Olympic Reply. Olympic Torch Arrives in the UK Olympic Stadium.

Olympic Entertainment Group AS
Consolidated interim financial statements for the 1st quarter of 2013 (unaudited)
(translation of the Estonian original)*
Beginning of reporting period 1 January 2013
End of reporting period 31 March 2013
Business name Olympic Entertainment Group AS
Registration number 10592898
Address Pronksi 19, Tallinn 10124
Telephone +372 667 1250
Fax +372 667 1270
E-mail [email protected]
Website www.olympic-casino.com
Core activity Provision of gaming services
Auditor AS PricewaterhouseCoopers
_____________________ *This version of consolidated interim financial statements is a translation from the original, which was prepared in Estonian. All possible care has been taken to ensure that the translation is an accurate representation of the original. However, in all matters of interpretation of information, views or opinions, the original language version of consolidated interim financial statements takes precedence over this translation.
Olympic Entertainment Group AS
Consolidated interim financial statements for the 1st
quarter of 2013 (unaudited) 2
Table of Contents
Corporate profile ........................................................................................................................................................................ 3
Declaration of the management ................................................................................................................................................ 5
Management report ................................................................................................................................................................... 6
Overview of the economic activities ...................................................................................................................................... 6
Description of main risks ...................................................................................................................................................... 10
Management and Supervisory Boards ................................................................................................................................. 10
Shares of Olympic Entertainment Group AS ........................................................................................................................ 11
Consolidated interim financial statements .............................................................................................................................. 13
Consolidated statement of financial position ...................................................................................................................... 13
Consolidated statement of comprehensive income ............................................................................................................ 14
Consolidated statement of cash flows ................................................................................................................................. 15
Consolidated statement of changes in equity...................................................................................................................... 16
Notes to the consolidated interim financial statements...................................................................................................... 17
Note 1 Summary of significant accounting policies ......................................................................................................... 17
Note 2 Seasonality of operations .................................................................................................................................... 17
Note 3 Investment property ............................................................................................................................................ 18
Note 4 Property, plant and equipment ........................................................................................................................... 18
Note 5 Intangible assets .................................................................................................................................................. 18
Note 6 Borrowings ........................................................................................................................................................... 18
Note 7 Equity ................................................................................................................................................................... 19
Note 8 Segment reporting ............................................................................................................................................... 20
Note 9 Transactions with related parties ........................................................................................................................ 20

Olympic Entertainment Group AS
Consolidated interim financial statements for the 1st
quarter of 2013 (unaudited) 3
Corporate profile
Olympic Entertainment Group AS with its subsidiaries (hereinafter the “Group”) is the leading provider of gaming services in the Baltic States (Estonia, Latvia and Lithuania), and it operates casinos in Poland, Slovakia, Belarus and Italy.
Olympic Entertainment Group AS is the Group’s ultimate holding company, organising the strategic management and financing of the Group. The operations of local casinos are controlled by local subsidiaries which include Olympic Casino Estonia AS in Estonia, Olympic Casino Latvia SIA in Latvia, Olympic Casino Group Baltija UAB in Lithuania, Casino Polonia-Wroclaw Sp. z o.o. in Poland, Olympic Casino Slovakia S.r.o. in Slovakia, Olympic Casino Bel IP in Belarus and The Box S.r.l and Jackpot Game S.r.l. in Italy. In Estonia, Latvia, Lithuania and Slovakia, the Group’s non-core activities, such as managing a hotel in Tallinn and managing casino bars, are separated from casino operations and performed by respective specialised legal entities. Most of the Group’s casino properties operate under the trademark of Olympic Casino.
Group entities include:
Domicile Ownership 31.03.2013
Ownership 31.12.2012
Area of activity
Olympic Casino Eesti AS Estonia 95% 95% Organisation of gaming Kungla Investeeringu AS Estonia 100% 100% Hotel services, catering Kesklinna Hotelli OÜ Estonia 97.5% 97.5% Hotel services Nordic Gaming OÜ Estonia 100% 100% Holding activities Fortuna Travel OÜ Estonia 95% 95% Casino tourism Kasiino.ee OÜ Estonia 100% 100% Internet solutions Olympic Casino Latvia SIA Latvia 100% 100% Organisation of gaming Ahti SIA Latvia 100% 100% Bar services Olympic Casino Group Baltija UAB Lithuania 100% 100% Organisation of gaming Mecom Grupp UAB Lithuania 100% 100% Bar services Silber Investments Sp. z o.o. Poland 100% 100% Holding activities Baina Investments Sp. z o.o. Poland 100% 100% Holding activities Casino-Polonia Wroclaw Sp. z o.o. Poland 80% 80% Organisation of gaming Olympic Casino Slovakia S.r.o Slovakia 100% 100% Organisation of gaming Olympic F & B S.r.o. Slovakia 100% 100% Bar services Olympic Casino Bel IP Belarus 100% 100% Organisation of gaming The Box S.r.l. Italy 50% 50% Organisation of gaming Jackpot Game S.r.l. Italy 50% 50% Organisation of gaming Siquia Holding B.V. Holland 95% - Holding activities Gametech Services Ltd Jersey 100% - Software services Brandhouse Ltd Jersey 100% - Holding activities Olympic Casino Ukraine TOV Ukraine 100% 100% Bankrupt Alea Private Company Ukraine 100% 100% Bankrupt
The Group operates slot and gaming table casinos as well as casino bars at most of the casinos of its subsidiaries. At 31 March 2013, the Group had a total of 66 casinos: 18 in Estonia, 21 in Latvia, 12 in Lithuania, 3 in Poland, 5 in Slovakia, 5 in Belarus and 2 in Italy. The Group employed 2,381 employees in 7 countries.
The shares of Olympic Entertainment Group AS are listed on the Tallinn and Warsaw Stock Exchanges (OMX: OEG1T / WSE: OEG).
Our vision To be a global casino and resort operator with a passion for service excellence.
Our mission To give our guests a customer orientated, secure and safe environment with the finest design and craftsmanship, unparalleled in the industry and supported by the excellence of our name and reputation.

Olympic Entertainment Group AS
Consolidated interim financial statements for the 1st
quarter of 2013 (unaudited) 4
Group’s structure at 31 March 2013

Olympic Entertainment Group AS
Consolidated interim financial statements for the 1st
quarter of 2013 (unaudited) 5
Declaration of the management
The members of the management confirm that according to their best knowledge, the interim financial statements, prepared in accordance with the accounting standards in force, give a true and fair view of the assets, liabilities, financial position and profit or loss of Olympic Entertainment Group AS and the group entities involved in the consolidation as a whole, and the management report gives a true and fair view of the development and results of the business activities and financial position of Olympic Entertainment Group AS and the group entities involved in the consolidation as a whole and contains a description of the main risks and doubts.
Madis Jääger Meelis Pielberg Chairman of the Management Board Member of the Management Board
29 April 2013

Olympic Entertainment Group AS
Consolidated interim financial statements for the 1st
quarter of 2013 (unaudited) 6
Management report
Overview of the economic activities
Key developments of the Group during the Q1 of 2013:
The Group’s consolidated net profit for Q1 2013 totalled EUR 4.6 million compared to EUR 5.1 million in Q1 2012.
In Q1 of 2013, the Group’s income from gaming transactions and revenues totalled EUR 33.1 million, up 4.4% year-over-year. The number of casinos in operation increased by 5 year-over-year.
On 11 March the subsidiary Olympic Casino Eesti AS of Olympic Entertainment Group AS acquired a 100% shareholding in Siquia Holding B.V. registered in the Netherlands.
On 11 March 2013 Olympic Entertainment Group AS established and registered the companies Gametech Services Ltd and Brandhouse Ltd in Jersey. The aim of establishing the subsidiaries is to create a legal platform for the expansion of the Group’s activities in markets related to remote gambling.
At the annual general meeting of the shareholders held on 18 April 2013 it was decided to pay a dividend in the total amount of 15,132,950.50 euros, which shall be paid to the shareholders on 15 May 2013.
In Q1 2013, the Group’s consolidated sales revenue totalled EUR 33.1 million and the total revenue totalled EUR 33.3 million, up 3.5% compared to the total revenue of EUR 32.2 million earned in Q1 2012. The Group’s EBITDA decreased from EUR 8.7 million in Q1 2012 to EUR 8.2 million in Q1 2013. In Q1 2013 the operating profit totalled EUR 6.1 million, in Q1 2012 the operating profit totalled EUR 5.8 million.
In Q1 2013, gaming operations accounted for 92.8% and other revenue 7.2% of the Group’s consolidated revenue, the respective percentages for Q1 2012 were 92.1% and 7.9%.
Total external income from gaming transactions and revenue (EUR thousands):
Q1 2013 Change
Percentage of total
Q1 2012 Percentage
of total
Estonia 8,108 6.5% 24.5% 7,614 24.0% Latvia 8,030 0.7% 24.3% 7,976 25.2% Lithuania 5,130 4.8% 15.5% 4,894 15.5% Poland 6,282 0.7% 19.0% 6,238 19.7% Slovakia 3,919 -7.9% 11.9% 4,255 13.4% Belarus 691 0.1% 2.1% 690 2.2% Italy 899 - 2.7% 0 0.0%
Total 33,059 4.4% 100.0% 31,667 100.0%
At the end of Q1 2013, the Group had 66 casinos, with the total floor area of 25,232 m². At the end of Q1 2012, the number of the Group’s casinos was 61 and total floor area was 23,418 m².
Number of casinos by segment
31 March 2013 31 March 2012
Estonia 18 17 Latvia 21 21 Lithuania 12 10 Poland 3 4 Slovakia 5 4 Belarus 5 5 Italy 2 -
Total 66 61
In Q1 2013, the Group’s consolidated operating expenses increased by 3.0% or EUR 0.8 million compared to Q1 2012. Compared to Q1 2012 the highest increase was in rental expenses (up EUR 0.7 million) while staff costs including social security taxes increased EUR 0.3 million and marketing expenses EUR 0.3 million. Depreciation, amortisation and impairment losses decreased the most compared to Q1 2012 by EUR 0.8 million.
Staff costs including social security taxes made up the largest share of the Group’s operating expenses, i.e. EUR 8.3 million, followed by gaming tax expenses of EUR 6.8 million, rental expenses EUR 3.1 million, marketing expenses of EUR 2.4 million and depreciation, amortisation and impairment losses of EUR 2.1 million.

Olympic Entertainment Group AS
Consolidated interim financial statements for the 1st
quarter of 2013 (unaudited) 7
In Q1 2013, the consolidated net profit attributable to equity holders of the parent company totalled EUR 4.6 million. In Q1 2012, the consolidated net profit attributable to equity holders of the parent company totalled EUR 5.1 million.
Key performance indicators of the Group (in millions of euros)
Q1 2013 Q1 2012 Q1 2011
Revenue 33.3 32.2 31.1 EBITDA 8.2 8.7 6.3 Operating profit 6.1 5.8 0.6 Net profit 4.6 5.1 0.2 EBITDA margin 24.8% 27.1% 20.1% Operating margin 18.4% 18.0% 2.0% Net margin 13.8% 15.9% 0.6% ROE 5.1% 6.4% 0.2% ROA 4.1% 4.9% 0.2% Current ratio 3.6 2.2 2.9 Number of casinos at year-end 66 61 65 Casino floor area (m²) at year-end 25,232 23,418 24,658 Number of slot machines at the period end 2,693 2,446 2,494 Number of gaming tables at the period end 184 183 184
Underlying formulas:
EBITDA = earnings before financial expenses, taxes, depreciation and amortisation and impairment losses
Operating profit = profit before financial expenses and taxes
Net profit = net profit for the period less non-controlling interests
EBITDA margin = EBITDA / revenue
Operating margin = operating profit / revenue
Net margin = net profit / revenue
ROE = net profit / average total equity attributable to the shareholders of the parent company
ROA = net profit / average total assets
Current ratio = current assets / current liabilities

Olympic Entertainment Group AS
Consolidated interim financial statements for the 1st
quarter of 2013 (unaudited) 8
Overview by markets
Estonian segment In Q1 2013, the external revenue of the Estonian segment totalled EUR 8.2 million, of which the income from gaming transactions totalled EUR 7.5 million and other revenue and income totalled EUR 0.5 million. The external revenue of the Estonian segment increased by 4.9% compared to the Q1 2012. The market share of Olympic Casino Eesti AS in the Estonian gaming market was 54% in Q1 2013 and 54% in Q1 2012. In Q1 2013, the total Estonian gaming market increased by 2.5% as compared to the Q1 2012.
In Q1 2013, EBITDA of the Estonian segment totalled EUR 1.8 million and the operating profit totalled EUR 1.4 million. In Q1 2012, EBITDA of the Estonian segment totalled EUR 1.8 million and the operating profit totalled EUR 1.1 million.
At the end of Q1 2013, there were 18 Olympic casinos with 739 slot machines and 20 gaming tables operating in Estonia.
Latvian segment In Q1 2013, the external revenue of the Latvian segment totalled EUR 8.1 million, of which the income from gaming transactions totalled EUR 7.3 million and other revenue and income totalled EUR 0.8 million. The external revenue of the Latvian segment was at the same level compared to the Q1 2012. The market share of Olympic Casino Latvia SIA in the Latvian gaming market was 20% in Q1 2013 and 20% in Q1 2012. In Q1 2013, the total Latvian gaming market increased by 2.9% as compared to the Q1 2012.
In Q1 2013, EBITDA of the Latvian segment totalled EUR 3.4 million and the operating profit totalled EUR 2.8 million. In Q1 2012, EBITDA of the Latvian segment totalled EUR 3.6 million and the operating profit totalled EUR 2.9 million.
At the end of Q1 2013, there were 21 Olympic casinos with 673 slot machines and 18 gaming tables operating in Latvia.
Lithuanian segment In Q1 2013, the external revenue of the Lithuanian segment totalled EUR 5.1 million, of which the income from gaming transactions totalled EUR 4.8 million and other revenue and income totalled EUR 0.3 million. The external revenue of the Lithuanian segment increased by 4.4% compared to the Q1 2012. The market share of Olympic Casino Group Baltija UAB in the Lithuanian gaming market was 69% in Q1 2013 and 68% in Q1 2012. In Q1 2013, the total Lithuanian gaming market increased by 4.0% as compared to the Q1 2012.
In Q1 2013, EBITDA of the Lithuanian segment totalled EUR 1.2 million and the operating profit totalled EUR 0.9 million. In Q1 2012, EBITDA of the Lithuanian segment totalled EUR 1.1 million and the operating profit totalled EUR 0.7 million.
At the end of Q1 2013, there were 12 Olympic casinos with 414 slot machines and 59 gaming tables operating in Lithuania.
Polish segment In Q1 2013, the external revenue of the Polish segment totalled EUR 6.3 million, of which the income from gaming transactions totalled EUR 6.2 million and other revenue and income totalled EUR 0.1 million. The external revenue of the Polish segment decreased by 0.5% compared to the Q1 2012.
In Q1 2013, EBITDA of the Polish segment totalled EUR 1.1 million and the operating profit totalled EUR 0.7 million. In Q1 2012, EBITDA of the Polish segment totalled EUR 0.9 million and the operating profit totalled EUR 0.2 million.
At the end of Q1 2013, there were 3 Olympic casinos with 266 slot machines and 37 gaming tables operating in Poland.
Slovak segment In Q1 2013, the external revenue of the Slovak segment totalled EUR 3.9 million, of which the income from gaming transactions totalled EUR 3.6 million and other revenue and income totalled EUR 0.3 million. The external revenue of the Slovak segment decreased by 7.8% compared to the Q1 2012.
In Q1 2013, EBITDA of the Slovak segment totalled EUR 0.6 million and the operating profit totalled EUR 0.3 million. In Q1 2012, EBITDA of the Slovak segment totalled EUR 1.1 million and the operating profit totalled EUR 0.8 million.
At the end of Q1 2013, there were 5 Olympic casinos with 263 slot machines and 50 gaming tables operating in Slovakia.

Olympic Entertainment Group AS
Consolidated interim financial statements for the 1st
quarter of 2013 (unaudited) 9
Belarusian segment In this interim financial statements the Belarusian segment is regarded as a hyperinflationary economy that is subject to the accounting policies of IAS 29.
In Q1 2013, the external revenue of the Belarusian segment totalled EUR 0.7 million, of which the income from gaming transactions totalled EUR 0.7 million and other revenue and income totalled EUR 0.0 million. The external revenue of the Belarusian segment was at the same level compared to Q1 2012.
In Q1 2013, EBITDA of the Belarusian segment totalled EUR 0.1 million and the operating profit totalled EUR 0.1 million. In Q1 2012, EBITDA of the Belarusian segment totalled EUR 0.2 million and the operating profit totalled EUR 0.1 million.
At the end of Q1 2013, there were 5 Olympic casinos with 226 slot machines operating in Belarus.
Italian segment In Q1 2013, the external revenue of the Italian segment before deducting the gaming taxes of Italy totalled EUR 1.9 million. In Q1 2013, EBITDA of the Italian segment totalled EUR 0.1 million and the operating loss totalled EUR 0.0 million.
At the end of Q1 2013, there were 2 VLT slot casinos under the brand Slottery with 112 gaming machines operating in Italy.
Financial position As at 31 March 2013, the total assets of the Group amounted to EUR 113.2 million (31 December 2012: EUR 109.2 million), up 3.6% during the Q1 2013.
Current assets totalled EUR 55.3 million or 48.9% of total assets, and non-current assets totalled EUR 57.9 million or 51.1% of total assets. At the balance sheet date, the liabilities totalled EUR 15.8 million and the equity totalled EUR 97.3 million. The largest liability items included tax liabilities of EUR 4.5 million, payables to employees of EUR 3.5 million and payables to suppliers of EUR 3.3 million.
Investments In Q1 2013, the Group’s expenditures on property, plant and equipment totalled EUR 3.6 million, of which EUR 2.3 million was spent on new gaming equipment and EUR 1.2 million on construction and reconstruction of casinos.
In Q1 2012, expenditures on property, plant and equipment totalled EUR 1.4 million.
Cash flows In Q1 2013, the Group’s cash flows generated from operating activities totalled EUR 4.6 million. Cash flows from investing activities totalled EUR 6.8 million and cash flows used in financing activities totalled EUR 0.1 million. Net cash flows totalled EUR 11.3 million.
In Q1 2012, the Group’s cash flows generated from operating activities totalled EUR 8.3 million. Cash flows from investing activities totalled EUR 1.6 million and cash flows used in financing activities totalled EUR 0.8 million. Net cash flows totalled EUR 9.2 million.
Staff As at 31 March 2013, the Group employed 2,388 people (31 December 2012: 2,277): 524 in Estonia, 493 in Latvia, 640 in Lithuania, 355 in Poland, 268 in Slovakia, 101 in Belarus and 7 in Italy.
In Q1 2013, employee wages and salaries including social security taxes totalled EUR 8.3 million (Q1 2012: EUR 8.0 million). In Q1 2013, the members of the Management Board and Supervisory Board of all Group entities were paid remuneration and benefits including social security taxes in the amount of EUR 222 thousand (Q1 2012: EUR 213 thousand) and EUR 39 thousand (Q1 2012: EUR 39 thousand), respectively.

Olympic Entertainment Group AS
Consolidated interim financial statements for the 1st
quarter of 2013 (unaudited) 10
Description of main risks
The risk management policy of the Group is based on the requirements established by regulative bodies, generally accepted practices and internal regulations of the Group. The Group is guided by the principle to manage risks in a manner that ensures an optimal risk to income ratio. As part of the risk management of the Group, all potential risks, their measurement and control are defined, and an action plan is prepared to reduce risks, thereby ensuring the achievement of financial and other strategic objectives of the Group.
Business risks The macro-economic development of operated markets and related changes in the consumption habits of clients are the factors that influence the Group the most. To manage risks, the Group monitors and analyses the general development of markets and the activities of competitors, as a result of which the Group will adjust operational activities, including marketing activities, if necessary.
The gaming sector as a whole is significantly influenced by regulative changes and supervisory activities at the state and local level. The Group estimates that the regulative risk is managed by representation of the risk in seven different jurisdictions.
Currency risk The Group earns income in euros, Latvian lats, Lithuanian litas, Polish zloty and Belarusian rubles. Most of the Group’s expenses are incurred in these currencies in its operating markets. The changes in exchange rates of these currencies against the euro impact both the Group’s revenue and expenses, as a result of which there is no major effect on the Group’s operating profit.
Internal transactions of the Group are primarily concluded in euros. The equity of the Group is influenced by a change in the exchange rate of the Polish zloty and Belarusian ruble to the euro. The functional currencies of subsidiaries within the Group, the US dollar (USD), the Swiss franc (CHF) and investment gold (XAU) as well as the derivative instruments related to the aforementioned currencies may be used to manage currency risks. The market value of USD, CHF or XAU (incl. the respective derivative instruments) may not exceed 20% of the equity according to the last audited consolidated balance sheet of the Group.
Management and Supervisory Boards
The Management Board of Olympic Entertainment Group AS comprises two members, where the Chairman is Madis Jääger and member is Meelis Pielberg. In the daily management activities, the Management Board of the Company is independent and is guided by the best interests of all shareholders, thereby ensuring sustainable development of the Company according to the set objectives and strategy. The Management Board also ensures the functioning of internal control and risk management procedures in the Company. The Supervisory Board of Olympic Entertainment Group AS elects members of the Management Board for a term of three years.
Madis Jääger – Chairman of the Management Board and CEO since 2012 (member of the Management Board since 2010). Madis Jääger graduated from Estonian Business School in 2002 with a degree in International Business Administration major in accounting and banking cum laude. Madis Jääger owns neither directly nor through the companies controlled by him any of the Company’s shares.
Meelis Pielberg – member of the Management Board and head of land-based casino operations since 2012. Meelis Pielberg graduated from Estonian Maritime Academy in 2000. Meelis Pielberg owns directly and through the companies controlled by him a total of 29,355 Company’s shares.
Olympic Entertainment Group AS
Consolidated interim financial statements for the 1st
quarter of 2013 (unaudited) 11
The Supervisory Board of Olympic Entertainment Group AS comprises of four members. The Supervisory Board is chaired by
the Chairman Armin Karu; members of the Supervisory Board are Jaan Korpusov, Liina Linsi and Peep Vain. The General
Meeting of Shareholders of Olympic Entertainment Group AS elects members of the Supervisory Management Board.
Armin Karu – Chairman of the Supervisory Board since 2008. Armin Karu is the founder of the Company. He graduated from Haaga Institute in Finland (International Management Diploma 1998; MBA 2005). Armin Karu owns directly and through the companies controlled by him a total of 68,364,790 Company’s shares.
Jaan Korpusov – member of the Supervisory Board since 2006. Jaan Korpusov graduated from University of Tartu in 1985 the faculty of history. Jaan Korpusov owns directly and through the companies controlled by him a total of 28,761,910 Company’s shares.
Liina Linsi – member of the Supervisory Board since 2006. Liina Linsi graduated from University of Tartu (law) in 1984 cum laude. Liina Linsi owns directly and through the companies controlled by her a total of 16,681 Company’s shares.
Peep Vain – member of the Supervisory Board since 2006. Peep Vain studied radio technology at Tallinn Polytechnic Institute from 1986 to 1987 and market economy at the University of Tartu from 1989 to 1990. He graduated from Bentley College in Massachusetts, USA with a degree in marketing cum laude. Peep Vain owns neither directly nor through the companies controlled by him any of the Company’s shares.
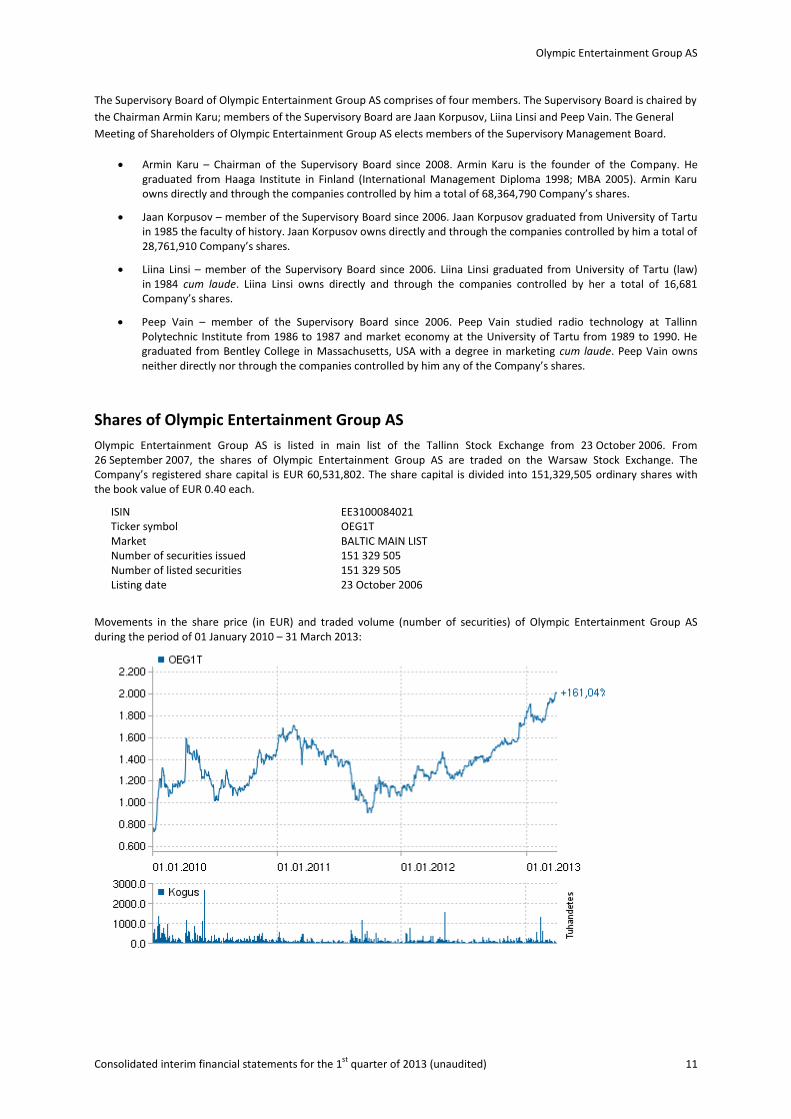
Shares of Olympic Entertainment Group AS
Olympic Entertainment Group AS is listed in main list of the Tallinn Stock Exchange from 23 October 2006. From 26 September 2007, the shares of Olympic Entertainment Group AS are traded on the Warsaw Stock Exchange. The Company’s registered share capital is EUR 60,531,802. The share capital is divided into 151,329,505 ordinary shares with the book value of EUR 0.40 each.
ISIN EE3100084021 Ticker symbol OEG1T Market BALTIC MAIN LIST Number of securities issued 151 329 505 Number of listed securities 151 329 505 Listing date 23 October 2006
Movements in the share price (in EUR) and traded volume (number of securities) of Olympic Entertainment Group AS during the period of 01 January 2010 – 31 March 2013:
Olympic Entertainment Group AS
Consolidated interim financial statements for the 1st
quarter of 2013 (unaudited) 12
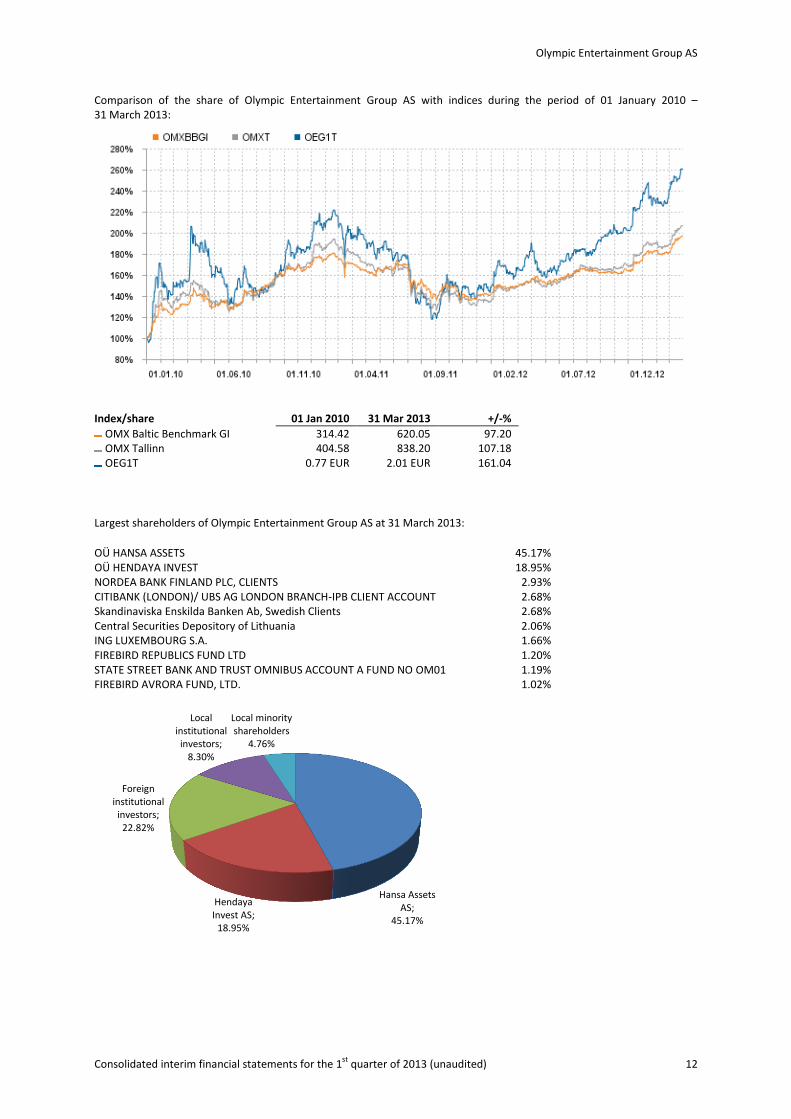
Comparison of the share of Olympic Entertainment Group AS with indices during the period of 01 January 2010 – 31 March 2013:
Index/share 01 Jan 2010 31 Mar 2013 +/-%
OMX Baltic Benchmark GI 314.42 620.05 97.20 OMX Tallinn 404.58 838.20 107.18 OEG1T 0.77 EUR 2.01 EUR 161.04
Largest shareholders of Olympic Entertainment Group AS at 31 March 2013:
OÜ HANSA ASSETS 45.17% OÜ HENDAYA INVEST 18.95% NORDEA BANK FINLAND PLC, CLIENTS 2.93% CITIBANK (LONDON)/ UBS AG LONDON BRANCH-IPB CLIENT ACCOUNT 2.68% Skandinaviska Enskilda Banken Ab, Swedish Clients 2.68% Central Securities Depository of Lithuania 2.06% ING LUXEMBOURG S.A. 1.66% FIREBIRD REPUBLICS FUND LTD 1.20% STATE STREET BANK AND TRUST OMNIBUS ACCOUNT A FUND NO OM01 1.19% FIREBIRD AVRORA FUND, LTD. 1.02%
Hansa Assets AS;
45.17%
Hendaya Invest AS;
18.95%
Foreign institutional investors;
22.82%
Local institutional investors;
8.30%
Local minority shareholders
4.76%
(in thousands of euros) Olympic Entertainment Group AS
Consolidated interim financial statements for the 1st
quarter of 2013 (unaudited) 13
Consolidated interim financial statements
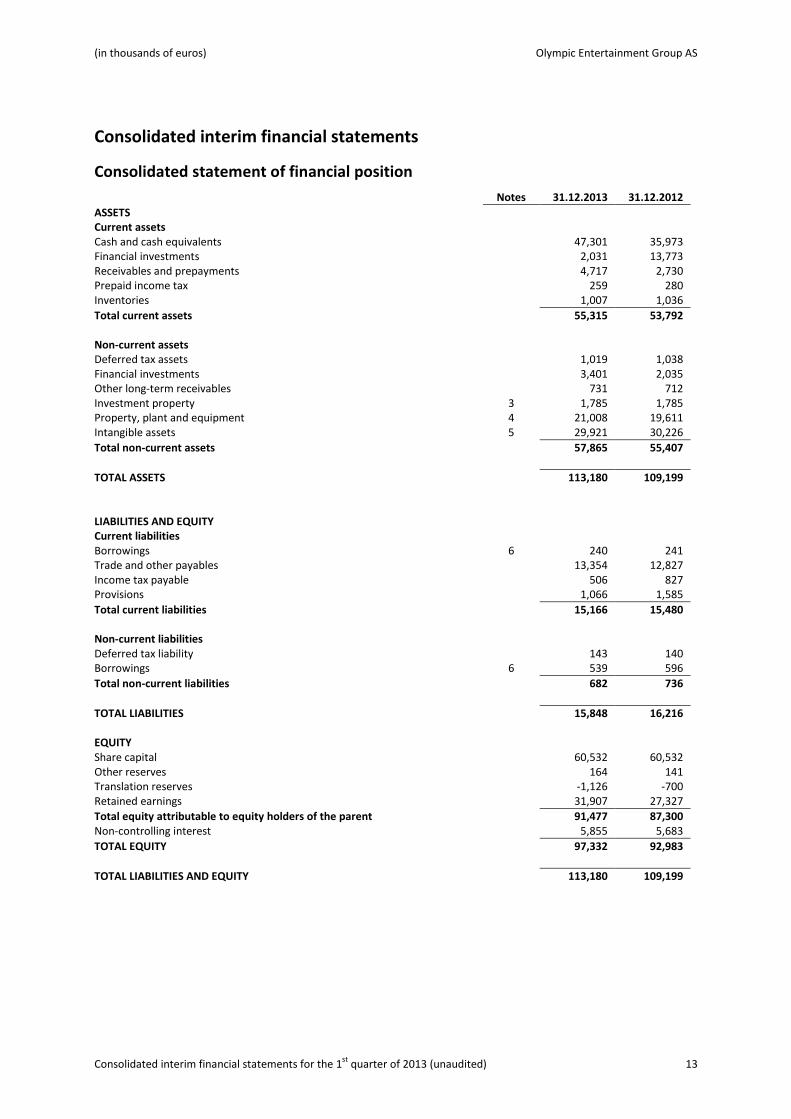
Consolidated statement of financial position
Notes 31.12.2013 31.12.2012
ASSETS Current assets Cash and cash equivalents 47,301 35,973 Financial investments 2,031 13,773 Receivables and prepayments 4,717 2,730 Prepaid income tax 259 280 Inventories 1,007 1,036
Total current assets 55,315 53,792 Non-current assets Deferred tax assets 1,019 1,038 Financial investments 3,401 2,035 Other long-term receivables 731 712 Investment property 3 1,785 1,785 Property, plant and equipment 4 21,008 19,611 Intangible assets 5 29,921 30,226
Total non-current assets 57,865 55,407
TOTAL ASSETS 113,180 109,199 LIABILITIES AND EQUITY Current liabilities Borrowings 6 240 241 Trade and other payables 13,354 12,827 Income tax payable 506 827 Provisions 1,066 1,585
Total current liabilities 15,166 15,480 Non-current liabilities Deferred tax liability 143 140 Borrowings 6 539 596
Total non-current liabilities 682 736
TOTAL LIABILITIES 15,848 16,216 EQUITY Share capital 60,532 60,532 Other reserves 164 141 Translation reserves -1,126 -700 Retained earnings 31,907 27,327
Total equity attributable to equity holders of the parent 91,477 87,300 Non-controlling interest 5,855 5,683
TOTAL EQUITY 97,332 92,983
TOTAL LIABILITIES AND EQUITY 113,180 109,199

(in thousands of euros) Olympic Entertainment Group AS
Consolidated interim financial statements for the 1st
quarter of 2013 (unaudited) 14
Consolidated statement of comprehensive income
Notes Q1 2013 Q1 2012
Income from gaming transactions 8 30,884 29,596 Revenue 8 2,175 2,071 Other income 8 225 484
Total revenue and income
33,284 32,151 Cost of materials, goods and services
-707 -664
Other operating expenses
-15,968 -14,644 Staff costs
-8,303 -8,035
Depreciation, amortisation and impairment 4;5 -2,108 -2,901 Other expenses
-61 -110
Total operating expenses
-27,147 -26,354
Operating profit
6,137 5,797 Interest income
32 74
Interest expense
-4 -55 Foreign exchange gains (losses)
5 -14
Other finance income and costs
-621 285
Total finance income and costs
-588 290
Profit from operating activities
5,549 6,087 Income tax expense
-797 -703
Net profit for the period
4,752 5,384 Attributable to equity holders of the parent company
4,580 5,122
Attributable to non-controlling interest
172 262 Other comprehensive income
Currency translation differences
-426 868
Total comprehensive profit for the period
4,326 6,252 Attributable to equity holders of the parent company
4,154 5,990
Attributable to non-controlling interest
172 262 Basic earnings per share* 7 3.0 3.4 Diluted earnings per share* 7 3.0 3.4
* euro cents

(in thousands of euros) Olympic Entertainment Group AS
Consolidated interim financial statements for the 1st
quarter of 2013 (unaudited) 15
Consolidated statement of cash flows
Notes Q1 2013 Q1 2012
Cash flows from operating activities Net profit 4,752 5,384 Adjustments:
Depreciation, amortisation and impairment 4;5 2,108 2,901 Profit / loss on disposal of non-current assets (net) -10 -55 Income tax expense 797 703 Other financial income and expenses (net) 588 -290
Changes in working capital: Receivables and prepayments -2,060 -112 Inventories 29 -16 Liabilities and prepayments -862 293
Interest paid -4 -55 Corporate income tax paid -769 -445
Net cash generated from operating activities 4,569 8,308 Cash flows from investing activities Acquisition of property, plant equipment and intangible assets -3,077 -1,215 Proceeds from sale of property plant equipment 42 139 Purchase of financial investments -1,379 -91 Proceeds from sale of financial investments 11,150 2,696 Interest received 68 115
Net cash used in from investing activities 6,804 1,644 Cash flows from financing activities Repayments of loans received 6 -59 -777 Repayments of finance leases -1 -1
Net cash used in financing activities -60 -778
Net cash flows 11,313 9,174 Cash and cash equivalents at beginning of the period 35,973 33,413 Exchange gains and losses on cash and cash equivalents 15 3
Cash and cash equivalents at end of the period 47,301 42,590

(in thousands of euros) Olympic Entertainment Group AS
Consolidated interim financial statements for the 1st
quarter of 2013 (unaudited) 16
Consolidated statement of changes in equity
Equity attributable to equity holders of the parent
Share capital
Share premium
Statutory reserve capital
Other reserves
Currency translation differences
Retained earnings Total
Non-controlling interest Total equity
Balance at 31.12.2011 81,718 14,535 2,470 53 -1,776 -19,930 77,070 4,589 81,659 Net profit for the period 0 0 0 0 0 5,122 5,122 262 5,384 Other comprehensive income 0 0 0 0 868 0 868 0 868
Total comprehensive income for the period 0 0 0 0 868 5,122 5,990 262 6,252 Employee option programme 0 0 0 27 0 0 27 0 27
Balance at 31.03.2012 81,718 14,535 2,470 80 -908 -14,808 83,087 4,851 87,938 Balance at 31.12.2012 60,532 0 0 141 -700 27,327 87,300 5,683 92,983 Net profit for the period 0 0 0 0 0 4,580 4,580 172 4,752 Other comprehensive expense 0 0 0 0 -426 0 -426 0 -426
Total comprehensive income for the period 0 0 0 0 -426 4,580 4,154 172 4,326 Employee option programme 0 0 0 23 0 0 23 0 23
Balance at 31.03.2013 60,532 0 0 164 -1,126 31,907 91,477 5,855 97,332

(in thousands of euros) Olympic Entertainment Group AS
Consolidated interim financial statements for the 1st
quarter of 2013 (unaudited) 17
Notes to the consolidated interim financial statements
Note 1 Summary of significant accounting policies
Olympic Entertainment Group AS (hereinafter the “Company”) is a company registered in Estonia at 15 November 1999. The consolidated interim financial statements of the Company prepared for the reporting period ended 31 March 2013 comprise the Company and its subsidiaries (together referred to as the “Group”).
This condensed consolidated interim financial information was approved by the management for issue on 29 April 2013.
The audited consolidated financial statements of the Group as of and for the year ended 31 December 2012 are available upon request from the Company’s registered office at Pronksi 19, Tallinn and at the Company’s website at www.olympic-casino.com.
Basis of preparation These condensed consolidated interim financial statements have been prepared in accordance with International Financial Reporting Standard IAS 34 “Interim Financial Reporting” as adopted by the European Union. The condensed consolidated interim financial statements do not include all of the information required by complete set of financial statements and should be read in conjunction with annual consolidated financial statements of the Group as at and for the year ended 31 December 2012.
The accounting policies applied by the Group in these condensed consolidated interim financial statements are the same as those applied by the Group in its consolidated financial statements as at and for the year ended 31 December 2012.
Note 2 Seasonality of operations
Due to the slight seasonal nature of the gaming market, higher revenues are generated in the second half of the year. In the financial year ended 31 December 2012, 47% of the income from gaming transactions accumulated in the first half of the year, with 53% accumulating in the second half.

(in thousands of euros) Olympic Entertainment Group AS
Consolidated interim financial statements for the 1st
quarter of 2013 (unaudited) 18
Note 3 Investment property
Land Buildings Total
At 31 December 2012 1,299 486 1,785
At 31 March 2013 1,299 486 1,785
Note 4 Property, plant and equipment
Land and buildings
Renovation expenditures
Machinery & equipment Other PP&E
Construction in progress Total
At 31 December 2012 38 7,189 10,355 1,192 837 19,611 Additions 0 324 2,292 31 898 3,545 Disposals 0 0 -32 0 0 -32 Write-offs 0 -2 -2 -1 0 -5 Reclassifications 0 7 2 12 -21 0 Depreciation charge -2 -566 -1,319 -133 0 -2,020 Exchange differences 0 -31 -51 -7 -2 -91
At 31 March 2013 36 6,921 11,245 1,094 1,712 21,008
Note 5 Intangible assets
Goodwill Software
and licences Total
At 31 December 2012 29,424 802 30,226 Additions 0 17 17 Amortisation charge 0 -83 -83 Exchange differences -231 -8 -239
At 31 March 2013 29,193 728 29,921
Note 6 Borrowings
31.03.2013 31.12.2012
Short-term borrowings Current portion of finance lease 2 3 Current portion of long-term debt 238 238
Total short-term borrowings 240 241 Long-term borrowings Non-current portion of finance lease 10 10 Non-current portion of long-term debt 504 563 Other borrowings 25 23
Total long-term borrowings 539 596
Total borrowings 779 837
Jackpot Game S.r.l and Banka Popolare di Milano have concluded the loan agreement with the due date of 31 March 2016. The annual interest rate is 3-month Euribor + 2.0%.

(in thousands of euros) Olympic Entertainment Group AS
Consolidated interim financial statements for the 1st
quarter of 2013 (unaudited) 19
Note 7 Equity
The General Meeting of Shareholders held at 18 April 2013 decided to pay dividends to the shareholders of 0.10 euros per share in the total amount of 15,132,950.50 euros. Dividends shall be paid out to the shareholders on 15 May 2013.
At 27 July 2012, the reduction of share capital of Olympic Entertainment Group AS on the basis adopted by resolution of the General Meeting of Shareholders held at 19 April 2012 was entered in the Commercial Register where it was decided to reduce the share capital of the Company altogether by EUR 21,186,130.70 from EUR 81,717,932.70 to EUR 60,531,802. The share capital was reduced by reducing the book value of the shares from EUR 0.54 to EUR 0.40, whereas the number of the shares remained the same (i.e. 151,329,505). The reduction of share capital in the amount of EUR 15,132,950.50 (EUR 0.10 per share) was paid to the shareholders on 29 October 2012. Upon reducing the share capital, EUR 6,053,180.20 was not paid to the shareholders but was used to cover the accumulated losses.
Earnings per share
Q1 2013 Q1 2012
Net profit for the period 4,580 5,122 Weighted average number of shares outstanding (in thousands)
151,329 151,329
Basic earnings per share (euro cents) 3.0 3.4 Diluted earnings per share (euro cents) 3.0 3.4
Basic earnings per share are calculated by dividing profit attributable to equity holders of the company by the weighted average number of ordinary shares outstanding during the period. The calculation of diluted earnings per share also takes into consideration the share options granted to employees.
In 2011, share options were granted to the members of the Management Board of Olympic Entertainment Group AS and the Group’s key personnel. According to the agreements, a member of the Management Board may subscribe for up to 70,000 shares in Olympic Entertainment Group AS until the end of the option programme; the numbers of shares that may be subscribed for under the agreements concluded with the Group’s key personnel are individually different. The exact number of shares that each member of the Management Board and each employee can subscribe for depends on the attainment of the Group’s financial targets and the individual performance of each member of the Management Board or key personnel. The option holders have the right to subscribe for shares from 1 July 2014. The expiration date of the share option programme is 1 September 2014.

(in thousands of euros) Olympic Entertainment Group AS
Consolidated interim financial statements for the 1st
quarter of 2013 (unaudited) 20
Note 8 Segment reporting
The Group’s segments have been determined on the basis of reports monitored and analysed by the parent company’s Management Board. Financial results are monitored by geographical regions. The results of operating segments are evaluated on the basis on external sales revenue and operating profit. At 31 March 2013, the Group had operations in the Estonian, Latvian, Lithuanian, Polish, Slovak, Belarusian and Italian markets.
All segments generate majority of their income from gaming transactions. In addition, Estonian segment is engaged in hotel services. Management estimates that inter-segment transactions have been concluded at market prices and under market conditions.
Q1 2013 Estonia Latvia Lithuania Poland Slovakia Belarus Italy Total
Income from gaming transactions 7,450 7,317 4,833 6,187 3,560 648 1,865 31,860 Gaming tax of Italy 0 0 0 0 0 0 -976 -976 Revenue 673 713 297 95 359 43 10 2,190 Inter-segment revenue -15 0 0 0 0 0 0 -15
External revenue 8,108 8,030 5,130 6,282 3,919 691 899 33,059 Other external revenue 136 62 1 4 3 19 0 225
Total revenue 8,244 8,092 5,131 6,286 3,922 710 899 33,284 Total expenses -6,841 -5,277 -4,270 -5,555 -3,670 -608 -926 -27,147
Incl. Depreciation, amortisation and impairment losses
-382 -610 -352 -338 -314 -28 -84 -2,108
Total operating profit (-loss) 1,403 2,815 861 731 252 102 -27 6,137
Q1 2012 Estonia Latvia Lithuania Poland Slovakia Belarus Italy Total
Income from gaming transactions 6,944 7,340 4,587 6,146 3,943 636 0 29,596 Revenue 692 638 307 92 312 54 0 2,095 Inter-segment revenue -22 -2 0 0 0 0 0 -24
External revenue 7,614 7,976 4,894 6,238 4,255 690 0 31,667 Other external revenue 248 122 19 77 0 18 0 484
Total revenue 7,862 8,098 4,913 6,315 4,255 708 0 32,151
Total expenses -6,782 -5,197 -4,207 -6,144 -3,458 -566 0 -26,354 Incl. Depreciation, amortisation and impairment losses -756 -657 -415 -715 -281 -77 0 -2,901
Total operating profit 1,080 2,901 706 171 797 142 0 5,797
Note 9 Transactions with related parties
For the purposes of these consolidated interim financial statements, related parties include:
a) shareholders with significant influence; b) key management personnel (members of the Management Board and Supervisory Board of Group entities); c) close family members of and companies related to the above.
Purchase of goods and services Q1 2013 Q1 2012
Shareholders with significant influence 0 18 Total 0 18 As at 31.03.2013 and 31.12.2012, there were no balances of receivables and liabilities.
In Q1 2013, the members of the Management Board and Supervisory Board of all Group entities were paid remuneration and benefits including social security taxes in the amount of EUR 222 thousand (Q1 2012: EUR 213 thousand) and EUR 39 thousand (Q1 2012: EUR 39 thousand), respectively.