Oldtown - I3investor - Stock Investment Portalklse.i3investor.com/files/my/ptres/res5748.pdf ·...
23
PP10551/09/2012 (030567) 04 Jan 2012 OSK Research | See important disclosures at the end of this report 1 MALAYSIA EQUITY Investment Research Daily Initiating Coverage Oldtown Delivering a Potent Brew The share price of Oldtown Bhd has rebounded strongly from its post IPO low of RM0.89 since the company‟s listing due to its consistent earnings, favorable catalysts and attractive valuation. We like the company‟s solid fundamentals, favorable consumer factors and rapid regional expansion, which look set to boost its revenue and net profit by double digits. We initiate coverage with a BUY recommendation, valuing the stock at RM1.55 based on 13.0x FY12 EPS. An extensive café network. Oldtown started its business in 1999 when its co-founders formulated their own blend of 3-in-1 instant white coffee mix and commenced manufacturing under the „OLDTOWN‟ brand. Five years later, the company expanded vertically into the food services industry by opening a chain of cafés. Today, the company exports its coffee mix to more than 12 countries and operated 194 cafe outlets as of end Nov 2011. Fast moving consumer goods (FMCG) business to outpace food and beverage business (F&B). We are bullish on the growth of Oldtown‟s FMCG business (the manufacturing and distribution of its coffee) given the strength of its brand and quality. The group recently appointed its first FMCG distributor in Beijing, China. Management has guided that the company delivered its first direct shipment to China in Oct at a volume that is double its FY10 indirect export sales to China (via Hong Kong). Moving forward, we expect revenue from the FMCG business to overtake its F&B business. F&B business tickling palates regionally. Oldtown started tapping into China‟s booming consumption recently, opening its first licensed outlet in Guangzhou with a vision of opening 172 outlets in 10 years. We gather that management is pleased with the numbers from its first outlet in the opening month of operation. The group‟s prospects in China look promising given the growing population and consumer spending, low unemployment, plus the fact that China was not as hard hit by the recession in 2008, are all factors fuelling its F&B market. Overall catalysts for its F&B business include i) favorable consumer trends, ii) „halal‟ certification to penetrate the Muslim market in Malaysia, iii) strong outlet rollout, iv) expansion to Indonesia, Singapore and China, and iv) nifty pricing strategy. Initiate with BUY. We like Oldtown for exposure to the defensive F&B subsector in anticipation of a feeble 2012 for: i) its attractive valuation, ii) decent top- and bottom-line growth, and iii) stabilizing margins. As the group has been consistently reporting earnings that were consistent with our conservative forecasts, we maintain our IPO note earnings forecast but upgrade its valuation from 12.5x to 13.0x FY12 EPS. With that, we initiate coverage of this stock with a BUY recommendation and a fair value of RM1.55 based on 13.0x FY12 EPS. FYE Dec FY09 FY10 FY11f FY12f FY13f Revenue 193.7 255.1 293.8 357.8 423.9 Net Profit 30.2 31.7 35.3 39.4 44.7 % chg y-o-y 47.9 4.8 11.5 11.6 13.4 Consensus 35.3 39.4 - EPS 9.2 9.6 10.7 11.9 13.5 DPS 0.0 0.0 5.3 6.0 6.8 Dividend yield (%) - - 4.3 4.8 5.4 ROE (%) - 16.8 15.3 15.8 16.3 ROA (%) - 12.4 11.4 11.8 12.5 PER (x) 13.6 13.0 11.7 10.5 9.2 BV/share - 0.57 0.70 0.76 0.83 P/BV (x) - 2.2 1.8 1.7 1.5 EV/EBITDA (x) - 8.2 7.4 6.3 5.8 BUY Price RM1.25 CONSUMER Oldtown manufactures 3-in-1 coffee and instant tea mixes and operates a chain of café outlets under the „OLDTOWN WHITE COFFEE‟ brand Stock Statistics Bloomberg Ticker OTB MK Share Capital (m) 330.0 Market Cap 412.5 52 week H | L Price 1.40 0.89 3mth Avg Vol (000) 807.7 YTD Returns 0.0 Beta (x) - Shariah Compliant NO Major Shareholders (%) Old Town International 59.12 Lee Siew Heng 5.39 Share Performance (%) Month Absolute Relative 1m 11.1 11.2 3m 30.4 22.2 6m - - 12m - - 6-month Share Price Performance 0.80 0.90 1.00 1.10 1.20 1.30 1.40 Jul-11 Aug-11 Sep-11 Oct-11 Nov-11 Nov-11 Dec-11 Fair Value RM1.55 The Research Team +60 (3) 9207 7688 [email protected]
Transcript of Oldtown - I3investor - Stock Investment Portalklse.i3investor.com/files/my/ptres/res5748.pdf ·...

PP10551/09/2012 (030567)
04 Jan 2012
OSK Research | See important disclosures at the end of this report
1
MALAYSIA EQUITY Investment Research
Daily
Initiating Coverage
Oldtown
Delivering a Potent Brew The share price of Oldtown Bhd has rebounded strongly from its post IPO low of
RM0.89 since the company‟s listing due to its consistent earnings, favorable
catalysts and attractive valuation. We like the company‟s solid fundamentals,
favorable consumer factors and rapid regional expansion, which look set to boost its
revenue and net profit by double digits. We initiate coverage with a BUY
recommendation, valuing the stock at RM1.55 based on 13.0x FY12 EPS.
An extensive café network. Oldtown started its business in 1999 when its co-founders
formulated their own blend of 3-in-1 instant white coffee mix and commenced manufacturing
under the „OLDTOWN‟ brand. Five years later, the company expanded vertically into the
food services industry by opening a chain of cafés. Today, the company exports its coffee
mix to more than 12 countries and operated 194 cafe outlets as of end Nov 2011.
Fast moving consumer goods (FMCG) business to outpace food and beverage
business (F&B). We are bullish on the growth of Oldtown‟s FMCG business (the
manufacturing and distribution of its coffee) given the strength of its brand and quality. The
group recently appointed its first FMCG distributor in Beijing, China. Management has
guided that the company delivered its first direct shipment to China in Oct at a volume that
is double its FY10 indirect export sales to China (via Hong Kong). Moving forward, we
expect revenue from the FMCG business to overtake its F&B business.
F&B business tickling palates regionally. Oldtown started tapping into China‟s booming
consumption recently, opening its first licensed outlet in Guangzhou with a vision of opening
172 outlets in 10 years. We gather that management is pleased with the numbers from its
first outlet in the opening month of operation. The group‟s prospects in China look promising
given the growing population and consumer spending, low unemployment, plus the fact that
China was not as hard hit by the recession in 2008, are all factors fuelling its F&B market.
Overall catalysts for its F&B business include i) favorable consumer trends, ii) „halal‟
certification to penetrate the Muslim market in Malaysia, iii) strong outlet rollout, iv)
expansion to Indonesia, Singapore and China, and iv) nifty pricing strategy.
Initiate with BUY. We like Oldtown for exposure to the defensive F&B subsector in
anticipation of a feeble 2012 for: i) its attractive valuation, ii) decent top- and bottom-line
growth, and iii) stabilizing margins. As the group has been consistently reporting earnings
that were consistent with our conservative forecasts, we maintain our IPO note earnings
forecast but upgrade its valuation from 12.5x to 13.0x FY12 EPS. With that, we initiate
coverage of this stock with a BUY recommendation and a fair value of RM1.55 based on
13.0x FY12 EPS.
FYE Dec FY09 FY10 FY11f FY12f FY13f
Revenue 193.7 255.1 293.8 357.8 423.9
Net Profit 30.2 31.7 35.3 39.4 44.7
% chg y-o-y 47.9 4.8 11.5 11.6 13.4
Consensus 35.3 39.4 -
EPS 9.2 9.6 10.7 11.9 13.5
DPS 0.0 0.0 5.3 6.0 6.8
Dividend yield (%) - - 4.3 4.8 5.4
ROE (%) - 16.8 15.3 15.8 16.3
ROA (%) - 12.4 11.4 11.8 12.5
PER (x) 13.6 13.0 11.7 10.5 9.2
BV/share - 0.57 0.70 0.76 0.83
P/BV (x) - 2.2 1.8 1.7 1.5
EV/EBITDA (x) - 8.2 7.4 6.3 5.8
BUY
Price RM1.25
CONSUMER
Oldtown manufactures 3-in-1 coffee and
instant tea mixes and operates a chain of café
outlets under the „OLDTOWN WHITE
COFFEE‟ brand
Stock Statistics
Bloomberg Ticker OTB MK
Share Capital (m) 330.0
Market Cap 412.5
52 week H | L Price 1.40 0.89
3mth Avg Vol (000) 807.7
YTD Returns 0.0
Beta (x) -
Shariah Compliant NO
Major Shareholders (%)
Old Town International 59.12
Lee Siew Heng 5.39
Share Performance (%)
Month Absolute Relative 1m 11.1 11.2
3m 30.4 22.2
6m - -
12m - -
6-month Share Price Performance
0.80
0.90
1.00
1.10
1.20
1.30
1.40
Jul-11 Aug-11 Sep-11 Oct-11 Nov-11 Nov-11 Dec-11
Fair Value RM1.55
The Research Team
+60 (3) 9207 7688

OSK Research
OSK Research | See important disclosures at the end of this report
2
2
COMPANY BACKGROUND
Oldtown at a glance. The group‟s history traces back to the incorporation of White Café in 1999 when
its co-founders, Mr Goh Ching Mun and Mr Tan Say Yap, formulated their own blend of 3-in-1 instant
white coffee. The duo commercialized the coffee product that year with the “OLDTOWN” brand name
and began exporting it to Singapore the following year. Subsequently, the company diversified into
instant milk tea mixes, instant chocolate beverages and roasted coffee powder. In 2005, it decided to
expand vertically into the food services industry by opening a chain of cafés encapsulating the traditional
Ipoh coffee shop setting and ambience. This expansion into food services has met with success because
Oldtown is today a regional food services company with cafés in Malaysia, Singapore, Indonesia and
China.
Beverage manufacturer with extensive café network. Oldtown‟s own manufactured products - the 3-
in-1 coffee mixes and instant tea mixes, and “NANYANG” roasted coffee powder - are marketed to the
retail segment under the “OLDTOWN” brand name. The beverages in the FMCG business that it
produces in-house are sold in more than 7,768 retail outlets in Malaysia, 752 in Singapore, 2,870 retail
outlets in Hong Kong, as well as in other countries. Meanwhile, the group‟s café outlets under the retail
segment operate under the brand name “OLDTOWN WHITE COFFEE” and “OLDTOWN WHITE
COFFEE SIGNATURE” for the premium segment, which is a modern version of its original coffee shop in
Ipoh. The group has an extensive chain of cafes in Malaysia via 194 outlets as of end Nov 2011, and
also operates a few outlets that are open 24/7 in certain areas. This tally includes fully and partially
owned outlets, franchise outlets and licensed outlets.
Figure 1: Principal business activities
Source: OSK, Company
Local franchises. Nearly half of Oldtown‟s café outlets are franchise outlets. A typical franchise
agreement in Malaysia has the following structure:
i) Term: 5 years + 5 years (option)
ii) Fee: Upfront franchise fee of RM80,000 (one-off) and an additional RM10,000 if franchisee
exercises option to extend tenure and then 5% royalty fee on the gros s revenue derived
from monthly sales, and 3% advertising and promotion fees of the gross revenue derived
from monthly sales
iii) Fit-out cost: A typical store will cost around RM700,000 to fit out, although this may vary
according to size of the outlet
iv) Franchisee‟s benefits: Use of trade name, use of trade mark, use of Oldtown‟s franchise
business operating system and sales of Oldtown‟s products and services.

OSK Research
OSK Research | See important disclosures at the end of this report
3
3
Overseas franchises. A typical overseas franchise agreement will entail the following terms:
i) Term: Negotiable
ii) Fee (Overseas): Master licensee to pay upfront franchise fee, which is negotiable
(USD100,000 for Indonesia and USD400,000 for China) and other fees, depending on a
schedule set by Oldtown at initiation of contract namely: i) franchise fee ranging from
USD10-30k per outlet (one-off), ii) 1-5% royalty of the gross revenue derived from sales,
and iii) 1% for advertising and promotion (A&P). The rule of thumb is the earlier the
franchisee fulfills the outlet opening criteria or achieves the terms and conditions set in the
license agreement, the lower the franchise fee and royalty charges.
iii) Fit-out cost: Varies according to size of the outlet and country.
iv) Franchisee‟s benefits: Use of trade name, use of trade mark, use of the group‟s franchise
business system and sales of Oldtown products and services
Rapid expansion of FMCG business. Oldtown‟s current manufacturing facility is located in Ipoh. Its
existing instant coffee mix and instant milk tea mix facility is running at 82% utilization, while that for
roasted coffee stands at 36% as of 3QFY11, but we are forecasting an average utilization of 71% and
30% respectively throughout 2011. The facility is able to manufacture 7,920 tonnes of instant coffee mix
and instant milk tea mix p.a., and 1,248 tonnes of roasted coffee powder p.a. The group also owns 19
mixers with a total production capacity of 14,298 tonnes p.a. and 3 roasters with a total production
capacity of 781 tonnes p.a. In tandem with the growth in its FMCG business, Oldtown will set up a factory
in Tasek Industrial Estate in Kinta, Perak, for which construction started in 2Q11 with completion slated
for 4Q12. To date, the piling has been completed and construction of the project‟s first phase is expected
to commence in 1Q11. The new plant, when completed, is expected to raise production capacity by a
whopping 500%.
Listing summary. OIdtown was listed on the Main Board of Bursa Malaysia on 13 Jul 2011. The IPO
comprised an offer for sale of 33.0m shares and a new issue of 63.4m shares of RM1.00 each at an
issue/offer price of RM1.25 per share. With a market capitalization of RM412.5m upon listing, the group
raised total proceeds of RM79.2m, of which 48% was to be used as capital expenditure (new cafes and
new plant), 25% for acquiring companies not owned by Oldtown International (the holding company of
Oldtown), 13% for working capital, 8% to repay bank borrowings, and the remaining 6% for listing
expenses.

OSK Research
OSK Research | See important disclosures at the end of this report
4
4
WHAT WE LIKE ABOUT OLDTOWN
Favourable consumer trends feeding its growth. The F&B industry in Malaysia is set to grow healthily
moving forward, driven by rising incomes, low unemployment and robust consumer spending. The
average household income of Malaysians grew at a CAGR of 5.0% from 2002-2009. While average
household expenses grew at a CAGR of 3.0% from 1999-2010, the expenditure per household for food
and non-alcoholic beverages expanded at a strong CAGR of 4.9%. Moreover, food and beverage (F&B)
is the largest component of household spending in Malaysia, as shown in Figure 4. We like Oldtown‟s
footprint in the F&B industry, as the demand for its products has always stayed firm during both good and
bad times. The positive consumption trend as well as the group‟s strong fundamentals and expansion
plans, are expected to add impetus to Oldtown‟s earnings moving forward.
Figure 2: Average household income, Malaysia (2002-2009)
Figure 3: Average household expenses, Malaysia (1999-2010)
Source: OSK, CEIC, BNM
Source: OSK, CEIC, BNM
Figure 4: Household consumption by purpose, Malaysia (%) (2002-2009)
Source: OSK, CEIC, Department of Statistics
Figure 5: Household consumption by purpose, Malaysia (%) (2002-2009)
Source: OSK, CEIC, Department of Statistics
2.0
2.5
3.0
3.5
4.0
4.5
2002 2004 2007 2009
RM'000
Average household income
Bumiputera
Chinese
Indian
Others
0.0
0.5
1.0
1.5
2.0
2.5
1999 2005 2010
RM'000
Expenditure per household
Expenditure per household for food and non-alcoholic beverages
Food and non-alcoholic beverages
23%
Housing, water, electricity, gas and fuels
19%
Transport13%
Miscellaneous goods and services
13%
Restaurants and hotels7%
Communication6%
Furnishings, household equipment and maintenance
5%
Recreation and culture5%
Clothing and footwear3%
Alcoholic, beverages and tobacco
2%
Health2%
Education2%
0.0
100.0
200.0
300.0
400.0
500.0
600.0
24yrs and below (Food & Non-
Alcoholic Beverage)
24yrs and below (Coffee & Non-
Alcoholic Beverage)
25 to 34 yrs (Food & Non-Alcoholic
Beverage)
25 to 34 yrs (Coffee & Non-Alcoholic
Beverage)
35 to 44 yrs (Food & Non-Alcoholic
Beverage)
35 to 44 yrs (Coffee & Non-Alcoholic
Beverage)
45 to 64 yrs (Food & Non-Alcoholic
Beverage)
45 to 64 yrs (Coffee & Non-Alcoholic
Beverage)
65 yrs and above (Food & Non-
Alcoholic Beverage)
65 yrs and above (Coffee & Non-
Alcoholic Beverage)
RM
2005
2010
OSK Research
OSK Research | See important disclosures at the end of this report
5
5
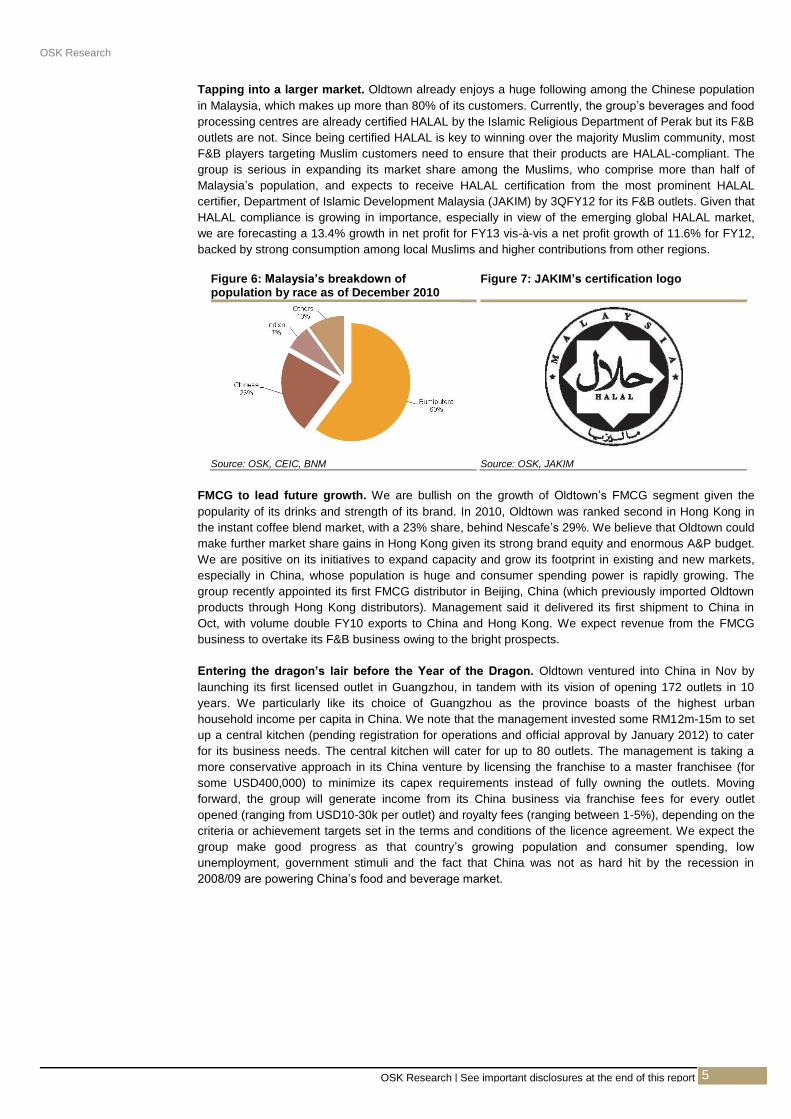
Tapping into a larger market. Oldtown already enjoys a huge following among the Chinese population
in Malaysia, which makes up more than 80% of its customers. Currently, the group‟s beverages and food
processing centres are already certified HALAL by the Islamic Religious Department of Perak but its F&B
outlets are not. Since being certified HALAL is key to winning over the majority Muslim community, most
F&B players targeting Muslim customers need to ensure that their products are HALAL-compliant. The
group is serious in expanding its market share among the Muslims, who comprise more than half of
Malaysia‟s population, and expects to receive HALAL certification from the most prominent HALAL
certifier, Department of Islamic Development Malaysia (JAKIM) by 3QFY12 for its F&B outlets. Given that
HALAL compliance is growing in importance, especially in view of the emerging global HALAL market,
we are forecasting a 13.4% growth in net profit for FY13 vis-à-vis a net profit growth of 11.6% for FY12,
backed by strong consumption among local Muslims and higher contributions from other regions.
Figure 6: Malaysia‟s breakdown of population by race as of December 2010
Figure 7: JAKIM‟s certification logo
Source: OSK, CEIC, BNM
Source: OSK, JAKIM
FMCG to lead future growth. We are bullish on the growth of Oldtown‟s FMCG segment given the
popularity of its drinks and strength of its brand. In 2010, Oldtown was ranked second in Hong Kong in
the instant coffee blend market, with a 23% share, behind Nescafe‟s 29%. We believe that Oldtown could
make further market share gains in Hong Kong given its strong brand equity and enormous A&P budget.
We are positive on its initiatives to expand capacity and grow its footprint in existing and new markets,
especially in China, whose population is huge and consumer spending power is rapidly growing. The
group recently appointed its first FMCG distributor in Beijing, China (which previously imported Oldtown
products through Hong Kong distributors). Management said it delivered its first shipment to China in
Oct, with volume double FY10 exports to China and Hong Kong. We expect revenue from the FMCG
business to overtake its F&B business owing to the bright prospects.
Entering the dragon‟s lair before the Year of the Dragon. Oldtown ventured into China in Nov by
launching its first licensed outlet in Guangzhou, in tandem with its vision of opening 172 outlets in 10
years. We particularly like its choice of Guangzhou as the province boasts of the highest urban
household income per capita in China. We note that the management invested some RM12m-15m to set
up a central kitchen (pending registration for operations and official approval by January 2012) to cater
for its business needs. The central kitchen will cater for up to 80 outlets. The management is taking a
more conservative approach in its China venture by licensing the franchise to a master franchisee (for
some USD400,000) to minimize its capex requirements instead of fully owning the outlets. Moving
forward, the group will generate income from its China business via franchise fees for every outlet
opened (ranging from USD10-30k per outlet) and royalty fees (ranging between 1-5%), depending on the
criteria or achievement targets set in the terms and conditions of the licence agreement. We expect the
group make good progress as that country‟s growing population and consumer spending, low
unemployment, government stimuli and the fact that China was not as hard hit by the recession in
2008/09 are powering China‟s food and beverage market.

OSK Research
OSK Research | See important disclosures at the end of this report
6
6
Figure 8: Urban household income per capita by province, China (2007-2010)
Source: OSK, CEIC, National Bureau of Statistics China
Figure 9: Cover page of Oldtown‟s menu in China
Figure 10: Oldtown‟s menu in China – MySignature
Source: OSK,Company
Source: OSK, Company
Figure 11: Oldtown‟s menu in China – My All Time Favourites
Figure 12: Oldtown‟s menu in China – Oldtown blends
Source: OSK, Company
Source: OSK, Company
0.00
10,000.00
20,000.00
30,000.00
40,000.00
50,000.00
60,000.00
70,000.00
80,000.00
90,000.00
100,000.00
2007 2008 2009 2010
RMB
Urban Household: 36 Cities Average
Urban Household: Beijing
Urban Household: Shanghai
Urban Household: Guangzhou
Urban Household: Shenzhen

OSK Research
OSK Research | See important disclosures at the end of this report
7
7
Aggressive rollout locally and regionally. In the local front, Oldtown is the second largest F&B café
operator with 182 outlets, behind Secret Recipe‟s more than 212 outlets as of end Nov. In tandem with
the management‟s aspirations to match KFC‟s outlets in Malaysia, the group intends to open up to 30
outlets per year in Malaysia, 2-3 outlets a year in Singapore, 75 outlets in Indonesia over 10 years, and
172 outlets in China over 10 years. We expect the group‟s international branch network to grow at a
2011f-2013f CAGR of 107% to 60 outlets, largely driven by its expansion in China (2011f-2013f CAGR of
466%). Given the strong reputation of its brand and a strong balance sheet, we believe that the group is
in a sound position to open more outlets. While we are positive on management‟s plan to aggressively
expand the number of outlets, we are taking a more conservative approach in our outlet growth forecast
(shown in Figure 13) as such a pace of expansion for fully owned and partially owned outlets may strain
its cash flow while franchising too aggressively may slow down its quality control efforts.
Figure 13: Forecast growth of café outlets by type
Source: OSK, Company
Strong A&P and brand building. Oldtown‟s marketing strategy capitalizes on tri-media (print, TV and
radio) advertising campaigns. The company‟s large revenue base allows it to spend more on advertising
and promotion (A&P) vs its competitors. Oldtown collects 3% of gross sales from its outlets in Malaysia
and 1% of gross sales from its regional franchisees for A&P. We are forecasting that the group will spend
some RM14m and RM15m in FY12 and FY13 respectively on A&P. We like the group‟s emphasis on
strengthening and promoting the “OLDTOWN” brand name, which is its key strategy in building brand
equity and winning customer loyalty.
Affordable products focusing on different target markets. Oldtown primarily targets the low- to
middle-income segment of consumers who simply want to meet their dining needs. As such, a typical
meal would cost around RM6.90-RM10.00 on average (with value meals costing less). It recently
introduced the “OLDTOWN SIGNATURE” outlets targeting the mid- to higher-end of the middle income
segment of customers who are more discerning and prefer finer dining. In such outlets, a typical meal
would cost about RM10.00-RM15.00. By having two categories of cafe outlets, Oldtown is able to target
customers from the low end up to the high end, which effectively enlarges its addressable market overall.
Among the local café operators adopting the „kopitiam‟ concept are Papparich, Hailam Kopitiam, Desa
Kopitiam, Georgetown White Coffee and Uncle Lim‟s. However, Oldtown enjoys a strong competitive
edge over its competitors, thanks to its tactical pricing strategy. As shown in Figure 27 in the Appendix,
Oldtown is able to price its items more cheaply due to greater economies of scale, which enables the
group to spread its fixed and operating costs across a wide network of outlets. As such, during bad times
the group would be able to reduce its pricing to draw more customers, while giving little or no room for its
peers to grow, although this strategy may not be sustainable over the long term.

OSK Research
OSK Research | See important disclosures at the end of this report
8
8
WHERE WE HAVE CONCERNS
Changes in consumer preferences. The F&B business is highly dependent on the goodwill and the
market‟s receptiveness to a particular brand. Hence, Oldtown would have to continuously adapt to these
changes. Branding is vital in Malaysia‟s F&B business owing to the highly competitive nature of the
industry and the tendency for consumer preference to change. Thus, Oldtown will have to strive to
achieve brand loyalty among its existing and prospective customers via A&P and customer acquisition
programmes over a sustained period of time.
Consistency of quality. We like Oldtown‟s variety of food as it caters to the general population,
regardless of age and time of the day. The group seems to be in a strong position in terms of pricing, but
we are concerned over service standards and food quality in the long run. We note that Oldtown is aware
that the quality of food at its outlets is average but reiterated that it is branding Oldtown as a practical
dining place that a top-of-the-mind choice for daily dining targeting the low-middle income customers who
are less discerning.
Service quality. We note that labor shortage and the inability to get locals to work in the retail sector is a
common problem in the F&B subsector, hampering efforts to maintain consistent quality of food and
service standards throughout all outlets among local F&B operators. Hence, Oldtown will need to ensure
that their salary package is competitive and continuously invest in internal training and development
programmes to ensure that all outlet staff is skilled in preparing food and providing top-notch customer
services. Failure to do so may lead to customer dissatisfaction and adversely impact the patronage at
Oldtown outlets.
Risks inherent in franchising. Although Oldtown has aggressively opened outlets over the last six
years, there is a downside to this as this gives rise to the risk of deterioration in the quality of its services
and products. For instance, the negative perception of a few below-par outlets may have impact on the
group as a whole. As such, it must ensure that its franchisees are properly trained and abide by the
same system. The potential risks are the ability to retain staff at reasonable wages while continuing to
expand.
Specific risks related to ability to secure new outlets. To facilitate Oldtown‟s expansion, management
faces the need to secure new outlets at strategic locations. Tenants who intend to secure new premises
for outlet expansion are usually required to prepay their rents 3-12 months in advance. Hence, the
group‟s aggressive expansion plans, especially with regard to fully owned outlets, may strain its cash
flow.
Generic risks related to business concentration in Malaysia. Given that a large portion of Oldtown‟s
operations is in Malaysia, broader investment risks such as economic instability in Malaysia may
adversely affect general consumption expenditure. Furthermore, consumer spending can also be
negatively affected by unemployment, high interest rates, high consumer debts, tight credit conditions
and an increase in tax rates, etc. These can in turn adversely affect the group‟s financial performance.
Low barriers to entry. The food industry is a highly competitive one, where the barriers to entry are low
and where operators – ranging from restaurant chains that are large and diverse, to individual
restaurants and cafés – compete for market share. Oldtown has to compete by offering quality food,
competitive pricing, good customer services and accessibility. Failure to keep up with, let alone outclass,
its competitors may adversely affect its financial performance over the longer term.
Dependence on raw materials whose prices are dictated by global commodities. Raw materials are
essential input for any business, especially those involved in the F&B sector. As such, any interruption in
the supply of these raw materials to Oldtown can severely disrupt its operations, which may in turn
materially affect its profitability. Also, the cost of raw materials such as coffee beans and sugar which
Oldtown uses, are dictated by global commodity prices. Hence, the group‟s earnings could to a certain
extent be eroded when raw material prices trend up.

OSK Research
OSK Research | See important disclosures at the end of this report
9
9
FINANCIAL FORECASTS
9MFY11 net profit as anticipated. Oldtown‟s 9MFY11 revenue and net profit came in line with our
expectations, accounting for 68.6% and 80.8% of our adjusted revenue and net profit forecasts
respectively. Revenue from its FMCG business made up 39.1% of total revenue while the remaining
60.9% was from its F&B business. Revenue for 3QFY11 surged 9.5% q-o-q while the PBT dipped 17.3%
q-o-q due to a gain on disposal of investment in associated companies of RM5.1m registered in the
preceding quarter. We believe Oldtown‟s earnings will meet our full year forecasts given that 4Q is
generally the best quarter for the group due to the holiday season.
Positive outlook ahead. We believe that revenue growth from its F&B business will be highly correlated
with the number of new outlets the group will open in future, especially fully owned outlets. We expect
revenue from the FMCG business to outpace that from the F&B business as we anticipate the extra
production capacity from its new manufacturing plant to contribute to a significant spike in earnings in
FY13. Hence we are forecasting a 2011f-2013f CAGR for revenue for the FMCG and F&B business at
25.5% and 16.8% respectively.
Figure 14: Revenue breakdown by business (RM‟m)
Source: OSK, Company
Compared to the numbers in our IPO note in July, we are lowering our revenue forecasts for FY11 and
FY12 to RM293.8m and RM357.8m respectively but maintain our net profit forecast at RM35.3m and
RM39.4m as we expect the company to benefit from the price increase at its F&B outlets in October by
an average of 5.0%, coupled with the retracement in commodity prices, which was one of our greatest
concerns during the company‟s IPO and internal cost saving efforts. We are lowering our original outlet
forecast of 209 outlets to 196 outlets for FY11, and forecast a total of 234 outlets in FY12 and 278 outlets
in FY13.
Figure 15: Food commodity prices (base year = 2007)
Source: OSK, Company
0.0
50.0
100.0
150.0
200.0
250.0
300.0
350.0
400.0
450.0
2009 2010 2011f 2012f 2013f
128.8166.0 185.1
223.0252.7
64.8
89.1108.7
134.9
171.2
RM'm
Manufacturing of beverages
Operation of café outlets

OSK Research
OSK Research | See important disclosures at the end of this report
10
10
Figure 16: Forecast number of café outlets by country
Source: OSK, Company
What‟s in store for F&B and FMCG segments. Although we expect Oldtown to benefit from its HALAL
status by 3QFY12, we remain conservative in forecasting its forward revenue. Hence we are forecasting
a revenue growth of 20.5% for FY12 and FY13 growth of 13.3% for its F&B business, mainly driven by
new outlets. As the construction of its new plant in Ipoh would only be completed in 4QFY12, any
substantial increase in sales from this segment would only be felt in FY13 due to capacity constraints.
Hence, we are forecasting revenue growth of 24.1% for FY12 and 26.9% for FY13 for the FMCG
segment, fuelled by production capacity increases and bright growth prospects in its current markets
(such as China) and potential markets (Iran). In our forecast, we are assuming an average utilization of
71.0% for FY11, 80.0% for FY12 and 46.5% for FY13 for the instant coffee and instant milk tea mixes.
Our average selling price assumptions are as shown in Table 1.
Table 1: Assumptions used to derive revenue and net profit
FY07 FY08 FY09 FY10 FY11f FY12f FY13f
Revenue (RM m) 79.2 138.4 193.7 255.1 293.8 357.8 423.9
- F&B 47.9 93.3 128.8 166.0 185.1 223.0 252.7
- FMCG 31.3 45.1 64.8 89.1 108.7 134.8 171.2
Average revenue per store (RM‟m)
F&B 0.64 0.87 0.89 0.95 0.94 0.95 0.91
Average cost of sales & direct expenses per store (RM‟m)
F&B 0.46 0.57 0.57 0.64 0.65 0.66 0.66
Average selling price of FMCG products (RM per kg)
Local - 9.0 10.0 11.8 14.1 14.9 15.7
Overseas - 14.0 15.0 17.5 20.6 21.8 21.8
Other parameters (FMCG business)
Total capacity – instant coffee mix and instant milk tea („000 kg per year)
7,920 7,920 7,920 7,920 7,920 7,920 15,840
Average utilization rate – instant coffee mix and instant milk tea (%)
- - - 69.0 71.0 80.0 46.5
Source: OSK, Company
OSK Research
OSK Research | See important disclosures at the end of this report
11
11
Healthy topline growth but overseas F&B contribution may take time. While the growth prospects
overseas seem attractive, it may take some time for Oldtown to establish its brand in those countries. We
expect the group‟s international branch network to grow at a 2011f-2013f CAGR of 107% to 60 outlets,
largely driven by its expansion in China (2011f-2013f CAGR of 466%), while its local network is expected
to grow at a 2011f-2013f CAGR of 9.4% to 218 outlets. As management will continue to focus on building
scale overseas, we anticipate its local operations to make up a larger share of net sales in the short to
medium term.
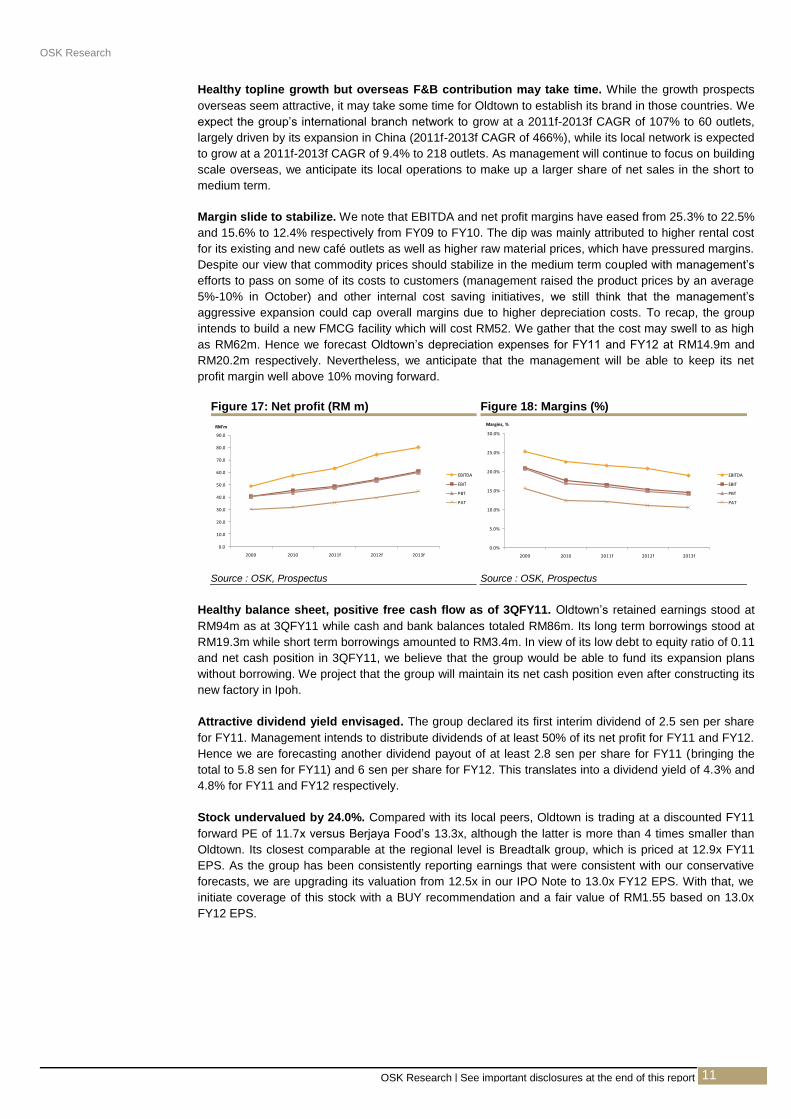
Margin slide to stabilize. We note that EBITDA and net profit margins have eased from 25.3% to 22.5%
and 15.6% to 12.4% respectively from FY09 to FY10. The dip was mainly attributed to higher rental cost
for its existing and new café outlets as well as higher raw material prices, which have pressured margins.
Despite our view that commodity prices should stabilize in the medium term coupled with management‟s
efforts to pass on some of its costs to customers (management raised the product prices by an average
5%-10% in October) and other internal cost saving initiatives, we still think that the management‟s
aggressive expansion could cap overall margins due to higher depreciation costs. To recap, the group
intends to build a new FMCG facility which will cost RM52. We gather that the cost may swell to as high
as RM62m. Hence we forecast Oldtown‟s depreciation expenses for FY11 and FY12 at RM14.9m and
RM20.2m respectively. Nevertheless, we anticipate that the management will be able to keep its net
profit margin well above 10% moving forward.
Figure 17: Net profit (RM m) Figure 18: Margins (%)
Source : OSK, Prospectus
Source : OSK, Prospectus
Healthy balance sheet, positive free cash flow as of 3QFY11. Oldtown‟s retained earnings stood at
RM94m as at 3QFY11 while cash and bank balances totaled RM86m. Its long term borrowings stood at
RM19.3m while short term borrowings amounted to RM3.4m. In view of its low debt to equity ratio of 0.11
and net cash position in 3QFY11, we believe that the group would be able to fund its expansion plans
without borrowing. We project that the group will maintain its net cash position even after constructing its
new factory in Ipoh.
Attractive dividend yield envisaged. The group declared its first interim dividend of 2.5 sen per share
for FY11. Management intends to distribute dividends of at least 50% of its net profit for FY11 and FY12.
Hence we are forecasting another dividend payout of at least 2.8 sen per share for FY11 (bringing the
total to 5.8 sen for FY11) and 6 sen per share for FY12. This translates into a dividend yield of 4.3% and
4.8% for FY11 and FY12 respectively.
Stock undervalued by 24.0%. Compared with its local peers, Oldtown is trading at a discounted FY11
forward PE of 11.7x versus Berjaya Food‟s 13.3x, although the latter is more than 4 times smaller than
Oldtown. Its closest comparable at the regional level is Breadtalk group, which is priced at 12.9x FY11
EPS. As the group has been consistently reporting earnings that were consistent with our conservative
forecasts, we are upgrading its valuation from 12.5x in our IPO Note to 13.0x FY12 EPS. With that, we
initiate coverage of this stock with a BUY recommendation and a fair value of RM1.55 based on 13.0x
FY12 EPS.
0.0
10.0
20.0
30.0
40.0
50.0
60.0
70.0
80.0
90.0
2009 2010 2011f 2012f 2013f
RM'm
EBITDA
EBIT
PBT
PAT
0.0%
5.0%
10.0%
15.0%
20.0%
25.0%
30.0%
2009 2010 2011f 2012f 2013f
Margins, %
EBITDA
EBIT
PBT
PAT

OSK Research
OSK Research | See important disclosures at the end of this report
12
12
Table 2: Local peer comparison (as at 3 Jan 2012)
Company Current
Market Cap
(RM‟m)
Revenue
(RM‟m)(1)
Net profit
(RM‟m) (1)
EPS
(RM) (1)
ROE
(%)(1)
FY11
Forward PE
(X)
KFC 3,030.3 2,732 156.6 0.20 15.7 19.2
QSR
Brands 1,969.3 3,321 122.0 0.41 15.0 15.9
Berjaya
Food 143.6 70.7 10.8 0.08 19.9 13.3
OldTown 412.5 305.5 35.3 0.11 17.1 11.7
(1) Consensus data for FYE11
Source: OSK, Bloomberg
Table 3: Regional and international peer comparison (as at 3 Jan 2012)
Company Listed In
Current Market
Cap (USD)
Revenue
(USD‟m)(1)
Net profit
(USD‟m)
(1)
EPS
(USD‟sen)
(1)
Forward
PE
(X)
Regional
Breadtalk
Group SGX
117.6 285.3 9.3 3.3 12.9
Jollibee
Foods PSE
2,204.9 1,398.1 72.3 7.0 30.6
International
Dunkin
Brands NASDAQ
3,000.9 615.6 95.8 0.9 27.1
Starbucks NASDAQ 34,295.9 13,004.0 1,386.2 1.8 25.2
McDonalds NYSE 102,659.5 26,952.7 5,457.9 5.2 19.2
OldTown KLSE 130.1 96.74 11.18 3.8 11.7
(1) Consensus data for FYE11 SGX – Singapore Stock Exchange PSE – Philippines Stock Exchange IDX – Indonesia Stock Exchange NYSE – New York Stock Exchange
Source: OSK, Bloomberg
OSK Research
OSK Research | See important disclosures at the end of this report
13
13
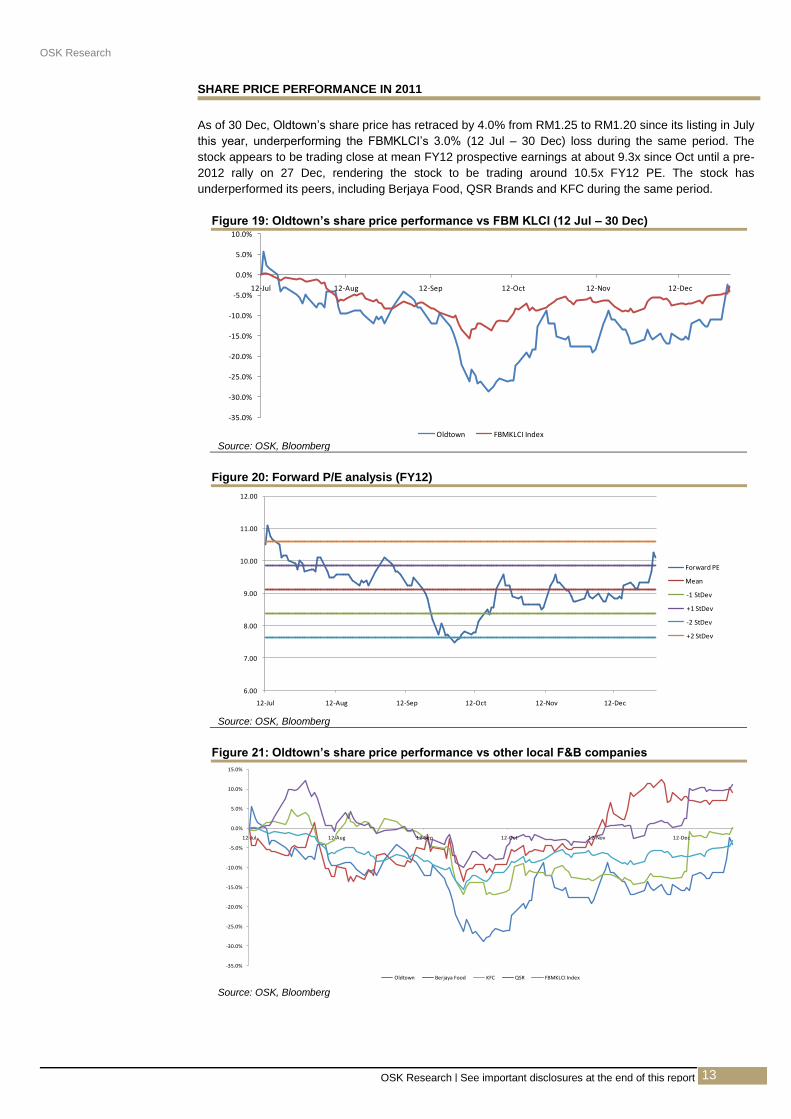
SHARE PRICE PERFORMANCE IN 2011
As of 30 Dec, Oldtown‟s share price has retraced by 4.0% from RM1.25 to RM1.20 since its listing in July
this year, underperforming the FBMKLCI‟s 3.0% (12 Jul – 30 Dec) loss during the same period. The
stock appears to be trading close at mean FY12 prospective earnings at about 9.3x since Oct until a pre-
2012 rally on 27 Dec, rendering the stock to be trading around 10.5x FY12 PE. The stock has
underperformed its peers, including Berjaya Food, QSR Brands and KFC during the same period.
Figure 19: Oldtown‟s share price performance vs FBM KLCI (12 Jul – 30 Dec)
Source: OSK, Bloomberg
Figure 20: Forward P/E analysis (FY12)
Source: OSK, Bloomberg
Figure 21: Oldtown‟s share price performance vs other local F&B companies
Source: OSK, Bloomberg
-35.0%
-30.0%
-25.0%
-20.0%
-15.0%
-10.0%
-5.0%
0.0%
5.0%
10.0%
12-Jul 12-Aug 12-Sep 12-Oct 12-Nov 12-Dec
Oldtown FBMKLCI Index
6.00
7.00
8.00
9.00
10.00
11.00
12.00
12-Jul 12-Aug 12-Sep 12-Oct 12-Nov 12-Dec
Forward PE
Mean
-1 StDev
+1 StDev
-2 StDev
+2 StDev
-35.0%
-30.0%
-25.0%
-20.0%
-15.0%
-10.0%
-5.0%
0.0%
5.0%
10.0%
15.0%
12-Jul 12-Aug 12-Sep 12-Oct 12-Nov 12-Dec
Oldtown Berjaya Food KFC QSR FBMKLCI Index

OSK Research
OSK Research | See important disclosures at the end of this report
14
14
APPENDICES
MALAYSIA ECONOMIC OUTLOOK FOR CONSUMER SECTOR AND F&B BUSINESS
F&B industry remains resilient. According to a report by IMAP, the global food and beverage (F&B)
sector – which comprises farming, food production, distribution, retail and catering – was valued at
USD5.7trn in 2008. The industry is one of the major contributors to the economic growth of most
countries and has historically witnessed consistent growth. The industry is expected to expand at a
CAGR of 3.5% to USD7trn by 2014, according to Dow Jones Factiva. Undeniably, the recent economic
slump has had an adverse impact on most global industries and the F&B industry was not spared. The
major problems faced by the F&B players are rising food prices (leading to higher COGS), increasing
logistic costs (due to increasing oil prices) and a decline in consumer spending. Nevertheless, the F&B
industry has been relatively less affected when compared to other industries. This is mainly attributed to
the fact that the F&B industry continues to be part and parcel of everyone‟s lives during good or bad
times.
OVERWEIGHT on the local consumer sector. In Malaysia, the consumer sector remained rather
resilient during the last crisis in 2008/09 and in fact, has been rerated strongly post crisis. During the last
crisis in 2008/09, most consumer companies‟ top and bottom lines continued to register double-digit
growth, driven mainly by promotional activities which spurred consumer spending, firm demand for food
and internal cost saving initiatives. Despite the revenue foregone or expenses incurred arising from
heavy discounting, promotional activities and opening new outlets, most retail companies reported flat to
improved margins in 2008-2010. The same applies to F&B companies, though food commodity prices
have spiraled upwards after the crisis as shown in Figure 22. Having implemented various
countermeasures to cope with the last recession in 2008/09 and learnt the crucial lessons, we believe
consumer-centric companies could perform even better now than before.
Previously downgraded due to concerns over high commodity prices. Our house previously
downgraded the F&B subsector from OVERWEIGHT to NEUTRAL back in Feb 2011, as we had
expected high food commodity prices to impact the sentiment of the stocks in the sector, though we still
believed that F&B companies would continue to grow. Although the prices of food commodities have
remained at elevated levels since 2007, prices have generally stabilized and those of some food
commodities have even retraced from their recent highs. As the global economy continues to deteriorate,
we expect prices to decline further, although they are not likely to touch the previous lows. In the event of
the prices of food commodities staying high, most F&B companies would have developed a higher
tolerance level in view of their ability to stomach the high raw material costs after the 2008/09 crisis. The
F&B subsector, which has a low equity beta, would be a safer bet in view of the deteriorating global
economic and equity market outlooks for 2012. Hence, we have upgraded the F&B subsector from
NEUTRAL to OVERWEIGHT in Oct 2011, based on its unchanged strong fundamentals and defensive
nature.
Figure 22: Food commodity prices (base year = 2007)
Source: OSK, Bloomberg

OSK Research
OSK Research | See important disclosures at the end of this report
15
15
Once bitten, twice shy. Having adopted the necessary countermeasures during the last recession in
2008/09 and having learnt the lessons on how to deal with such turbulent situations should they recur in
the future, we believe that consumer companies in general could fare even better now than before.
Hence, we view that such companies would continue to post profit growth, albeit the rate of growth would
be at a slower pace.
Growth to be supported by two-pronged expansion. In line with the government‟s Economic
Transformation Programme (ETP) that encourages local businesses to expand overseas, we view that
more consumer companies, including those from the F&B subsector, will embark on more aggressive
expansion plans – both on the local and overseas fronts – over the next few years. New openings in
selected locations and the refitting of old outlets will attract new customers and generate new revenue
streams, which can buffer against any potential sales decline for existing outlets.
Table 4: Local F&B companies‟ expansion plans
Company Expansion plan Targeted
opening date
Oldtown China 2011
Indonesia 2011
Secret Recipe Cambodia April 2012
India 3Q12
Kenny Rogers China 2012
KFC Increase number of stores by 15 stores 2012
Papparich Singapore At negotiating stage Thailand
Philippines
China
Australia
Source: OSK, Company
Our view is further supported by favourable consumer factors. Aside from being supported by
endogenous factors as mentioned above, we expect consumer demand to stay relatively resilient. While
consumer sentiment may be affected by the generally weak global economic outlook, we view that
sentiment will be rebound once consumers have somewhat adapted to the prevailing uncertain and
volatile economic environment. Our positive view on the F&B industry is further supported by low
unemployment, rising disposable income and a trending-up expenditure per household for food and non-
alcoholic beverages. As shown in Figure 23, the average household income of Malaysians recorded a
CAGR of 5.0% from 2002-2009. While the average household expenses recorded a CAGR of 3.0% from
1999-2010, the expenditure per household for food and non-alcoholic beverages recorded a strong
CAGR of 4.9%. Moreover, F&B remains the largest component of household spending in Malaysia as
shown in Figure 25.
Figure 23: Average household income, Malaysia (2002-2009)
Figure 24: Average household expenses, Malaysia (1999-2010)
Source: OSK, CEIC, BNM
Source: OSK, CEIC, BNM
2.0
2.5
3.0
3.5
4.0
4.5
2002 2004 2007 2009
RM'000
Average household incomeBumiputera
Chinese
Indian
Others
0.0
0.5
1.0
1.5
2.0
2.5
1999 2005 2010
RM'000
Expenditure per household
Expenditure per household for food and non-alcoholic beverages

OSK Research
OSK Research | See important disclosures at the end of this report
16
16
Figure 25: Household consumption by purpose, Malaysia (%) (2002-2009)
Source: OSK, CEIC, Department of Statistics
Table 5: Household consumption by purpose (%)
2000 2009
Food and non-alcoholic beverages 24.1% 21.8%
Alcoholic, beverages and tobacco 2.2% 2.3%
Clothing and footwear 3.5% 2.4%
Housing, water, electricity, gas and fuel 21.7% 16.7%
Furnishings, household equipment and maintenance 5.9% 5.2%
Health 2.1% 2.1%
Transport 12.6% 13.1%
Communication 4.9% 7.4%
Recreation and culture 4.3% 4.9%
Education 1.5% 1.6%
Restaurants and hotels 5.8% 9.7%
Miscellaneous goods and services 11.6% 12.7% Source: OSK, BNM
Figure 26: Household consumption by purpose, Malaysia (%) (2002-2009)
Source: OSK, CEIC, Department of Statistics
While some F&B stocks are rich in valuation, they are safer bets. Due to the F&B companies‟
business nature, their earnings are generally expected to be resilient. While revenue and earnings may
not grow exponentially in the short term, they are still expected to grow organically in tandem with the
population growth. Any cost pressures could most probably be passed onto consumers easily as the
price increase per unit is minimal, coupled with the fact that food and beverage products are necessities.
In the event that any cost increase is not passed onto consumers, companies that have achieved
economies of scale are expected to withstand pressure on their margins during times of high commodity
prices. Due to its safer and resilient nature, we believe that the F&B subsector offers an interesting
investment proposition for 2012 in anticipation of generally weaker economic conditions moving forward.
Food and non-alcoholic beverages
23%
Housing, water, electricity, gas and fuels
19%
Transport13%
Miscellaneous goods and services
13%
Restaurants and hotels7%
Communication6%
Furnishings, household equipment and maintenance
5%
Recreation and culture5%
Clothing and footwear3%
Alcoholic, beverages and tobacco
2%
Health2%
Education2%
0.0
100.0
200.0
300.0
400.0
500.0
600.0
24yrs and below (Food & Non-
Alcoholic Beverage)
24yrs and below (Coffee & Non-
Alcoholic Beverage)
25 to 34 yrs (Food & Non-Alcoholic
Beverage)
25 to 34 yrs (Coffee & Non-Alcoholic
Beverage)
35 to 44 yrs (Food & Non-Alcoholic
Beverage)
35 to 44 yrs (Coffee & Non-Alcoholic
Beverage)
45 to 64 yrs (Food & Non-Alcoholic
Beverage)
45 to 64 yrs (Coffee & Non-Alcoholic
Beverage)
65 yrs and above (Food & Non-
Alcoholic Beverage)
65 yrs and above (Coffee & Non-
Alcoholic Beverage)
RM
2005
2010

OSK Research
OSK Research | See important disclosures at the end of this report
17
17
INDICATIVE PRICE COMPARISON FOR SOME BEST SELLING PRODUCTS AMONG
LOCAL „KOPITIAM‟ OPERATORS
Figure 27: Indicative Pricing of Oldtown‟s best selling products vis-à-vis other „Kopitiam‟
operators in Malaysia
Operator/Items Oldtown Papparich Hailam Kopitiam
Desa Kopitiam
Georgetown White Coffee
Uncle Lim‟s
Type of Outlet
Ipoh Koey Teow Soup
With Chicken
RM7.50*
RM9.90
RM8.50
RM8.90
N/A
N/A
Shop Lot
Assam Laksa
RM6.90*
RM10.90
RM8.20
RM7.90
RM8.90
(Shopping
Mall)
RM8.90
(Shopping
Mall)
Shop Lot
Nasi Lemak
With Sambal/ Curry Chicken
RM10.50
RM10.90
RM9.60
RM8.90*
RM9.90
(Shopping
Mall)
RM9.90
(Shopping
Mall)
Shop Lot
Kaya & Butter Toast (Single)
RM1.70*
RM4.20
RM2.50
RM2.30
RM3.80
(Shopping
Mall)
RM2.50
(Shopping
Mall)
Shop Lot
Omega Soft Boiled Eggs
RM3.00
RM2.80*
RM2.80*
N/A
RM4.20
(Shopping
Mall)
RM4.20
(Shopping
Mall)
Shop Lot
White Coffee
(Iced)
RM3.90
RM4.80
RM3.80
RM3.50*
RM4.20
(Shopping
Mall)
RM3.50*
(Shopping
Mall)
Shop Lot
Enriched
Chocolate (Ice)
RM4.50*
RM7.90
RM6.80
RM6.20
RM4.50*
(Shopping
Mall)
N/A
Shop Lot
*Cheapest among operators Note: Price of items are obtained in outlets of respective kopitiam operators within the Klang Valley between 3-17 Dec
Source: OSK

OSK Research
OSK Research | See important disclosures at the end of this report
18
18
A VISIT TO OLDTOWN‟S FOOD PROCESSING CENTRE IN SUBANG, SELANGOR
We came, we saw, we got convinced. We visited one of Oldtown‟s three food processing centres in
Subang Jaya, Selangor, during which we got a first-hand look at how this facility processes and distributes
food, along with other items, to the company‟s café outlets in the central and southern regions of
Peninsular Malaysia. Oldtown‟s two other food processing centres are located in Ipoh (see Figure 28). We
also took a tour of one of the company‟s six central warehouses, which is located just next to the central
kitchen and serves as a store for items such as furniture, electrical appliances, as well as rice and instant
coffee mix from Ipoh.
Figure 28: Process flow of distribution activities for Oldtown‟s products
Source: OSK, Prospectus
Figure 29: Process flow for Oldtown‟s food processing centres and warehouses
Source: OSK
Operation framework in a nutshell. During our visit, we were taken to a tour of Oldtown‟s three
facilities, namely the warehouse, food processing centre and the research and development (R&D)
facility. As depicted in Figures 28 and 29, the food processing centre takes on the role of procuring the
food items for Oldtown‟s café outlets. Firstly, the centre receives all the food orders from each of the
outlets under its coverage. A staff member then processes the order and upon approval, passes it to the
food processing centre. After preparing the food, it is then packed, pasteurized and frozen. While waiting
for the items to be delivered to the outlets, the prepared food will be stored in the cold room of the
designated warehouse, while other items – such as rice, sugar, instant coffee mix, furniture and electrical
appliances – are kept in other parts of the warehouse at room temperature (see Figures 32 to 34). The
R&D facility is responsible for creating new products to be added to the menu. The R&D team formulates
new recipes and prepares “test tube” products, initiating up to two new products every two months on
average.
Prepared food
sent to
warehouse for
storage pending
delivery
Food
processed and
frozen
Order from
outlets
received
Warehouse
delivers item
to outlets
OSK Research
OSK Research | See important disclosures at the end of this report
19
19
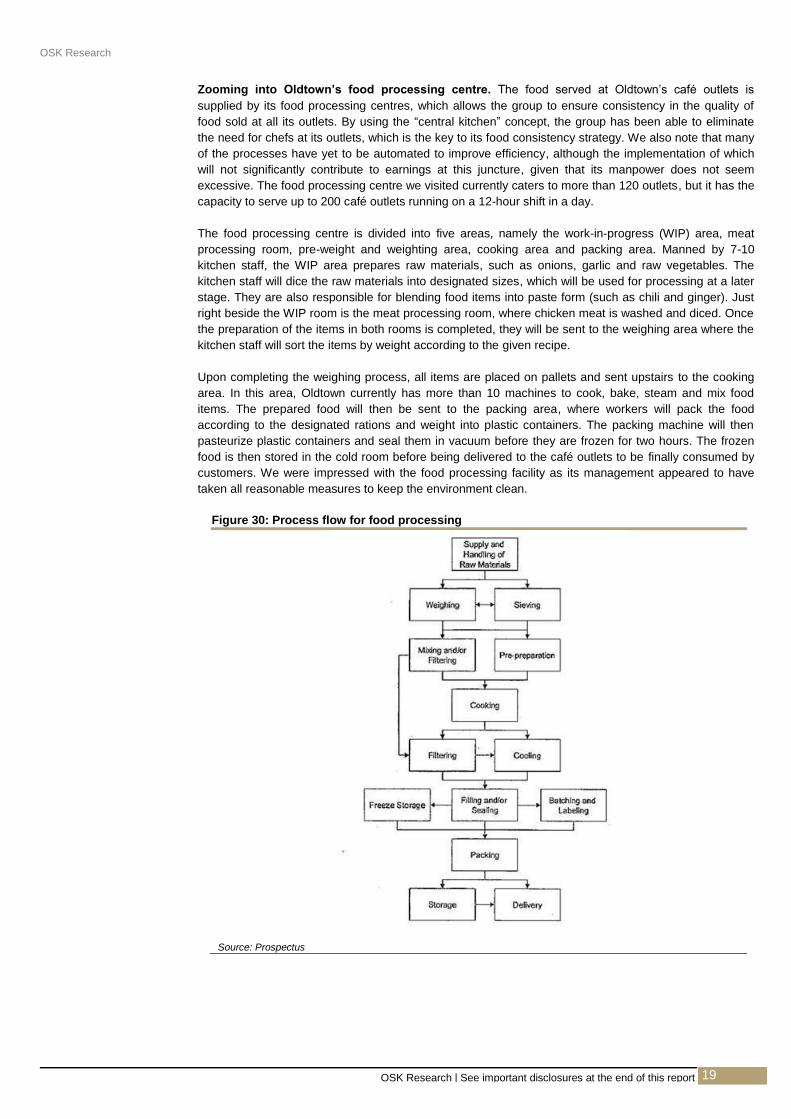
Zooming into Oldtown‟s food processing centre. The food served at Oldtown‟s café outlets is
supplied by its food processing centres, which allows the group to ensure consistency in the quality of
food sold at all its outlets. By using the “central kitchen” concept, the group has been able to eliminate
the need for chefs at its outlets, which is the key to its food consistency strategy. We also note that many
of the processes have yet to be automated to improve efficiency, although the implementation of which
will not significantly contribute to earnings at this juncture, given that its manpower does not seem
excessive. The food processing centre we visited currently caters to more than 120 outlets, but it has the
capacity to serve up to 200 café outlets running on a 12-hour shift in a day.
The food processing centre is divided into five areas, namely the work-in-progress (WIP) area, meat
processing room, pre-weight and weighting area, cooking area and packing area. Manned by 7-10
kitchen staff, the WIP area prepares raw materials, such as onions, garlic and raw vegetables. The
kitchen staff will dice the raw materials into designated sizes, which will be used for processing at a later
stage. They are also responsible for blending food items into paste form (such as chili and ginger). Just
right beside the WIP room is the meat processing room, where chicken meat is washed and diced. Once
the preparation of the items in both rooms is completed, they will be sent to the weighing area where the
kitchen staff will sort the items by weight according to the given recipe.
Upon completing the weighing process, all items are placed on pallets and sent upstairs to the cooking
area. In this area, Oldtown currently has more than 10 machines to cook, bake, steam and mix food
items. The prepared food will then be sent to the packing area, where workers will pack the food
according to the designated rations and weight into plastic containers. The packing machine will then
pasteurize plastic containers and seal them in vacuum before they are frozen for two hours. The frozen
food is then stored in the cold room before being delivered to the café outlets to be finally consumed by
customers. We were impressed with the food processing facility as its management appeared to have
taken all reasonable measures to keep the environment clean.
Figure 30: Process flow for food processing
Source: Prospectus

OSK Research
OSK Research | See important disclosures at the end of this report
20
20
Figure 31: Loading supplies to be delivered to Oldtown‟s café outlets
Source: OSK Research Snapshots
Figure 32: Oldtown‟s warehouse where dry food stock is stored
Figure 33: Oldtown‟s warehouse stores furniture and electrical appliances
Source: OSK Research Snapshots
Source: OSK Research Snapshots
Figure 34: Oldtown‟s warehouse where instant coffee mix and roasted coffee powder are stored
Figure 35: Preparing to enter the cold room (sub-zero temperature)
Source: OSK Research Snapshots
Source: OSK Research Snapshots

OSK Research
OSK Research | See important disclosures at the end of this report
21
21
Figure 36: Processed food sorted according to outlets ready for delivery in the cold room
Figure 37: Staff conducting research and development initiatives
Source: OSK Research Snapshots
Source: OSK Research Snapshots
Figure 38: Oldtown staff member giving visitors a short briefing before they enter the food processing centre
Figure 39: Attendees washing their hands in a sterilized environment before entering the food processing centre
Source: OSK Research Snapshots
Source: OSK Research Snapshots
Figure 40: Visit ended with an investor briefing and a “snacking” session in Oldtown Signature, Taipan branch
Figure 41: Oldtown COO Clarence D‟Silva briefing investors on Oldtown‟s future plans
Source: OSK Research Snapshots
Source: OSK Research Snapshots
OSK Research
OSK Research | See important disclosures at the end of this report
22
22
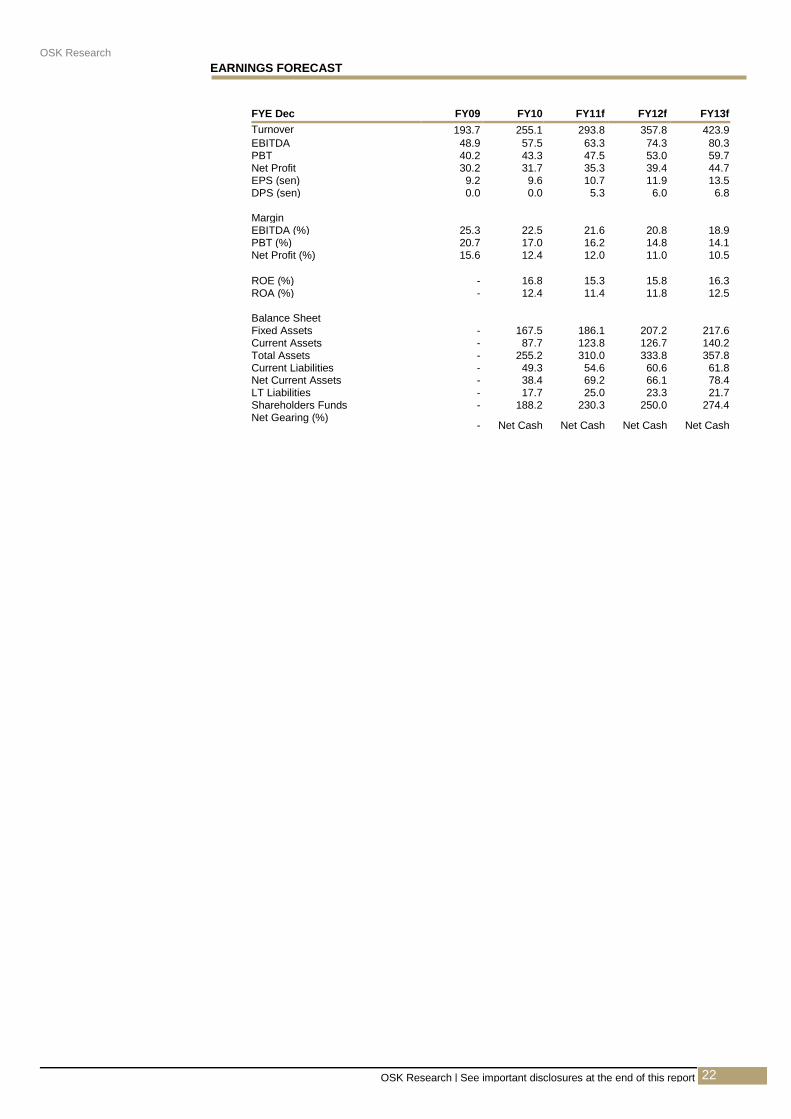
FYE Dec FY09 FY10 FY11f FY12f FY13f
Turnover 193.7 255.1 293.8 357.8 423.9
EBITDA 48.9 57.5 63.3 74.3 80.3 PBT 40.2 43.3 47.5 53.0 59.7 Net Profit 30.2 31.7 35.3 39.4 44.7 EPS (sen) 9.2 9.6 10.7 11.9 13.5 DPS (sen) 0.0 0.0 5.3 6.0 6.8 Margin EBITDA (%) 25.3 22.5 21.6 20.8 18.9 PBT (%) 20.7 17.0 16.2 14.8 14.1 Net Profit (%) 15.6 12.4 12.0 11.0 10.5
ROE (%) - 16.8 15.3 15.8 16.3 ROA (%) - 12.4 11.4 11.8 12.5 Balance Sheet Fixed Assets - 167.5 186.1 207.2 217.6 Current Assets - 87.7 123.8 126.7 140.2 Total Assets - 255.2 310.0 333.8 357.8 Current Liabilities - 49.3 54.6 60.6 61.8 Net Current Assets - 38.4 69.2 66.1 78.4 LT Liabilities - 17.7 25.0 23.3 21.7 Shareholders Funds - 188.2 230.3 250.0 274.4 Net Gearing (%)
- Net Cash Net Cash Net Cash Net Cash
EARNINGS FORECAST
OSK Research
OSK Research Guide to Investment Ratings
Buy: Share price may exceed 10% over the next 12 months Trading Buy: Share price may exceed 15% over the next 3 months, however longer-term outlook remains uncertain Neutral: Share price may fall within the range of +/- 10% over the next 12 months Take Profit: Target price has been attained. Look to accumulate at lower levels Sell: Share price may fall by more than 10% over the next 12 months Not Rated (NR): Stock is not within regular research coverage
All research is based on material compiled from data considered to be reliable at the time of writing. However, information and opinions expressed will be subject to change at short notice, and no part of this report is to be construed as an offer or solicitation of an offer to transact any securities or financial instruments whether referred to herein or otherwise. We do not accept any liability directly or indirectly that may arise from investment decision-making based on this report. The company, its directors, officers, employees and/or connected persons may periodically hold an interest and/or underwriting commitments in the securities mentioned.
Distribution in Singapore
This research report produced by OSK Research Sdn Bhd is distributed in Singapore only to "Institutional Investors", "Expert Investors" or "Accredited Investors" as defined in the Securities and Futures Act, CAP. 289 of Singapore. If you are not an "Institutional Investor", "Expert Investor" or "Accredited Investor", this research report is not intended for you and you should disregard this research report in its entirety. In respect of any matters arising from, or in connection with, this research report, you are to contact our Singapore Office, DMG & Partners Securities Pte Ltd ("DMG").
All Rights Reserved. No part of this publication may be used or re-produced without expressed permission from OSK Research. Published by OSK Research Sdn. Bhd., 6th Floor, Plaza OSK, Jalan Ampang, 50450 Kuala Lumpur Printed by Xpress Print (KL) Sdn. Bhd., No. 17, Jalan Lima, Off Jalan Chan Sow Lin, 55200 Kuala Lumpur
OSK RESEARCH SDN. BHD. (206591-V) (A wholly-owned subsidiary of OSK Investment Bank Berhad)
Kuala Lumpur Hong Kong Singapore
Malaysia Research Office
OSK Research Sdn. Bhd.
6th Floor, Plaza OSK
Jalan Ampang
50450 Kuala Lumpur
Malaysia
Tel : +(60) 3 9207 7688
Fax : +(60) 3 2175 3202
OSK Securities
Hong Kong Ltd.
12th Floor,
World-Wide House
19 Des Voeux Road
Central, Hong Kong
Tel : +(852) 2525 1118
Fax : +(852) 2810 0908
DMG & Partners
Securities Pte. Ltd.
10 Collyer Quay
#09-08 Ocean Financial Centre
Singapore 049315
Tel : +(65) 6533 1818
Fax : +(65) 6532 6211
Jakarta Shanghai Phnom Penh
PT OSK Nusadana
Securities Indonesia
Plaza CIMB Niaga,
14th Floor,
Jl. Jend. Sudirman Kav. 25,
Jakarta Selatan 12920
Indonesia
Tel : (6221) 2598 6888
Fax : (6221) 2598 6777
OSK (China) Investment
Advisory Co. Ltd.
Room 6506, Plaza 66
No.1266, West Nan Jing Road
200040 Shanghai
China
Tel : +(8621) 6288 9611
Fax : +(8621) 6288 9633
OSK Indochina Securities Limited
No. 1-3, Street 271,
Sangkat Toeuk Thla, Khan Sen Sok,
Phnom Penh,
Cambodia
Tel: (855) 23 969 161
Fax: (855) 23 969 171
Bangkok
OSK Securities (Thailand) PCL
191, Silom Complex Building
16th Floor, Silom Road,Silom,
Bangrak, Bangkok 10500
Thailand
Tel: +(66) 2200 2000
Fax : +(66) 2632 0191