OLDER DOMINION PARTNERSHIP 2011 Virginia … · Ed Ansello, Ph.D., Virginia ... The Center for...
48
O LDER D OMINION P ARTNERSHIP 2011 Virginia Age Ready Indicators Benchmark Survey Historic Triangle Oversample Report Prepared by Southeastern Institute of Research, Inc.
-
Upload
nguyenhanh -
Category
Documents
-
view
215 -
download
0
Transcript of OLDER DOMINION PARTNERSHIP 2011 Virginia … · Ed Ansello, Ph.D., Virginia ... The Center for...

OLDER DOMINION PARTNERSHIP 2011 Virginia Age Ready Indicators Benchmark Survey
Historic Triangle Oversample Report
Prepared by
Southeastern Institute of Research, Inc.

OLDER DOMINION PARTNERSHIP
The Older Dominion Partnership (ODP) is a non-profit initiative by Virginia businesses, government, foundations, and non-profits to help Virginia ride the age wave – the doubling of the Commonwealth's 65+ year old population from ~900,000 today to over ~1.8 million by 2030. The ODP was created in 2007 by a cross section of community leaders including business leaders, health system executives, executive directors of non-profit organizations serving Virginia's aging population, leaders from Virginia's philanthropic community, and academicians from Virginia's universities, and state government officials.
The ODP serves as an inspiration, catalyst, and independent platform for networking, collaborating, planning, and as a potential funding partner for ODP members. The overarching goals of the ODP are to 1) build awareness of the coming age wave and its potential impact on the Commonwealth; 2) broaden the number of stakeholders who want to prepare for this demographic shift; 3) help facilitate the creation and advancement of a community-driven, overall strategy to accelerate Virginia's age wave preparedness; 4) support ODP members through strategic coordination and possible alignment of funding sources; and 5) document and report on Virginia's progress in preparing for the age wave.
Survey advisory committee:
Ed Ansello, Ph.D., Virginia Commonwealth University
Robert Blancato, Maltz, Blancato, & Associates
Peter A. Boling, M.D., Virginia Commonwealth University
Kathleen Fletcher, R.N., M.S.N., C.S.-B.C., G.N.P., University of Virginia
Marissa Galicia-Castillo, M.D., Eastern Virginia Medical College
Christine J. Jensen, Ph.D., Center for Excellence in Aging and Geriatric Health
Gina Kavanaugh, R.N., The Center for Excellence in Aging and Geriatric Health
Jay Holdren, MHA, L-NHA, VCU Medical Center, VCU Partnership in Geriatric Education
Paula Kupstas, Ph.D., Virginia Commonwealth University
Richard Lindsay, M.D., University of Virginia
Merle Mast, Ph.D., James Madison University
Marilyn Pace Maxwell, MSW, Mountain Empire Older Citizens, Inc.
Chris Murray, Jefferson Area Board for Aging (JABA)
James Olds, Ph.D., George Mason University
Paulette Parker, Williamsburg Community Health Foundation
Karen Roberto, Ph.D., Virginia Polytechnic Institute
Bruce Robertson, Sentara Healthcare
Ken Robertson, Virginia Retirement System
Louis Rossiter, Ph.D., College of William and Mary
Gordon Walker, Jefferson Area Board for Aging
Rhonda Zingraff, Ph.D., James Madison University
Financial support provided by:
AARP-Virginia
Baptist Community Ministries
Bon Secours Virginia Health System
Danville Regional Foundation
Estate Planning Council
Genworth Foundation
HCA Virginia Health System
Home Instead Senior Care of Virginia
Network for Good
Richmond Memorial Health Foundation
The Community Foundation for Northern Virginia
The Community Foundation of Greater Richmond
United Way of Greater Richmond and Petersburg
Virginia Association of Area Agencies on Aging
Virginia Association of Counties
Virginia Association of Local Human Service Boards
Virginia Municipal League

Older Dominion Partnership – Historic Triangle Oversample Report November 2011
iii
Older Dominion Partnership
2011 VIRGINIA AGE READY INDICATORS BENCHMARK SURVEY Historic Triangle Oversample Report
TABLE OF CONTENTS
I. Introduction .............................................................................................................. 8 A. Background & Study Purpose ..................................................................................................... 8
B. Objectives.................................................................................................................................... 8
C. Methodology ............................................................................................................................... 9
D. Key Findings from the Statewide Report .................................................................................. 10
II. Historic Triangle Collaborative Respondent Profile ............................................... 11 III. Quality of Life ......................................................................................................... 14
A. Individual Quality of Life ........................................................................................................... 14
B. Drivers of Individual Quality of Life ........................................................................................... 16
C. Perceived Quality of Life of Others in the Community ............................................................. 17
IV. Preparedness for the Future .................................................................................. 19 A. Individual Preparedness for the Future .................................................................................... 19
B. Community Preparedness for the Future ................................................................................. 20
V. Civic & Community Engagement ............................................................................ 23 A. Volunteering ............................................................................................................................. 23
B. Availability of Recreational Activities ........................................................................................ 23
C. Socialization & Loneliness ......................................................................................................... 24
VI. Health & Well-Being ............................................................................................... 26 A. Quality of Health ....................................................................................................................... 26
B. Dental Health ............................................................................................................................ 27
C. Nutrition & Exercise .................................................................................................................. 28
D. Healthcare Access ..................................................................................................................... 29
E. Routine/Preventative Healthcare ............................................................................................. 30
F. Medications .............................................................................................................................. 32
G. Caregiving .................................................................................................................................. 33
VII. Finances .................................................................................................................. 34 A. Income ...................................................................................................................................... 34
B. Assets ........................................................................................................................................ 36
C. Financial Assistance .................................................................................................................. 36
D. Financial Preparation for Retirement ....................................................................................... 38

Older Dominion Partnership – Historic Triangle Oversample Report November 2011
iv
VIII. Housing ................................................................................................................... 39 A. Current Home ........................................................................................................................... 39
B. Safety ........................................................................................................................................ 41
IX. Workforce ............................................................................................................... 42 X. Transportation & Mobility ...................................................................................... 44 XI. Area Agency on Aging ............................................................................................. 46 XII. Conclusions ............................................................................................................. 47

Older Dominion Partnership – Historic Triangle Oversample Report November 2011
5
LIST OF TABLES
Table 1: Respondent Race .................................................................................................................... 12
Table 2: Others Living in Household with Respondent ........................................................................ 12
Table 3: Children ................................................................................................................................... 13
Table 4: Grandchildren Living with Respondent .................................................................................. 13
Table 5: Comparison of Individual Satisfaction Measures to Statewide Data ..................................... 16
Table 6: Activity Availability and Participation ..................................................................................... 24
Table 7: Quality of Health Factors ........................................................................................................ 27
Table 8: Preventative Screening Frequency ......................................................................................... 31
Table 9: Respondents Needing and Receiving Assistance.................................................................... 33
Table 10: Feelings of Safety .................................................................................................................. 41

Older Dominion Partnership – Historic Triangle Oversample Report November 2011
6
LIST OF FIGURES
Figure 1: County of Residence .............................................................................................................. 11
Figure 2: Respondent Education .......................................................................................................... 11
Figure 3: Respondent Marital Status .................................................................................................... 12
Figure 4: Individual Quality of Life ........................................................................................................ 14
Figure 5: Respondent Satisfaction, 50-64 ............................................................................................. 15
Figure 6: Respondent Satisfaction, 65+ ................................................................................................ 15
Figure 7: Drivers of Individual Quality of Life ....................................................................................... 17
Figure 8: Perceived Quality of Life - Seniors ......................................................................................... 17
Figure 9: Perceived Quality of Life - Adults .......................................................................................... 18
Figure 10: Perceived Quality of Life - Children ..................................................................................... 18
Figure 11: Preparedness for the Future ............................................................................................... 19
Figure 12: Drivers of Feelings of Individual Preparedness for Aging .................................................... 20
Figure 13: Community Preparedness for the Future............................................................................ 21
Figure 14: Driver of Feelings of Community Preparedness for Aging .................................................. 22
Figure 15: Volunteering in the Community .......................................................................................... 23
Figure 16: Frequency of Socializing with Others .................................................................................. 25
Figure 17: Feelings of Loneliness .......................................................................................................... 25
Figure 18: Overall Health Rating ........................................................................................................... 26
Figure 19: Length of Time Since Last Dental Visit ................................................................................ 28
Figure 20: Perception of Eating a Nutritious Diet ................................................................................ 28
Figure 21: Participation in Physical Activity or Exercise in Past Month ............................................... 29
Figure 22: Healthcare Insurance & Access ........................................................................................... 30
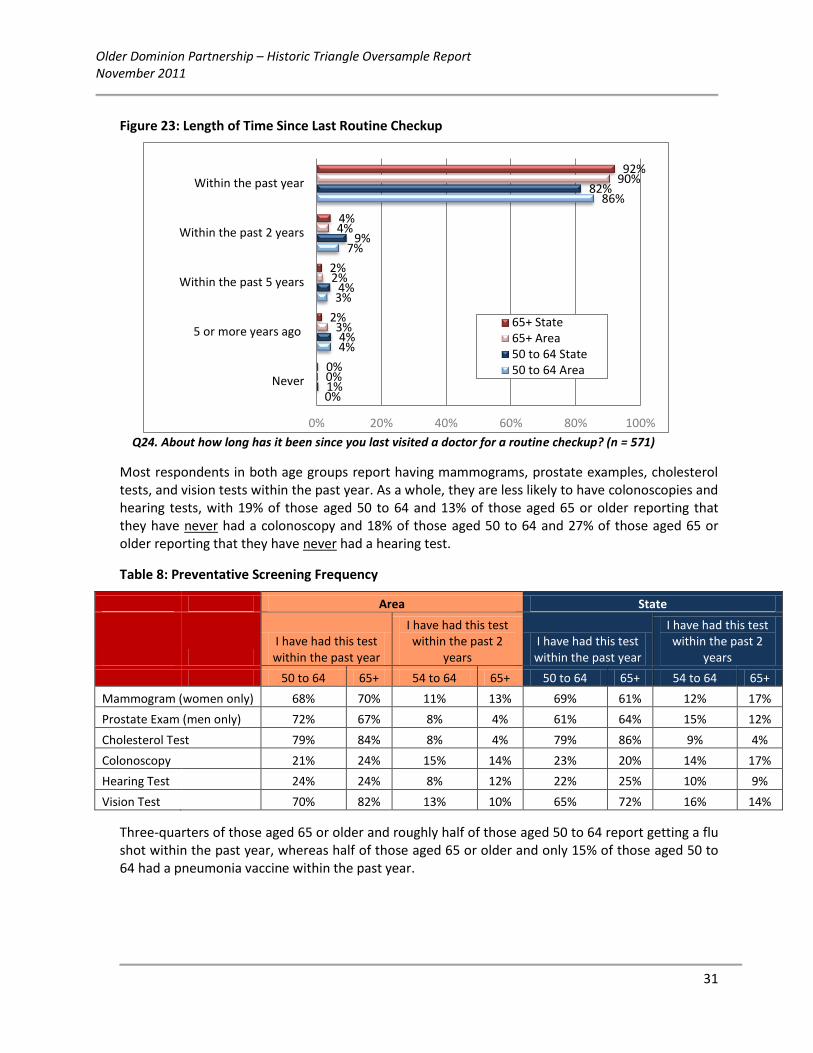
Figure 23: Length of Time Since Last Routine Checkup ........................................................................ 31
Figure 24: Vaccinations Within the Past Year ...................................................................................... 32
Figure 25: Medication Taken Daily ....................................................................................................... 32
Figure 26: Affordability of Medication ................................................................................................. 33
Figure 27: Household Income............................................................................................................... 34
Figure 28: Income Sources ................................................................................................................... 35
Figure 29: Household Assets (Not Including Home) ............................................................................. 36
Figure 30: Public Assistance ................................................................................................................. 37

Older Dominion Partnership – Historic Triangle Oversample Report November 2011
7
Figure 31: Perceived Need for Financial Assistance ............................................................................. 37
Figure 32: Preparedness for Retirement .............................................................................................. 38
Figure 33: Housing Type ....................................................................................................................... 39
Figure 34: Home Ownership ................................................................................................................. 40
Figure 35: Housing Affordability ........................................................................................................... 40
Figure 36: Employment Status ............................................................................................................. 42
Figure 37: Workforce Re-entry ............................................................................................................. 43
Figure 38: Age Discrimination at Work ................................................................................................ 43
Figure 39: Available Transportation Options ....................................................................................... 44
Figure 40: Licensed Drivers................................................................................................................... 45
Figure 41: Availability of Transportation .............................................................................................. 45
Figure 42: Familiarity with Local Agency on Aging ............................................................................... 46

Older Dominion Partnership – Historic Triangle Oversample Report November 2011
8
Older Dominion Partnership
2011 VIRGINIA AGE READY INDICATORS BENCHMARK SURVEY Historic Triangle Oversample Report
I. Introduction
A. Background & Study Purpose
Right now there are about 900,000 people over the age of 65 living in Virginia and this number is expected to double to 1.8 million by 2030. This means that about 20% of the population of Virginia will be over age 65. Very little solid and current data exists today on the status of Virginia’s senior population. Relevant and meaningful information on older Virginians is neither comprehensive nor readily accessible. For example, the last detailed statewide survey of older Virginians was the 2000 Statewide Survey of Older Virginians, conducted by the Virginia Office on Aging. The Behavioral Risk Factor Surveillance System of the Virginia Department of Health and the CDC contains only two questions on caregiving to a person over age 65. The U.S. Census 2010 offers even less information. As such, in preparation for the doubling of Virginia’s senior population, the Older Dominion Partnership (ODP) has compiled the most comprehensive array of information and insights on the Commonwealth’s older residents. This includes both primary and secondary research coordinated by the ODP’s Shared Database Workgroup, led by Dr. Richard Lindsay. As the primary effort of this initiative, the ODP conducted the 2011 Virginia Age Ready Indicators Benchmark Survey – a major statewide initiative. As part of this initiative, the Historic Triangle Collaborative, with support from the Williamsburg Community Health Foundation, contracted with the Older Dominion Partnership to conduct an oversampling of residents of the Historic Triangle. This report compares the findings from the Historic Triangle to overall statewide results of the Older Dominion Partnership 2011 Virginia Age Ready Indicators Benchmark Survey. Please Note: the Historic Triangle includes James City County, York County and the City of Williamsburg. In the Figures/Graphs throughout the report, the term “Area,” refers to these 3 localities.
B. Objectives
The overall purpose of this research survey is to obtain baseline data on the status of Virginia’s population aged 65 and older and Baby Boomers. The survey is designed to be a periodic tracking study, repeated every three years. By including Baby Boomers in the initial benchmark wave, this survey will provide a means to track aging Baby Boomers’ transition into the senior years and monitor changes to their overall quality of life across key indicators.

Older Dominion Partnership – Historic Triangle Oversample Report November 2011
9
The specific objectives of this study are as follows:
Understand Virginia’s current senior population (aged 65 and older) and Baby Boomers in terms of their personal state of aging and aging preparedness, as well as that of their community and employer, if applicable.
Gather data on key indicators among Virginia’s senior population and Baby Boomers that have been identified by the ODP Shared Database Work Group as having the most importance and relevance to Virginia’s age wave preparedness:
o Caregiving
o Civic & community engagement
o Finances
o Health & well-being
o Housing
o Transportation & mobility
o Workforce
Where possible, compare findings to the 2000 Statewide Study of Older Virginians.
Capture relevant and necessary demographic information.
C. Methodology for the Statewide Report and the Historic Triangle Report
The main methodology of the 2011 Virginia Age Ready Indicators Benchmark Survey follows an outbound telephone approach. Five thousand outbound telephone interviews were conducted using an approximately 30-minute base questionnaire. The questionnaire was developed and approved by the ODP’s Shared Database Workgroup of experts on aging. The questionnaire was carefully vetted with this group and went through multiple different iterations before being finalized. Interviews were conducted throughout July and August 2011. Sample was based on directory listed residential addresses compiled from telephone directories with a variety of secondary source records such as birth records, voter registration, real estate transactions, multiple credit sources, motor vehicle records, etc. Completed interviews were equally divided among 25 different Area Agencies on Aging (AAAs) such that there were 200 completed interviews – 100 aged 50 to 64 and 100 aged 65 or older – in each of the different AAAs. As part of this initiative, the Historic Triangle Collaborative, with support from the Williamsburg Community Health Foundation, contracted with the Older Dominion Partnership to conduct an oversampling of 500 additional residents of the Historic Triangle. Added together with the 71 residents of the Historic Triangle who were surveyed as part of the Peninsula Agency on Aging area, there are 571 total completed surveys in the Historic Triangle oversample dataset.

Older Dominion Partnership – Historic Triangle Oversample Report November 2011
10
Throughout this report, statewide results are weighted by AAA, income, gender, and education. Historic Triangle results are weighted by locality, income, gender, and education.
D. Key Findings from the Statewide Report
Key Highlights from the Statewide Report include:
Older Virginians report a high quality of life and feel their quality of life is higher than others in the community. They are most satisfied with their relationships and least satisfied with their personal financial situation.
Health and current job are the key drivers of perceived quality of life among those aged 65 and older, whereas current financial situation and health are the key drivers among those aged 50 to 64.
Individuals feel they are more prepared than their communities are for the age wave. Individual financial situation drives both feelings of individual and community preparedness. Availability of health care, educational opportunities and recreational opportunities are key community preparedness drivers.
Levels of volunteering and other community engagement are high. Participation in activities is tied to reduced levels of loneliness.
Older Virginians report being relatively healthy; however, there are a substantial number who have chronic conditions, are not having recommended health screening tests, or are taking some sort of medication on a daily basis.
About half of those aged 50 to 64 and a third of those 65+ do not feel prepared for retirement. Feelings of preparedness for retirement are highly connected with income and assets. For both age groups, a noteworthy proportion of respondents feel they could use additional assistance.
About 10% of respondents report they have to make major sacrifices to be able to afford their current home.
Many of those who are currently working report they have left and re-entered the workforce.
Older Virginians rely heavily on their cars for their transportation needs, and reliance on personal cars may present problems as they age. One in twenty respondents already feels they need more transportation than they currently have.
On average, about six in ten respondents are aware of their local agency on aging, but there is significant variation in awareness among the various areas.
For a complete copy of the statewide report or for more information regarding the Older Dominion Partnership, please contact: David Ross, Executive Director, Older Dominion Partnership at [email protected] or 804-559-0147.

Older Dominion Partnership – Historic Triangle Oversample Report November 2011
11
II. Historic Triangle Respondent Profile
Overall, the age range of respondents in the Historic Triangle is 50 to 99 years old, with an average age of 67. Throughout this report, respondents are broken down into two groups, those aged 50 to 64 and those aged 65 and older, with average ages of 58 and 75 respectively.
Results in this oversample report are weighted by locality (i.e., county or city), gender, income, and education to match the overall population of the Historic Triangle catchment area as closely as possible.
The sample for the Historic Triangle thus includes more respondents from York County and James City County than from the City of Williamsburg.
Figure 1: County of Residence
Q14. In what county or city do you live? (n = 571)
Gender is roughly equal between males and females, with slightly more of those aged 65 or older being female (as is the case in the population as a whole).
As a whole, those in the Historic Triangle catchment area are highly educated. Almost half have a college degree or higher.
Figure 2: Respondent Education
Q14. What is the highest level of education you have completed? (n = 571)
49%
5%
46%
57%
9%
34%
0% 20% 40% 60% 80% 100%
James City County
City of Williamsburg
York County
65+ Area
50 to 64 Area
9%
21%
4%
20%
24%
22%
4%
17%
7%
19%
27%
26%
0% 20% 40% 60% 80% 100%
Some high school or less
Completed high school/GED
Trade/technical school
Some college
Completed college
Graduate or professional degree
65+ Area
50 to 64 Area

Older Dominion Partnership – Historic Triangle Oversample Report November 2011
12
The majority of respondents are Caucasian and those aged 65 or older are slightly more likely to be Caucasian than those aged 50 to 64. The majority of those who are not Caucasian report that they are African American.
Table 1: Respondent Race
50 to 64 65+
White, Non-Hispanic 80% 87%
African-American 12% 12%
Asian 3% 1%
Hispanic 3% 0%
Native American 1% 1%
Other 4% 1%
The majority of respondents are either married or living with someone. As could be expected, those aged 65 or older are much more likely to be widowed than those aged 50 to 64.
Figure 3: Respondent Marital Status
Q57. What is your current marital status? (n = 571)
Approximately 10% of those aged 50 to 64 report living alone, whereas 28% of those aged 65 or older do. Respondents who report living with another individual most frequently report living with a spouse. Living with children is the next most prevalent living situation.
Table 2: Others Living in Household with Respondent
50 to 64 65+
Spouse 77% 63%
Children 33% 8%
Grandchildren 6% 5%
Parents 3% 1%
Siblings 1% 0%
Other 4% 1%
Alone 10% 28%
7%
8%
4%
81%
2%
6%
27%
65%
0% 20% 40% 60% 80% 100%
Single, Never married
Not currently married - divorced or separated
Not currently married - widowed
Married or living with someone
65+ Area
50 to 64 Area

Older Dominion Partnership – Historic Triangle Oversample Report November 2011
13
Most respondents report having children. Not surprisingly, those aged 50 to 64 are more likely to have children under the age of 18 and to have children who currently live with them.
Table 3: Children
50 to 64 65+
Have children 18 or older who do not live with me 56% 84%
Have children 18 or older who live with me 23% 8%
Have children under 18 who live with me 14% 1%
Have children under 18 who do not live with me 10% 5%
Do not have children 15% 5%
Eight in ten respondents aged 65 or older report having grandchildren, as compared to almost half of those aged 50 to 64. Not surprisingly, very few of those aged 50 to 64 have grandchildren who are 18 years of age or older. Table 4: Grandchildren Living with Respondent
50 to 64 65+
Have grandchildren under 18 who live with me 5% 4%
Have grandchildren under 18 who do not live with me 38% 56%
Have grandchildren 18 or older who live with me 3% 2%
Have grandchildren 18 or older who do not live with me 6% 50%
Do not have grandchildren 54% 20%

Older Dominion Partnership – Historic Triangle Oversample Report November 2011
14
III. Quality of Life
Those living in the Historic Triangle report a higher quality of life than do those in Virginia as a whole. Health and current home are the two biggest drivers of quality of life ratings.
A. Individual Quality of Life
Overall, those living in the Historic Triangle report a very high quality of life. In fact, more than half in both age groups rate their quality of life as “excellent.” Additionally, many of those who do not rate their quality of life as “excellent” give it a “4” on a scale where 1 means poor and 5 means excellent. In total, 85% of those aged 50 to 64 and 89% of those aged 65 or older rate their quality of life a 4 or 5. Furthermore, respondents in the Historic Triangle area rate their quality of life much higher than the statewide average. Not surprisingly, individual quality of life ratings are highly correlated with income and ratings of perceived health.
Figure 4: Individual Quality of Life
Q4a. Overall, how would you rate your quality of life? (n = 571)
Respondents were also asked to rate their satisfaction with individual elements that may impact quality of life. Satisfaction ratings were very similar across the two age groups. Both groups gave the highest satisfaction ratings for relationships with friends and family, safety and security, and their current home and the lowest ratings for their health, recreational opportunities, and their current financial situation.
55%
30%
11%
4%
1%
40%
37%
17%
4%
2%
59%
30%
8%
1%
1%
44%
34%
16%
3%
3%
0% 20% 40% 60% 80% 100%
5 - Excellent
4
3
2
1 - Poor
65+ State
65+ Area
50 to 64 State
50 to 64 Area

Older Dominion Partnership – Historic Triangle Oversample Report November 2011
15
Figure 5: Respondent Satisfaction, 50-64
Q7a-k. How satisfied are you with each of the following? (n = 571)
Figure 6: Respondent Satisfaction, 65+
Q7a-k. How satisfied are you with each of the following? (n = 571)
36%
33%
37%
35%
31%
38%
35%
22%
28%
34%
29%
23%
34%
38%
41%
50%
43%
47%
64%
59%
56%
64%
59%
67%
75%
76%
80%
81%
82%
86%
87%
90%
93%
0% 20% 40% 60% 80% 100%
Your current personal financial situation
Recreational activities
Your health
Availability of healthcare services
Opportunities to Volunteer
Educational opportunities
Your current job (Only those who work)
Your ability to get around
Your current home
Your safety and security
Relationships with friends and family
Satisfied Very Satisfied
38%
28%
41%
27%
21%
25%
19%
20%
26%
27%
17%
30%
45%
33%
58%
63%
60%
62%
68%
67%
65%
78%
67%
73%
73%
85%
84%
84%
81%
89%
93%
92%
96%
0% 20% 40% 60% 80% 100%
Your current personal financial situation
Recreational activities
Your health
Availability of healthcare services
Opportunities to Volunteer
Educational opportunities
Your current job (Only those who work)
Your ability to get around
Your current home
Your safety and security
Relationships with friends and family
Satisfied Very Satisfied

Older Dominion Partnership – Historic Triangle Oversample Report November 2011
16
Across the board, satisfaction with individual elements is higher than statewide averages for satisfaction. Those living in York County, however, are slightly less likely than those in James City County and the City of Williamsburg to perceive that they have educational and recreational opportunities available to them. Table 5: Comparison of Individual Satisfaction Measures to Statewide Data
Area State
50 to 64 65+ 50 to 64 65+
Relationships with friends and family 93% 96% 88% 93%
Your current home 87% 93% 85% 90%
Your safety and security 90% 92% 82% 88%
Your ability to get around 86% 89% 83% 84%
Availability of healthcare services 76% 85% 70% 76%
Educational opportunities 81% 84% 71% 73%
Opportunities to Volunteer 80% 84% 73% 73%
Your current job (Only those who work) 82% 81% 73% 80%
Your health 75% 73% 68% 67%
Recreational activities 67% 73% 56% 60%
Your current personal financial situation 59% 67% 55% 61%
B. Drivers of Individual Quality of Life
Statistical regression analysis models data to explore and identify linkages between how respondents rate overall measures and how they rate specific performance variables. This process looks for relationships or predictors where ratings on specific attributes positively or negatively impact the overall rating. In other words, regression analysis can be used to determine what is driving overall quality of life ratings. Due to sample size, the 50 to 64 age group and the 65+ age group were merged together for the regression analysis. Potential drivers of overall quality of life measured in this survey include the following:
Opportunities to volunteer in one’s community
Recreational activities available in one’s community
Relationships with friends and family
Educational opportunities available in one’s community
Current job
Current personal financial situation
Health
Availability of the healthcare services one needs in one’s community
Current home
Safety and security
Ability to get around one’s community

Older Dominion Partnership – Historic Triangle Oversample Report November 2011
17
Regression analysis indicates that state of health and current home are the two biggest drivers of individual quality of life ratings. Recreational opportunities and safety and security are smaller, yet still statistically significant drivers of individual quality of life.
Figure 7: Drivers of Individual Quality of Life
**The R-squared of the model is .371, demonstrating that the model explains approximately 37% of the variance in quality of life. The above model shows coefficients that are significant at the 90% confidence level.
C. Perceived Quality of Life of Others in the Community
In general, respondents in the Historic Triangle in both groups are more likely than the statewide average to rate quality of life for seniors highly. Figure 8: Perceived Quality of Life - Seniors
Q4b. Overall, how would you rate the quality of life of seniors aged 65 or older in your community in general? (n = 571)
12%
26%
36%
22%
4%
1%
16%
12%
34%
29%
6%
3%
13%
26%
45%
12%
2%
1%
13%
20%
36%
25%
4%
2%
0% 20% 40% 60% 80% 100%
Unsure
5 - Excellent
4
3
2
1 - Poor
65+ State
65+ Area
50 to 64 State
50 to 64 Area

Older Dominion Partnership – Historic Triangle Oversample Report November 2011
18
Historic Triangle respondents’ ratings for quality of life among adults, however, are on par with the statewide average.
Figure 9: Perceived Quality of Life - Adults
Q4c. Overall, how would you rate the quality of life of adults aged 18-64 in your community in general? (n = 571)
Those aged 50 to 64 in the Historic Triangle rate the quality of life of children in their community higher than do those in the state in general, yet there is no significant difference between the ratings of those aged 65 or older and the statewide average.
Figure 10: Perceived Quality of Life - Children
Q4d. Overall, how would you rate the quality of life of children under 18 in your community in general? (n = 571)
8%
21%
45%
25%
1%
0%
8%
14%
40%
30%
6%
1%
25%
17%
38%
16%
3%
0%
22%
17%
34%
20%
5%
2%
0% 20% 40% 60% 80% 100%
Unsure
5 - Excellent
4
3
2
1 - Poor
65+ State65+ Area50 to 64 State50 to 64 Area
12%
31%
33%
17%
4%
2%
11%
22%
37%
22%
6%
2%
32%
22%
29%
10%
5%
2%
27%
21%
26%
18%
6%
2%
0% 20% 40% 60% 80% 100%
Unsure
5 - Excellent
4
3
2
1 - Poor
65+ State65+ Area50 to 64 State50 to 64 Area

Older Dominion Partnership – Historic Triangle Oversample Report November 2011
19
IV. Preparedness for the Future
Those living in the Historic Triangle feel as though they are more prepared to navigate the challenges of aging than are their communities. Current personal financial situation is the key driver of both individual and community preparedness.
A. Individual Preparedness for the Future
As with the statewide findings, those aged 50 to 64 feel less prepared to navigate the challenges of aging than do those aged 65 or older. Historic Triangle respondents who are aged 65 or older are slightly more likely than the statewide average to feel as though they are “very prepared.”
Figure 11: Preparedness for the Future
Q5. How well prepared do you feel to navigate the challenges of aging yourself? (n = 571)
Not surprisingly, feelings of individual preparedness for navigating the challenges of aging are highly correlated with income and ratings of individual health. As with ratings of individual quality of life, regression analysis can be used to understand the drivers of feelings of individual preparedness for aging. The regression analysis demonstrates that current
24%
30%
32%
11%
3%
21%
33%
27%
12%
8%
43%
31%
17%
4%
4%
34%
34%
22%
6%
4%
0% 20% 40% 60% 80% 100%
5 - Very prepared
4
3
2
1 - Not at all Prepared
65+ State
65+ Area
50 to 64 State
50 to 64 Area

Older Dominion Partnership – Historic Triangle Oversample Report November 2011
20
personal financial situation is the key driver of feelings of individual preparedness. Current home, volunteer opportunities, and current job are also significant, yet smaller, drivers.
Figure 12: Drivers of Feelings of Individual Preparedness for Aging
**The R-squared of the model is .439, demonstrating that the model explains approximately 44% of the variance in quality of life. The above model shows coefficients that are significant at the 90% confidence level.
B. Community Preparedness for the Future
Respondents are less likely to feel as though their community is prepared for meeting the needs and lifestyles of a substantially older population than they are in their own abilities to navigate the challenges of aging. Only 20% of Historic Triangle respondents aged 65 or older and 11% of those aged 50 to 64 feel as though their community is “very prepared.” Those in the Historic Triangle, however, may be very slightly more likely than the statewide average to feel as though their community is prepared. For example, 52% of those aged 65 or older in the Historic Triangle rate their community’s preparedness a 4 or 5 on a scale where 1 means not at all prepared and 5 means very prepared, as compared to 42% on a statewide basis. Likewise, 47% of those aged 50 to 64 in the Historic Triangle rate their community’s preparedness a 4 or 5, as compared to just 24% of the state as a whole.

Older Dominion Partnership – Historic Triangle Oversample Report November 2011
21
Figure 13: Community Preparedness for the Future
Q6. How well prepared is your community for meeting the needs and lifestyles of a substantially older population? (n = 571)
Overall, those in York County are slightly less likely than those in James City County and the City of Williamsburg to feel as though their community is prepared for meeting the needs and lifestyles of a substantially older population. Collapsing across both age groups, 43% of those in York County rate their community’s preparedness a 4 or 5, whereas 62% of those in James City County and 56% of those in the City of Williamsburg give this rating.
As with feelings of individual preparedness for aging, current personal financial situation is the key driver of feelings of community preparedness. Volunteer opportunities, relationships with friends and family, and current home are also significant drivers.
8%
11%
36%
31%
12%
3%
9%
7%
17%
41%
18%
8%
9%
20%
32%
25%
7%
6%
12%
14%
28%
30%
10%
6%
0% 20% 40% 60% 80% 100%
Unsure
5 - Very Prepared
4
3
2
1 - Not at all Prepared
65+ State
65+ Area
50 to 64 State
50 to 64 Area

Older Dominion Partnership – Historic Triangle Oversample Report November 2011
22
Figure 14: Driver of Feelings of Community Preparedness for Aging
**The R-squared of the model is .309, demonstrating that the model explains approximately 31% of the variance in quality of life. The above model shows coefficients that are significant at the 90% confidence level.

Older Dominion Partnership – Historic Triangle Oversample Report November 2011
23
V. Civic & Community Engagement
Levels of volunteering and participating in recreational activities are high. Whereas very few respondents report feeling lonely frequently, almost a fifth say that they sometimes do.
A. Volunteering
Similarly to the state as a whole, many in the Historic Triangle are active volunteers. About half of both age groups report volunteering their time in support of an organization or cause within the past three months.
Figure 15: Volunteering in the Community
Q8. When was the last time you volunteered your time in support of an organization or cause? (n = 571)
B. Availability of Recreational Activities
Both age groups report their communities offer a number of recreational activities and many currently participate in these activities. Over half of both age groups have participated in dining out and gardening in the past year. There is also significant participation in walking for exercise and religious groups or church. Those living in the Historic Triangle are more likely than the statewide average to report the availability of live theater, book clubs, art, and bridge clubs. Furthermore, both groups are more likely than the statewide average to have participated in live sporting events, live theater events,
8%
20%
5%
9%
7%
6%
17%
29%
9%
18%
5%
10%
8%
8%
13%
28%
11%
28%
2%
10%
2%
1%
13%
32%
13%
28%
4%
9%
4%
5%
12%
24%
0% 20% 40% 60% 80% 100%
Never
More than 2 years ago
Within the last 2 years
Within the last year
Within the last 6 months
Within the last 3 months
Within the last month
Within the last week
65+ State65+ Area50 to 64 State50 to 64 Area

Older Dominion Partnership – Historic Triangle Oversample Report November 2011
24
going to the movies, book clubs, and art. They are less likely to have participated in dining out, walking for exercise, religious groups, and attending live music events. Table 6: Activity Availability and Participation
Area State
Activity Available in the
Community
Available and have
participated in the past 12
months
Activity Available in the
Community
Available and have
participated in the past 12
months
50 to 64 65+ 50 to 64 65+ 50 to 64 65+ 50 to
64 65+
Dining out 96% 98% 65% 71% 99% 98% 91% 85%
Walking for exercise 95% 89% 57% 48% 99% 97% 81% 71%
Religious group/church 93% 91% 56% 38% 98% 98% 67% 69%
Gardening 95% 91% 66% 57% 91% 88% 60% 51%
Other forms of exercise 89% 93% 42% 49% 92% 88% 59% 48%
Attending a live music event 91% 90% 37% 14% 90% 88% 51% 41%
Going to the movies 99% 99% 91% 90% 92% 90% 56% 37%
Attending a live sporting event 97% 93% 69% 50% 91% 89% 42% 29%
Attending a live theater event 98% 98% 83% 69% 83% 80% 35% 29%
Art 97% 93% 73% 56% 75% 72% 24% 18%
Educational classes or courses 74% 78% 8% 17% 91% 83% 24% 14%
Bicycling 81% 88% 29% 31% 89% 82% 27% 12%
Book club 87% 90% 25% 25% 69% 68% 10% 12%
Bridge club 59% 69% 4% 13% 49% 59% 3% 6%
C. Socialization & Loneliness
As with the statewide averages, the majority of those in the Historic Triangle report spending time socializing with family and friends that do not live with them either every day or several times a week.

Older Dominion Partnership – Historic Triangle Oversample Report November 2011
25
Figure 16: Frequency of Socializing with Others
Q12. How frequently do you spend time socializing with friends or family who do not live with you? (n = 571)
Whereas very few respondents report feeling lonely frequently, almost a fifth say that they sometimes do. This level of loneliness is roughly on par with the statewide average. Figure 17: Feelings of Loneliness
Q13. Do you find yourself feeling lonely quite often, sometimes, or almost never? (n = 571)
21%
33%
27%
12%
5%
1%
0%
0%
16%
39%
19%
14%
7%
4%
0%
1%
22%
48%
11%
12%
5%
2%
0%
0%
22%
40%
18%
10%
5%
4%
1%
1%
0% 20% 40% 60% 80% 100%
Every day
A few times a week
Once a week
A few times a month
Once a month
A few times a year
Less than once a year
Never
65+ State
65+ Area
50 to 64 State
50 to 64 Area
2%
18%
80%
4%
20%
76%
3%
17%
80%
5%
21%
74%
0% 20% 40% 60% 80% 100%
Quite often
Sometimes
Almost never
65+ State65+ Area50 to 64 State50 to 64 Area

Older Dominion Partnership – Historic Triangle Oversample Report November 2011
26
VI. Health & Well-Being
On average, those in the Historic Triangle rate their health slightly more positively than do those in Virginia as a whole. Like Virginia as a whole, however, there are still many with chronic conditions and some who report not receiving recommended screenings and visiting doctors and dentists on a regular basis.
A. Quality of Health Overall, respondents rate their health quite positively. More than half of those aged 50 to 64 in the Historic Triangle rate their health as “very good” or “excellent.” On average, those in both age groups in the Historic Triangle rate their health more positively than do those in Virginia as a whole. For example, 55% of those aged 65 or older in the Historic Triangle rate their health as very good or excellent, as compared to only 43% of their statewide counterparts. Likewise, 65% of those aged 50 to 64 in the Historic Triangle rate their health as very good or excellent, as compared to 49% statewide.
Figure 18: Overall Health Rating
Q22. Would you say that in general your health is: (n = 571)
Those with high incomes are much more likely than those with lower incomes to rate their health as excellent or very good. Respondents report a variety of health problems, with 23% of those aged 50 to 64 and 32% of those aged 65 or older in the Historic Triangle indicating that they are limited in some activities because of physical, mental, or emotional problems. Despite giving more positive ratings to their health than the statewide average, reports on limitations, illnesses, hospitalization, and mental health are similar between the Historic Triangle and the statewide average.
29%
36%
23%
9%
4%
19%
30%
29%
15%
6%
20%
35%
28%
13%
5%
14%
29%
30%
20%
7%
0% 20% 40% 60% 80% 100%
Excellent
Very good
Good
Fair
Poor
65+ State65+ Area50 to 64 State50 to 64 Area

Older Dominion Partnership – Historic Triangle Oversample Report November 2011
27
Table 7: Quality of Health Factors
50 to 64 65+
23% 32% 33% 40%
8% 19% 10% 22%
5% 6% 7% 10%
23% 41% 33% 46%
4% 14% 5% 13%
4% 11% 4% 9%
1% 1% 1% 2%
26% 33% 28% 37%
15% 32% 21% 34%
53% 53% 53% 53%
7% 5% 15% 10%
3% 4% 9% 4%
I have been admitted to the hospital in the past two years
I have visited a doctor (other than the emergency room) for
an injury or illness within the past two years
Mental HealthI have a nervous, emotional, or psychiatric problem, such as
depression, post-traumatic stress disorder, anxiety disorder,
etc.
I have gone to the emergency room in the past two years
Quality of Health Factors
Area State
Limitations 50 to 64 65+
I am limited in some activities because of physical, mental,
or emotional problems
I have a health problem that requires me to use special
equipment such as a cane, a wheelchair, a special bed, or a
special telephone
I have difficulty with some activities of daily living such as
bathing or showering, dressing, eating, getting in or out of
bed or chairs, etc.
I have received treatment or counseling for personal or
family problems or for nervous, emotional, or psychiatric
problems in the past six months
Illnesses
I currently have a chronic illness, such as diabetes, arthritis,
cancer, etc.
I have had a heart attack
I have had a stroke
I have Alzheimer’s disease, dementia, or another memory
disorder
Hospitalization
B. Dental Health
On average, Historic Triangle residents are very slightly more likely than the statewide average to have visited the dentist within the past year. This difference is more pronounced within those aged 65 or older than within those aged 50 to 64.

Older Dominion Partnership – Historic Triangle Oversample Report November 2011
28
Figure 19: Length of Time Since Last Dental Visit
Q32. How long has it been since you last visited a dentist or a dental clinic for any reason? (n = 571)
Of those who have not gone to the dentist within the past year, most say that it’s because they did not have a need to go, yet 20% of those aged 65 or older and 35% of those aged 50 to 64 or older say that the reason is cost.
C. Nutrition & Exercise
Overall, both age groups report eating a nutritious diet.
Figure 20: Perception of Eating a Nutritious Diet
Q35. In general, do you feel that you have a nutritious diet? (n = 571)
65%
9%
8%
15%
2%
1%
75%
9%
6%
10%
0%
0%
77%
9%
6%
8%
1%
0%
82%
8%
8%
2%
0%
0%
0% 20% 40% 60% 80% 100%
Within the past year
Within the past 2 years
Within the past 5 years
5 or more years ago
Don’t know/Not Sure
Never
65+ State
65+ Area
50 to 64 State
50 to 64 Area
84%
7%
9%
91%
3%
5%
82%
9%
9%
85%
8%
7%
0% 20% 40% 60% 80% 100%
Yes
Sometimes yes / sometimes no
No
65+ State
65+ Area
50 to 64 State
50 to 64 Area

Older Dominion Partnership – Historic Triangle Oversample Report November 2011
29
Whereas few (2% of those aged 65 or older and 3% of those aged 50 to 64) say that they often cannot afford to eat balanced meals, 5% of those aged 65 or older and 10% of those aged 50 to 64 say that is sometimes the case. Likewise, 1% of those aged 65 or older say that it is often true that the food they bought doesn’t last and they do not have money to buy more and 7% say that is sometimes true, whereas 4% of those aged 50 to 64 say that is often true and 10% say that it is sometimes true.
Over three-quarters of respondents in the Historic Triangle report participating in physical activity or exercise within the past month. This percentage is very slightly higher than the national average.
Figure 21: Participation in Physical Activity or Exercise in Past Month
Q36. During the past month, other than your regular job, did you participate in any physical activities or exercises such as running, calisthenics, golf, gardening, or walking for exercise? (n = 571)
D. Healthcare Access
The majority of respondents in both groups report having health coverage. As would be expected, almost all respondents aged 65 or older report having Medicare. Additionally, about nine in ten respondents in both groups report having health insurance. About three-quarters also have life insurance. Prevalence of health care coverage does not vary substantially between the Historic Triangle and the state as a whole.
71%
29%
76%
24%
83%
17%
88%
12%
0% 20% 40% 60% 80% 100%
Yes
No
65+ State
65+ Area
50 to 64 State
50 to 64 Area

Older Dominion Partnership – Historic Triangle Oversample Report November 2011
30
Figure 22: Healthcare Insurance & Access
Q21. Which of the following do you have? Please select all that apply. (n = 571)
Ninety-five percent of those aged 65 or older and 91% of those aged 50 to 64 report that they have a person who they think of as their primary care physician. These percentages are on par with the statewide averages.
E. Routine/Preventative Healthcare
In addition to having a primary care physician, a large number of respondents in both age groups report they had been to their physician for a routine checkup in the past year.
91%
85%
74%
22%
13%
8%
6%
1%
91%
91%
70%
29%
4%
13%
9%
0%
17%
88%
80%
23%
5%
29%
31%
4%
10%
92%
88%
18%
2%
30%
35%
4%
0% 20% 40% 60% 80% 100%
Medicare
Health insurance
Life insurance
Long-term care insurance
Medicaid
Long-term disability insurance
Short-term disability insurance
None of the above
65+ State
65+ Area
50 to 64 State
50 to 64 Area
Older Dominion Partnership – Historic Triangle Oversample Report November 2011
31
Figure 23: Length of Time Since Last Routine Checkup
Q24. About how long has it been since you last visited a doctor for a routine checkup? (n = 571)
Most respondents in both age groups report having mammograms, prostate examples, cholesterol tests, and vision tests within the past year. As a whole, they are less likely to have colonoscopies and hearing tests, with 19% of those aged 50 to 64 and 13% of those aged 65 or older reporting that they have never had a colonoscopy and 18% of those aged 50 to 64 and 27% of those aged 65 or older reporting that they have never had a hearing test.
Table 8: Preventative Screening Frequency
Area State
I have had this test within the past year
I have had this test within the past 2
years I have had this test within the past year
I have had this test within the past 2
years
50 to 64 65+ 54 to 64 65+ 50 to 64 65+ 54 to 64 65+
Mammogram (women only) 68% 70% 11% 13% 69% 61% 12% 17%
Prostate Exam (men only) 72% 67% 8% 4% 61% 64% 15% 12%
Cholesterol Test 79% 84% 8% 4% 79% 86% 9% 4%
Colonoscopy 21% 24% 15% 14% 23% 20% 14% 17%
Hearing Test 24% 24% 8% 12% 22% 25% 10% 9%
Vision Test 70% 82% 13% 10% 65% 72% 16% 14%
Three-quarters of those aged 65 or older and roughly half of those aged 50 to 64 report getting a flu shot within the past year, whereas half of those aged 65 or older and only 15% of those aged 50 to 64 had a pneumonia vaccine within the past year.
92%
4%
2%
2%
0%
90%
4%
2%
3%
0%
82%
9%
4%
4%
1%
86%
7%
3%
4%
0%
0% 20% 40% 60% 80% 100%
Within the past year
Within the past 2 years
Within the past 5 years
5 or more years ago
Never
65+ State65+ Area50 to 64 State50 to 64 Area

Older Dominion Partnership – Historic Triangle Oversample Report November 2011
32
Figure 24: Vaccinations Within the Past Year
Q26. Which of the following immunizations have you had within the past year? Please select all that apply. (n = 571)
F. Medications
Almost nine in ten respondents aged 65 or older and seven in ten respondents aged 50 to 64 report taking at least one medication on a daily basis.
Figure 25: Medication Taken Daily
Q29. How many medications do you take on a daily basis? (n = 571)
A very small number, however, report that it is difficult to afford them. Nine percent of those aged 65 or older and 10% of those aged 50 to 64 rate the affordability of their medication a 1 or 2 on a scale of 1 to 5 where 1 means “it is very difficult to afford them” and 5 means “it is very easy to
43%
15%
56%
44%
17%
55%
21%
54%
75%
21%
43%
76%
0% 20% 40% 60% 80% 100%
Neither
Pneumonia vaccine
Flu Shot
65+ State65+ Area50 to 64 State50 to 64 Area
1%
0%
1%
5%
13%
28%
22%
30%
4%
3%
3%
7%
14%
28%
15%
26%
4%
4%
6%
14%
24%
26%
8%
13%
5%
4%
6%
14%
25%
26%
11%
9%
0% 20% 40% 60% 80% 100%
12 or more
10 to 11
8 to 9
6 to 7
4 to 5
2 to 3
1
None
65+ State
65+ Area
50 to 64 State

Older Dominion Partnership – Historic Triangle Oversample Report November 2011
33
afford them.” Furthermore, 4% of those aged 65 or older and 5% of those aged 50 to 64 say that there are medications that they should be taking but are not because of the cost. Figure 26: Affordability of Medication
Q30. How difficult or easy is it for you to afford your medications? (n = 443)
G. Caregiving
Many respondents report that someone checks in on them on a regular basis, but very few report needing this help. Additionally, a small percentage report receiving help with their personal care and/or nursing care.
Table 9: Respondents Needing and Receiving Assistance
During the past 6
months, had someone regularly checked on
you?
Do you feel you need someone to regularly
check on you?
In the past six months, has someone helped you with your
personal care?
In the past six months, have you had any nursing
care?
Area 50 to 64 65+ 50 to 64 65+ 50 to 64 65+ 50 to 64 65+
Yes 34% 48% 3% 13% 5% 6% 5% 7%
No 56% 52% 97% 87% 95% 94% 95% 93%
State 50 to 64 65+ 50 to 64 65+ 50 to 64 65+ 50 to 64 65+
Yes 43% 61% 7% 14% 5% 6% 6% 8%
No 57% 39% 93% 86% 95% 94% 94% 92%
Additionally, 41% of those aged 50 to 64 and 29% of those aged 65 or older report providing care or assistance to a friend or family member who has a health problem, long-term illness, or disability.
5%
5%
16%
18%
57%
5%
4%
10%
14%
67%
6%
4%
17%
18%
55%
7%
3%
13%
10%
67%
0% 20% 40% 60% 80% 100%
1-It is very difficult to afford them
2
3
4
5-It is very easy to afford them
65+ State65+ Area50 to 64 State50 to 64 Area

Older Dominion Partnership – Historic Triangle Oversample Report November 2011
34
VII. Finances
Almost three-quarters of those aged 65 or older and half of those aged 50 to 64 in the Historic Triangle feel as though they are financially prepared for retirement. That said, however, there are still some – particularly those with poor health – who feel they need more financial assistance than they are currently getting.
A. Income
Overall, respondents aged 50 to 64 in the Historic Triangle report higher incomes than those aged 65 or older. Furthermore, in general, income in the Historic Triangle is higher than the statewide average income. As a reminder, data was weighted by income to match overall Census results. The following represent weighted data.
Figure 27: Household Income
Q16. Which of the following best represents your total annual household income? (n = 571)
9%
18%
14%
11%
8%
14%
7%
4%
2%
3%
3%
6%
4%
8%
9%
10%
8%
22%
11%
8%
4%
4%
4%
8%
5%
6%
7%
8%
8%
18%
13%
10%
7%
7%
7%
3%
2%
3%
5%
5%
6%
16%
14%
13%
10%
12%
9%
4%
0% 20% 40% 60% 80% 100%
Less than $10,000
$10,000 to $19,999
$20,000 to $29,999
$30,000 $39,999
$40,000 $49,999
$50,000 to $74,999
$75,000 to $99,999
$100,000 to $124,999
$125,000 to $149,999
$150,000 to $199,999
$200,000 or more
Don't know
65+ State65+ Area50 to 64 State50 to 64 Area

Older Dominion Partnership – Historic Triangle Oversample Report November 2011
35
Both groups reported receiving income from a variety of sources. The two most common sources of income reported are earnings from employment and social security. As would be expected, age plays a major role in what kind of income a respondent receives, with those aged 50 to 64 being three times as likely as those aged 65 or older to receive income from employment. Likewise, those aged 65 or older are three to four times as likely as those aged 50 to 64 to report income from Social Security. Those aged 65 or older in the Historic Triangle are significantly more likely than their peers in the state as a whole to receive income from a retirement pension from their job and income from rentals, investments, etc. Figure 28: Income Sources
Q15.Through which of the following sources do you (and your spouse or partner) receive income? Please select all that apply. (n = 571)
1%
2%
2%
6%
1%
3%
6%
3%
1%
12%
78%
49%
38%
22%
2%
2%
1%
2%
1%
1%
6%
3%
3%
9%
73%
40%
32%
29%
3%
1%
1%
1%
1%
0%
3%
3%
2%
14%
28%
56%
71%
87%
1%
0%
0%
0%
0%
0%
4%
5%
8%
11%
24%
41%
57%
84%
0% 20% 40% 60% 80% 100%
Other
Unemployment Compensation
Alimony or child support
Scholarships, stipends
Financial aid from private organizations
Welfare payments/Aid for Children
Disability payments
Assistance from family members
SSI payments
V.A. Benefits
Employment Earnings
Income from rentals, investments, etc.
Retirement pension from job
Social Security
65+ State65+ Area50 to 64 State50 to 64 Area

Older Dominion Partnership – Historic Triangle Oversample Report November 2011
36
B. Assets
In general, assets are higher among those in the Historic Triangle than in the state as a whole. Many respondents – particularly those aged 65 or older report that they have “no idea” what the total value of their assets are.
Figure 29: Household Assets (Not Including Home)
Q19. What would you say is the approximate total value of your financial assets for your entire household —not including your home? (n = 571)
C. Financial Assistance
Very few respondents in the Historic Triangle report that they currently receive some sort of public assistance, yet 8% of each of the age groups report that they feel as though they need it.
11%
12%
11%
12%
12%
9%
5%
5%
24%
6%
7%
8%
9%
17%
10%
12%
8%
23%
10%
8%
11%
16%
17%
11%
8%
4%
15%
5%
11%
5%
14%
15%
14%
14%
8%
13%
0% 20% 40% 60% 80% 100%
Less than $10,000
$10,000 - $24,999
$25,000 - $49,999
$50,000 - $99,999
$100,000 - $249,999
$250,000 - $499,999
$500,000 - $999,999
$1,000,000 or higher
No Idea
65+ State
65+ Area
50 to 64 State
50 to 64 Area

Older Dominion Partnership – Historic Triangle Oversample Report November 2011
37
Figure 30: Public Assistance
Q18. Do you currently receive some sort of public assistance, such as food stamps, energy assistance, etc.? (n = 571)
Those who rate their health poorly (i.e., those rating it “poor” or “fair”) are no more likely than those rating it average or higher to be getting public assistance, but they are much more likely to report that they feel as though they need it. Twenty-eight percent of those rating their health “poor” or “fair” say that they do not get public assistance but they feel as though they need it, as compared to 3% of those rating their health as “average” and 4% of those rating their health as “very good” or “excellent.”
Similarly to those needing public assistance, 11% of those aged 65 or older and 16% of those aged 50 to 64 report that their financial situation is such that they feel they need financial assistance or help beyond what they are already getting. These percentages, however, are slightly lower than the statewide averages.
Figure 31: Perceived Need for Financial Assistance
Q17. Is your financial situation such that you feel you need financial assistance or help beyond what you are already getting? (n = 571)
91%
8%
1%
83%
12%
5%
92%
8%
1%
83%
11%
7%
0% 20% 40% 60% 80% 100%
No, and I do not need it
No, and I feel as though I need it
Yes65+ State
65+ Area
50 to 64 State
50 to 64 Area
1%
83%
16%
1%
79%
21%
1%
88%
11%
1%
81%
17%
0% 20% 40% 60% 80% 100%
Don't know
No
Yes
65+ State65+ Area50 to 64 State50 to 64 Area

Older Dominion Partnership – Historic Triangle Oversample Report November 2011
38
Those who rate their health poorly (i.e., those rating it “poor” or “fair”) are much more likely than those rating it average or higher to report that they need financial assistance beyond that which they are already getting. In fact, 37% of those rating their health as “poor” or “fair” say that they need financial assistance, as compared to 13% of those rating their health as “average” and only 7% of those rating their health as “very good” or “excellent.”
D. Financial Preparation for Retirement
As with the statewide findings, those aged 65 and older are more likely than those aged 50 to 64 to report that they are “very prepared” financially for retirement. Those aged 65 or older in the Historic Triangle are even more likely than those in Virginia as a whole to report that they feel “very prepared.” As a whole, however, those in York County are less likely than those in James City County and the City of Williamsburg to feel as though they are financially prepared for retirement. Figure 32: Preparedness for Retirement
Q20. How financially prepared are you for retirement? (n = 571)
Not surprisingly, feelings of preparedness for retirement are highly correlated with income. As with need for public assistance and financial assistance, those with poor health are much less likely than those with average or better health to feel as though they are prepared for retirement.
11%
8%
20%
23%
38%
6%
5%
15%
24%
50%
16%
12%
27%
25%
21%
12%
11%
24%
32%
21%
0% 20% 40% 60% 80% 100%
1-Not at all prepared
2
3
4
5-Very prepared
65+ State65+ Area50 to 64 State50 to 64 Area

Older Dominion Partnership – Historic Triangle Oversample Report November 2011
39
VIII. Housing
Whereas few in the Historic Triangle have to make major sacrifices to afford their home, many report that it does require some more minor sacrifices.
A. Current Home
The majority of respondents in the Historic Triangle report living in a single-family detached home. The remainder tend to live in apartment buildings or multi-family dwellings.
Figure 33: Housing Type
Q43. Which of the following best describes the type of housing where you live? (n = 571)
Those with lower incomes are slightly more likely to be living in an apartment building. Additionally, those living in the City of Williamsburg are more likely than those living in James City County and York County to be living in apartment buildings. Those aged 50 to 64 are more likely to be paying a mortgage than to own their home outright, whereas the reverse is true for those aged 65 or older.
1%
0%
5%
4%
91%
0%
0%
6%
5%
86%
1%
6%
6%
11%
77%
1%
2%
6%
7%
82%
0% 20% 40% 60% 80% 100%
Other
Assisted living facility/Nursing Home
Multiple dwelling house
Apartment building
Single-family detached home
65+ State65+ Area50 to 64 State50 to 64 Area

Older Dominion Partnership – Historic Triangle Oversample Report November 2011
40
Figure 34: Home Ownership
Q44. Do you own your own home? (n = 571)
Only 1% of respondents in both age groups report living in public housing. Most respondents feel as though their home is either easily affordable or affordable with minor sacrifices. Seven percent of those aged 65 or older and 6% of those aged 50 to 64 report that it requires some major sacrifices, and a very small percentage report that their home is not at all affordable.
Figure 35: Housing Affordability
Q45. How affordable do you find your mortgage/rent? (n = 571)
68%
21%
2%
9%
60%
30%
2%
9%
38%
52%
3%
6%
35%
60%
1%
5%
0% 20% 40% 60% 80% 100%
Yes, own outright
Yes, still paying mortgage
No, living with someone else who owns the home
No, rent
65+ State65+ Area50 to 64 State50 to 64 Area
2%
3%
6%
37%
52%
0%
2%
10%
39%
50%
1%
3%
7%
17%
73%
1%
1%
8%
31%
59%
0% 20% 40% 60% 80% 100%
Don't know
Not at all affordable
Affordable with some major sacrifices
Affordable with some minor sacrifices
Easily affordable
65+ State
65+ Area
50 to 64 State
50 to 64 Area

Older Dominion Partnership – Historic Triangle Oversample Report November 2011
41
A small, yet meaningful, percentage of respondents (4% of those aged 50 to 64 and 5% of those in the 65 and older age group) report that they have difficulty living in their home because it is not accessible.
B. Safety
Overall, respondents feel safe in their homes and in their communities – both during the day and at night. In fact, almost everyone rates their feelings of safety a 4 or 5 on a scale from 1 to 5 where 1 means not at all safe and 5 means very safe. Table 10: Feelings of Safety
I typically feel safe or very safe… Area State
50 to 64 65+ 50 to 64 65+
In my home during the day 99% 96% 97% 97%
In my home at night 97% 97% 93% 96%
In my community during the day 99% 97% 94% 95%
In my community at night 94% 96% 87% 91%

Older Dominion Partnership – Historic Triangle Oversample Report November 2011
42
IX. Workforce
As with the statewide averages, many of those who are currently working report they have left and re-entered the workforce.
About half of the respondents in the Historic Triangle aged 50 to 64 report being employed full-time, and a quarter of the respondents in this group report being retired. The majority (83%) of respondents aged 65 or older are retired, whereas only 5% of this age group and employed full-time and an additional 8% are employed part-time.
Figure 36: Employment Status
Q49. Which of the following best describes your employment status? (n = 571)
Approximately half of those aged 65 and older who are currently employed and a third of those aged 50 to 64 who are currently employed report that they have left and re-entered the workforce. Those who have are approximately equally as likely to have re-entered with the same type of job as they are to have re-entered with a different type of job.
5%
6%
24%
2%
12%
52%
6%
9%
24%
4%
10%
46%
0%
1%
83%
3%
8%
5%
1%
2%
82%
3%
5%
6%
0% 20% 40% 60% 80% 100%
Other
Not currently employed
Retired
Homemaker / Stay at home parent
Employed part-time
Employed full-time
65+ State
65+ Area
50 to 64 State
50 to 64 Area

Older Dominion Partnership – Historic Triangle Oversample Report November 2011
43
Figure 37: Workforce Re-entry
Q51. Have you left and re-entered the workforce? (n = 217)
Overall, only a small portion of those who are currently working indicate they had encountered discrimination due to age in the workplace. Perhaps surprisingly, slightly more of those aged 50 to 64 than those aged 65 or older report encountering discrimination.
Figure 38: Age Discrimination at Work
Q52. Within the past two years, have you felt as though you experienced discrimination at work because of age? (n = 217)
24%
21%
55%
21%
26%
54%
18%
17%
65%
14%
16%
70%
0% 20% 40% 60% 80% 100%
Yes, re-entered with same type of job
Yes, re-entered with different type of job
No
65+ State
65+ Area
50 to 64 State
50 to 64 Area
5%
95%
5%
95%
9%
91%
9%
91%
0% 20% 40% 60% 80% 100%
Yes
No
65+ State65+ Area50 to 64 State50 to 64 Area

Older Dominion Partnership – Historic Triangle Oversample Report November 2011
44
X. Transportation & Mobility
As with Virginia as a whole, those in the Historic Triangle rely heavily on their cars for their transportation needs.
Residents in the Historic Triangle report having a wide variety of transportation options available. The most common options are cars that they own, rides from neighbors, and taxis. Figure 39: Available Transportation Options
Q54. Which of the following forms of transportation is available to you? (n = 571)
Almost everyone in both groups report that they have a driver’s license. A small percentage of those in the 65 and older age group, however, report that they cannot drive at night or that they cannot drive during the day.
41%
50%
64%
71%
66%
83%
90%
91%
96%
34%
54%
63%
63%
67%
81%
75%
79%
94%
42%
50%
69%
71%
72%
74%
84%
85%
93%
28%
49%
65%
64%
67%
69%
68%
78%
88%
0% 20% 40% 60% 80% 100%
Local train
Bus
Special transportation for the elderly
Rides from my church group
Special transportation for thedisabled
Car that I can borrow
Taxi
Rides from my neighbors
Car that I own
65+ State
65+ Area
50 to 64 State
50 to 64 Area

Older Dominion Partnership – Historic Triangle Oversample Report November 2011
45
Figure 40: Licensed Drivers
Q53. Are you a licensed driver? (n = 571)
Only 2% of respondents in each group report that they need transportation more often than it is currently available to them. Further, less than 1% in either age group say that not having transportation access had created problems or made them unable to participate in regular day-to-day activities. Figure 41: Availability of Transportation
Q56. Do you feel you need transportation more often than it is available to you? (n = 571)
78%
6%
3%
12%
83%
8%
2%
7%
93%
1%
1%
5%
97%
1%
0%
2%
0% 20% 40% 60% 80% 100%
Yes
Yes, but I cannot drive at night
Yes, but I cannot drive at all
No
65+ State65+ Area50 to 64 State50 to 64 Area
98%
2%
95%
5%
98%
2%
95%
5%
0% 20% 40% 60% 80% 100%
No
Yes
65+ State
65+ Area
50 to 64 State
50 to 64 Area

Older Dominion Partnership – Historic Triangle Oversample Report November 2011
46
XI. Area Agency on Aging
Almost two-thirds of respondents report that they have heard of the Peninsula Agency on Aging.
Residents of the Historic Triangle fall into the Peninsula Agency on Aging, Inc. catchment area, which encompasses James City County, York County, and the City of Williamsburg, as well as the Cities of Newport News, Hampton, and Poquoson. Almost two-thirds of respondents report that they have heard of the Peninsula Agency on Aging – almost exactly on par with the statewide average for awareness of area agencies on aging. Figure 42: Familiarity with Local Agency on Aging
Q11. Have you ever heard of the Peninsula Agency on Aging? (n = 571)
1%
36%
63%
3%
38%
59%
2%
33%
65%
3%
32%
65%
0% 20% 40% 60% 80% 100%
Don't know
No
Yes
65+ State
65+ Area
50 to 64 State
50 to 64 Area

Older Dominion Partnership – Historic Triangle Oversample Report November 2011
47
XII. Conclusions
The population of the Historic Triangle is aging and it is important to be prepared. Additionally, advances in healthcare and cultural shifts mean that this upcoming generation of seniors will have different needs and expectations as they grow older. The Historic Triangle oversample of the Older Dominion Partnership 2011 Virginia Age Ready Indicators Benchmark Survey provides key information that can be used to prepare for the future. Key Highlights from the Historic Triangle Oversample include:
Those living in the Historic Triangle report a higher quality of life than do those in Virginia as a whole. Health and current home are the two biggest drivers of quality of life ratings.
Those living in the Historic Triangle area feel as though they are more prepared to navigate the challenges of aging than are their communities. Current personal financial situation is the key driver of both individual and community preparedness.
Levels of volunteering and participating in recreational activities are high. Whereas very few respondents report feeling lonely frequently, almost a fifth say that they sometimes do.
On average, those in the Historic Triangle rate their health slightly more positively than do those in Virginia as a whole. Like Virginia as a whole, however, there are still many with chronic conditions and some who report not receiving recommended screenings and visiting doctors and dentists on a regular basis.
Almost three-quarters of those aged 65 or older and half of those aged 50 to 64 in the Historic Triangle feel as though they are financially prepared for retirement. That said, however, there are still some – particularly those with poor health – who feel they need more financial assistance than they are currently getting.
Whereas few in the Historic Triangle have to make major sacrifices to afford their home, many report that it does require some more minor sacrifices.
As with the statewide averages, many of those who are currently working report they have left and re-entered the workforce.
As with Virginia as a whole, those in the Historic Triangle rely heavily on their cars for their transportation needs. This reliance on personal cars may present problems as they age.
Almost two-thirds of respondents report that they have heard of the Peninsula Agency on Aging.

48
Additional Information
In addition to this report, the following items are available:
Detailed Statewide report Reports for each of the Area Agencies on Aging of the VAAAA Information on additional questions asked to a sub-set of the survey
respondents (at a Statewide level)
Detailed data tables (at a Statewide level)
Customized data tables (at a Statewide level)
For information on any of the above or for more information about the Older Dominion Partnership in general and/or this study specifically, please contact:
David Ross Executive Director, Older Dominion Partnership
[email protected] 804-559-0147
Older Dominion Partnership 8400 Meadowbridge Road Mechanicsville, VA 23116