Older and Wiser? Birth Order and IQ of Young Men - Iza
27
IZA DP No. 3007 Older and Wiser? Birth Order and IQ of Young Men Sandra E. Black Paul J. Devereux Kjell G. Salvanes DISCUSSION PAPER SERIES Forschungsinstitut zur Zukunft der Arbeit Institute for the Study of Labor August 2007
Transcript of Older and Wiser? Birth Order and IQ of Young Men - Iza

IZA DP No. 3007
Older and Wiser? Birth Order and IQ of Young Men
Sandra E. BlackPaul J. DevereuxKjell G. Salvanes
DI
SC
US
SI
ON
PA
PE
R S
ER
IE
S
Forschungsinstitutzur Zukunft der ArbeitInstitute for the Studyof Labor
August 2007
Older and Wiser?
Birth Order and IQ of Young Men
Sandra E. Black University of California, Los Angeles,
NHH, NBER and IZA
Paul J. Devereux University College Dublin, CEPR
and IZA
Kjell G. Salvanes Norwegian School of Economics, Statistics Norway, CEP and IZA
Discussion Paper No. 3007 August 2007
IZA
P.O. Box 7240 53072 Bonn
Germany
Phone: +49-228-3894-0 Fax: +49-228-3894-180
E-mail: [email protected]
Any opinions expressed here are those of the author(s) and not those of the institute. Research disseminated by IZA may include views on policy, but the institute itself takes no institutional policy positions. The Institute for the Study of Labor (IZA) in Bonn is a local and virtual international research center and a place of communication between science, politics and business. IZA is an independent nonprofit company supported by Deutsche Post World Net. The center is associated with the University of Bonn and offers a stimulating research environment through its research networks, research support, and visitors and doctoral programs. IZA engages in (i) original and internationally competitive research in all fields of labor economics, (ii) development of policy concepts, and (iii) dissemination of research results and concepts to the interested public. IZA Discussion Papers often represent preliminary work and are circulated to encourage discussion. Citation of such a paper should account for its provisional character. A revised version may be available directly from the author.

IZA Discussion Paper No. 3007 August 2007
ABSTRACT
Older and Wiser? Birth Order and IQ of Young Men*
While recent research finds strong evidence that birth order affects children’s outcomes such as education and earnings, the evidence on the effects of birth order on IQ is decidedly mixed. This paper uses a large dataset on the population of Norway that allows us to precisely measure birth order effects on IQ using both cross-sectional and within-family methods. Importantly, irrespective of method, we find a strong and significant effect of birth order on IQ, and our results suggest that earlier born children have higher IQs. Our preferred estimates suggest differences between first-borns and second-borns of about one fifth of a standard deviation or approximately 3 IQ points. Despite these large average effects, birth order only explains about 3% of the within-family variance of IQ. When we control for birth endowments, the estimated birth order effects increase. Thus, our analysis suggests that birth order effects are not biologically determined. Also, there is no evidence that birth order effects occur because later-born children are more affected by family breakdown. JEL Classification: I2, J1 Keywords: birth order, IQ Corresponding author: Kjell G. Salvanes Department of Economics Norwegian School of Economics and Business Administration Helleveien 30 N-5045 Bergen Norway E-mail: [email protected]
* Black and Devereux gratefully acknowledge financial support from the National Science Foundation and the California Center for Population Research. Salvanes thanks the Research Council of Norway for financial support. We are grateful to the Medical Birth Registry for Norway for providing the birth registry data. We are also indebted to Stig Jakobsen who was instrumental in obtaining data access to the IQ data from the Norwegian Armed Forces.

The psychology literature has long debated the role of birth order in determining
children’s IQ. The debate was seemingly resolved when, in 2000, Rodgers et al.
published a paper in the American Psychologist entitled “Resolving the Debate Over
Birth Order, Family Size, and Intelligence” that referred to the apparent relationship
between birth order and IQ as a “methodological illusion.”1 2. However, since that time,
the economics literature, using data on the population of Norway, has found strong
evidence that birth order affects educational attainment and earnings. (See Black,
Devereux, and Salvanes, 2005). This leads one to wonder: how can we reconcile the
strong relationship between birth order and educational attainment with a literature
suggesting no relationship between birth order and IQ?
Previous work has been limited due to an absence of large representative datasets
necessary to identify these effects. This paper uses a large dataset on the population of
Norway and focuses on the effect of birth order on IQ, an outcome not previously
available in datasets of this magnitude.3
Consistent with our earlier findings on educational attainment but in contrast to
the previous work in the literature, we find strong birth order effects on IQ that are
present both in between-family (cross-sectional) and within-family analysis. Later-born
children have lower IQ on average and the differences are quite large. For example, the
difference between first-born and second-born average IQ is on the order of one fifth of a
standard deviation or about 3 IQ points. This translates into approximately a 2%
1 Page 599. 2 In the 2001 June/July issue of The American Psychologist, several articles from leading researchers within this field debated the findings in Rodgers et al. (2001), and Rodgers stated in an article in that issue that “The existance of a birth order effect on intelligence is a phenomenon still in search of data to support its evidence. Until such data are found, models of the phenomenon cannot be taken seriously.” (Rodgers, 2001, p 510).
2

difference in annual earnings as an adult. To put the magnitude of this birth order effect
in another perspective, the black-white IQ gap in the United States is typically measured
to be about 1 standard deviation. We also begin to investigate the underlying causes of
this relationship, including examining the impact of controlling for birth characteristics in
order to assess the role of biological explanations, and restricting the sample to families
that remain intact to examine whether family breakdown can cause birth order effects.4
2. Data
Our primary data source is the birth records for all Norwegian births over the
period 1967 to 1998 obtained from the Medical Birth Registry of Norway. All births,
including those born outside of a hospital, are included as long as the gestation period
was at least 16 weeks.5 The birth records contain information on year and month of birth,
birth weight, gestational length, age of mother, and a range of variables describing infant
health at birth. In these data, we are also able to identify twin births. We can measure
family size by counting the number of births to each woman in these data. Our sample is
composed of families in which the first birth took place during or after 1967.6 Given that
3 Our data provide information on the IQ scores of men aged between 18 and 20. IQ at these ages is particularly interesting as it is about the time of entry to the labor market or to higher education. 4 While completing this draft of the paper, we became aware of a similar study by Bjerkedal et al. (2007). It uses the same data source and similar methods and comes to similar conclusions. Our study differs in that we include more control variables and evaluate the role of family breakdown and biological explanations for birth order effects. 5 The data also include stillbirths, which constitute approximately 15 per 1000 births. We exclude these from the sample. 6 The Norwegian Family Register provides an independent measure of family size for each woman. This file is updated annually and the most recent available version is for 2002. We obtain a second measure of family size from the 2002 file (using annual files between 1998-2001 to fill in family size for women who are missing in the 2002 file). Reassuringly, for over 94% of observations, the family size from the Family Register equals the family size that results in counting births from the birth register. For a further 2.2% of observations, no family size number is reported in the Family Register so we use the count of births from the birth records as our family size measure. For an additional 3% of cases, the number from the Family Register exceeds the count from the birth records. In these cases we assume that additional children were
3

we observe year of birth, we are able to construct indicators for the birth order of each
child directly from the birth register.
Using unique personal identifiers, we match these files to the Norwegian Registry
Data, a linked administrative dataset that covers the population of Norwegians aged 16-
74 in the 1986-2002 period and is a collection of different administrative registers such as
the education register, family register, and the tax and earnings register. These data are
maintained by Statistics Norway and provide information about educational attainment,
labor market status, earnings, and a set of demographic variables (age, gender) as well as
information on families.7
The IQ data are taken from the Norwegian military records from 1984 to 2005. In
Norway, military service is compulsory for every able young man. Before entering the
service, their medical and psychological suitability is assessed; this occurs for the great
majority between their eighteenth and twentieth birthday.8 The IQ measure is a composite
score from three speeded IQ tests -- arithmetic, word similarities, and figures (see Sundet
born after 1998 and use the number from the Family Register as our family size measure. For 0.3% of cases, more births are counted in the birth files than are reported in the Family Register but there is no indication in the birth files that there has been any infant mortality. For these cases, we set our measure of family size to be the count from the birth records. For approximately 0.3% of cases, we observe the family register reporting fewer children than the birth registry due to the death of a child within the first year. Because of the difficulty of assigning birth order in these cases, we have excluded these families from our sample. 7 Educational attainment is reported by the educational establishment directly to Statistics Norway, thereby minimizing any measurement error due to misreporting. The education register started in 1970; we use information from the 1970 Census for individuals who completed their education before then. Census data are self reported but the information is considered to be very accurate; there are no spikes or changes in the education data from the early to the later cohorts. See Møen, Salvanes and Sørensen [2004] for a description of these data. 8 Of the men in the 1967-1987 cohorts, 1.2 percent died before 1 year and 0.9 percent died between 1 year of age and registering with the military at about age 18. About 1 percent of the sample of eligible men had emigrated before age 18, and 1.4 percent of the men were exempted because they were permanently disabled. An additional 6.2 percent are missing for a variety of reasons including foreign citizenship and missing observations. See Eide et al. [2005] for more details. There are also some missing IQ scores for individuals who showed up to the military. In total, we have IQ scores on about 84% of the relevant population. Later-born children are slightly more likely to be missing IQ scores than earlier-borns. Given
4

et al. [2004, 2005] and Thrane [1977] for details). The arithmetic test is quite similar to
the arithmetic test in the Wechsler Adult Intelligence Scale (WAIS) [Sundet et al. 2005;
Cronbach 1964]. The word test is similar to the vocabulary test in WAIS, and the figures
test is similar to the Raven Progressive Matrix test [Cronbach 1964]. The composite IQ
test score is an unweighted mean of the three subtests. The IQ score is reported in stanine
(Standard Nine) units, a method of standardizing raw scores into a nine point standard
scale with a normal distribution, a mean of 5, and a standard deviation of 2.9
We exclude families in which no child is born before 1987 as no data on military
outcomes of children is available for such families. We drop twins from our estimating
samples because of the ambiguities involved in calculating birth order for twins. Table 1
presents summary statistics for our sample and Appendix Table 1 shows the distribution
of family sizes in our sample. Most families in our sample have two or three children.
3. Birth Order Analysis
Birth Order Literature
Blake (1989) describes the stringent data requirements necessary to identify birth
order effects in cross sectional analyses. Because higher rank children are more likely to
be born into larger families, she stresses the need to control for family size effects.
Because higher rank children are more likely to be born in later years, she stresses the
need to control for cohort effects. Because higher rank children are more likely to have
older parents at birth, she stresses the need to control for parent cohort effects. And,
because parents differ across families, she stresses the need to control for parental
that one would expect persons excused from the military to tend to have lower IQ, this implies that, if anything, the birth order effects we find are a conservative estimate.
5

characteristics in cross-sectional (cross-family) analysis. Because of these requirements,
in order to provide credible estimates of birth order using cross-family variation, one
needs to have multiple cohorts for each birth order so one can control for cohort effects,
and one needs to have full fertility histories so one can control for mother’s age at birth
and mothers age at first birth (which will be correlated with birth order conditional on
child cohort and mother cohort). Also, one needs to have access to parental characteristics
like mother’s education, as they may also be correlated with birth order conditional on
child and mother cohort.
A particularly influential cross-sectional study is that by Belmont and Marolla
(1973). They averaged Raven Progressive Matrices scores from a cross-section of almost
400,000 19-year-old Dutch men born between 1944 and 1947 and found a clear pattern of
declining intelligence by birth order within family size groups. These findings inspired
the confluence model of Zajonc (1976). However, these results have subsequently been
questioned. For example, Blake (1989) suggests that the birth order effects found may
simply arise due to a failure to control for cohort effects and parental education; in
addition, she suggests the effects may also be due to systematic mortality arising from a
famine during 1944 and 1945. More generally, the cross-sectional studies of birth order
and IQ have not included the required control variables, often because of data limitations.
More recently, studies have strongly argued that as birth order processes are
fundamentally within-family, within-family data are required to study them. Rodgers et
al. (2000) state “The most important methodological point in this article is that cross-
sectional data are so filled with potential selection (and other) biases as to be virtually
useless in addressing birth order effects on intelligence. Yet, most of what researchers
9 The correlation between this IQ measure and the WAIS IQ has been found to be .73 (Sundet et al., 1988).
6

know (or believe that they know) about family structure and its influence on intellectual
development derives from cross-sectional data”. As discussed above, we believe that
sufficiently rich cross-sectional data can be informative about birth order effects if used
properly. However, there are obvious attractions to comparing siblings within families, as
it ensures that there are no confounding across-family processes. Note that there can still
be biases in within-family analyses as parents of later-born children are older, and later
born children belong to different cohorts. These issues can be dealt with using cohort
indicators for each child. Essentially, birth order effects are then identified from the
unequal spacing of births.10
The within-family literature on birth order and IQ consists of a small number of
studies that have generally failed to find statistically significant birth order effects.11
However, most studies have used small, non-representative samples (Berbaum and
Moreland 1980 studied 51 families; Galbraith 1982 used a sample of Brigham Young
students). Retherford and Sewell (1991) used the Wisconsin Longitudinal Survey of high
school graduates in 1957 and found no statistically significant sibling differences in IQ by
birth order. However there are issues with sample selection (the main respondent must be
a high school graduate and education and IQ are correlated), and sample sizes are
relatively small (about 500 pairs in a typical sibling comparison). Most importantly, they
10 When cohort effects are included, identification of birth order effects relies on the fact that birth order does not perfectly correspond to cohort. If children were always born one year apart, cohort effects would absorb the birth order effects; we are thus identified off of unequal spacing of children. 11 A related literature has studied the effects of birth order on educational attainment (Behrman and Taubman 1986; Hanushek 1992; Hauser and Sewell 1985). In recent work (Black, Devereux, and Salvanes 2005), we studied educational outcomes of earlier cohorts of Norwegians using within-family models in addition to OLS. We found strong birth order effects in education, with educational attainment falling monotonically with birth order. Subsequent studies using data from several countries (for example, Booth and Kee, 2006) have found similar effects for education. However, these studies do not have data on intelligence.
7

do not control for child cohort/parental age at birth, and it is not clear how large the age
gaps are between the respondent and the other randomly chosen sibling used in the
comparisons. A more compelling dataset was used by Rodgers et al. (2000) who
analyzed the effects of birth order on the IQ of children aged between 5 and 15 using data
from the National Longitudinal Survey of Youth (NLSY).12 They found that, using
within-family analysis, average scores were not statistically different by birth order
within family size classes. However, they have relatively small sample sizes (565 2-child
families, 233 3-child families, and 56 4-child families) and do not carry out any
multivariate analysis; as a result, their estimates may be confounded by potentially
important child cohort and parent age effects. In a more recent study using the NLSY,
Price (2007) finds statistically significant birth order effects that favor first-borns when
using the PIAT reading scores as an outcome variable.13
In this paper, we are able to address many of the limitations of earlier work by
using data on the population of Norway matched to new data on IQ in order to
convincingly identify the relationship between birth order and IQ. We use both cross-
sectional and within-family approaches. We then investigate some potential causes for
these birth order effects. In particular, we investigate the role of birth endowments by
analyzing how birth weight and other birth characteristics are influenced by birth order
and how conditioning on these characteristics affects the magnitude of birth order effects.
Birth Order Results for IQ
12 Their IQ measure was obtained by averaging the PIAT subscales from Reading Recognition, Reading Comprehension, and Mathematical Achievement for two successive administrations of these tests (ie. Six scores in all were averaged).
8

The average IQ level by birth order is listed in Table 2 and the distribution by
birth order is presented in Figure 1. There is a clear pattern of declining IQ for higher
birth orders. Also, it is clear from Figure 1 that the averages are not being excessively
influenced by either tail of the ability distribution. However, these summary statistics can
be misleading in that we are not controlling for family size, cohort effects, or any other
demographic characteristics that may be correlated with birth order. To remedy this, we
estimate the relationship between birth order and IQ in a regression framework. In order
to avoid any confounding family size effects, we run separate regressions by family size
and include families of 2, 3, 4, and 5 (fewer than 1% of families have more than 5
children. See Appendix Table 1 for more detail). The results are presented in Table 3.
Each column in Table 3 represents a separate regression for a particular family
size. We first present estimates where there are no control variables included. If we look
across row one, we can see the effect of being a “second child” (the omitted category is
first child) is large and negative for all family sizes. Our IQ measure is on a scale from
one to nine; thus a coefficient of -.3 on 2nd child suggests that second children have on
average a score of .3 lower than first children (a difference of about 30% of a stanine or
15% of a standard deviation). In general, we find that IQ scores decline as birth order
increases.
On the right hand side of Table 3, we include a set of control variables. These
include indicator variables for cohort, age at test, age of mother at birth, age of mother at
first birth, years of education of mother, and years of education of father. We also include
13 IQ is measured at different ages for different children in the NLSY. This is a pervasive problem in the birth order and IQ literature. It is not a problem for us as all men are tested about age 19.
9

controls for IQ of the father for cases in which this is available.14 When we include these
extra controls, we find birth order effects that are qualitatively similar to earlier but which
are quantitatively larger, strongly supporting the idea that later-born male children tend to
have lower IQ scores. The substantial difference in the magnitudes of the estimated birth
order effects with and without controls demonstrates the importance of conditioning out
other possible confounding factors.15
Figure 2 provides a visual representation of the birth order effects. To construct
this picture, we pooled all families with 5 or fewer children and included dummy
variables for each birth order-family size combination. The omitted category is children
in one-child families. We include the same control variables as above. Strikingly, Figure
2 shows that the magnitude of the birth order effects is very similar across families of
different size. Also, it is clear that the impacts of birth order are much greater than those
of family size.
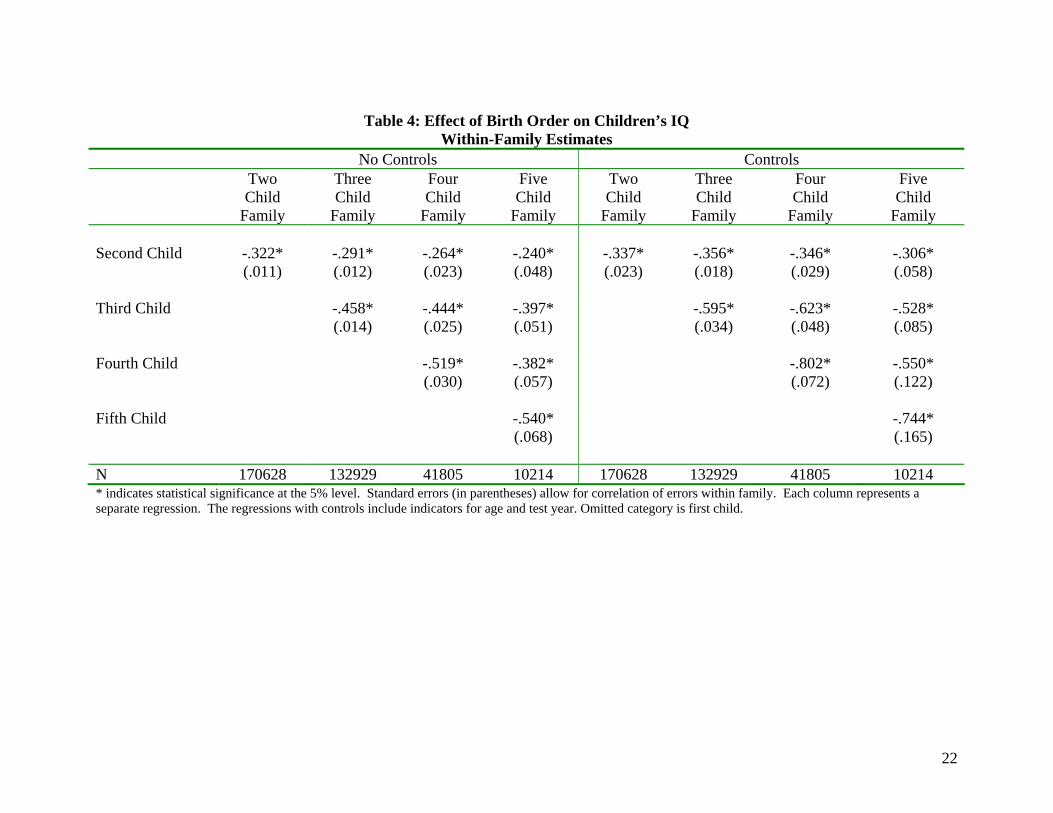
The within-family estimates using family indicators are in Table 4. The estimates
are very similar to those using cross-sectional variation, suggesting that the estimated
birth order effects do not reflect omitted family characteristics. As with the cross-
sectional estimates, the magnitude of the estimated effects increases with the addition of
control variables (in this case cohort indicators) showing the importance of factoring out
effects of mother’s age at birth and child cohort effects. Our birth order findings are very
different to that of Rodgers et al. (2000) and others that have used within-family analysis
14 We do this by setting father’s IQ to zero for cases in which it is missing and then interacting father’s IQ with a dummy variable which is one if we have information on father’s IQ and zero otherwise. Both these variables are then included in the regression. 15 It is well known that families in which the first two children are the same sex are more likely to have a third child than families in which the first two children are opposite in sex. This suggests that there might be systematic differences between same-sex two child families and opposite-sex two child families. For this
10

to estimate birth order effects and find little significant relationship between birth order
and IQ. While we are not sure of the causes of the differences, we suspect it is in part
related to our inclusion of cohort effects and our access to a very large representative data
set in which IQ is measured at approximately the same age for all children in the family.
Why might Birth Order affect IQ?
There are many reasons why there might be birth order effects on IQ. Although
there is no genetic component to birth order, there may be biological differences by birth
order resulting from differing experiences in utero. For example, the quality of pre-natal
care or the behavior of expectant mothers may differ by birth order. We can use
information about birth characteristics to explore biological explanations further.
Appendix Table 2 shows the correlations between birth characteristics, IQ, and birth
order. There are clear positive correlations between birth weight, birth length, and head
size at birth with IQ (all correlations in the table are statistically significant).
Interestingly, these positive birth characteristics are also positively correlated with birth
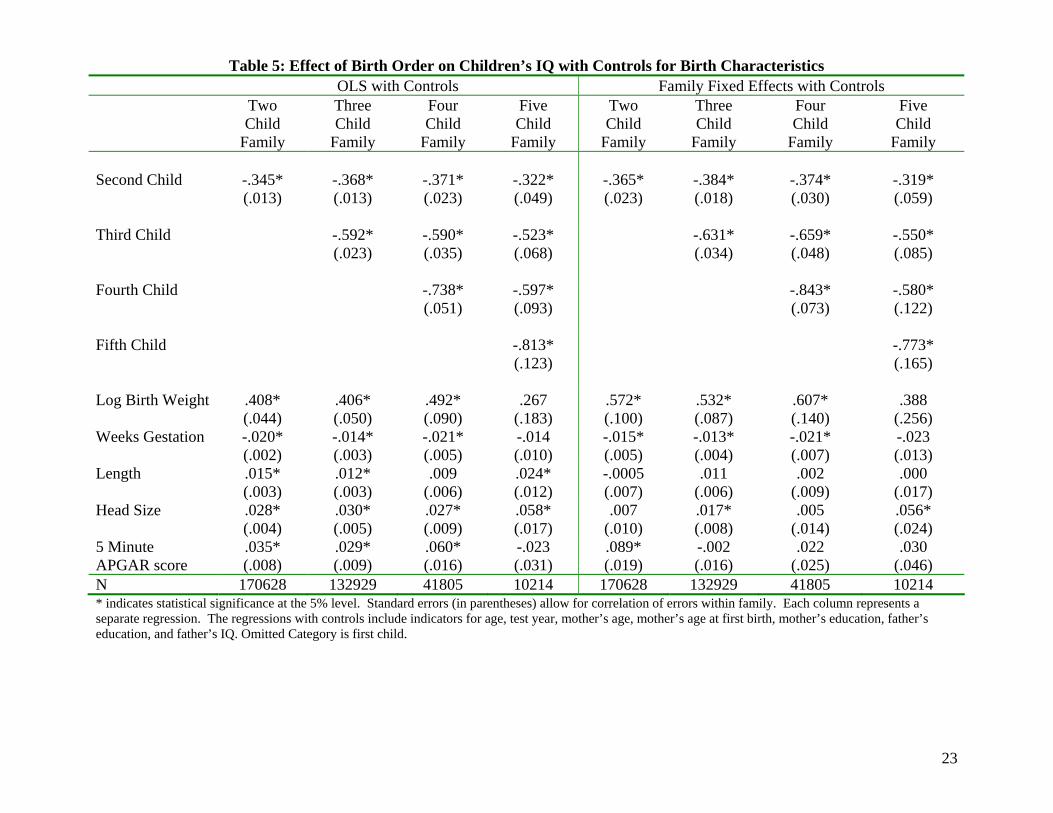
order, so later-borns actually have better measured birth characteristics.16 Not
surprisingly then, when we include these characteristics in the birth order regressions (see
Table 5), we find that the birth order effects increase. Thus, as far as we can tell,
biological factors are not responsible for the birth order effects we have found.
An additional possibility is that birth order effects occur because of separations
and divorces; later-borns will be younger when the split occurs and may be more affected
reason, we have tried estimating separate birth order specifications for these two groups of two child families. We found estimates that are similar to each other and to those reported in Table 3. 16 Higher birth weight has been shown to have positive effects on IQ scores in Norway (Black, Devereux, Salvanes 2007).
11

by it. However, this is not what is driving our birth order effects; when we re-estimate
all regressions on the subset of families in which all children have the same parents and
both parents are still together 20 years after the first child is born, we find birth order
effects that are very similar in magnitude to those reported in the tables.
Alternative models are those based on the idea of resource dilution. One important
resource is time; first-borns may benefit from having the exclusive attention of their
parents, while later-borns have to share time with their earlier-born siblings. Price (2006)
uses time-use data to show that later-borns get less parental time than earlier-borns
received at that same age. One might expect that if the time constraint explanation is
important, birth order effects would be larger in more closely spaced families. We have
tried interacting birth order dummies with the spacing gap between the first and last
child; we found no evidence that birth order effects are related to spacing.
Likewise, if there are credit constraints, financial resources may be more plentiful
when there are fewer children in the household, and this will benefit first-borns. In
general, resource dilution arguments suggest that later-borns will have poorer outcomes.
In order to try to test this, we have calculated the percentage income growth of the father
over the 15 years after the year of birth of the first child and interacted that with the birth
order effects. One might expect that if financial resource constraints were an important
determinant of birth order effects, these effects would be smaller in families with faster
income growth. However, when we interact the income growth rate over these 15 years
with the birth order effects, we find no evidence for this hypothesis.
Birth order effects could also be the result of changing parental behaviors post-
birth. Parents of later-borns are more experienced and this may prove beneficial. On the
12

other hand, standard diminishing marginal utility arguments suggest that parents might
invest more in earlier-borns. The confluence model of Zajonc (1976) suggests that first-
borns benefit from living in a more adult environment and from having younger siblings
to teach. Unfortunately, our data are not suitable for evaluating the role of these
explanations.
4. Conclusions
In contrast to previous research, we find strong birth order effects on IQ that are
present both in cross-sectional and within-family analysis. Later-born children have lower
IQ on average, and the differences are quite large. For example, the difference between
first-born and second-born average IQ is on the order of one fifth of a standard deviation.
This corresponds to approximately 3 units on an IQ scale and translates into
approximately a 2% difference in annual earnings as an adult.17 To put the magnitude of
this birth order effect in another perspective, the black-white IQ gap in the United States
is typically measured to be about 1 standard deviation. One might expect that such
sizeable birth order effects would explain a large part of the within-family variance in IQ.
In fact, they explain only about 3% of the within-family variance; most sibling
differences in IQ are related to genetic and other hard-to-observe factors.
Our birth register data enable us to assess the role of biological explanations for
birth order effects. We find that measured endowments of children at birth cannot explain
our birth order effects and, in fact, the birth order effects increase once we control for
17 We arrive at this number by regressing log earnings in 2002 on IQ scores for individuals aged at least 30 in 2002. For both cross-sectional and family fixed effects specifications we obtain precisely estimated coefficients on ability of about .06, suggesting an extra stanine in ability (about half a standard deviation) leads to about 6% higher earnings.
13

birth characteristics. There is also no evidence that the birth order effects results from
separations and divorce, or from resource constraints. There are many other possible
explanations for birth order effects but we are unable to assess their role with our data.
14

References
Behrman, Jere R. and Paul Taubman, “Birth Order, Schooling, and Earnings.” Journal of Labor Economics, 1986. Vol 4, No. 3.
Belmont L. and F.A. Marolla (1973), “Birth Order, Family Size, and Intelligence”
Science, 182, 1096-1101. Berbaum, M.L. and R.L. Moreland (1980), “Intellectual Development within the Family:
A new application of the confluence model” Developmental Psychology, 16, 500-515.
Bjerkedal, Tor, Petter Kristensen, Geir A. Skjeret, and John I. Brevik, “Intelligence test
scores and birth order among young Norwegian men (conscripts) analyzed within and between families”, Intelligence (2007).
Black, Sandra E., Paul J. Devereux, and Kjell G. Salvanes, “The More the Merrier? The
Effects of Family Size and Birth Order on Children’s Education,” Quarterly Journal of Economics, CXX (2005), 669-700.
Black, Sandra E., Paul J. Devereux, and Kjell G. Salvanes, “From the Cradle to the Labor
Market? The Effect of Birth Weight on Adult Outcomes,” Quarterly Journal of Economics, February 2007, 122(1), 409-439.
Blake, Judith, Family Size and Achievement, 1989, University of California Press,
Berkeley and Los Angeles. Booth, Alison L. and Hiau Joo Kee. “Birth Order Matters: The Effect of Family Size and
Birth Order on Educational Attainment” Working Paper, 2006. Cronbach, Lee J., Essentials of Psychological Testing, 2nd Edition, (London, UK:
Harper and Row, 1964). Eide, Martha G., Nina Øyen, Rolv Skjærven, Stein Tore Nilsen, Tor Bjerkedal and
Grethe S. Tell, “Size at Birth and Gestational Age as Predictors of Adult Height and Weight,” Epidemiology, XVI (2005), 175-181.
Galbraith, R.C. (1982) “Sibling Spacing and Intellectual Development: A closer look at
the confluence models” Developmental Psychology, 18, 151-173. Hanushek, Eric A., “The Trade-off between Child Quantity and Quality” Journal of
Political Economy, 1992. Vol 100, No. 1. Hauser, Robert M., and William H. Sewell (1985), "Birth Order and Educational
Attainment in Full Siblings", American Educational Research Journal, Vol. 22, No. 1, 1-23.
15
Møen, Jarle, Kjell G. Salvanes and Erik Ø. Sørensen, “Documentation of the Linked
Empoyer-Employee Data Base at the Norwegian School of Economics,” Mimeo, The Norwegian School of Economics and Business Administration, 2004.
Price, Joseph, “Quality Time: The Effect of Birth Order” Working Paper, 2006. Price, Joseph, “Parental Time, Family Income, and Child Outcomes”, Working Paper
2007. Retherford, R.D. and W.H. Sewell. “Birth Order and Intelligence: Further Tests of the
Confluence Model”, American Sociological Review, 56, 141-158 (1991). Rodgers Joseph L., H. Harrington Cleveland, Edwin van den Oord, and David C. Rowe,
“Resolving the Debate over Birth Order, Family Size, and Intelligence” American Psychologist, 55(6) 599-612 (2000).
Rogers, Joseph L., What Causes Birth Order- Intelligence Patterns?” American
Psychologist, 56(6/7) 505-510 (2001). Sundet, Martin Jon, Dag G. Barlaug, and Tore M. Torjussen, "The End of the Flynn
Effect? A Study of Secular Trends in Mean Intelligence Test Scores of Norwegian Conscripts During Half a Century", Intelligence , XXXII (2004), 349-362.
Sundet, Jon Martin, Kristian Tambs, Jennifer R. Harris, Per Magnus, and Tore M.
Torjussen (2005), “Resolving the Genetic and Environmental Sources of the Correlation Between Height and Intelligence: A Study of Nearly 2600 Norwegian Male Twin Pairs,” Twin Research and Human Genetics, VII (2005), 1-5.
Sundet, Jon Martin, Kristian Tambs, Per Magnus, and K. Berg, “On the Question of
Secular Trends in the Heritability of IQ Test Scores: A Study of Norwegian Twins”, Intelligence (1988), 12, 47-59.
Thrane, Vidkunn Coucheron, “Evneprøving av Utskrivingspliktige i Norge 1950-53,” Arbeidsrapport nr. 26, INAS 1977.
Zajonc R. B., “Family Configuration and Intelligence” Science, Vol. 192, 227-236, 1976.
16

Figure 1:Distribution of Ability by Birth Order
0
5
10
15
20
25
30
1 2 3 4 5 6 7 8 9
Ability Stanine
Birth Order=1 Birth Order=2 Birth Order=3 Birth Order=4 Birth Order=5 Birth Order=6
17

Figure 2
Birth Order Effects by Family SizeOmitted Category: Single Child Family
-0.8
-0.7
-0.6
-0.5
-0.4
-0.3
-0.2
-0.1
0
0.1
0.2
1 2 3 4 5
Birth Order
Stan
ine
Poin
ts
Family Size=2 Family Size=3 Family Size=4 Family Size=5
18
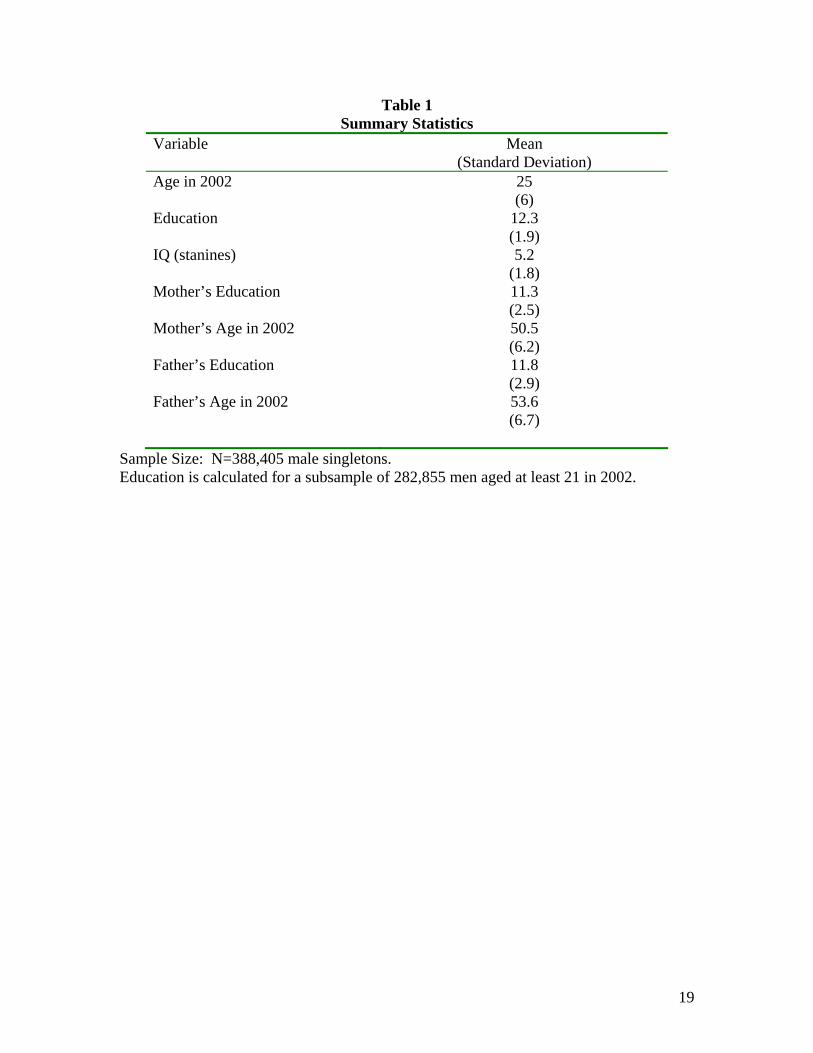
Table 1 Summary Statistics
Variable Mean (Standard Deviation)
Age in 2002 25 (6)
Education 12.3 (1.9)
IQ (stanines) 5.2 (1.8)
Mother’s Education 11.3 (2.5)
Mother’s Age in 2002 50.5 (6.2)
Father’s Education 11.8 (2.9)
Father’s Age in 2002 53.6 (6.7)
Sample Size: N=388,405 male singletons. Education is calculated for a subsample of 282,855 men aged at least 21 in 2002.
19
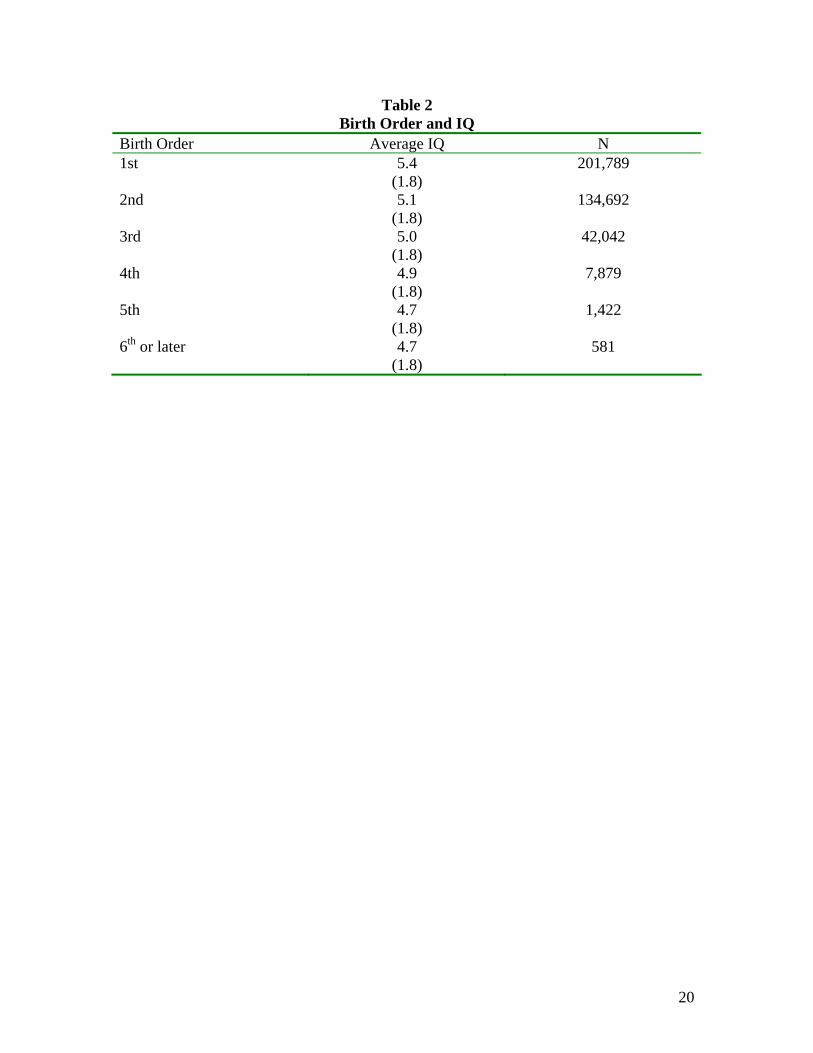
Table 2 Birth Order and IQ
Birth Order Average IQ N 1st 5.4
(1.8) 201,789
2nd 5.1 (1.8)
134,692
3rd 5.0 (1.8)
42,042
4th 4.9 (1.8)
7,879
5th 4.7 (1.8)
1,422
6th or later 4.7 (1.8)
581
20

21
Table 3: Effect of Birth Order on Children’s IQ (OLS) No Controls Controls
Two Child
Family
Three Child
Family
Four Child
Family
Five Child
Family
Two Child
Family
Three Child
Family
Four Child
Family
Five Child
Family Second Child
-.267* (.008)
-.235* (.010)
-.234* (.020)
-.188* (.044)
-.316* (.013)
-.344* (.013)
-.348* (.023)
-.297* (.048)
Third Child
-.354*(.012)
-.351* (.022)
-.277* (.048)
-.563*(.023)
-.560* (.035)
-.490* (.067)
Fourth Child
-.403*(.026)
-.267* (.054)
-.707*(.051)
-.562* (.092)
Fifth Child
-.436*(.066)
-.778*(.122)
N 170628 132929 41805 10214 170628 132929 41805 10214* indicates statistical significance at the 5% level. Standard errors (in parentheses) allow for correlation of errors within family. Each column represents a separate regression. The regressions with controls include indicators for age, test year, mother’s age, mother’s age at first birth, mother’s education, father’s education, and father’s IQ. Omitted Category is first child.
22
Table 4: Effect of Birth Order on Children’s IQ Within-Family Estimates
No Controls Controls Two
Child Family
Three Child
Family
Four Child
Family
Five Child
Family
Two Child
Family
Three Child
Family
Four Child
Family
Five Child
Family Second Child
-.322* (.011)
-.291* (.012)
-.264* (.023)
-.240* (.048)
-.337* (.023)
-.356* (.018)
-.346* (.029)
-.306* (.058)
Third Child
-.458*(.014)
-.444* (.025)
-.397* (.051)
-.595*(.034)
-.623* (.048)
-.528* (.085)
Fourth Child
-.519*(.030)
-.382* (.057)
-.802*(.072)
-.550* (.122)
Fifth Child
-.540*(.068)
-.744*(.165)
N 170628 132929 41805 10214 170628 132929 41805 10214* indicates statistical significance at the 5% level. Standard errors (in parentheses) allow for correlation of errors within family. Each column represents a separate regression. The regressions with controls include indicators for age and test year. Omitted category is first child.
23
Table 5: Effect of Birth Order on Children’s IQ with Controls for Birth Characteristics
OLS with Controls Family Fixed Effects with Controls Two
Child Family
Three Child
Family
Four Child
Family
Five Child
Family
Two Child
Family
Three Child
Family
Four Child
Family
Five Child
Family Second Child
-.345* (.013)
-.368* (.013)
-.371* (.023)
-.322* (.049)
-.365* (.023)
-.384* (.018)
-.374* (.030)
-.319* (.059)
Third Child
-.592*(.023)
-.590* (.035)
-.523* (.068)
-.631*(.034)
-.659* (.048)
-.550* (.085)
Fourth Child
-.738*(.051)
-.597* (.093)
-.843*(.073)
-.580* (.122)
Fifth Child
-.813*(.123)
-.773*(.165)
Log Birth Weight .408* (.044)
.406* (.050)
.492* (.090)
.267 (.183)
.572* (.100)
.532* (.087)
.607* (.140)
.388 (.256)
Weeks Gestation -.020* (.002)
-.014* (.003)
-.021* (.005)
-.014 (.010)
-.015* (.005)
-.013* (.004)
-.021* (.007)
-.023 (.013)
Length .015* (.003)
.012* (.003)
.009 (.006)
.024* (.012)
-.0005 (.007)
.011 (.006)
.002 (.009)
.000 (.017)
Head Size .028* (.004)
.030* (.005)
.027* (.009)
.058* (.017)
.007 (.010)
.017* (.008)
.005 (.014)
.056* (.024)
5 Minute APGAR score
.035* (.008)
.029* (.009)
.060* (.016)
-.023 (.031)
.089* (.019)
-.002 (.016)
.022 (.025)
.030 (.046)
N 170628 132929 41805 10214 170628 132929 41805 10214* indicates statistical significance at the 5% level. Standard errors (in parentheses) allow for correlation of errors within family. Each column represents a separate regression. The regressions with controls include indicators for age, test year, mother’s age, mother’s age at first birth, mother’s education, father’s education, and father’s IQ. Omitted Category is first child.

Appendix Table 1
Distribution of Family Size Family Size Percentage 1
10
2
47
3
31
4
9
5
2
6 or more 1
24

Appendix Table 2 Correlations between IQ, Birth Order, Family Size, and Birth Characteristics
IQ Birth Order
Family Size Log Birth Weight Weeks Gestation Head Size Length 5 Minute APGAR
IQ
1Birth Order -.08 1Family Size -.04 .46 1Log Birth Weight .07 .14 .07 1Weeks Gestation .02 -.01 .01 .46 1Head Size .08 .11 .06 .70 .36 1Length .07 .07 .05 .82 .41 .58 15 Minute APGAR .01 .05 .02 .11 .09 .03 .04 1 The above are correlations between the listed variables. All correlations are statistically greater than zero. All variables measured between 1967 and 1987 except head size and 5 minute APGAR score which are only available from 1977-1987. All correlations use all available observations for the two variables.
25