Older adult problem drinkers: Who presents for alcohol treatment?
10
This article was downloaded by: [University of Sydney] On: 02 September 2014, At: 00:59 Publisher: Routledge Informa Ltd Registered in England and Wales Registered Number: 1072954 Registered office: Mortimer House, 37-41 Mortimer Street, London W1T 3JH, UK Aging & Mental Health Publication details, including instructions for authors and subscription information: http://www.tandfonline.com/loi/camh20 Older adult problem drinkers: Who presents for alcohol treatment? Marilyn M. Christie a , Deborah Bamber b , Charlotte Powell b , Tina Arrindell c & Anshuman Pant d a School of Psychology – Clinical Section, University of Leicester , Leicester , England b Research and Education Team, Leicestershire Partnership NHS Trust, Leicester City Alcohol and Drug Service, Paget House , Leicester , England c Service Evaluation Team, Leicestershire Partnership NHS Trust, Leicester City Alcohol and Drug Service, Paget House , Leicester , England d Bradgate Mental Health Unit, Glenfield Hospital , Leicester , England Published online: 04 Jul 2012. To cite this article: Marilyn M. Christie , Deborah Bamber , Charlotte Powell , Tina Arrindell & Anshuman Pant (2013) Older adult problem drinkers: Who presents for alcohol treatment?, Aging & Mental Health, 17:1, 24-32, DOI: 10.1080/13607863.2012.696577 To link to this article: http://dx.doi.org/10.1080/13607863.2012.696577 PLEASE SCROLL DOWN FOR ARTICLE Taylor & Francis makes every effort to ensure the accuracy of all the information (the “Content”) contained in the publications on our platform. However, Taylor & Francis, our agents, and our licensors make no representations or warranties whatsoever as to the accuracy, completeness, or suitability for any purpose of the Content. Any opinions and views expressed in this publication are the opinions and views of the authors, and are not the views of or endorsed by Taylor & Francis. The accuracy of the Content should not be relied upon and should be independently verified with primary sources of information. Taylor and Francis shall not be liable for any losses, actions, claims, proceedings, demands, costs, expenses, damages, and other liabilities whatsoever or howsoever caused arising directly or indirectly in connection with, in relation to or arising out of the use of the Content. This article may be used for research, teaching, and private study purposes. Any substantial or systematic reproduction, redistribution, reselling, loan, sub-licensing, systematic supply, or distribution in any form to anyone is expressly forbidden. Terms & Conditions of access and use can be found at http:// www.tandfonline.com/page/terms-and-conditions
Transcript of Older adult problem drinkers: Who presents for alcohol treatment?

This article was downloaded by: [University of Sydney]On: 02 September 2014, At: 00:59Publisher: RoutledgeInforma Ltd Registered in England and Wales Registered Number: 1072954 Registered office: MortimerHouse, 37-41 Mortimer Street, London W1T 3JH, UK
Aging & Mental HealthPublication details, including instructions for authors and subscription information:http://www.tandfonline.com/loi/camh20
Older adult problem drinkers: Who presents foralcohol treatment?Marilyn M. Christie a , Deborah Bamber b , Charlotte Powell b , Tina Arrindell c &Anshuman Pant da School of Psychology – Clinical Section, University of Leicester , Leicester , Englandb Research and Education Team, Leicestershire Partnership NHS Trust, Leicester CityAlcohol and Drug Service, Paget House , Leicester , Englandc Service Evaluation Team, Leicestershire Partnership NHS Trust, Leicester City Alcoholand Drug Service, Paget House , Leicester , Englandd Bradgate Mental Health Unit, Glenfield Hospital , Leicester , EnglandPublished online: 04 Jul 2012.
To cite this article: Marilyn M. Christie , Deborah Bamber , Charlotte Powell , Tina Arrindell & Anshuman Pant(2013) Older adult problem drinkers: Who presents for alcohol treatment?, Aging & Mental Health, 17:1, 24-32, DOI:10.1080/13607863.2012.696577
To link to this article: http://dx.doi.org/10.1080/13607863.2012.696577
PLEASE SCROLL DOWN FOR ARTICLE
Taylor & Francis makes every effort to ensure the accuracy of all the information (the “Content”) containedin the publications on our platform. However, Taylor & Francis, our agents, and our licensors make norepresentations or warranties whatsoever as to the accuracy, completeness, or suitability for any purpose ofthe Content. Any opinions and views expressed in this publication are the opinions and views of the authors,and are not the views of or endorsed by Taylor & Francis. The accuracy of the Content should not be reliedupon and should be independently verified with primary sources of information. Taylor and Francis shallnot be liable for any losses, actions, claims, proceedings, demands, costs, expenses, damages, and otherliabilities whatsoever or howsoever caused arising directly or indirectly in connection with, in relation to orarising out of the use of the Content.
This article may be used for research, teaching, and private study purposes. Any substantial or systematicreproduction, redistribution, reselling, loan, sub-licensing, systematic supply, or distribution in anyform to anyone is expressly forbidden. Terms & Conditions of access and use can be found at http://www.tandfonline.com/page/terms-and-conditions

© 2013 Taylor & Francis
Aging & Mental Health, 2013Vol. 17, No. 1, 24–32, http://dx.doi.org/10.1080/13607863.2012.696577
Older adult problem drinkers: Who presents for alcohol treatment?
Marilyn M. Christiea*, Deborah Bamberb, Charlotte Powellb, Tina Arrindellc and Anshuman Pantd
aSchool of Psychology – Clinical Section, University of Leicester, Leicester, England; bResearch and Education Team,Leicestershire Partnership NHS Trust, Leicester City Alcohol and Drug Service, Paget House, Leicester, England;
cService Evaluation Team, Leicestershire Partnership NHS Trust, Leicester City Alcohol and Drug Service, Paget House,Leicester, England; dBradgate Mental Health Unit, Glenfield Hospital, Leicester, England
(Received 25 January 2012; final version received 10 May 2012)
Objectives: To describe a treatment population of older adults (60þ years) assessed for alcohol treatment over a20-year period.Method: Retrospective analysis of alcohol treatment assessment data relating to all older adults assessed by oneUK NHS Trust Community Alcohol Team (n¼ 585) between April 1988 and March 2008.Results: Over the 20-year period, the number of assessments per year increased though the demographic profile ofthose assessed for treatment remained the same: male (62%), white ethnic origin (94%) and average age 65.7years. The average amount of alcohol consumed per week was 102.91 units. Most were drinking alcohol on adaily basis (79%), mainly spirits (79%), at home (84%), alone (82%) and ‘to reduce tension/anxiety’ (22%). Theaverage length of having had an alcohol problem was 9.7 years. Significant gender differences were found interms of demographic profile and drinking patterns.Conclusions: The older adults assessed for alcohol treatment were drinking in amounts comparable to thetreatment population of younger adult problem drinkers, men more so than women. The majority were notreporting problems with their drinking until they were on average in their middle-to-late 50s and were thereforeconsidered to be late onset ‘reactors’ rather than early onset ‘survivors’ of longer term heavy drinking patternsreported in earlier studies.
Keywords: elderly; alcohol problem; alcohol treatment
Introduction
With a growing population of older adults (age 60þyears), it is reasonable to expect a concomitant increasein the absolute number of older adults who drinkalcohol problematically (Drummond et al., 2005).Despite this, the UK Government concerns andmedia hype about the adverse effects of excessivealcohol consumption have not resulted in any mentionof older adults in the current government strategy onalcohol (Department of Health, 2007; Wadd,Lapworth, Sullivan, Forester, & Galvani, 2011). Sucha lack of recognition thereby makes it likely that an‘invisible epidemic’ (Widlitz & Marin, 2003) or a‘hidden epidemic’ (O’Connell, Ai-Vryn, Cunningham,& Lawlor, 2003) of older drinkers may come tofruition.
Prevalence rates of older adult problem drinkershave been reported to range from 5% to 23%(Carrington, Reid, Tinetti, Brown, & Concato, 1998).The UK General Household Survey (Goddard, 2006)indicated that 22% of men and 11% of women overthe age of 65 exceed government recommended limitsset for regular alcohol consumption in adults ofworking age (Department of Health, 2007).Furthermore, there is evidence that older adults aremore likely to drink on five or more days per week(28% men, 16% women) compared to those aged16–24 years (9% of men, 3% of women; NHS,
The Information Centre for Health and Social Care,
2008). A more worrying fact is that we have everyreason to believe that today’s older generation mightbe relatively heavier drinkers than previous generationsdue to greater social availability and acceptability ofalcohol during their working years (Institute ofAlcohol Studies [IAS], 2009; Wadd et al., 2011),higher levels of disposable income in retirement with
more time to drink and increased availability of cheapalcohol in UK supermarkets (McGrath, Crome, &Crome, 2005).
A plethora of descriptive literature exists about thehealth effects of alcohol on the older population andthe complications that arise from alcohol and theageing process (e.g. Crome, 1997; Dar, 2006). It is wellestablished that an increasing biological sensitivity to
alcohol occurs with age so that older drinkers needsmaller quantities than younger drinkers to get thesame effects of intoxication on motor co-ordinationand memory (Atkinson, 2002; Oslin, Pettinati, &Volpicelli, 2002). This is due to bodily changes,health problems, psychiatric co-morbidity, etc. Yet,there are no official ‘safe limits’ set for the older
drinker; the US National Institute of Alcohol Abuseand Alcoholism (NIAAA) however, recommended nomore than one standard drink per day and no morethan seven drinks per week for those over 65 years ofage (NIAAA, 1995). In the UK, it has been
*Corresponding author. Email: [email protected]
Dow
nloa
ded
by [
Uni
vers
ity o
f Sy
dney
] at
00:
59 0
2 Se
ptem
ber
2014

Aging & Mental Health 25
recommended that no more than one unit of alcoholfor women and one and a half units for men should beconsumed per day (Clough, Hart, Nugent, Fox, &Watkins, 2004). Older people have been found to bethe least well informed about alcohol units (Dar, 2006),may well be taking concomitant medications whichcould react adversely with alcohol (Atkinson, 2002)and are most likely to self-medicate for reasonspertaining to negative affect, e.g. depression, boredomand anxiety (Atkinson, 2002). All of these factorscombine to make them particularly vulnerable tohazardous/harmful levels of consumption (Waddet al., 2011).
Key factors associated with drinking in the oldergeneration include observations that: many stop drink-ing altogether (especially women) or at least, reducetheir alcohol consumption; for those who carry ondrinking problematically, men are more likely thanwomen to exceed sensible daily limits (23% for men,14% for women; Goddard, 2006); and a significantminority of over 65-year olds will report drinking on adaily basis (22% of men,12% of women; Goddard,2006), a rate greater than their younger counterparts.
It is accepted that there are two, if not threecategories of drinkers in the older adult population:early onset (‘survivors’ of a lifetime of problemdrinking); late onset (‘reactors’ to life events later inlife) and intermittent, at any age of onset, (bingedrinkers who consume 45 drinks in a drinkingepisode). For the early onset or ‘survivors’, prevalencerates have varied from 66% to 70% of older problemdrinkers, often with a family history of problemdrinking and a long history of medical problems suchas cirrhosis, organic brain syndromes or psychiatricproblems throughout most of their adult lives(Atkinson, 2002; McGrath et al., 2005; Menninger,2002). They typically develop drinking problems intheir 20s or 30s.
Late onset ‘reactors’, on the other hand, areestimated to make up one-third of the older problemdrinkers, typically developing their drinking problemsafter the age of 50 years (McGrath et al., 2005) inresponse to a life event/stressor. These are the peoplewho are materially better off, better educated and withfewer physical and mental health problems associatedwith their drinking (Atkinson, 2002; Brennan & Moos,1991; IAS, 2009), although many have been heavydrinkers in the past or simply increase their ‘risky’drinking in response to life events in later life(Atkinson, 2002). From a poll of 857 UK adults aged60þ years, 13% increased their drinking followingretirement: of these, 19% reported this was becausethey were depressed and 13% reported this was to copewith bereavement (Scriminger, 2010). Not surprisingly,it is the late onset drinkers who either recover naturally(without treatment) (Menninger, 2002) or have bettertreatment outcomes than early onset drinkers(Atkinson, 2002; Schutte, Brennan, & Moos, 1998).Referrals of older adults to specialist alcohol treatmentservices would therefore be expected to be dominated
by the early onset survivors based on the higher
number of alcohol-related problems.Intermittent or binge drinkers drink to excess only
occasionally, although such excesses can cause amultitude of problems in the older adult (IAS, 2009).
Intermittent or binge drinking is related to pattern ofdrinking and could be of early or late onset. However,
as such drinkers demonstrate skills of abstinence or
controlled drinking in between episodes of excessivedrinking, this group is often undetected by profes-
sionals as having a drink problem, no matter what age(Tuunanen, Aalto, & Seppa, 2007).
Despite reported treatment success with older
drinkers (Atkinson, 2002; Lemke & Moos, 2002,2003; Oslin et al., 2002; Rice, Longabaugh, Beattie,
& Noel, 1993), worrying levels of under-detection of
problem drinking in older adults remain in health caresettings (Lemke & Moos, 2002; Wadd et al., 2011).
Lemke and Moos (2002) referred to ageism in thetreatment setting and O’Connell et al. (2003) went as
far as calling it ‘treatment nihilism’ (p. 666). In the
absence of a routine screening programme, attempts toquantify the levels of identification by GPs/psychia-
trists of older problem drinkers have revealed a widerange from 5% (Callahan & Tierney, 1995; Cheeta
et al., 2008) to 37% (Atkinson, 2002). It is generally
accepted that only about one-third of older problemdrinkers are recognised in hospital populations (Dar,
2006; McGrath et al., 2005) despite up to 60% ofelderly hospital admissions for conditions such as
confusion, falls, recurrent chest infections and heart
failure, having possible undetected alcohol problems(Royal College of Physicians, see IAS Fact Sheet
2009), and this has been known for the past 20 years(e.g. Curtis, 1989 cited in Dar, 2006). Reasons for
under-detection in health settings of what is deemed a
growing ‘epidemic’ of older problem drinkers are wellrecognised and include factors to do with: lack of
awareness and inadequate training in health profes-sionals (Crome, 1997); defensiveness and evasiveness in
the drinkers themselves (Dar, 2006; McGrath et al.,
2005); society’s attitudes that stereotype older drinkers;family shame and embarrassment (IAS, 2009; Wadd
et al., 2011) and inadequate screening tools for an olderpopulation (Crome, 1997; Dar, 2006). Because of such
under-detection of problem drinking in older adults,
little is known about who actually makes it to alcoholtreatment services. This study therefore aimed to
examine a population of older adults referred forspecialist alcohol treatment over a 20-year time period
beginning in 1988 to determine who were actually
entering treatment services.
Research question
What are the characteristics of a treatment populationof older problem drinkers (60þ years) presenting for
community alcohol treatment assessments?
Dow
nloa
ded
by [
Uni
vers
ity o
f Sy
dney
] at
00:
59 0
2 Se
ptem
ber
2014

26 M.M. Christie et al.
Method
The targeted Community Alcohol Team (CAT) was anoutpatient service well established since 1975 andsituated within an NHS Mental Health Trust in theUK, within a network of mental health and voluntaryservices. The service covered a city and county areaand stood alone in the provision of tertiary careservices to the client group in the area. Referrals weremainly from a variety of professional sources, e.g. GPs,probation services and social services, as well as someself or family referrals in the early years. Client-centredalcohol treatment goals included: controlled drinkingtraining; gradual reduction of drinking and/or trainingin abstinence from alcohol. A multi-disciplinary teamof alcohol ‘counsellors’ (including psychiatrists, psy-chologists, community psychiatric nurses and socialworkers) offered a key worker system through anegotiated care plan with one-to-one psychosocialtreatments and counselling; support for friends andfamily; GP liaison; referrals on to other agencies andhome or hospital detoxification if required.
Participants
Participants were selected from an existing servicedatabase containing details of all clients assessed by thetarget CAT between April 1988 and March 2008(11,829 assessments in all). From this database, allclients aged 60þ years at the time of their firstassessment since turning 60 years old were selectedfor the purpose of this study; there were no exclusions.The resultant older adult population comprised dataon 755 assessments, 6.5% of all alcohol assessmentsconducted between April 1988 and March 2008. These755 assessments related to 585 individuals as someindividuals were assessed more than once sinceturning 60.
Measures
Client information was obtained from a structuredassessment interview with a clinical team member,guided by an initial assessment form containingquestions about the individual’s socio-demographics(e.g. age, ethnicity and marital status,) and drinkingdetails (e.g. frequency of drinking, preferred beverageand with whom drinking). No structured self-assessments or standardised measures were used.Daily consumption was calculated from a one-weekretrospective diary of number of drinks consumed perday in a ‘typical’ drinking week. ‘Reasons for drinking’were recorded in a list on the assessment form, withonly the first one being computer inputted on theassumption that this was the most salient. All datawere therefore self-reported. Although the datarecorded varied over the time period due to develop-ments of the assessment form, for this analysis, onlyinformation that was available for the whole dataperiod (Table 1) was used for the analysis.
Procedure
The data included in this study were routinely collectedby the target alcohol service and the researchers hadfull-authorised access to the information as NHSservice employees. The local NHS ethics committeetherefore considered full ethical approval to be unnec-essary. Clients were informed that the anonymiseddata could be used for service monitoring and/orresearch purposes in the services leaflet and by theassessing clinicians.
After selecting the population of older adultdrinkers, a new database was formed for analysis.Where missing data were identified, clients’ case noteswere examined to ensure the dataset was as complete aspossible. Table 1 also shows the amount of datamissing following this exercise. Reasons for missingdata were largely due to assessment forms beingincomplete, particularly if clients were only seen for aone-off advice session or if the client was currentlyabstinent from alcohol. Overall, the level of missingdata was considered to be acceptable for this study.
Once the dataset was considered to be as completeas possible, variables were assessed to see how thecoding of responses had changed over the years. Datain some years needed to be recoded in order to reduceit to the smallest number of categories used over thestudy period.
Analysis
Preliminary analyses showed that there were very fewchanges over time in the profile and drinking patternsof all the older adults assessed for alcohol treatment
Table 1. Socio-demographic and drinking variables andcorresponding missing data.
Data itemMissingdata (n) Percentage
Socio-demographic details at assessmentAge 0 0Sex 0 0Ethnicity 7 1Marital status 16 2Employment status 16 2Legal status 64 8
Drinking details at assessmentFrequency of drinking 17 2Preferred beverage 18 2With whom drinking 62 8Main place of alcoholconsumption
51 7
Amount of alcohol consumedeach week (units)a
43 6
Reasons for drinking 37 5Length of alcohol problem 111 14
Notes: aSixty-five individuals (12%) were abstinent at thetime of assessment and were therefore not consuming anyalcohol. They were subsequently removed from analysescalculating amount of alcohol consumed. Both men andwomen were equally likely to report being abstinent.
M.M. Christie
Dow
nloa
ded
by [
Uni
vers
ity o
f Sy
dney
] at
00:
59 0
2 Se
ptem
ber
2014

Aging & Mental Health 27
between April 1988 and March 2008. Such changes arereported below, but because they were minimal, thedataset was collapsed across the years and analysed asa whole, using SPSS version 18 for Windows, in orderto describe the overall profile and drinking patterns ofthe population of all older adults who had presentedfor alcohol treatment in the 20-year study period.Simple uni- and bi-variate analyses were conducted toexamine individual variables and gender differences.T-tests and chi-squares were carried out whereappropriate.
Results
The total number of assessments of older adultproblem drinkers increased over the 20-year studyperiod, more so for men than for women (Figure 1).The percentage of the over 60s of the total assessmentdataset however remained consistent at 6–7% acrossthe 20-year time period.
Overall socio-demographic profile
Tables 2 and 3 detail the overall socio-demographicprofile of those aged 60þ years assessed by the
0
10
20
30
40
50
60
70
1988
-89
1989
-90
1990
-91
1991
-92
1992
-93
1993
-94
1994
-95
1995
-96
1996
-97
1997
-98
1998
-99
1999
-00
2000
-01
2001
-02
2002
-03
2003
-04
2004
-05
2005
-06
2006
-07
2007
-08
Year of Assessment
Fre
quen
cy
Males
Females
All Assessments
Figure 1. Total number of alcohol assessments with older adults (60þ years) 1988–2008 (N¼ 755).
Table 2. Socio-demographic characteristics at first alcoholtreatment assessment since turning 60 years of age (n¼ 585).
Socio-demographiccharacteristics Male (%) Female (%) Total (%)
Sex 360 (61.5) 225 (38.5) 585
EthnicityWhite 321 (91) 220 (99) 541 (94)Asian 28 (8) 1 (0) 29 (5)Black 4 (1) 1 (0) 5 (1)Other (not specified) 1 (0) 1 (0) 2 (0)
Marital statusa
Married/cohabiting 201 (57) 95 (44) 296 (52)Widowed 34 (10) 88 (41) 122 (21)Divorced 51 (14) 16 (7) 67 (12)Single 51 (14) 11 (5) 62 (11)Separated 17 (5) 6 (3) 23 (4)
Employment statusa
Retired 201 (57) 160 (73) 361 (63)Unemployed 82 (23) 18 (8) 100 (18)Employed 67 (19) 26 (12) 93 (16)Houseworker 0 (0) 12 (6) 12 (2)Other (not specified) 1 (0) 2 (1) 3 (1)Legal statusNo 304 (92) 205 (99) 509 (94)Yes 28 (8) 3 (1) 31 (6)
Note: a�2, p¼50.01.
Dow
nloa
ded
by [
Uni
vers
ity o
f Sy
dney
] at
00:
59 0
2 Se
ptem
ber
2014
28 M.M. Christie et al.
target CAT. Most older problem drinkers assessed
were male (62%), and of white ethnic origin (94%).The mean age at assessment was 65.7 years and thisremained reasonably constant over the study period.
The average ages of older women fluctuated over theyears more so than for men but still fell between 60 and70 years of age. Just over half of older adults were
married or cohabiting (52%), most were retired (63%)and very few had a current legal status (6%),particularly the women.
There were statistically significant differencesbetween the sexes on: age, marital status and employ-
ment status. Women were on average 1.83 years olderthan men (t (388.6)¼�3.622, p¼50.01, 95%CI¼�2.83 to�0.84). More men were married/cohabit-
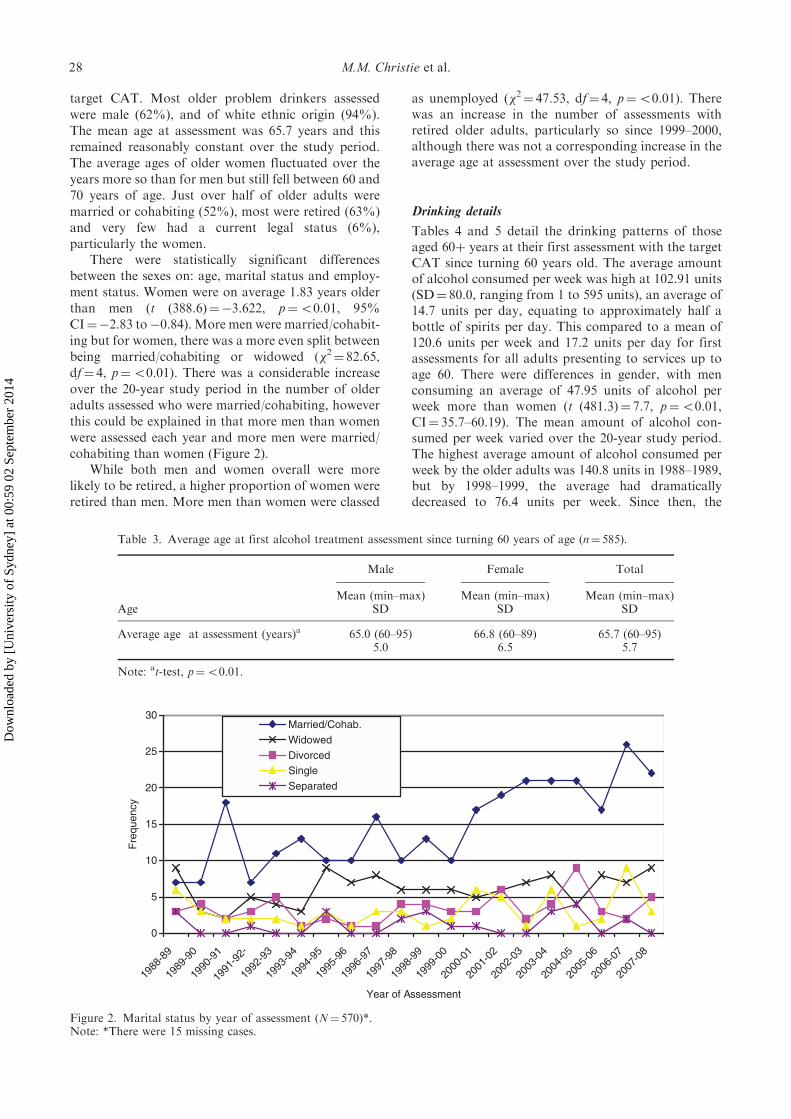
ing but for women, there was a more even split betweenbeing married/cohabiting or widowed (�2¼ 82.65,df¼ 4, p¼50.01). There was a considerable increase
over the 20-year study period in the number of olderadults assessed who were married/cohabiting, howeverthis could be explained in that more men than women
were assessed each year and more men were married/cohabiting than women (Figure 2).
While both men and women overall were morelikely to be retired, a higher proportion of women wereretired than men. More men than women were classed
as unemployed (�2¼ 47.53, df¼ 4, p¼50.01). Therewas an increase in the number of assessments withretired older adults, particularly so since 1999–2000,although there was not a corresponding increase in theaverage age at assessment over the study period.
Drinking details
Tables 4 and 5 detail the drinking patterns of thoseaged 60þ years at their first assessment with the targetCAT since turning 60 years old. The average amountof alcohol consumed per week was high at 102.91 units(SD¼ 80.0, ranging from 1 to 595 units), an average of14.7 units per day, equating to approximately half abottle of spirits per day. This compared to a mean of120.6 units per week and 17.2 units per day for firstassessments for all adults presenting to services up toage 60. There were differences in gender, with menconsuming an average of 47.95 units of alcohol perweek more than women (t (481.3)¼ 7.7, p¼50.01,CI¼ 35.7–60.19). The mean amount of alcohol con-sumed per week varied over the 20-year study period.The highest average amount of alcohol consumed perweek by the older adults was 140.8 units in 1988–1989,but by 1998–1999, the average had dramaticallydecreased to 76.4 units per week. Since then, the
0
5
10
15
20
25
30
1988
-89
1989
-90
1990
-91
1991
-92-
1992
-93
1993
-94
1994
-95
1995
-96
1996
-97
1997
-98
1998
-99
1999
-00
2000
-01
2001
-02
2002
-03
2003
-04
2004
-05
2005
-06
2006
-07
2007
-08
Year of Assessment
Fre
quen
cy
Married/Cohab.
Widowed
DivorcedSingle
Separated
Figure 2. Marital status by year of assessment (N¼ 570)*.Note: *There were 15 missing cases.
Table 3. Average age at first alcohol treatment assessment since turning 60 years of age (n¼ 585).
Male Female Total
AgeMean (min–max)
SDMean (min–max)
SDMean (min–max)
SD
Average age at assessment (years)a 65.0 (60–95) 66.8 (60–89) 65.7 (60–95)5.0 6.5 5.7
Note: at-test, p¼50.01.
Dow
nloa
ded
by [
Uni
vers
ity o
f Sy
dney
] at
00:
59 0
2 Se
ptem
ber
2014

Aging & Mental Health 29
average has crept upwards again, with the most
noticeable increases in 2003–2004, 2005–2006 and
2007–2008 (Figure 3).Overall, spirits were predominantly the preferred
beverages, though a higher proportion of men (33%)
than women (7%) preferred to drink beer/lager or
cider, while more women (31%) than men (8%)
preferred to drink wine (�2¼ 86.38, df¼ 3,
p¼50.001). The majority of older adults were
drinking alcohol on a daily basis (79%), at home
(84%), and alone (82%). A higher proportion of men
(14%) than women (0.5%) were drinking alcohol
predominantly outside of the home (�2¼ 35.74,
df¼ 2, p¼50.01), and mainly with other people
(�2¼ 11.21, df¼ 1, p¼50.01), whereas a higher pro-
portion of women than men were mainly drinking at
home (95% vs. 77%) and alone (89% vs. 78%).The most common perceived reasons for drinking
by men were ‘habit/dependency’ on alcohol (23%) or
‘to reduce tension/anxiety’ (20%), whereas for women,
the most common reasons given were ‘to reduce
tension/anxiety’ (24%) or ‘loneliness, depression and/
or lack of confidence’ (19%). Twice as many men than
women reported that they were predominantly drink-
ing alcohol either because they ‘enjoyed it’ (14% vs.
7%) or because of ‘boredom/something to do’ (10%
vs. 4%) (�2¼ 32.96, df¼ 13, p¼50.01), although the
numbers were small. Overall, the most common reason
given for drinking was ‘to reduce tension/anxiety’
(22%). Aggregated data showed that 49% of older
adults reported they were drinking primarily for
reasons of negative affect (anxiety, depression, bore-
dom, life pressures) and only 4% primarily to help with
‘sleep problems’. Few people (11%) reported they
drank because they ‘enjoyed it’ or for the physical
effect of intoxication (6%). ‘Habit/dependency’ or
‘avoiding withdrawals’, both associated with ‘addic-
tion’, were given as a reason for drinking in only 22%
of older adult assessments.The average length of having perceived to have had
an alcohol problem was 9.7 years (SD¼ 11.2), making
the start of their alcohol problem likely to have been in
their late 50s, given an average age of 65.7 years at first
alcohol treatment assessment since turning 60 years;
men reported to have had an alcohol problem on
average for 3.2 years longer than women (t (463.5)¼3.322, p¼50.01, CI¼ 1.32–5.16).
The profile therefore of the typical female older
problem drinker at assessment for alcohol treatment
was of a 67-year-old daily spirit or wine drinker
(73 units of alcohol per week) who drank at home
alone for reasons of anxiety or loneliness/depression.
The typical problem drinking older male, in contrast,
was a 65-year-old daily spirit or beer drinker (121 units
Table 5. Drinking details at first assessment since turning 60(n¼ 585).
Drinking detailsMale
No (%)FemaleNo (%)
TotalNo (%)
Preferred beveragea
Spirits 171 (48) 125 (57) 171 (51)Beer, lager, cider 116 (33) 16 (7) 132 (23)Wine, sherry 29 (8) 68 (31) 97 (17)No preference 39 (11) 12 (5) 51 (9)
Frequency of drinkingDaily 279 (82) 159 (75) 438 (79)Not daily 61 (18) 53 (25) 114 (21)
Main place of alcohol consumptiona
Home 262 (77) 206 (95) 468 (84)Pubs/clubs 47 (14) 1 (0.5) 48 (9)Other (not specified) 30 (9) 10 (5) 40 (7)
With whom drinkinga
Alone 243 (78) 184 (89) 427 (82)With others 69 (22) 22 (11) 91 (18)
Reasons for drinkinga
Habit/dependency 74 (23) 32 (16) 106 (20)Reduce tension/anxiety 66 (20) 48 (24) 114 (22)Loneliness/depression/lack of confidence
25 (8) 38 (19) 63 (12)
Enjoys it 45 (14) 14 (7) 59 (11)Boredom/somethingto do
31 (10) 8 (4) 39 (7)
Life pressures/oblivion 21 (7) 22 (11) 43 (8)For physical effect 19 (6) 12 (6) 31 (6)Avoid withdrawals 6 (2) 2 (1) 8 (2)Social/family pressures/stress
17 (5) 16 (8) 33 (6)
Work pressures 4 (1) 1 (0) 5 (1)Sleep problems 12 (4) 8 (4) 20 (4)To cope 2 (1) 1 (0) 3 (1)
Note: a�2, p¼50.01.
Table 4. Average units of alcohol consumed per week (abstainers removed) and perceived problem length by sex at firstassessment since turning 60 years of age (n¼ 585).
Male Female Total
Drinking detailsMean (min–max)
SDMean (min–max)
SDMean (min–max)
SD
Amount of alcohol consumed per week (units)a 121.01 (1–595) 73.06 (4–210) 102.91 (1–595)89.7 47.9 80.0
Problem Length (years)a 10.95 (1–50) 7.71 (1–40) 9.70 (1–50)12.2 9.1 11.2
Note: at-test, p¼50.01.
Dow
nloa
ded
by [
Uni
vers
ity o
f Sy
dney
] at
00:
59 0
2 Se
ptem
ber
2014

30 M.M. Christie et al.
of alcohol per week) who drank mostly at home alonefor reasons of habit/dependency or anxiety.
Discussion
This project set out to analyse a 20-year treatmentassessment dataset to describe the population of olderadults (60þ years) who made it through to assessmentfor community-based alcohol treatment. Over the timeperiod, beginning in 1988, there was a 100% increase inreferrals of older adults (60þyears) from a variety ofsources; yet, this consistently made up only 6.5% of thetotal assessment dataset for the whole adult age range.Given that the proportion of older adults presenting toservices remained stable over this time period suggeststhat the increase in referrals was in line with ageing ofthe increasing general population. The preliminaryanalysis revealed levels of alcohol consumption perweek far exceeded the safe government limits set foryounger people for both the older men and women.The older men, as expected, drank at higher levels thanthe women (121 units for men vs. 73 units for womenper week). Overall, most of the older drinkers werespirit drinkers, with women more so than men. Themajority of both sexes preferred to drink at homealone. Reasons given for drinking were predominantlyfor negative affect (e.g. depression and anxiety) andonly 11% drank mainly because they ‘enjoyed it’. Onaverage, the older problem drinkers reported to havehad an alcohol problem for 9.7 years, although therange was 1–50 years. An ad-hoc analysis of the totaltreatment dataset revealed that most of the older adultpopulation were first-time referrals, thus suggestingthat the target alcohol service was assessing late onset‘reactors’ (Atkinson, 2002; Brennan & Moos, 1991;IAS, 2009).
The high levels of alcohol consumption of the over60s referred for alcohol treatment far exceeded those ofthe general population (Goddard, 2006) for any age, let
alone for older drinkers. Additionally, the olderdrinkers were only drinking slightly less than youngerdrinkers (2.4 units per day less) which, given theirlower tolerance for alcohol and the possible use ofconcomitant medication, gives most cause for concern.That our older men drank more than the women wasan expected pattern: the whole treatment dataset showsthis consistently over the 20-year period and has beenfound in the general population of older adults (Dar,2006; Goddard, 2006; Smith & Foxcroft, 2009). Whatwas worrying was the preference for spirits, given itshigh alcohol content, especially for the women, and thehigh rate of isolated home drinking for reasons ofnegative affect, such as depression, loneliness andanxiety.
It was unexpected to find that the targeted NHSalcohol treatment services – a tertiary treatment service(National Treatment Agency for Substance Misuse[NTA], 2006) – were mostly receiving referrals of thelate onset ‘reactors’ to life events/stressors with prob-lems of less than 10 years in length, not the ‘survivors’of long-term alcohol problems with concomitant mul-titudes of physical and mental health problems(Atkinson, 2002; McGrath, et al., 2005; Menninger,2002). Oslin et al. (2002) found their older adultreferrals for alcohol rehabilitation to be more physi-cally damaged and less impaired on psychiatric oraddiction severity. Explanations of why physicalproblems predominate in the older adult drinkersneed further investigation. Late onset drinkers havebeen found to have fewer physical and mental healthproblems (Atkinson, 2002; Brennan & Moos, 1991)although many have been found to have a history of‘risky’ or ‘hazardous’ drinking (Atkinson, 2002;Schutte et al., 1998) which may escalate in responseto a life event such as bereavement, retirement andchronic pain situations common to an older popula-tion. This also needs further investigation. It could bethat the early onset ‘survivors’ who have been found to
0
20
40
60
80
100
120
140
160
180
1988
-89
1989
-90
1990
-91
1991
-92
1992
-93
1993
-94
1994
-95
1995
-96
1996
-97
1997
-98
1998
-99
1999
-00
2000
-01
2001
-02
2002
-03
2003
-04
2004
-05
2005
-06
2006
-07
2007
-08
Year of Assessment
Mea
n A
vera
ge A
mou
nt o
f Alc
ohol
Con
sum
ed p
er W
eek
(uni
ts)
Male
Female
Overall
Figure 3. Average amount of alcohol consumed per week in units by year of assessments (N¼ 490)*.Note: *There were 95 missing cases.
Dow
nloa
ded
by [
Uni
vers
ity o
f Sy
dney
] at
00:
59 0
2 Se
ptem
ber
2014

Aging & Mental Health 31
make up 70% of older adult problem drinkers in thegeneral population (Atkinson, 2002; Brennan & Moos,1991; Dar, 2006) are seen as untreatable (treatmentnihilism) or simply are not being recognised by GPs orother health and/or social care workers because theirlongstanding medical problems (e.g. organic brainsyndromes and psychiatric problems) are being inter-preted as problems of ageing (ageism). On the otherhand, it may well be that the late onset ‘reactors’ arebehaving out of character of their normal selves andare displaying acute problems due to a relatively recentincrease in alcohol consumption far exceeding safelimits set for younger people, coupled with a decreasedalcohol tolerance and biological sensitivity and anincrease in the use of medication for physical ailments.GPs have been found to be more reactive to physicalindicators when prompted to inquire about alcohol(Locke et al., 2010; Wilson et al., 2011) such thatproblem drinkers with alcohol-related social or mentalhealth problems are perhaps being missed. Manyelderly patients with diagnosed drinking problemspresent with physical problems such as falls and asfew as 15% are referred on for rehabilitation (Mulinga,1999).
Implications for healthcare clinicians are to rou-tinely screen for alcohol problems (Cracknell, 2009),no matter how long the problems have been observedor reported. Yet routine screening is not enough: therehas to be treatment optimism (Dar, 2006; Lemke &Moos, 2002) for the older client group and adequatelocal support services (self-help/counselling) as incen-tives for healthcare workers to intervene for alcoholproblems (Locke et al., 2010; Wilson et al., 2011).
Further analysis of this service dataset is underwayto examine the drinking patterns of the older adults inmore detail to: find predictors of amount drinking perweek; make comparisons with the younger and middle-aged problem drinkers; examine differential treatmentoutcomes and examine levels of treatment engagementin the older problem drinkers.
This study was an initial retrospective descriptiveanalysis of a large continuous dataset of alcoholtreatment assessments collected over a 20-yearperiod. The data collection form was a clinical toolprimarily to assess clients’ needs and to plan treatment,not a primary research tool. Data were collected by avariety of clinicians via one-to-one clinical interviewswith all of the pressures on patients for sociallydesirable responding; all data were self-reported.While self-reports of amount of alcohol consumedhave long been shown to be reliable and valid (Brown,Kranzler, & Del Boca, 1992; Del Boca & Darkes,2003), the reliability of self-report for other informa-tion remains unclear. The data analysed here wascollected for the purposes of assessment for alcoholtreatment and not necessarily for research purposeshence the lack of objective checks for accuracy orcorroborate verifications. Whilst this limits the data interms of research, a research study collecting such dataover a 20-year period would be time consuming,
expensive and cumbersome. So, while entirely based
on self-report, the data presented here still serve toprovide a longer term view of the characteristics ofolder adults presenting for assessment for alcoholtreatment services.
Changes over the 20-year time period in the needs
of commissioners and/or managers for monitoringinformation meant that the key categories of thedataset were altered and recoded to meet demand,leaving a minimum dataset that was fairly basic. Dataon prescribed and over-the-counter medication were
inconsistently recorded between and within individualclinicians and were therefore excluded from thedataset. Psychiatric diagnoses were also poorlyrecorded due in part to the wide variety of clinical
staff doing the assessments. Simplification of thedataset was therefore preferred by the research teamto increase accuracy of the data over the 20 yearsrather than reverting to a complex research dataset
that required more skill or training for collection and/or coding and inputting. Missing data on the originaldatabase were conscientiously sought from thearchived case files by the researchers. As a result, the
dataset is unique and robust, albeit basic, and isconsistent and continuous over the 20-year period ofdata collection.
The category of ‘problem length’ in the baselineanalysis was not developed in this study beyond whatthe client reported in response to the question: ‘how
long have you had an alcohol problem?’. It wasrecognised that some people would answer this inrelation to this episode for problem drinking, whilstothers might answer it in terms of a lifetime of drinking
problematically. Different clinicians would treatthe data differently and no checks were made by theresearchers for corroborative information from thecase files or referral letters because the population wasso large. Future analysis will need to check further into
the clients’ records to make this as accurate andconsistent as possible in order to pursue the finding ofpredominately late onset drinkers being referred to theservices.
Nevertheless, this study, using a unique and robust
alcohol assessment dataset covering a 20-year period,provided an initial profile of a UK treatment popula-tion of older adult problem drinkers: a populationdrinking far in excess of recommended limits who inthe main were not recognised as having problems with
their drinking until they were, on average, in theirmiddle-to-late 50s.
References
Atkinson, R.M. (2002). Alcohol use in later life. American
Journal of Geriatric Psychiatry, 10, 649–652.
Brennan, P.L., & Moos, R.H. (1991). Functioning, life
context and help-seeking among late-onset problem
drinkers: Comparisons with non-problem and early-onset
Dow
nloa
ded
by [
Uni
vers
ity o
f Sy
dney
] at
00:
59 0
2 Se
ptem
ber
2014

32 M.M. Christie et al.
heavy drinkers on skid row. British Journal of Addiction,
86, 1139–1150.Brown, J., Kranzler, H.R., & Del Boca, F.K. (1992). Self-
reports by alcohol and drug abuse inpatients: Factors
affecting reliability and validity. British Journal of
Addiction, 87, 1013–1024.Callahan, C.M., & Tierney, W.M. (1995). Health services use
and mortality among older primary care patients with
alcoholism. Journal of American Geriatric Society, 43,
1378–1383.
Carrington, R.M., Tinetti, M., Brown, C.J., & Concato, J.
(1998). Physician awareness of alcohol use disorders
among older patients. Journal of General Internal
Medicine, 13, 729–734.Cheeta, S., Drummond, C., Oyefeso, A., Phillips, T., Deluca,
P., Perryman, K., & Coulton, S. (2008). Low identification
of alcohol use disorders in general practice in England.
Addiction, 103, 766–773.
Clough, R., Hart, R., Nugent, M., Fox, D., & Watkins, C.
(2004). Older people and alcohol: A Summary and recom-
mendations arising from research in Ayreshire and Arran.
Lancashire: Third Sector First. Retrieved from
www.3sf.co.uk/publications.htm
CraCknell, A. (2009, March 20). Alcohol and older people.
British Geriatrics Society News Letter.
Crome, I.B. (1997). Alcohol problems in the older person.
Journal of Research in Social Medicine, 90, 16–22.
Dar, K. (2006). Alcohol use disorders in elderly people: Fact
or fiction? Advances in Psychiatric Treatment, 12, 173–181.
Del Boca, F.K., & Darkes, J. (2003). The validity of
self-reports of alcohol consumption: State of the sci-
ence and challenges for research. Addiction, 98(Suppl. 2),
1–12.Department of Health (2007). Safe, sensible, social: The next
steps in the national alcohol strategy. London: HMSO.Drummond, D.C., Oyefeso, N., Phillips, T., Cheeta, S.,
DeLuca, P., Winfield, H., . . .Christopolous, A. (2005).
Alcohol needs assessment research project: The 2004
National alcohol needs assessment for England. London:
Department of Health.Goddard, E. (2006). General household survey 2006: Smoking
and drinking among adults, 2006. London: Office of
National Statistics, HMSO.Institute of Alcohol Studies (IAS) (2009, January 26).
Alcohol and the elderly. Fact Sheet.Lemke, S., & Moos, R.H. (2002). Prognosis of older patients
in mixed-age alcoholism treatment programs. Journal of
Substance Misuse Treatment, 22, 33–43.
Lemke, S., & Moos, R.H. (2003). Outcomes at 1 and 5 years
for older patients with alcohol use disorders. Journal of
Substance Misuse Treatment, 24, 43–50.Locke, C., Wilson, G., Kaner, E., Cassidy, P, Christie, M.M.,
& Heather, N. (2010). A survey of general practitioners’
knowledge, attitudes and practices regarding the prevention
and management of alcohol-related problems: An update of
a World Health Organisation survey 10 years on. A reportto the Alcohol Education and Research Council.
McGrath, A., Crome, P., & Crome, I.B. (2005). Substancemisuse in the older population. Postgraduate MedicalJournal, 81, 228–231.
Menninger, J.A. (2002). Assessment and treatment of
alcoholism and substance related disorders in the elderly.Bulletin of the Menninger Clinic, 66, 166–184.
Mulinga, J.D. (1999). Elderly people with alcohol-related
problems: Where do they go? International Journal ofGeriatric Psychiatry, 14, 564–566.
National Institute of Alcohol Abuse and Alcoholism
(NIAAA) (1995). The physicians’ guide to helping patientswith alcohol problems. Rockville, MD: NIAAA.
National Treatment Agency for Substance Misuse (NTA)(2006). Models of care for treatment of adult drug misusers:
Update 2006. London: NTA.NHS, The Information Centre for Health and Social Care(2008). Statistics on alcohol: England 2008. London:
HMSO.O’Connell, H., Ai-Vryn, C., Cunningham, C., & Lawlor, B.(2003). Alcohol use disorders in elderly people: Redefining
an age old problem in old age. British Medical Journal,327, 664–667.
Oslin, D.W., Pettinati, H., & Volpicelli, J.R. (2002).
Alcoholism treatment adherence: Older age predictsbetter adherence and drinking outcomes. AmericanJournal of Geriatric Psychiatry, 10, 740–747.
Rice, C., Longabaugh, R., Beattie, M., & Noel, N. (1993).
Age-group differences in response to treatment forproblematic alcohol use. Addiction, 88, 1369–1375.
Schutte, K.K., Brennan, P.L., & Moos, R.H. (1998).
Predicting the development of late-life late-onset drinkingproblems: A 7-year prospective study. Alcohol: Clinical andExperimental Research, 22, 1349–1358.
Scriminger, S. (2010, March 30). Increased alcohol con-sumption among the retired. Alcoholics: The Bulletin of theMedical Council on Alcohol, pp. 2–4.
Smith, L., & Foxcroft, D. (2009). Drinking in the UK: Anexploration of trends. Oxford: Joseph RowntreeFoundation.
Tuunanen, M., Aalto, M., & Seppa, K. (2007). Binge
drinking and its detection among middle-aged men usingAUDIT, AUDIT-C and AUDIT-3. Drug and AlcoholReview, 26, 295–299.
Wadd, S., Lapworth, K., Sullivan, M., Forester, D., &Galvani, S. (2011). Working with older drinkers. TildaGoldberg Centre for Social Work and Social Care,
University of Bedfordshire.Widlitz, M., & Marin, D.B. (2003). Substance abuse in olderadults: An overview. Geriatrics, 57, 29–34.
Wilson, G.B., Lock, C., Heather, N., Cassidy, P., Christie,
M.M., & Kaner, E.F.S. (2011). Intervention againstexcessive alcohol consumption in primary health care: Asurvey of GPs’ attitudes and practices in England ten years
on. Alcohol and Alcoholism, 46, 570–577.
Dow
nloa
ded
by [
Uni
vers
ity o
f Sy
dney
] at
00:
59 0
2 Se
ptem
ber
2014