Old age, height and nutrition: Common misconceptions...
31
Old age, height and nutrition: Common misconceptions about medieval England Felinah Memo Hazara Khan-ad-Din Caidan Pentathlon, March 2003
Transcript of Old age, height and nutrition: Common misconceptions...
Old age, height and nutrition:
Common misconceptions about medieval England
Felinah Memo Hazara Khan-ad-DinCaidan Pentathlon, March 2003
Old Age, Height and Nutrition: Felinah Memo Hazara Khan-ad-DinCommon Misconceptions About Medieval England [email protected] paper, Caidan Pentathlon, March 2003
I. Introduction: The benefit of the original records.
Just as introspection enriches our life experience and our personal relationships, examining
history enriches our understanding of society and how people have responded to common
challenges under many different circumstances. Expanding historical study to visualize the
everyday lives of the individuals involved enhances these benefits greatly, but reveals the
complexity of such study. Understanding any complex subject requires simplification, and
medieval history is no exception. Therefore, it is natural to use personal experience to help
create a mental model of medieval everyday life. The relative dearth of written records in
medieval England, especially prior to the 14th century, only strengthens the tendency to fill out
the medieval life experience by analogy to the better-documented 18th and 19th centuries, or even
to our modern experience.
While generalization and analogy provide a necessary starting point for any student of
medieval history, recourse to the actual records provides an essential “reality check”. For
contrary to a common subconscious bias, historical trends do not progress steadily over time,
and many correlations valid during the better-documented periods cannot be accurately
projected back into the medieval period. Such study of the medieval record often reveals
fascinating misconceptions concerning the medieval experience, and this paper explores three
such misconceptions.
The first concerns the perception of life span. Surrounded by facts and measurements in
modern society, most people know that today, on average, babies born in the United States or
Great Britain will live 70 to 80 years. This reflects the statistical calculation that half of the
babies born in a particular year will live into their later eighth decade; i.e., the statistical average
life span from birth today is between 75 and 80. When an adult is asked how long he or she
expects to live, the answer will typically center on this statistical average. So an adult of 30
years would commonly answer that he or she expected to live another 40 to 50 years. Although
the definition of “old age” tends to vary with the age of the individual being questioned, most
Old Age, Height and Nutrition: Felinah Memo Hazara Khan-ad-DinCommon Misconceptions About Medieval England [email protected] paper, Caidan Pentathlon, March 2003
adult residents of the United States or Britain would also agree that 70 to 80 is definitely “old”,
although 60 is questionable.
In medieval England, the statistical average life span from birth was between 20 and 25
years1, yet a medieval Englishman of 30 years expected to live into his or her early 50s. Some
students of history, aware of the statistical average life span, assume that medieval Englishmen
considered 40 to be old. In fact, a medieval English adult most probably considered 50 years
about the beginning of “old age”.
The second misconception concerns average adult height in medieval England. Certainly the
17th century swashbuckler and the Victorian gentleman were a few inches shorter than their
modern descendents. This period of English history also saw mortality (death) rates about
twice the modern level, supporting the evidence of poor nutrition and harsh living conditions
presented by the short average adult height2. Since medieval mortality rates were even higher
than those in 17th through 19th century England, logic indicates an even shorter stature for
medieval Englishmen3. But, despite a very short statistical average life span from birth,
medieval English men and women were only about an inch shorter than those measured in 1984
(see Table 2 and Figure 2 below), indicating that nutritional status was sufficient for near-
modern height.
This leads to the third misconception investigated in this paper — the connection between
nutritional status and mortality rates. The greatest killer in all pre-modern societies has always
been infectious disease4, and poor nutritional status increased the death rate from diseases
prevalent in 18th and 19th century England5, so the short stature of the 18th century Englishmen
predicted his relatively short life span. Yet in medieval England, the epidemic diseases most
responsible for mortality were unaffected by nutritional status6, disconnecting high mortality
rates from stature and living conditions.
Old Age, Height and Nutrition: Felinah Memo Hazara Khan-ad-DinCommon Misconceptions About Medieval England [email protected] paper, Caidan Pentathlon, March 2003
II. Old age — how long did a medieval English adult expect to live?
What determines how long a person expects to live? The modern American or British
answer to “How long do you expect you’ll live?” equates roughly with the statistical average
life span from birth. Similarly, ages above this figure are included in the category of “elderly”,
although some argue about the starting point for that category. Based on statistical analysis of
medieval records, the average life span of medieval English babies was only 20 to 25 years. Yet
several lines of evidence indicate that an adult medieval English landowner expected to live to
more than twice that age — into his sixth decade. Perception of expected life span, not
statistics, defines “old age”, so people in medieval England did not consider those under 50
years as “old” and would not have been surprised by “elderly” colleagues living into their 60s.
Since medieval Englishmen had no idea of their statistical average life span from birth, what
created these expectations?
Due to limits in the available documentation, discussion of expected life span in medieval
England must focus on men of the landowning classes. Medieval records examined in such
discussions emphasized the land-holding class and, with the exception of the Domesday report
of 1086, did not exist in significant detail prior to the mid-13th century. Few manorial and
monastery accounts (extents) and church benefices were recorded prior to late 13th century,
while inquisitions post mortem for land-owners were first recorded in the mid-13th century.
Increasing numbers of genealogies and wills, as well as the poll tax of the laity of 1377 enrich
the records for 14th century. By the end of the 16th century, parish records recorded deaths
caused by plague and other vague categories of disease along with their other records for all
classes of society. The highly detailed records of deaths categorized by cause begin in the mid-
19th century7.
From these data, statistical analysis can provide average and age-specific mortality rates.
Average mortality rates measure the number of deaths/1000 of the mid-year population. But
knowing that four to five times as many medieval individuals died per 1000 population in a
year versus modern Britain8 does little to personalize medieval life. Such data require
Old Age, Height and Nutrition: Felinah Memo Hazara Khan-ad-DinCommon Misconceptions About Medieval England [email protected] paper, Caidan Pentathlon, March 2003
calculation of age-specific mortality rates, or the number of deaths in a year/1000 of the
individuals of that age in that year. Infant mortality specifically refers to the mortality rate from
birth to one year. Although not traditional in demographic articles, mortality rates in this paper
will be expressed as percentages (deaths per 100 individuals), to increase recognition and
comparison of such rates.
The statistical manipulations of age-specific mortality rates that generate the average life
span from birth, or average life span from a specific age are explained in Appendix A. Russell9
provides the best analysis of medieval mortality and life spans in his study of medieval male
landowners from the 1200s to 1450. Rosenthal10 analyzed records of medieval peers
summoned to court from 1300-1500, while other authors have studied specific monastery and
village records encompassing different segments of the medieval period. For comparison,
Ascadi and Nemeskeri11 have provided a detailed analysis of early medieval eastern European
life spans.
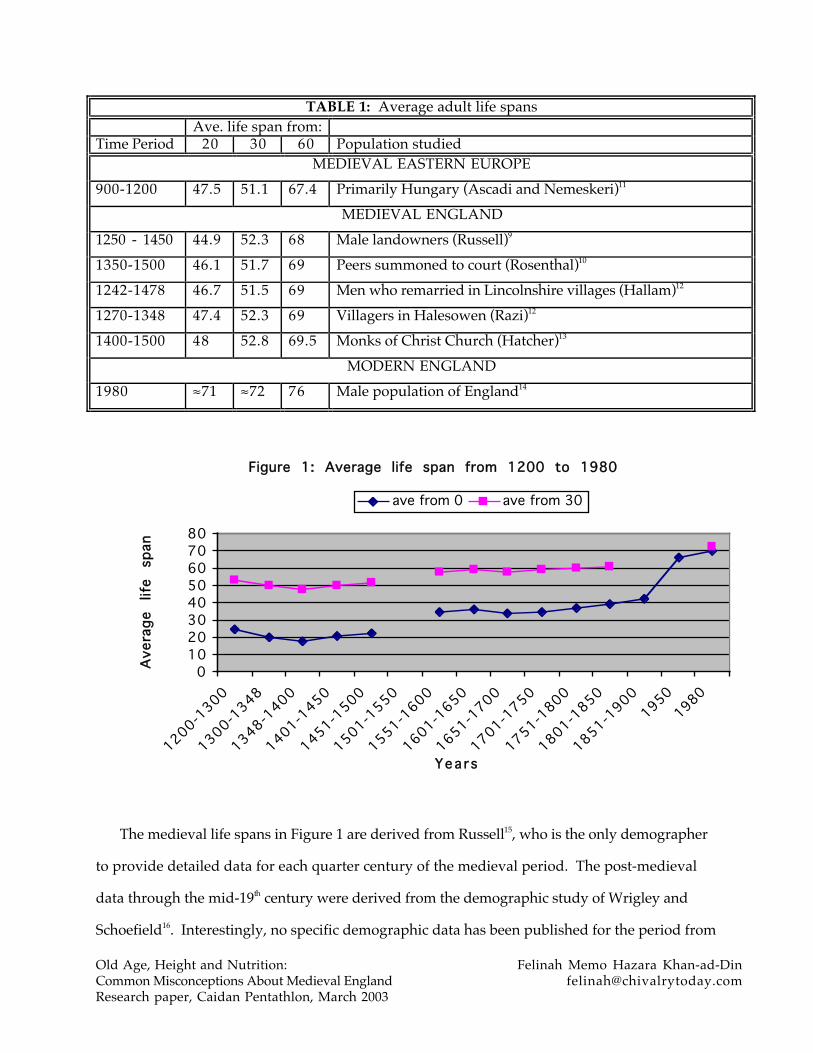
As shown in Table 1 on the following page, the average life spans of medieval British adults
reaching age 30 are remarkably consistent between several studies. Throughout the medieval
period, 30-year-old men from different segments of the population lived on average to about 52
years.
Figure 1 on the following page compares the statistical average life spans from birth and for
adults reaching age 30 over the past several centuries. Appendix B details the data sources and
calculations used to provide the figures in Table 1 for each study and for each time period in
Figure 1.
Old Age, Height and Nutrition: Felinah Memo Hazara Khan-ad-DinCommon Misconceptions About Medieval England [email protected] paper, Caidan Pentathlon, March 2003
TABLE 1: Average adult life spansAve. life span from:
Time Period 20 30 60 Population studiedMEDIEVAL EASTERN EUROPE
900-1200 47.5 51.1 67.4 Primarily Hungary (Ascadi and Nemeskeri)11
MEDIEVAL ENGLAND1250 - 1450 44.9 52.3 68 Male landowners (Russell)9
1350-1500 46.1 51.7 69 Peers summoned to court (Rosenthal)10
1242-1478 46.7 51.5 69 Men who remarried in Lincolnshire villages (Hallam)12
1270-1348 47.4 52.3 69 Villagers in Halesowen (Razi)12
1400-1500 48 52.8 69.5 Monks of Christ Church (Hatcher)13
MODERN ENGLAND1980 ≈71 ≈72 76 Male population of England14
Figure 1: Average life span from 1200 to 1980
01020304050607080
1200-1300
1300-1348
1348-1400
1401-1450
1451-1500
1501-1550
1551-1600
1601-1650
1651-1700
1701-1750
1751-1800
1801-1850
1851-1900
19501980
Years
Ave
rage
lif
e sp
an
ave from 0 ave from 30
The medieval life spans in Figure 1 are derived from Russell15, who is the only demographer
to provide detailed data for each quarter century of the medieval period. The post-medieval
data through the mid-19th century were derived from the demographic study of Wrigley and
Schoefield16. Interestingly, no specific demographic data has been published for the period from
Old Age, Height and Nutrition: Felinah Memo Hazara Khan-ad-DinCommon Misconceptions About Medieval England [email protected] paper, Caidan Pentathlon, March 2003
1450 to 1550. Detailed mortality records originated in the mid-19th century, and the Registrar
General of England and Wales provide data from this period through modern times.
The difference between average life span from birth and average life span from 30 years in
each time period in Figure 1 is due primarily to infant and early childhood mortality. As
average life spans increased over the centuries, the reduction in this early mortality brought the
average life span from birth much closer to the average life span of an adult at age 30.
Recent medieval demographers have questioned the accuracy of any age-specific mortality
rates for infants and young children, but agree that the first decade of life in medieval England
had by far the highest mortality rate. Probably about 25% of all babies born died in the first
year, and about another 20% of children and adolescents died before age 20.17 This high
childhood mortality is reflected in the average life span from birth during the medieval period,
currently estimated between 20 and 25 years18. Living through childhood and adolescence
meant that the individual had already outlived many of those sharing his or her birth year, so
half of the adults reaching 30 years lived into their sixth decade. Appendix A explains the
concerns of recent demographers with medieval childhood mortality rates.
Figure 1 indicates that a baby born in England in 1980 will live on average to 73 years old.
An individual at age 30 will live on average to about 75, and one living to 60 years will live on
average to 77.5 years of age. Current English infant mortality is only 1.6%, childhood mortality
remains very low, and the highest death rate averaged over a 10-year period occurs from 65 to
74 years of age19. An adult of 30 years in modern England or America knows that about half of
his or her parents’ acquaintances live into their seventies. So in modern England, the statistical
average life span from birth is a reasonable indicator of the expected life span of an adult.
Since medieval Englishmen did not calculate a statistical average life span from birth, how
long did medieval people really expect to live? Three lines of evidence support the proposition
that medieval English adults viewed 50 to 55 as a “normal” average life span.
The first line of evidence concerns how and when children learn the length of a “typical”
lifespan — how long they will expect to live. Children first develop the ability for abstract
Old Age, Height and Nutrition: Felinah Memo Hazara Khan-ad-DinCommon Misconceptions About Medieval England [email protected] paper, Caidan Pentathlon, March 2003
thought at about age 720. Children learn the length of a “typical” lifespan from their parents
after this age, both by hearing discussion and observing their parents’ response to deaths
around them. A medieval woman of the landholding class in 1300 married at an average age of
2421, and so might expect her first child by age 26. So a medieval child began learning the length
of an expected lifespan from parents who were typically in their 30sa. At that age the parents’
expectations, established by observing about half of their parents’ acquaintances living into their
sixth decade, would center on 50 to 55 years.
A second line of evidence drawn from statistical analysis of ages at death in early medieval
Hungary supports the first line. The average mortality rate for Hungary during this early
medieval period is close to that of England, and the average life span of adults reaching age 30
is very similar to those in medieval England in non-plague years22. Using skeletal evidence, the
authors calculated the death rate for each year of life in that time period. In this study, the age-
specific death rate fell from a maximum of 20% during the first year of life to below 2% per year
by age 5b, and never exceeded 2% per year again. The largest increase in death rate per year
after age 5 occurred between ages 50 and 55. This age would correlate to the most common age
of death observed by adults, supporting the first line of evidence. The authors explain that
statistically, this largest increase in mortality in adults represents the “normal” length of life of
adults23.
The third line of evidence is drawn from the writings of an early medieval author. Bishop
Isadore of 7th century Spain outlined six ages of man in his “Etymologies”, a manuscript widely
read during the medieval period. He defined “infancy” from birth to age 7, “childhood” from
age 7 to 14, “adolescence” from age 14 to 28, “youth” from age 28 to 50, “seniority” from age
50 to 70, and “old age” over 7024. Although modern categories might redefine the Bishop’s
aAverage marriage ages of daughters of medieval land-holding Englishmen from 1272-1307: 24 years;1307-1327: 22 years; 1327-1377: 20 years; mid-1400s: 18 years; 1485-1509: 15 years. Russell, JC, 1948, p.157, and Russell, JC, 1984, p. 207 (for mid 1400s). Russell estimates that these ages are somewhat lowerthan for average medieval marriage.
Old Age, Height and Nutrition: Felinah Memo Hazara Khan-ad-DinCommon Misconceptions About Medieval England [email protected] paper, Caidan Pentathlon, March 2003
“youth” as “adult” and the Bishop’s “seniority” as “mature adult”, the age groups are
surprisingly familiar to modern readers. It hardly seems likely that the Bishop would define the
age to which he expected to live as “youth”. Most probably, he would have included the
expected life span within “seniority”. Even allowing for the longer average life span in early
medieval Iberia, Bishop Isadore’s writing supports an estimate of at least 50 to 55 as the
expected life span in medieval Europe.
Bishop Isadore’s manuscript also provides insight into what age was considered “old” in
the medieval period. Although Bishop Isadore began “senilis” or “old age” at 70 years, it is
likely that in medieval Britain with its shorter average life spans, “elderly” began somewhat
earlier. Since approximately 20% of the young adult population (age 20) survived to age 6025 in
medieval England, adults surviving to 60 years would not be surprising. And Table 1 indicates
that half of the adults living to 60 years could expect to live almost to 70 years. So medieval
Englishmen were unlikely to consider 40 years, as “old”; this category most likely began about
50, with Bishop Isadore’s “seniority”.
Of course, differences in medieval mortality created several other contrasts to the modern
life experience. Today, in both the United States and in Great Britain, women commonly live
between 5 and 8 years longer than men, and both in the United States and in England, the
largest segment of the population, the “baby-boomers”, are mostly in their 50s. In contrast, at
least half the medieval English population was under 20 years old26 and medieval men typically
lived 2 to 3 years longer than women27.
The statistical average life span from birth in late 20th century England and Wales was 76
for a woman, compared to 70 years for a man28, which reflects a slightly greater mortality
among men compared to women and results in a small excess of women compared to men in the
population29. In medieval Europe, female mortality exceeded male mortality from birth through
the fifth decade, so men outlived women by a few years on average, and men outnumbered
bAlthough the specific figures calculated for infant and early childhood mortality may bequestionable, as discussed in Appendix A, they undoubtedly represent the highest age-specific death
Old Age, Height and Nutrition: Felinah Memo Hazara Khan-ad-DinCommon Misconceptions About Medieval England [email protected] paper, Caidan Pentathlon, March 2003
women by a few percent in the population.30 The increased female mortality arose from a
combination of higher rates of female infanticide and an increased death associated with
childbearing.31
Infanticide has been a relatively common method for controlling overpopulation, especially
in earlier periods, and the climate of medieval England provided a simple method through
exposure and hypothermia.32 Repeated bans on infanticide by the medieval English Church
demonstrate infanticide was a recurring problem, and the increased sex ratios of pre-pubertal
boys to girls can not be reasonably explained through other means.33
Some skeletal evidence, specifically infants buried with women, supports an increased
mortality in women due to complications of child bearing, but examination of skeletal remains
tends to underestimate the problem. In many cases, the mother lived long enough that the infant
was buried separately, and infant burials are more difficult to detect than adult burials. The
best evidence for increased mortality due to childbearing stems from the difference in average
life spans between women and men during the reproductive years:34
Medieval English girls, like their modern counterparts, began menstruating between ages 12
and 14, and became fertile about a year after their first menstrual cycle35. But the typical
reproductive years in medieval women extended from ages 20 to 40. The average marriage age
of a medieval woman occurred in her early 20s, ensuring that reproductive age typically began
about 20. And like her modern counterpart, fertility in a medieval woman began to drop
sharply in the late 30s36.
A 20-year-old medieval woman in England37, Hungary38 or Sweden39 lived on average about
two years less than her male counterpart. This difference held true until age 40 in medieval
English women, after which the difference became negligible. In 16th to 17th century Germany,
similar maternal mortality rates indicated that 11.3% of fertile women died from childbearing40.
While about 13.5% of 20-year-old men reached 60 in medieval Europe, about 12.9% of women
rates, and do not change the age-specific adult mortality rates, or the conclusion drawn from them.
Old Age, Height and Nutrition: Felinah Memo Hazara Khan-ad-DinCommon Misconceptions About Medieval England [email protected] paper, Caidan Pentathlon, March 2003
did so41. In England, the reversal to greater longevity in women did not occur until the early
1800s42.
III. Height — how tall were adults in medieval England?
Although adults in medieval England lived on average about 5 – 8 years less than their early
17th century counterparts (see Figure 1, above), skeletal evidence indicates that medieval
Englishmen were at least 2” taller on average than Englishmen in the 17th century, and only
about 1” shorter than their counterparts in 1984. As usual, less data is available for women,
but medieval Englishwomen averaged about 1.25” less in stature than their modern
counterparts.
The first detailed historical records of height began with military recruitment records kept
from the beginning of the 18th century.43 Stature data prior to 1700 relies on skeletal evidence,44
which presents several difficulties. Correctly identifying the time period represented by burials
in a particular cemetery creates the first hurdle, which is compounded by casual abuse of
skeletal remains prior to 1960.45 Once the historical time period of the skeletal remains has been
narrowed as much as possible, the skeletal evidence itself can be addressed. The sex of
skeletons can be determined with high accuracy from as little as a pelvis or skull and use of
multiple determinants can give quite accurate results for the age at death.46 Several statistical
models have been developed to accurately predict height from individual limb bones, or
averages of several limb bones. The currently accepted model for accurately estimating height
was developed by Trotter and Gleser using specifically measurements from femur (thigh bone)
and tibia (larger lower leg bone), and most of the data cited used this method. A brief
discussion of the Trotter and Gleser model is presented in Appendix C.
Old Age, Height and Nutrition: Felinah Memo Hazara Khan-ad-DinCommon Misconceptions About Medieval England [email protected] paper, Caidan Pentathlon, March 2003
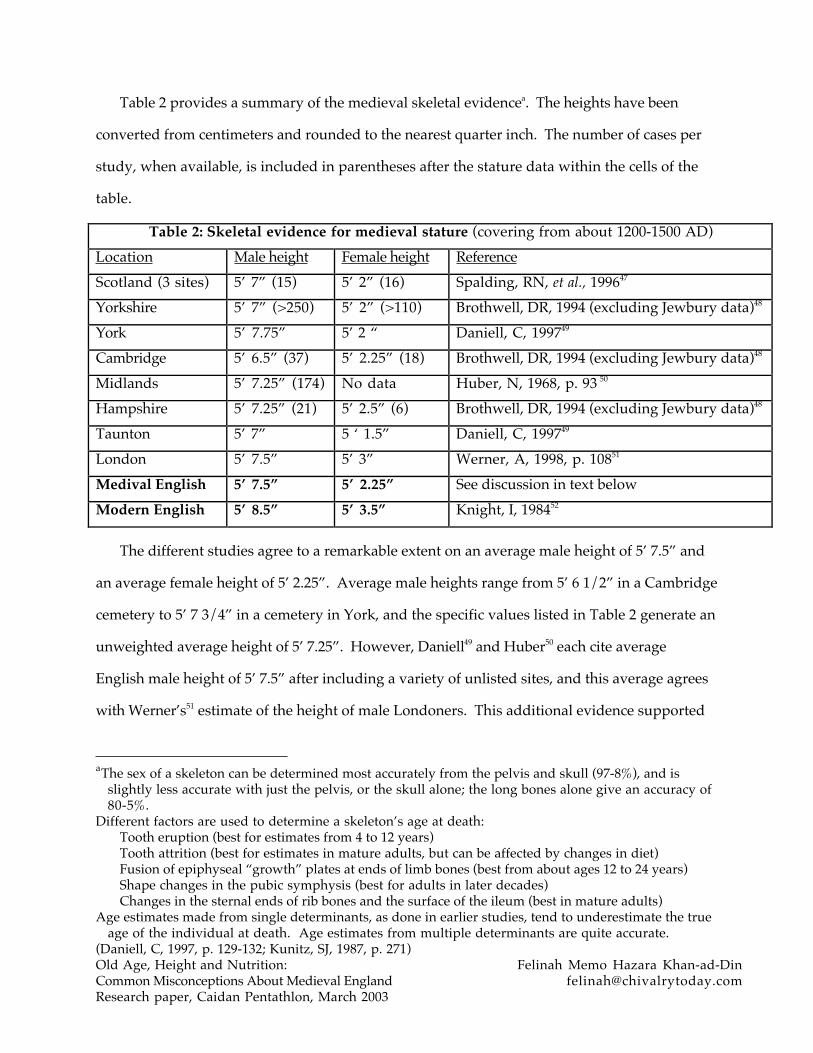
Table 2 provides a summary of the medieval skeletal evidencea. The heights have been
converted from centimeters and rounded to the nearest quarter inch. The number of cases per
study, when available, is included in parentheses after the stature data within the cells of the
table.
Table 2: Skeletal evidence for medieval stature (covering from about 1200-1500 AD)Location Male height Female height ReferenceScotland (3 sites) 5’ 7” (15) 5’ 2” (16) Spalding, RN, et al., 199647
Yorkshire 5’ 7” (>250) 5’ 2” (>110) Brothwell, DR, 1994 (excluding Jewbury data)48
York 5’ 7.75” 5’ 2 “ Daniell, C, 199749
Cambridge 5’ 6.5” (37) 5’ 2.25” (18) Brothwell, DR, 1994 (excluding Jewbury data)48
Midlands 5’ 7.25” (174) No data Huber, N, 1968, p. 93 50
Hampshire 5’ 7.25” (21) 5’ 2.5” (6) Brothwell, DR, 1994 (excluding Jewbury data)48
Taunton 5’ 7” 5 ‘ 1.5” Daniell, C, 199749
London 5’ 7.5” 5’ 3” Werner, A, 1998, p. 10851
Medival English 5’ 7.5” 5’ 2.25” See discussion in text belowModern English 5’ 8.5” 5’ 3.5” Knight, I, 198452
The different studies agree to a remarkable extent on an average male height of 5’ 7.5” and
an average female height of 5’ 2.25”. Average male heights range from 5’ 6 1/2” in a Cambridge
cemetery to 5’ 7 3/4” in a cemetery in York, and the specific values listed in Table 2 generate an
unweighted average height of 5’ 7.25”. However, Daniell49 and Huber50 each cite average
English male height of 5’ 7.5” after including a variety of unlisted sites, and this average agrees
with Werner’s51 estimate of the height of male Londoners. This additional evidence supported
aThe sex of a skeleton can be determined most accurately from the pelvis and skull (97-8%), and is
slightly less accurate with just the pelvis, or the skull alone; the long bones alone give an accuracy of80-5%.
Different factors are used to determine a skeleton’s age at death:Tooth eruption (best for estimates from 4 to 12 years)Tooth attrition (best for estimates in mature adults, but can be affected by changes in diet)Fusion of epiphyseal “growth” plates at ends of limb bones (best from about ages 12 to 24 years)Shape changes in the pubic symphysis (best for adults in later decades)Changes in the sternal ends of rib bones and the surface of the ileum (best in mature adults)
Age estimates made from single determinants, as done in earlier studies, tend to underestimate the trueage of the individual at death. Age estimates from multiple determinants are quite accurate.
(Daniell, C, 1997, p. 129-132; Kunitz, SJ, 1987, p. 271)
Old Age, Height and Nutrition: Felinah Memo Hazara Khan-ad-DinCommon Misconceptions About Medieval England [email protected] paper, Caidan Pentathlon, March 2003
an average medieval English male height of 5’ 7.5”. Spalding47 found that medieval Scottish men
were slightly shorter at 5’ 7”.
The average height for medieval adult women in Table 1 was derived from English averages
of 5’ 2” (Daniell) and 5’ 2.25” (Brothwell), with 5’ 3” for Londoners (Werner). Again, Spalding
found that Scottish women were slightly shorter at 5’ 2”.
The medieval average heights for men and women are surprisingly similar to the average
heights of men and women in Great Britain in the 1980s, at which time British men averaged 5’
8.5”, while British women averaged 5’ 3.5”52. Details of the data sources for both Table 2 and
Figure 2 are provided in Appendix C. Appendix C also discusses how the data in Table 2 were
selected to avoid or minimize certain complications in stature data, such as height loss with
advancing age and the need to focus solely on the Caucasian subpopulation of modern Britain
when comparing stature data. The question of the small but continuing increase in average
British (and American) stature over the past 20 years is also addressed briefly, explaining why
the most recent stature data is less likely to provide the best comparison with medieval stature.
Examination of the heights of some of the medieval English kings and their description by
medieval writers provides an interesting side note about height, its perception and its impact.
As noted by one author in his introduction53, “Height matters to humans,” and is “… one of our
primary means of identification.” In a similar vein, Russell54 explains that, “Human height
assumes an unreal importance because our eyes are near the top of our bodies, and thus they
detect easily relatively slight differences in stature. Today a few inches seem to confer some
advantage in securing positions of leadership….” Russell goes on to compare the actual heights
of medieval English kings with their descriptions in contemporary manuscripts. Although much
of his evidence is derived from tomb and effigy sizes, which are only sporadically accurate, the
available skeletal evidence supports his contention that 5’ 9” was an expected ordinary height
(often described as “just”) for English kings. Henry VI (reigned 1422-71) was described in this
fashion, and a recent historian identified his height as between 5’ 9” and 5’ 10”; Henry III
(reigned 1216-1272) was similarly described, and his tomb indicates a height of 5’ 9”, at a time
Old Age, Height and Nutrition: Felinah Memo Hazara Khan-ad-DinCommon Misconceptions About Medieval England [email protected] paper, Caidan Pentathlon, March 2003
when tombs commonly portrayed correct height. Henry’s father John (reigned 1199-1216) was
described as one of Henry II’s “short” sons, and both John’s skeleton and effigy agree on a
height between 5’ 5” and 5’ 6”. If Richard I’s (reigned 1189-99) tomb is as accurate in height as
that of his brother John, then he justified his “noble” and “very grand” descriptions by standing
about 6’. In contrast, skeletons are available for both Edward I (reigned 1272-1307), who at 6’
2” was described as standing “head and shoulders above common folk”, and Edward IV
(reigned 1461-83), who at 6’ 3” was described as “exceeding all in height”55. So, not
surprisingly, the contemporary writers expected an “ordinary” king to be 1” to 2” taller than an
average medieval subject.
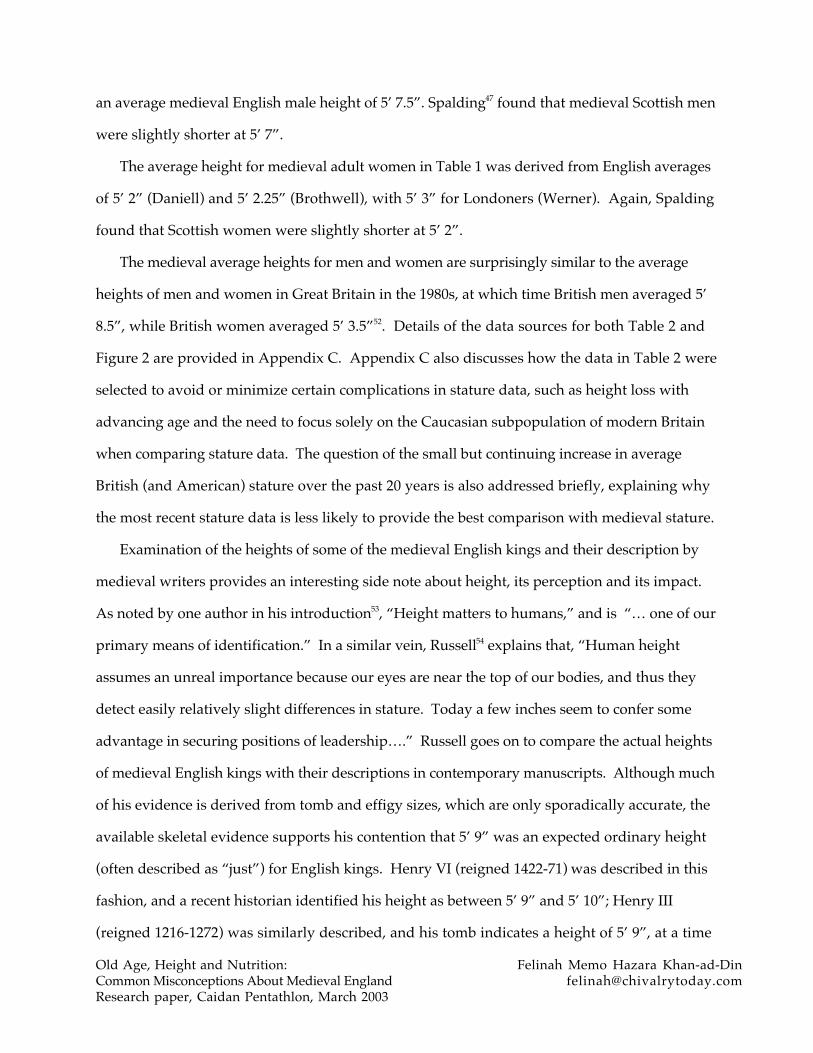
Figure 2 surveys average height in Great Britain from early medieval to modern times; the
details of the data sources for each period are discussed in Appendix C.
Figure 2: Changes in British stature
0123456789
850-1066
1067-1199
1200-1500
1501-1649
1650-1700
1701-1750
1751-1820
1830-1850
1851-1900
19351966
1984
Time period
Heig
ht in
inch
es o
ver
5 fe
et
Male Female
Old Age, Height and Nutrition: Felinah Memo Hazara Khan-ad-DinCommon Misconceptions About Medieval England [email protected] paper, Caidan Pentathlon, March 2003
No specific stature data were available between 1066-1200. Huber identifies heights based
on skeletons specifically from 1200-1400, and most of the other “medieval” cemeteries
discussed above were in use from the 12th or 13th centuries through the 15th century. Therefore,
the average medieval English height from Table 2 is used for the period from 1200-1500. No
stature data specific to the 16th or early 17th century has been found in the literature at this time.
At some point between the late 1400s and the end of the 17th century, average male stature
decreased by about two inches. This may account, at least in part, for a common observation
that some of the existing suits of full armor appear to be made for smaller men56. Since many of
these ornate suits date from the mid-16th century, the decrease in British male stature may have
already begun. From the late 17th century, British men slowly increased their height, with a small
regression in the second quarter of the 19th century, but didn’t regain their medieval average until
after 1935.
IV: The nutritional connection — what can explain tall medieval Englishmen with short life
spans?
What of the nutritional connection between average height and mortality? The average
height of a population is an accepted index of its general nutritional status57, and poor
nutritional status increases the mortality rates from some diseases58. Both the average stature
of Englishmen and the average English life span were rising in the early 18th century,
emphasizing the effect of nutritional status on mortality, as well. What can explain the taller
medieval Englishman with a shorter average life span?
Adult height results from a genetic potential modified by infant and childhood
environmental influences, including diet, living conditions and frequent disease, often grouped
under the heading of “nutritional status”59. Although the heights of an individual’s relatives
provide some guide to the genetic height potential of an individual, the genetic variation built
into sexual reproduction precludes knowing (yet) the genetic height potential of any
individual60. But genetic influences average out in a stable population, and genetic potential
does not change significantly in the span of even several hundred years. So in a stable
Old Age, Height and Nutrition: Felinah Memo Hazara Khan-ad-DinCommon Misconceptions About Medieval England [email protected] paper, Caidan Pentathlon, March 2003
population over time, genetic factors are constant, leaving only average nutritional status of
children and adolescents as the variable that significantly affects the average adult height of the
population. This is true for the medieval English population, and still holds reasonably well for
the Caucasian subpopulation in England through the last quarter of the 20th century (see
discussion in Appendix C).61
The exact statistical relationship between measurable changes in nutritional status and
average population stature remains uncertain, however. Children’s early growth is easily
slowed by inadequate nutrition or frequent bouts of disease because of the large energy
demands placed on their body by continued growth. And a few years after puberty, the growth
plates (epiphyses) on the long bones fuse, preventing further increase in stature. In fact, within
a decade or less of achieving full adult stature, individuals begin to lose height slowly62.
However, intermittent childhood periods of malnutrition or disease63 frequently have little effect
on decreasing final adult stature because of the opportunity for “catch-up” growth. After a
period of growth retardation in childhood resulting from poor nutritional status, accelerated
growth during the adolescent growth spurt often compensates to bring the adult height back
towards its normal value. Additionally, malnutrition or disease severe enough to retard growth
often delays puberty as well, allowing another opportunity for catch-up growth to return the
individual to his or her normal adult height.
Clearly, the average height of the medieval English population indicates a quite reasonable
nutritional status, despite comparatively harsh living conditions64. The typical medieval English
landowners’ diet emphasized bread, beer and meat, but medieval nobility minimized their
consumption of vegetables and fresh fruit. In fact, even consumption of significant milk and
cheese was avoided, unless as part of pies or deserts, since this form of “white meat” was
considered fit primarily for peasants. The peasant diet featured less meat, but more dairy
products and somewhat more vegetables65. No modern dietician would recommend any
medieval diet as nutritionally balanced, and periodic harvest failures ensured frequent spring
and early summer hunger, with occasional episodes of starvation due to outright famine. But
Old Age, Height and Nutrition: Felinah Memo Hazara Khan-ad-DinCommon Misconceptions About Medieval England [email protected] paper, Caidan Pentathlon, March 2003
both of these diets must have allowed substantial catch-up growth to help compensate for
periodic harvest failures and bouts of childhood disease66. Additionally, this nutritional
pattern, even with the harvest failures and occasional starvation, did not produce the severe
malnutrition we associate with famine in underdeveloped countries in the 20th century. Unlike
severe malnutrition, the moderately low nutritional status typical of the medieval period has
little, if any connection with increased mortality from epidemic disease67, and medieval famines
were typically short-lived enough not to permanently stunt growth.
The additional environmental factors contributing to nutritional status must have allowed
this catch-up growth as well. This argues that medieval housing was adequate to protect
people reasonably well from English winters, and that chronic or wasting, but non-fatal
childhood diseases were not frequent enough to permanently stunt growth. The small decrease
in average English male height between 850 – 1066 period and the period spanning 1200 –
1500s, if it is significant, probably occurred during the late 1200s or early 1300s. During this
time, increased demand for taxes and increasing population pushed villages into marginal land
and decreased fallowing of land. These factors combined with some climactic cooling to
decrease crop yields68 and strain winter housing. The resulting drop in average nutritional
status may have sufficed to decrease average male height about a half an inch, but medieval
men still stood only about an inch shorter than their modern counterparts.
So why didn’t this reasonable nutritional status increase the average life span of the
medieval Englishman, particularly that of the landowners with their better living conditions and
more protein-rich diet? By far the most predominant cause of mortality in medieval England
was epidemic disease. Violent death accounted for only about 5% of total deaths per year
among medieval English males, although male English peers suffered about twice that many
violent deaths per year69. After 1348, plague constantly dominated the medieval mortality
figures, accompanied by less severe epidemics of “sweating sickness”a,70, epidemic typhus, and
a”Sweating sickness” (Sudor Anglicus) appeared in English records in 1485 and disappeared again in the1550s. Although often equated with outbreaks of influenza, this disease differs from influenza and has
Old Age, Height and Nutrition: Felinah Memo Hazara Khan-ad-DinCommon Misconceptions About Medieval England [email protected] paper, Caidan Pentathlon, March 2003
influenza, imposed on a lower background mortality from dysentery, epidemic typhoid fever,
malaria, smallpox and tuberculosis71. Nutritional status has virtually no effect on the
probability of infection by epidemic diseases, nor on the mortality rates due to the plague,
malaria, or “sweating sickness”. Nutritional status has only a very equivocal effect on the
mortality rates due to smallpox, influenza and epidemic typhus, although it is closely correlated
to mortality from tuberculosis and dysentery.72 So although nutritionally-sensitive diseases
were present in medieval England, the relatively good nutritional status indicated by average
adult height did not significantly protect the people from the predominant causes of mortality.
Although medieval famines did typically correlate with outbreaks of pestilence, the connection
was not through depressed nutritional status. Instead, the pestilence during famine most
probably resulted from the infected population moving to escape hunger and spreading a small
local outbreak into an epidemic73.
This situation held through the late medieval period, even as the post-plague English
population began to increase once again during the late 15th century. Indeed, the poorer growth
and greater evidence of disease observed in urban children vs. their rural cousins in
industrialized England are not seen in late medieval England, although contemporary accounts
complain of air pollution and poor living conditions. So even in relatively crowded 15th century
English cities, children’s health did not suffer significantly compared to their rural
contemporaries74.
At some point between the 15th century and the late 17th century, average English male height
dropped by at least two inches, as shown in Figure 2. The significant decrease in nutritional
status causing this decrease probably resulted from increased urbanization, increasing
population and decreased real wages (adjusted for cost of living) 75. Interestingly, the “little ice
age” in Europe began in the 1500s76, about the same time as increasing population began to
stress agricultural productivity77. Although both height and life span began rising about 1700,
not yet been definitely identified. Similarities to Hantavirus and an unidentified arbovirus have bothbeen explored.
Old Age, Height and Nutrition: Felinah Memo Hazara Khan-ad-DinCommon Misconceptions About Medieval England [email protected] paper, Caidan Pentathlon, March 2003
(Figures 1 and 2), the period from about 1700 to 1900 was characterized by relatively short
English stature and mortality rates still at least twice the modern level78. By the mid-1700s, the
pattern of mortality changed from a “crisis mortality” pattern dominated by regional or
national epidemics to a steadier “background mortality” pattern with fewer epidemics79.
Specifically, this was the period during which tuberculosis emerged as the predominant killer,
accompanied by cholera, smallpox and infantile diarrhea80. During this same period, the
mortality of the peerage began to fall significantly below the mortality of the general populace
for the first time81. Since the nutritional status of the peerage always exceeded that of the
general population, this supports a change in the dominant causes of mortality to diseases
correlated with nutritional status. So, unlike the their taller medieval forefathers, members of the
shorter Georgian and Victorian population found poor living conditions clearly related to a
shorter life span.
V: Conclusion.
Certainly medieval living conditions and the demography of the medieval population
ensured that the medieval life experience differed greatly from ours. Death was a common
companion for medieval Englishmen, and the probability of a baby living past 25 years was less
than 50%. Even prior to the plague, villages grew slowly by modern standards, adding slightly
over two new individuals a year to a village of 300 people in the 13th century, in the absence of
migration82. But any population growth in the face of such high mortality rates required an even
higher fertility rate, ensuring that medieval Englishmen lived within a young population. The
dangers of childbirth predicted that men often outlived their wives. Living conditions were
clearly harsh and diet unbalanced by modern standards.
Modern experience, as well as that of the better-documented 18th and 19th century, would
seem to predict that such a short average life span from birth would indicate poor nutritional
status and “old age” starting by at least 35 or 40 years; the poor nutritional status would
correlate with a short average stature in the population. Not surprisingly, this is a common
view of medieval England. Yet investigation of the actual medieval record surprises the student
Old Age, Height and Nutrition: Felinah Memo Hazara Khan-ad-DinCommon Misconceptions About Medieval England [email protected] paper, Caidan Pentathlon, March 2003
of history with the reality that medieval individuals considered 50 to 55 to be a “typical” life
span, that nutritional status was good enough to allow near-modern height, but that that
nutritional status was unrelated to the high mortality rate. Such tantalizing insights into the
many common misconceptions of medieval life can only emphasize the rewards awaiting those
willing to delve further into the medieval record.
Old Age, Height and Nutrition: Felinah Memo Hazara Khan-ad-DinCommon Misconceptions About Medieval England [email protected] paper, Caidan Pentathlon, March 2003
APPENDIX A: Expectation of life and the concern over older demographic statistics.
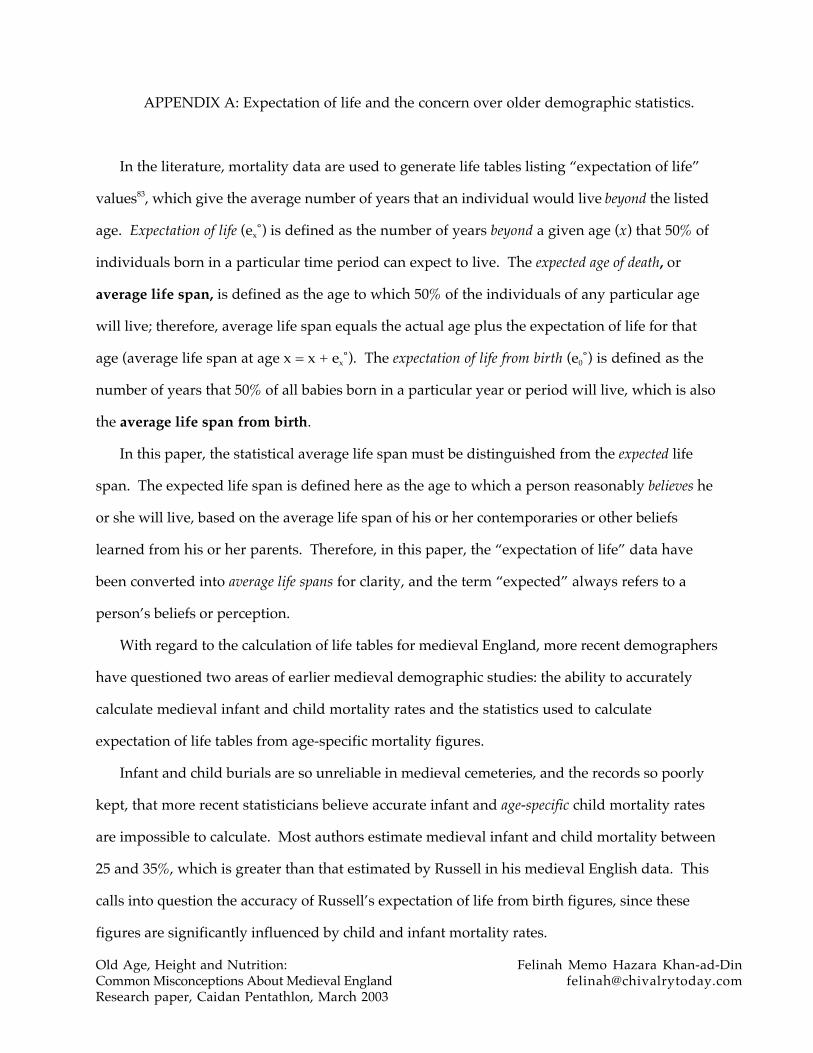
In the literature, mortality data are used to generate life tables listing “expectation of life”
values83, which give the average number of years that an individual would live beyond the listed
age. Expectation of life (ex˚) is defined as the number of years beyond a given age (x) that 50% of
individuals born in a particular time period can expect to live. The expected age of death, or
average life span, is defined as the age to which 50% of the individuals of any particular age
will live; therefore, average life span equals the actual age plus the expectation of life for that
age (average life span at age x = x + ex˚). The expectation of life from birth (e0˚) is defined as the
number of years that 50% of all babies born in a particular year or period will live, which is also
the average life span from birth.
In this paper, the statistical average life span must be distinguished from the expected life
span. The expected life span is defined here as the age to which a person reasonably believes he
or she will live, based on the average life span of his or her contemporaries or other beliefs
learned from his or her parents. Therefore, in this paper, the “expectation of life” data have
been converted into average life spans for clarity, and the term “expected” always refers to a
person’s beliefs or perception.
With regard to the calculation of life tables for medieval England, more recent demographers
have questioned two areas of earlier medieval demographic studies: the ability to accurately
calculate medieval infant and child mortality rates and the statistics used to calculate
expectation of life tables from age-specific mortality figures.
Infant and child burials are so unreliable in medieval cemeteries, and the records so poorly
kept, that more recent statisticians believe accurate infant and age-specific child mortality rates
are impossible to calculate. Most authors estimate medieval infant and child mortality between
25 and 35%, which is greater than that estimated by Russell in his medieval English data. This
calls into question the accuracy of Russell’s expectation of life from birth figures, since these
figures are significantly influenced by child and infant mortality rates.
Old Age, Height and Nutrition: Felinah Memo Hazara Khan-ad-DinCommon Misconceptions About Medieval England [email protected] paper, Caidan Pentathlon, March 2003
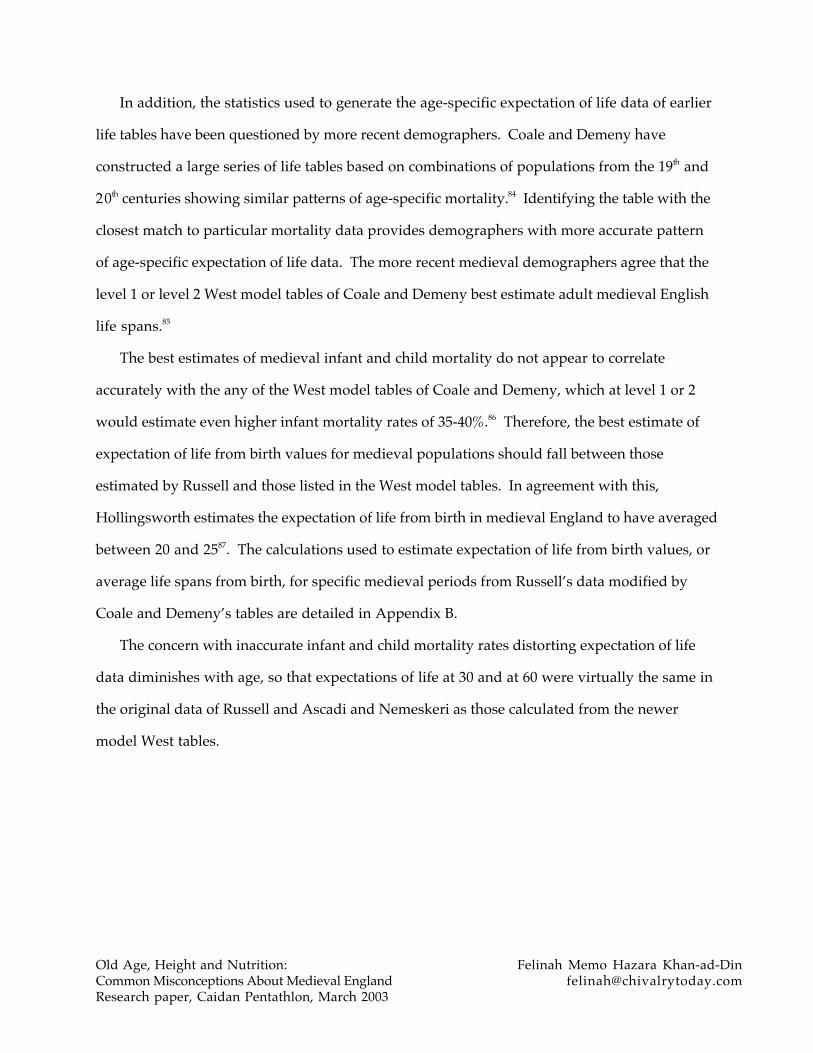
In addition, the statistics used to generate the age-specific expectation of life data of earlier
life tables have been questioned by more recent demographers. Coale and Demeny have
constructed a large series of life tables based on combinations of populations from the 19th and
20th centuries showing similar patterns of age-specific mortality.84 Identifying the table with the
closest match to particular mortality data provides demographers with more accurate pattern
of age-specific expectation of life data. The more recent medieval demographers agree that the
level 1 or level 2 West model tables of Coale and Demeny best estimate adult medieval English
life spans.85
The best estimates of medieval infant and child mortality do not appear to correlate
accurately with the any of the West model tables of Coale and Demeny, which at level 1 or 2
would estimate even higher infant mortality rates of 35-40%.86 Therefore, the best estimate of
expectation of life from birth values for medieval populations should fall between those
estimated by Russell and those listed in the West model tables. In agreement with this,
Hollingsworth estimates the expectation of life from birth in medieval England to have averaged
between 20 and 2587. The calculations used to estimate expectation of life from birth values, or
average life spans from birth, for specific medieval periods from Russell’s data modified by
Coale and Demeny’s tables are detailed in Appendix B.
The concern with inaccurate infant and child mortality rates distorting expectation of life
data diminishes with age, so that expectations of life at 30 and at 60 were virtually the same in
the original data of Russell and Ascadi and Nemeskeri as those calculated from the newer
model West tables.
Old Age, Height and Nutrition: Felinah Memo Hazara Khan-ad-DinCommon Misconceptions About Medieval England [email protected] paper, Caidan Pentathlon, March 2003
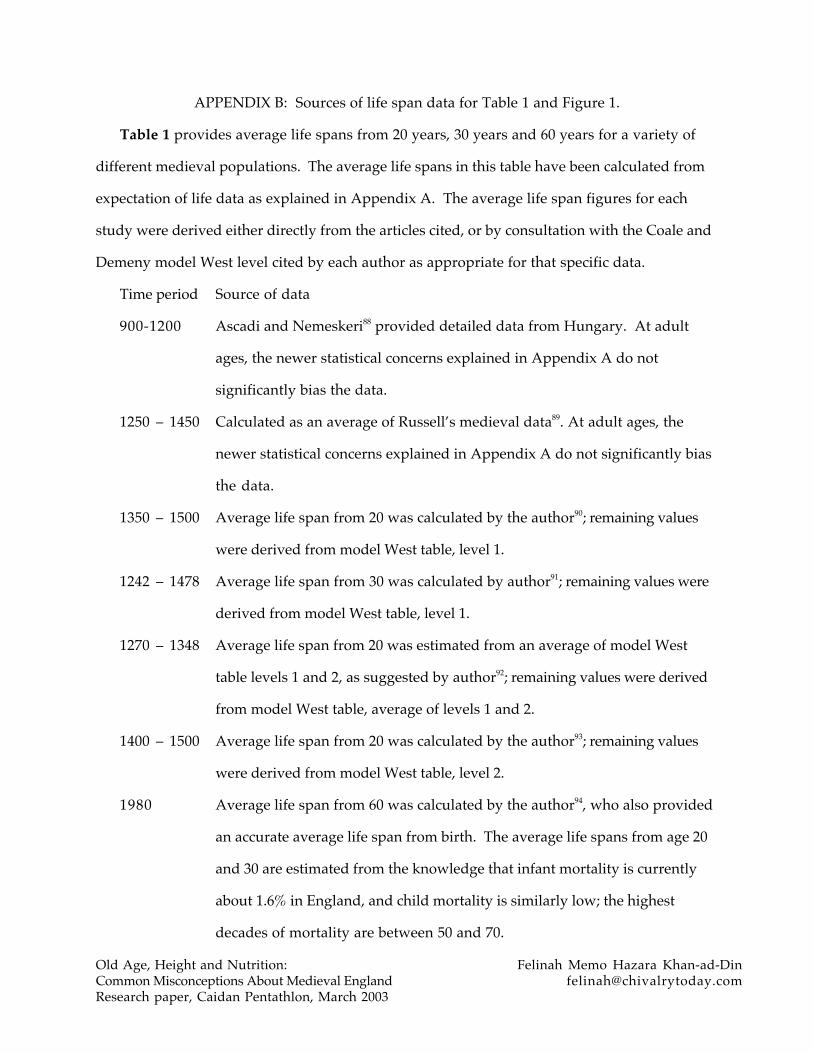
APPENDIX B: Sources of life span data for Table 1 and Figure 1.
Table 1 provides average life spans from 20 years, 30 years and 60 years for a variety of
different medieval populations. The average life spans in this table have been calculated from
expectation of life data as explained in Appendix A. The average life span figures for each
study were derived either directly from the articles cited, or by consultation with the Coale and
Demeny model West level cited by each author as appropriate for that specific data.
Time period Source of data
900-1200 Ascadi and Nemeskeri88 provided detailed data from Hungary. At adult
ages, the newer statistical concerns explained in Appendix A do not
significantly bias the data.
1250 – 1450 Calculated as an average of Russell’s medieval data89. At adult ages, the
newer statistical concerns explained in Appendix A do not significantly bias
the data.
1350 – 1500 Average life span from 20 was calculated by the author90; remaining values
were derived from model West table, level 1.
1242 – 1478 Average life span from 30 was calculated by author91; remaining values were
derived from model West table, level 1.
1270 – 1348 Average life span from 20 was estimated from an average of model West
table levels 1 and 2, as suggested by author92; remaining values were derived
from model West table, average of levels 1 and 2.
1400 – 1500 Average life span from 20 was calculated by the author93; remaining values
were derived from model West table, level 2.
1980 Average life span from 60 was calculated by the author94, who also provided
an accurate average life span from birth. The average life spans from age 20
and 30 are estimated from the knowledge that infant mortality is currently
about 1.6% in England, and child mortality is similarly low; the highest
decades of mortality are between 50 and 70.
Old Age, Height and Nutrition: Felinah Memo Hazara Khan-ad-DinCommon Misconceptions About Medieval England [email protected] paper, Caidan Pentathlon, March 2003
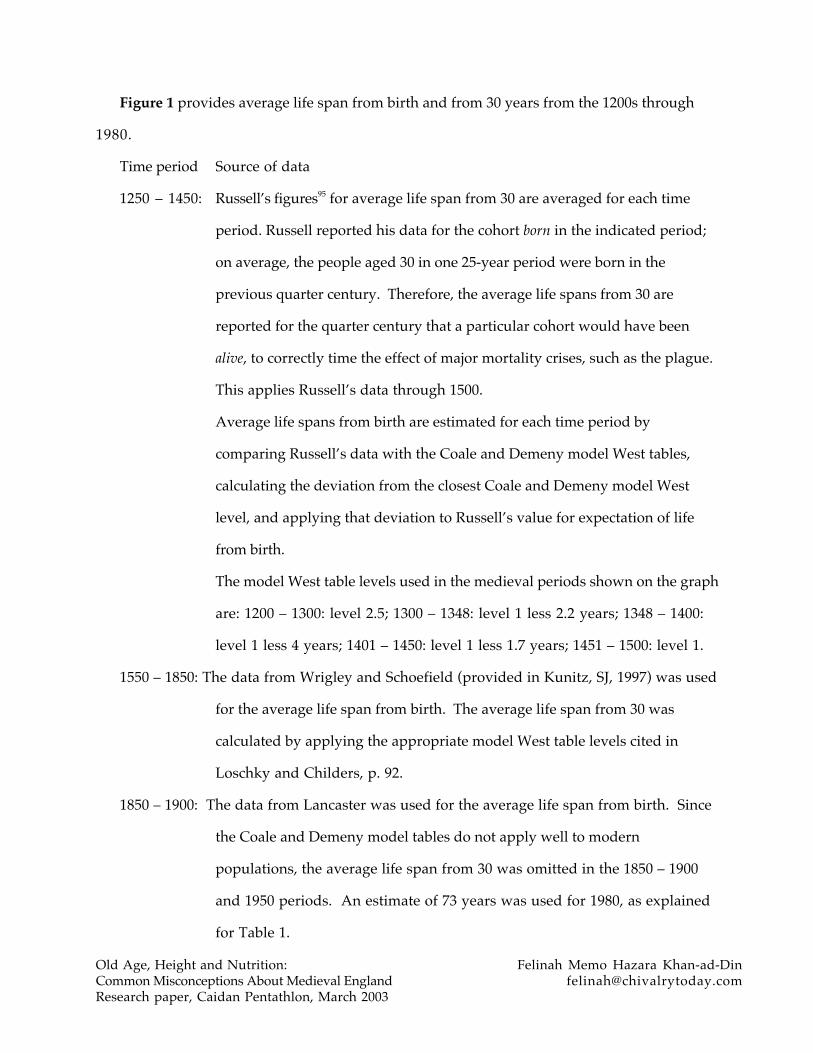
Figure 1 provides average life span from birth and from 30 years from the 1200s through
1980.
Time period Source of data
1250 – 1450: Russell’s figures95 for average life span from 30 are averaged for each time
period. Russell reported his data for the cohort born in the indicated period;
on average, the people aged 30 in one 25-year period were born in the
previous quarter century. Therefore, the average life spans from 30 are
reported for the quarter century that a particular cohort would have been
alive, to correctly time the effect of major mortality crises, such as the plague.
This applies Russell’s data through 1500.
Average life spans from birth are estimated for each time period by
comparing Russell’s data with the Coale and Demeny model West tables,
calculating the deviation from the closest Coale and Demeny model West
level, and applying that deviation to Russell’s value for expectation of life
from birth.
The model West table levels used in the medieval periods shown on the graph
are: 1200 – 1300: level 2.5; 1300 – 1348: level 1 less 2.2 years; 1348 – 1400:
level 1 less 4 years; 1401 – 1450: level 1 less 1.7 years; 1451 – 1500: level 1.
1550 – 1850: The data from Wrigley and Schoefield (provided in Kunitz, SJ, 1997) was used
for the average life span from birth. The average life span from 30 was
calculated by applying the appropriate model West table levels cited in
Loschky and Childers, p. 92.
1850 – 1900: The data from Lancaster was used for the average life span from birth. Since
the Coale and Demeny model tables do not apply well to modern
populations, the average life span from 30 was omitted in the 1850 – 1900
and 1950 periods. An estimate of 73 years was used for 1980, as explained
for Table 1.
Old Age, Height and Nutrition: Felinah Memo Hazara Khan-ad-DinCommon Misconceptions About Medieval England [email protected] paper, Caidan Pentathlon, March 2003
APPENDIX C: Sources of adult stature data for Table 2 and Figure 2.
The sources of data for the medieval English stature data in Table 2 are cited in the table.
Ironically, an excess of data, rather than a deficiency, complicates modern stature data
presented in Table 2. Although Werner cites an average height in the UK of 5’ 9” for men and 5’
3 3/4” for women by 1998, the slightly shorter 1984 data from Knight were used for a modern
comparison. Modern stature data is complicated both by increased immigration into England in
last century, and by stature data provided for specific age groups. Werner does not specify
either the ethnic group or the age group covered by his data, while Knight’s data specifically
represent the average height of the “white” subpopulation from age 20 to 64.
Immigration in England has created an ethnically mixed population in the last century,
confusing the genetic contribution to average adult stature. Focusing on the “white”
subpopulation data in Knight’s 1984 study minimizes this difficulty, since most Caucasian
immigrants come from a similar genetic pool.
As a second complication in stature data, adults begin to lose height several years after they
finish growing, so the average height of British men from ages 20 to 60 is an inch less than the
average height of British men at 21 or 22 years. British women show a similar, but smaller
difference with age.96 Since skeletons of all adult ages available at each medieval cemetery were
used in the skeletal evidence, the average male and female heights from ages 20 to 60 provide
the best comparison.
Although several studies indicate that average stature in Great Britain has continued to
increase over the last 15 to 20 years, this recent increase is most likely the result of increased
infant health care technology, rather than significant improvements in diet or living conditions.
This makes the more recent increase in stature much less applicable to comparison with the
medieval experience, supporting the use of Knight’s 1984 data in Table 2.
Old Age, Height and Nutrition: Felinah Memo Hazara Khan-ad-DinCommon Misconceptions About Medieval England [email protected] paper, Caidan Pentathlon, March 2003
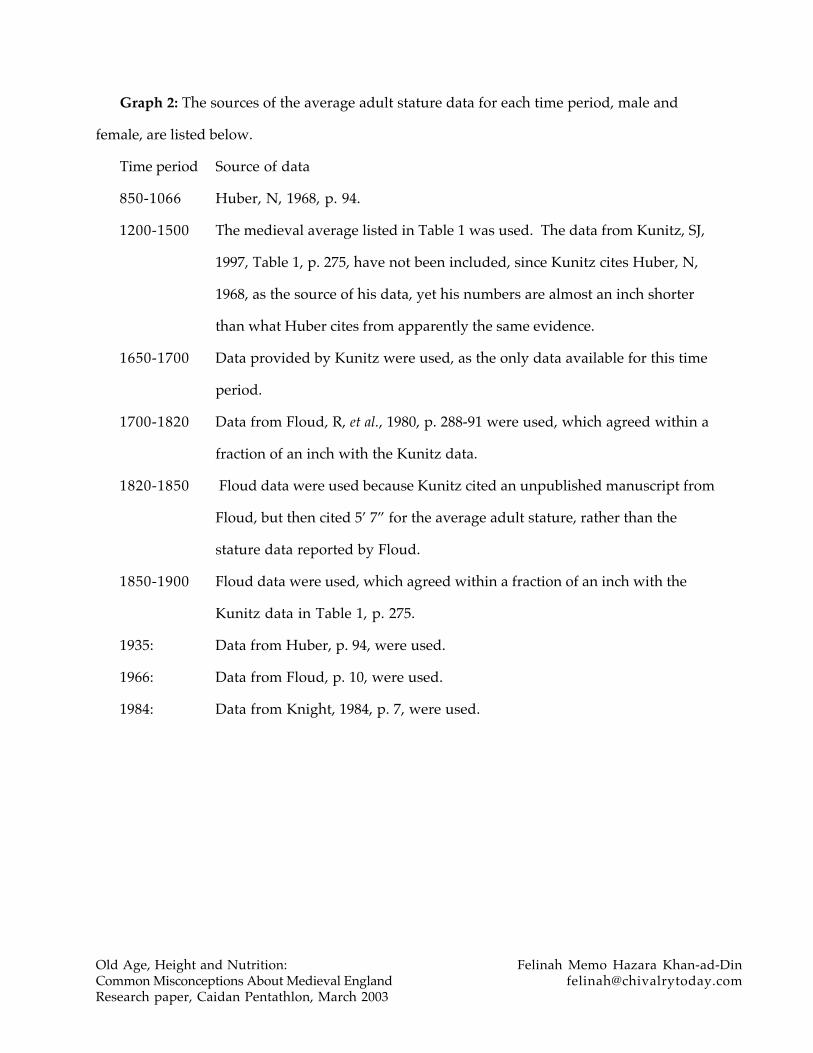
Graph 2: The sources of the average adult stature data for each time period, male and
female, are listed below.
Time period Source of data
850-1066 Huber, N, 1968, p. 94.
1200-1500 The medieval average listed in Table 1 was used. The data from Kunitz, SJ,
1997, Table 1, p. 275, have not been included, since Kunitz cites Huber, N,
1968, as the source of his data, yet his numbers are almost an inch shorter
than what Huber cites from apparently the same evidence.
1650-1700 Data provided by Kunitz were used, as the only data available for this time
period.
1700-1820 Data from Floud, R, et al., 1980, p. 288-91 were used, which agreed within a
fraction of an inch with the Kunitz data.
1820-1850 Floud data were used because Kunitz cited an unpublished manuscript from
Floud, but then cited 5’ 7” for the average adult stature, rather than the
stature data reported by Floud.
1850-1900 Floud data were used, which agreed within a fraction of an inch with the
Kunitz data in Table 1, p. 275.
1935: Data from Huber, p. 94, were used.
1966: Data from Floud, p. 10, were used.
1984: Data from Knight, 1984, p. 7, were used.
Old Age, Height and Nutrition: Felinah Memo Hazara Khan-ad-DinCommon Misconceptions About Medieval England [email protected] paper, Caidan Pentathlon, March 2003
1Hollingsworth, TH. A Note on Mediaeval Longevity of the Secular Peerage, 1350-1500. PopulationStudies 1975, 29(1):155-159, p. 159.2Floud, R; Wachter, K; Gregory, A. Height, Health and History: Nutritional Status in the UnitedKingdom, 1750-1980 , Cambridge: Cambridge University Press, 1990, p. 1-8 and p. 227. Micozzi, MS.Functional Consequences From Varying Patterns of Growth and Maturation During Adolescence.Hormone Research 1993, 39 (supplement):49-58, p. 51.3Loschky, D; Childers, BD. Early English Mortality. Journal of Interdisciplinary History 1993,24(1):85-97, p. 93 (average medieval adult male mortality). Riley, JC. Insects and the EuropeanMortality Decline. The American Historical Review 1986, 91(4):833-858, p. 833 (19th C mortality rates).4Floud, R et al., 1990, p. 295, and 310-311 (1848-52, civil records). Lancaster, HO. Expectations of Life 1990, New York: Springer-Verlag, p. 321 (British soldiers in Crimean war, mid 1800s).5Lancaster, HO, 1990, p.242. Floud, R, et al., 1990, p. 17.6Livi-Bacci, M. The Nutrition-Mortality Link in Past Times: A Comment. Journal of InterdisciplinaryHistory 1983, 14(2):293-298, p. 294. Kunitz, SJ. Making a long story short: A note on men’s height andmortality in England from the first through the nineteenth centuries. Medical History 1987, 31:269-280p. 269-270.7Loschky, D; Childers, BD, 1993, p. 85-89. Lancaster, HO, 1990, p. 8-9 and 375. Russell, JC. BritishMedieval Population , Albequerque: University of New Mexico Press, 1948, p. 207 and chapter 2(medieval English records).8Loschky, D; Childers, BD, 1993, p. 89. Ascadi G; Nemeskeri J. History of Human Life Span andMortality , Budapest: Akademiai Kiado, 1970, p. 256-7. Russell, JC, 1948, p. 207 for medievalmortality. Lancaster, HO, 1990, p. 36 for mid-20th century mortality.9Russell, JC, 1948. Loschky, D, et al., 1993, p. 90 – 92 (for recalculation of Russell’s mortality figures).10Hollingsworth, TH, 1975, p. 156-7.11Ascadi G; Nemeskeri J, 1970, p. 250.12Loschky, D, et al., 1993, p. 88.13Hatcher, J. Mortality in the Fifteenth Century: Some New Evidence. The Economic History Review1986, 39(1):19-38, p. 28.14Lancaster, HO, 1990, p. 44.15Russell, JC, 1948, p. 374; see Appendix B for specifics.16Wrigley, EA; Schoefield, RS. The Population History of England, 1541-1871 , London: Edward Arnold,1981, reproduced in Kunitz, SJ, 1987, p. 274. Floud, R et al., 1990, p. 292. See Appendix B for specifics.17Ascadi G; Nemeskeri J, 1970, p. 250.18Hollingsworth, TH, 1975, p. 159.19Lancaster, HO, 1990, p. 30 (average mortality), and p. 9 (infant mortality).20Lievegoed, B. Phases of Childhood , Edinburgh:Floris Books, 1997, p. 82.21Russell, JC, 1948, p. 157.22Ascadi G; Nemeskeri J, 1970, p. 256, 308 (medieval Hungary). Loschky, D; Childers, BD, 1993, p. 95(medieval England).23Ibid, p. 248 -49.24Russell, JC. The Control of Late Ancient and Medieval Population , Philadelphia: AmericanPhilosophical Society, 1985, p. 56.25Ibid, p. 57.26Ibid, p. 54. Ascadi G; Nemeskeri J, 1980, p. 250 and p. 255.27Daniell, C. Death and Burial in the Middle Ages , London, New York: Routledge, 1997, p. 133.28Lancaster, HO, 1990, p. 44.29Lancaster, HO, 1990, p. 44.30Russell, JC, 1985, p. 190-1. Ascadi G; Nemeskeri J, 1970, p. 251.
Old Age, Height and Nutrition: Felinah Memo Hazara Khan-ad-DinCommon Misconceptions About Medieval England [email protected] paper, Caidan Pentathlon, March 2003
31Hogberg, U; Iregren E, Claes-Henrik S; Diener L. Maternal Deaths in Medieval Sweden: AnOsteological and Life Table Analysis. Journal of Biosocial Science 1987, 19:495-503, p. 497 and 501.Russell, JC, 1985, p. 48.32Daniell, C, 1997, p. 126.33Russell, JC, 1985, p. 158-60.34Hogberg, U, et al., 1987, p. 496.35Bullough, VL. Age at Menarche: A Misunderstanding. Science 1981, 213:365-6.36Russell, JC, 1948, p.157-8. Russell, JC, 1985, p. 207 and 142.37Russell, JC, 1985, p. 75.38Ascadi G; Nemeskeri J, 1970, p. 251.39Hogberg, U, et al., 1987, p. 498.40Lancaster, HO, 1990, p. 9.41Russell, JC, 1985, p. 60 and p. 75.42Ascadi G; Nemeskeri J, 1970, p. 258; Hogberg, U, et al, 1987, p. 501.43Floud, R et al., 1990, p. 21. Kunitz, SJ, 1987, p. 270.44Werner, A. London Bodies Over Time. In London Bodies , compiled by Alex Werner, London: Museum ofLondon, 1998, p. 108. Kunitz, SJ, 1987, p. 270-1 and Table 1, p. 275.45Daniell, C, 1977, p. 116-7.46Ibid, p. 129-132. Kunitz, SJ, 1987, p. 271.47Spalding, RN; Sinclair, DJ; Cox, A; Morely, KD. Dry Bones: A Paleopathological Study of SkeletalRemains From a Medieval Graveyard in Dundee. Scottish Medical Journal 1996, 41:56-59, p. 57.48Brothwell, D. On the Possibility of Urban-Rural Contrasts in Human Population Paleobiology. InHall, AR; Kenward, HK (eds.), Urban-Rural Connexions: Perspectives from EnvironmentalArchaeology , Oxford: Oxbow Books, 1994.49Daniell, C, 1997, p. 135.50Huber, N. The Problem of Stature Increase: Looking from the Past to the Present. In Brothwell, DR(ed.), The Skeletal Biology of Earlier Human Populations , Oxford: Pergamon Press, 1968, p. 72.51Werner, A, 1998, p. 108.52Knight, I; Eldridge, J. The Heights and Weights of Adults in Great Britain , London: Her Majesty’sStationery Office, 1984, p. 7. Daniell, C, 1997, p. 135.53Floud, R et al., 1990, p. 1.54Russell, JC. Tall Kings: The Height of Medieval English Kings. In Twelfth Century Studies , NewYork: AMS Press, 1978, p. 62.55Ibid, p. 61-71.56Ibid, p. 71.57Floud, R., et al., 1990, p. 1-8 and p. 227; Micozzi, MS, 1993, p. 51.58Lancaster, HO, 1990, p.242; Floud, R et al., 1990, p. 17.59Floud, R., et al., 1990, p. 17-20; Proos, LA. Anthropometry in Adolescence – Secular Trends, Adoption,Ethnic and Environmental Differences. Hormone Research, 1993, 39(suppl. 3):18-24, p. 18.60Largo, RH. Catch-Up Growth During Adolescence. Hormone Research 1993, 39(suppl. 3):41-48, p. 46.61Floud, R., et al., 1990, p. 4-8, p. 20, and p. 135.62Huber, N, 1968, p. 86-89; Knight, I, 1984, p. 9.63Floud, R., et al., 1990, p. 225-253; Largo, RH, 1993, p. 44 and 47; Proos, LA, 1993, p. 20.64Brothwell, D, 1994, p. 130-1; Riley, JC, 1986, p. 834-5.65Dyer, C. English Diet in the Later Middle Ages. In Aston, TH; et al. (ed), Social Relations and Ideas ,Cambridge: Cambridge University Press, 1983, p. 192-196 and p. 202-209.66Donkin, RA. Changes in the Early Middle Ages. In Darby, HC (ed.), A New Historical Geography ofEngland , Cambridge: University Press, 1973, p. 78-81 and p. 90.67Livi-Bacci, M, 1983, p. 294; Riley, JC, 1986, p. 834-5.
Old Age, Height and Nutrition: Felinah Memo Hazara Khan-ad-DinCommon Misconceptions About Medieval England [email protected] paper, Caidan Pentathlon, March 2003
68Outhwaite, RB. Progress and Backwardness in English Agriculture, 1500-1650. The Economic HistoryReview 1986, 39(1), 1-18, p. 5-6. Donkin, RA, 1973. p.78-9. Russell, JC, 1948, p. 233-5.69Hollingsworth, TH, 1975, p. 159.70Thwaites G, Taviner M, Gant V. The English sweating sickness, 1485 to 1551. New England Journal ofMedicine 1997, 336(8):580-2.71Kunitz, SJ, 1987, p. 275. Appleby, A. Nutrition and Disease: The Case of London, 1550-1750. Journal ofInterdisciplinary History 1975, 6(1)1-22, p. 7-19. Appleby, A. Epidemics and Famine in the Little IceAge. Journal of Interdisciplinary History 1980, 10(4)643-663, p. 645-53.72Kunitz, SJ, 1987, p. 275. Livi-Bacci, M, 1983, p. 2-3. Appleby, A, 1975. In the latter paper, Applebyshows that none of the epidemic diseases common in 17th century England, including tuberculosis, werecorrelated to bread prices. More recent research has shown that the tuberculosis mortality is clearlycorrelated to nutritional status (Lancaster, HO, 1990, p. 89), casting doubt on his correlation betweenbread prices and actual nutritional status. This does not cast doubt on the actual mortality statistics hepresents.73Appleby, A, 1980, p. 653-4.74Lewis, ME. Impact of Industrialization: Comparative Study of Child Health in Four Sites fromMedieval and Postmedieval England (A.D. 850-1859). American Journal of Physical Anthropology2002, 119:211-223, p. 222.75Kunitz, SJ, 1987, p. 276.76Appleby, A, 1980, p. 645.77Outhwaite, RB, 1986, p. 1.78Riley, JC, 1986, p. 833-4.79Appleby, A, 1980, p. 644-45.80Lancaster, HO, 1990, p. 89. Appleby, A, 1975, p. 7-19. Appleby, A, 1980, p. 645-53. Livi-Bacci, M, 1983,p. 2-3. Riley, JC, 1986, p. 857-8.81Livi-Bacci, M, 1983, p. 295. Hollingsworth, TH, 1975 p. 157. See also Table 1 in Kunitz, SJ, 1987, p.274.82This number is calculated from the doubling rate of the medieval English population from 1086(Domesday figures) to its pre-plague maximum in 1300. Donkin estimates the population in 1086 and1300 as 1.5 million and 4.5 million, respectively (Donkin, RA, 1973, p. 75-6.). Russell estimates the 1086figure as 1.1 million and the pre-plague maximum as 3.7 million, respectively (Russell, JC, 1948, p. 257).The averages of these two estimates, 1.25 million and 4 million, respectively, were plotted on semi-logpaper to obtain the slope of the logarithmic (Russell, JC, 1948, p. 257) population increase over thisperiod. The slope provided a doubling time of 130 years, or an increase of .77% per year (100%increase/130 years = .77% increase/year, or .77 increase per 100 population/year). In a village of 300people with no migration, this would add 2.3 individuals to the net population each year (.0077increase per person•300 people = 2.3 new persons per year).83Lancaster, HO, 1990, chapter 4. Ascadi G, and Nemeskeri J, 1980. Coale, A; Demeny, P. RegionalModel Life Tables and Stable Populations , New York:Academic Press, 1983, p. 42-6.84Coale, A, Demeny, P, 1983, p. 3-7.85Loschky, D, Childers, BD, 1993, p. 87-8, 92-3. Hatcher, J, 1986, p. 31-33. Hollingsworth, TH, p. 156-157.86Coale, A; Demeny, P, 1983, p. 42.87Hollingsworth, TH, 1975, p. 159.88Ascadi G; Nemeskeri J, 1970, p. 308-9.89Hollingsworth, p. 157.90Ibid, p. 156.91Loschky, D; Childers, BD, 1993, p. 88.92Ibid, p. 88.93Hatcher, J, 1986, p. 28.
Old Age, Height and Nutrition: Felinah Memo Hazara Khan-ad-DinCommon Misconceptions About Medieval England [email protected] paper, Caidan Pentathlon, March 2003
94Lancaster, HO, 1990, p.44.95Russell, JC, 1948, p. 374.96Knight, I, 1984, p. 7-11.
Bibliography
Ascadi G; Nemeskeri J. History of Human Life Span and Mortality, Budapest: AkademiaiKiado, 1970.
Appleby, A. Nutrition and Disease: The Case of London, 1550-1750. Journal of InterdisciplinaryHistory 1975, 6(1)1-22.
Appleby, A. Epidemics and Famine in the Little Ice Age. Journal of Interdisciplinary History1980, 10(4)643-663.
Brothwell, D. On the Possibility of Urban-Rural Contrasts in Human Population Paleobiology.In Hall, AR; Kenward, HK (eds.), Urban-Rural Connexions: Perspectives fromEnvironmental Archaeology, Oxford: Oxbow Books, 1994.
Bullough, VL. Age at Menarche: A Misunderstanding. Science 1981, 213:365-6.
Coale, A; Demeny, P. Regional Model Life Tables and Stable Populations, New York:AcademicPress, 1983.
Daniell, C. Death and Burial in the Middle Ages, London, New York: Routledge, 1997.
Donkin, RA. Changes in the Early Middle Ages. In Darby, HC (ed.), A New HistoricalGeography of England, Cambridge: University Press, 1973.
Dyer, C. English Diet in the Later Middle Ages. In Aston, TH; et al. (ed), Social Relations andIdeas, Cambridge: Cambridge University Press, 1983.
Floud, R; Wachter, K; Gregory, A. Height, Health and History: Nutritional Status in the UnitedKingdom, 1750-1980, Cambridge: Cambridge University Press, 1990.
Hatcher, J. Mortality in the Fifteenth Century: Some New Evidence. The Economic History Review1986, 39(1):19-38.
Hogberg, U; Iregren E, Claes-Henrik S; Diener L. Maternal Deaths in Medieval Sweden: AnOsteological and Life Table Analysis. Journal of Biosocial Science 1987, 19:495-503.
Hollingsworth, TH. A Note on Mediaeval Longevity of the Secular Peerage, 1350-1500.Population Studies 1975, 29(1):155-159.
Huber, N. The Problem of Stature Increase: Looking from the Past to the Present. In Brothwell,DR (ed.), The Skeletal Biology of Earlier Human Populations, Oxford: Pergamon Press,1968.
Knight, I; Eldridge, J. The Heights and Weights of Adults in Great Britain, London: HerMajesty’s Stationery Office, 1984.
Old Age, Height and Nutrition: Felinah Memo Hazara Khan-ad-DinCommon Misconceptions About Medieval England [email protected] paper, Caidan Pentathlon, March 2003
Kunitz, SJ. Making a long story short: A note on men’s height and mortality in England from the
first through the nineteenth centuries. Medical History 1987, 31:269-280.
Lancaster, HO. Expectations of Life, New York: Springer-Verlag, 1990.
Largo, RH. Catch-Up Growth During Adolescence. Hormone Research 1993, 39(suppl. 3):41-48.
Lewis, ME. Impact of Industrialization: Comparative Study of Child Health in Four Sites fromMedieval and Postmedieval England (A.D. 850-1859). American Journal of PhysicalAnthropology 2002, 119:211-223.
Lievegoed, B. Phases of Childhood, Edinburgh: Floris Books, 1997.
Livi-Bacci, M. The Nutrition-Mortality Link in Past Times: A Comment. Journal ofInterdisciplinary History 1983, 14(2):293-298.
Loschky, D; Childers, BD. Early English Mortality. Journal of Interdisciplinary History 1993,24(1):85-97.
Micozzi, MS. Functional Consequences From Varying Patterns of Growth and MaturationDuring Adolescence. Hormone Research 1993, 39 (supplement):49-58.
Outhwaite, RB. Progress and Backwardness in English Agriculture, 1500-1650. The EconomicHistory Review 1986, 39(1), 1-18.
Proos, LA. Anthropometry in Adolescence – Secular Trends, Adoption, Ethnic andEnvironmental Differences. Hormone Research, 1993, 39(suppl. 3):18-24.
Riley, JC. Insects and the European Mortality Decline. The American Historical Review 1986,91(4):833-858.
Russell, JC. British Medieval Population, Albequerque: University of New Mexico Press, 1948.
Russell, JC. The Control of Late Ancient and Medieval Population, Philadelphia: AmericanPhilosophical Society, 1985.
Russell, JC. Tall Kings: The Height of Medieval English Kings. In Twelfth Century Studies, NewYork: AMS Press, 1978.
Spalding, RN; Sinclair, DJ; Cox, A; Morely, KD. Dry Bones: A Paleopathological Study ofSkeletal Remains From a Medieval Graveyard in Dundee. Scottish Medical Journal 1996,41:56-59.
Thwaites G, Taviner M, Gant V. The English sweating sickness, 1485 to 1551. New EnglandJournal of Medicine 1997, 336(8):580-2.
Werner, A. London Bodies Over Time. In London Bodies, compiled by Alex Werner, London:Museum of London, 1998.
Reference style book: Dodd, JS. The ACS Style Guide, 2nd ed.