Gender Development Disoreders and Congenital Adrenal Hyperplasia Dr Olcay Evliyaoğlu.

IMPROVING COLLEGE READINESS, PURSUIT, ACCESS, AND PERSISTENCE OF
DISADVANTAGED STUDENTS
by
OLCAY YAVUZ
A dissertation submitted to
The Graduate School of Education
Rutgers - The State University of New Jersey
in partial fulfillment of the requirements
for the degree of
Doctor of Education
Graduate Program in Teacher Leadership
written under the direction of
___________________________
W. Steven Barnett, Ph.D.
__________________________
Lesley Morrow, Ph.D.
___________________________
Carol Dahir, Ed.D.
New Brunswick, New Jersey
May 2014

IMPROVING COLLEGE READINESS, PURSUIT, ACCESS, AND PERSISTENCE OF
DISADVANTAGED STUDENTS
ii
© 2014
Olcay Yavuz
ALL RIGHTS RESERVED

IMPROVING COLLEGE READINESS, PURSUIT, ACCESS, AND PERSISTENCE OF
DISADVANTAGED STUDENTS
iii
Rutgers, The State University of New Jersey
Graduate School of Education
New Brunswick, New Jersey
Announcement of Ed.D. Dissertation Defense
OLCAY YAVUZ
Improving College Readiness, Pursuit, Access, and Persistence of Disadvantaged Students
Committee: Prof. Dr. W. Steven Barnett, Prof. Dr. Lesley Morrow, Prof. Dr. Carol Dahir
Date: January 31, 2014
Time: 10:30am
Location: GSE ETPA Room 11
ABSTRACT
This study investigated how participation in the comprehensive College Readiness
Access and Success Program (CRASP) affected disadvantaged students’ college readiness,
pursuit, access, and persistence. The study was guided by three major research questions: (1)
What are the impacts of CRASP? (2) How does each component of CRASP affect college
readiness, pursuit, enrollment, and persistence? (3) What struggles do graduated PCSST students
report in their first year of college?
CRASP was implemented by the Paterson Charter School for Science and Technology’s
(PCSST) school counseling department. PCSST, located in Paterson, New Jersey, served 1,040
students, grades K through 12. Approximately 85% of PCSST’s students were enrolled in the
free and reduced lunch program, and 90% of the school’s population was African American or
Hispanic. The sample population for this study consisted of 384 PCSST alumni from the classes
of 2009 to 2013.

IMPROVING COLLEGE READINESS, PURSUIT, ACCESS, AND PERSISTENCE OF
DISADVANTAGED STUDENTS
iv
This study compared college-related outcomes of PCSST students who participated in
CRASP for different lengths of time (from none to four years). Multiple regression was used to
measure the relationship with CRASP, controlling for students’ basic demographics and abilities
prior to CRASP.
The findings showed that when professional school counselors, educational leaders, and
key stakeholders worked collaboratively to deliver comprehensive counseling programs such as
CRASP, disadvantaged students received measurable benefits in their college readiness, pursuit,
and access. Particularly, CRASP participation was associated with higher percentages of students
making necessary preparations to get ready for college and enrolling in post-secondary
institutions.
Overall, this study provided information on the efficacy of CRASP to inform local
decision making. Furthermore, it shed light on factors that hinder or help disadvantaged students’
college readiness, pursuit, access, and persistence. The findings also address disadvantaged
students’ low rates of college readiness, access to higher education, and completion of college
degrees. In line with the new college and career readiness accountability standards, the results
indicate a need for further investigation by creating research-based and innovative
comprehensive school counseling programs catering to the needs of disadvantaged students.

IMPROVING COLLEGE READINESS, PURSUIT, ACCESS, AND PERSISTENCE OF
DISADVANTAGED STUDENTS
v
ACKNOWLEDGEMENTS
First, I would like to thank my wife for her ongoing support and love. Thanks for being
an incredible wife and taking good care of our kids while I was working on my dissertation. I
cannot imagine what my life would be without her in it. I appreciate everything she has done for
me and for our kids. I especially want to thank her for constantly reminding me that I could do
this and always encouraging me to pursue my dreams. Selim and Kerem, thanks for being a
greatest joy of my life and being a stress relief during my dissertation writing process. Now my
dissertation is over and I can play with them all day. I hope that when you grow up, I will be able
to be good role model to show them the value of patience and perseverance and the importance
of family. I hope they will see that hard work always pays off and that learning never ends.
I also would like to thank my parents and my sister for their constant support through all
my up’s and down’s. Thanks for supporting my education dreams by giving me unconditional
love and allowing me to come to the United States of America. Even though they live so far
away, I knew that my parents have been there for me and have always prayed for me to pursue
my passions with unwavering support and enthusiasm. Mam, I finally made it, and after years, I
am coming home without bags of books and articles. Dad, Yes! You can call me as Doctor
Yavuz, but I will still NOT be able to write prescriptions for medicine and treat patients. To the
rest of my family, I thank you for your love and support.
Particularly, I want to thank my dissertation committee, Dr. Barnett, Dr. Morrow and Dr.
Dahir for their ongoing advice, support, and guidance in helping complete my research. It is
important to me for three of you to know that I could not have done this without your guidance
and support. I would especially like to thank my dissertation chair, Dr. Steve Barnett. He is a
remarkable advisor, researcher, and expert in quantitative design. Above all, he helped me design

IMPROVING COLLEGE READINESS, PURSUIT, ACCESS, AND PERSISTENCE OF
DISADVANTAGED STUDENTS
vi
my methodology and the conceptual model of my program. During group and individual
meetings, Dr. Barnett provided me ongoing support and very valuable strategies for my data
analysis. Otherwise, I would not have been able to finish this research study without your
guidance. Although words cannot fully express my feelings of gratitude and devotion, I would
like to say thank you.
Specially, I would also like to acknowledge Prof. Dr. Lesley Morrow for serving on my
committee. Her feedback, resourcefulness and wisdom were very helpful throughout my
dissertation experience. After the qualification process, Dr. Morrow strongly encouraged me to
study improving disadvantaged students’ college readiness, persistence, access and persistence.
Her continued support and confidence in my abilities helped me push through this process.
Finally, I would like to extend my utmost appreciation to school counseling professor,
graduate school advisor, dissertation committee member, and friend, Prof. Dr. Carol Dahir who
gave me my beginning in school counseling and inspired me to complete my doctorate. Starting
from 2006, she has taught me so much about school counseling education, program
development, ASCA National Model and accountability. Without Prof. Dr. Dahir’s support,
guidance, patience, encouragement and wisdom, I would never have been able to be successful
with my comprehensive school counseling program. As an expert school counselor educator and
professor, she also has contributed very much to my personal, social, career and professional
development. Over the years, I learned so much from Prof. Dr. Dahir. Her encouragement and
belief in my abilities helped motivate me to finish this process. She will also never know how
much she has inspired me to become a professional school counselor. Nonetheless, thank Prof.
Dr. Dahir for everything she has done for me since entering the master program in NYIT.

IMPROVING COLLEGE READINESS, PURSUIT, ACCESS, AND PERSISTENCE OF
DISADVANTAGED STUDENTS
vii
Specifically, I have truly enjoyed my experience as a as a doctoral student at Rutgers
State University Graduate School of Education. I would also like to thank the wonderful
classmates and instructors I have met while attending graduate school: Dr. Belzer, Dr. Ryan, Dr.
De Lisi, Dr. Firestone, Dr. Hayland, Dr. Bastardo, Dr. Sargent and Dr. Justice. A few friends I
have reserved a special “thank you” for are Anibal, Tara, Christine, Jim, David, Shannon, Mark,
Jenice, Mary Jo, Mildred, Patricia, Nicole, Michelle, Jennifer James Tyler, Jim and Cathleen,
your friendship has been very special to me. I look forward to many more years.
I am also greatly indebted to my fellow colleagues from PCSST. Specially, I would like
to thank school counselors Lana, Pat, Simone, Cara, Steve, Denise, to all teachers, school
administrators, alumni coordinators, college representatives, community member, parents and
students for their support and collaboration. Last, but not least, I thank the anonymous alumni
who shared their time and college experiences so that this study could have been possible. Thank
you all very much. “Peace, Happiness and Love Forever”

IMPROVING COLLEGE READINESS, PURSUIT, ACCESS, AND PERSISTENCE OF
DISADVANTAGED STUDENTS
viii
DEDICATION
I dedicate this to those who inspire me to be the best I can be
Sumeyra (my wife), Selim and Kerem (my sons)
Gulasem (my mother), Huseyin (my father), Gulay (my sister) and
All minority, low income and first generation students

IMPROVING COLLEGE READINESS, PURSUIT, ACCESS, AND PERSISTENCE OF
DISADVANTAGED STUDENTS
ix
TABLE OF CONTENTS
ABSTRACT ....................................................................................................................... iii
ACKNOWLEDGEMENTS ................................................................................................ v
DEDICATION ................................................................................................................. viii
LIST OF TABLES ............................................................................................................ xii
LIST OF FIGURES .......................................................................................................... xv
CHAPTER ONE: INTRODUCTION ................................................................................. 1
Definitions and Indicators of Key Terms ........................................................................ 4
Problem Statement and Research Questions................................................................... 5
Significance of the Study ................................................................................................ 7
CHAPTER TWO: LITERATURE REVIEW ................................................................... 12
Historical Perspective ................................................................................................... 13
The Social Justice Issues in College Access and College Success ............................... 29
Multi-Level Theoretical Framework............................................................................. 32
What Works in Improving Disadvantaged Students’ College Access, Persistence, and
Attainment? ................................................................................................................... 40
Limitations of Existing Research .................................................................................. 50
The Logic Model of CRASP......................................................................................... 79
Theoretical Framework of CRASP ............................................................................... 82
CHAPTER IV: RESEARCH DESIGN ........................................................................ 85

IMPROVING COLLEGE READINESS, PURSUIT, ACCESS, AND PERSISTENCE OF
DISADVANTAGED STUDENTS
x
Pilot Study ..................................................................................................................... 86
Context, Setting, and Basic Demographics of Participants .......................................... 87
The Instrumentation and Data Sources ......................................................................... 95
Data Collection ............................................................................................................. 98
Data Analysis .............................................................................................................. 100
Variables ..................................................................................................................... 101
The Role of the Researcher ......................................................................................... 104
Reliability and Validity ............................................................................................... 105
CHAPTER FIVE: FINDINGS ........................................................................................ 107
Model 1: Effects of CRASP on College Readiness .................................................... 107
Model 2: Effects of CRASP on College Pursuit ......................................................... 122
Model 3: Effect of CRASP on Post-Secondary Enrollment ....................................... 129
Model 4: Effect of CRASP on Freshman to Sophomore Post-Secondary Persistence 134
CHAPTER SIX: DISCUSSION ..................................................................................... 140
Implication for Practices and Polices in Improving College Readiness ..................... 140
Implication for Practices and Policies in Improving College Pursuit ......................... 145
Implication for Practices and Policies in Improving Post-Secondary Access ............ 149
Implication for Practices and Policies to Improve Freshman to Sophomore Post-
Secondary Persistence ................................................................................................. 151
Helping Disadvantaged Students Deal with Challenges ............................................. 152

IMPROVING COLLEGE READINESS, PURSUIT, ACCESS, AND PERSISTENCE OF
DISADVANTAGED STUDENTS
xi
Implication for Counselor Education and State Policy ............................................... 154
Limitation of the Study ............................................................................................... 156
Implications for Future Research ................................................................................ 159
Conclusion .................................................................................................................. 160
REFERENCES ............................................................................................................... 163
APPENDIX: PCSST ALUMNI SURVEY ..................................................................... 182
IMPROVING COLLEGE READINESS, PURSUIT, ACCESS, AND PERSISTENCE OF
DISADVANTAGED STUDENTS
xii
LIST OF TABLES
1. The Effect of Reform Eras on School Counseling and K-16 Education. ..................... 29
2. The Number of Students in Cohort from 2009 to 2013 ................................................ 90
3. PCSST School Enrollment and Waiting List in 2011-2012 ......................................... 92
4. ANOVA of Participants’ Demographic Information by CRASP Participation............ 92
5. ANOVA Table of Participants’ Demographic Information by Years Spent in CRASP94
6. Data Sources and the Number with Data ...................................................................... 97
7. Survey Takers by Cohort .............................................................................................. 99
8. Dependent Variables ................................................................................................... 103
9. Independent Variables ................................................................................................ 103
10. CRASP Components ................................................................................................. 104
11. SAT Takers by CRASP Participation ....................................................................... 108
12. SAT Takers by Years Spent in CRASP .................................................................... 109
13. Summary of Binary Logistic Regression Analysis for CRASP Participation and
Variables Predicting the SAT Participation (N=384) ..................................................... 110
14. Summary of Binary Logistic Regression Analysis for Years in CRASP and Variables
Predicting the SAT Participation (N=384) ..................................................................... 112
15. Summary of Stepwise Binary Logistic Regression Analysis for Variables
Predicting the SAT Participation (N=171) ..................................................................... 113
16. SAT Composite Scores by CRASP Participation ..................................................... 114
17. SAT Composite Scores by Years Spent in CRASP .................................................. 114
18. SAT composite scores from the last time the test was taken by CRASP ................. 115

IMPROVING COLLEGE READINESS, PURSUIT, ACCESS, AND PERSISTENCE OF
DISADVANTAGED STUDENTS
xiii
19. Summary of Linear Logistic Regression Analysis for CRASP Participation and Variables
Predicting the SAT Composite Score (N=267) .............................................................. 116
20. Summary of Linear Logistic Regression Analysis for Years in CRASP and Variables
Predicting the SAT Composite Score (N=267) .............................................................. 118
21. Summary of Stepwise Linear Logistic Regression Analysis for Variables Predicting
the SAT Composite Scores (N=171) .............................................................................. 119
22. Final High School Cumulative GPA by CRASP Participation ................................ 120
23. Final High School Cumulative GPA by Years Spent in CRASP ............................. 120
24. Summary of Linear Logistic Regression Analysis for CRASP Participation and
Variables Predicting GPA (N=384) ................................................................................ 121
25. Summary of Linear Logistic Regression Analysis for Years Spent in CRASP and
Variables Predicting GPA (N=384) ................................................................................ 121
26. Number of Post-Secondary Applications by CRASP Participation ......................... 123
27. Number of Post-Secondary Applications by Years Spent in CRASP ...................... 123
28. Summary of Linear Logistic Regression Analysis for CRASP Participation and
Variables Predicting the Number of Post-Secondary Applications (N=376) ................. 124
29. Summary of Linear Logistic Regression Analysis for Years in CRASP and Variables
Predicting the Number of Post-Secondary Applications (N=376) ................................. 125
30. Summary of Stepwise Linear Logistic Regression Analysis for Variables Predicting
the Number of College Applications (N=171)................................................................ 126
31. FAFSA Completion by CRASP Participation .......................................................... 127
32. FAFSA Completion by Years Spent in CRASP ....................................................... 127
33. Summary of Linear Logistic Regression Analysis for CRASP Participation and
IMPROVING COLLEGE READINESS, PURSUIT, ACCESS, AND PERSISTENCE OF
DISADVANTAGED STUDENTS
xiv
Variables Predicting the FAFSA Completion (N=376) .................................................. 128
34. Summary of Linear Logistic Regression Analysis for Years in CRASP and Variables
Predicting the FAFSA Completion (N=376) .................................................................. 128
35. Summary of Stepwise Binary Logistic Regression Analysis for Variables
Predicting the FAFSA Completion (N=171) .................................................................. 129
36. Post-Secondary Enrollment by CRASP Participation (N=384)................................ 131
37. Summary of Linear Logistic Regression Analysis for CRASP Participation and
Variables Predicting Post-Secondary Enrollment (N=384) ............................................ 131
38. Summary of Linear Logistic Regression Analysis for CRASP Participation and
Variables Predicting Post-Secondary Enrollment ........................................................... 132
39. Summary of Linear Logistic Regression Analysis for Years in CRASP and Variables
Predicting the Post-Secondary Enrollment ..................................................................... 132
40. Summary of Stepwise Binary Logistic Regression Analysis for Variables
Predicting the Post-Secondary Enrollment (N=171) ...................................................... 133
41. Freshman to Sophomore Persistence by CRASP Participation ................................ 134
42. Freshman to sophomore persistence by years spent in CRASP ............................... 135
43. Summary of linear logistic regression analysis for CRASP participation and variables
predicting freshman to sophomore persistence (N=191) ................................................ 136
44. Summary of Linear Logistic Regression Analysis for Years in CRASP and Variables
Predicting Freshman to Sophomore Persistence (N=191) .............................................. 136
45. Freshman to Post-Secondary Persistence by Institution Type and Years in CRASP 137
46. The Rank of Challenges Students Face in College (N=171) .................................... 138
47. Dropout Reasons (N=120) ........................................................................................ 139

IMPROVING COLLEGE READINESS, PURSUIT, ACCESS, AND PERSISTENCE OF
DISADVANTAGED STUDENTS
xv
LIST OF FIGURES
1. Life time earning by education level. ............................................................................. 9
2. The literature map of the study. .................................................................................... 13
3. Relationship between share of jobs and post-secondary education and training. ......... 19
4. The influence of capitals on student outcomes. ............................................................ 39
5. The conceptual model of the CRASP. .......................................................................... 81
6. The theoretical model of CRASP. ................................................................................ 84
7. PCSST school demographics in 2011-2012. ................................................................ 88
8. School demographics of PCSST and the Paterson Public School District. .................. 89
9. College readiness. ....................................................................................................... 107
10. Effects of CRASP on post-secondary pursuit. .......................................................... 122
11. Effects of CRASP on post-secondary enrollment. .................................................... 130
12. Effect of CRASP on freshman to sophomore post-secondary persistence. .............. 134

IMPROVING COLLEGE READINESS, PURSUIT, ACCESS, AND PERSISTENCE OF
DISADVANTAGED STUDENTS
1
CHAPTER ONE: INTRODUCTION
In 2010, the Blueprint for Reform, released by the U.S. Department of Education,
proposed the reauthorization of the Elementary and Secondary Education Act (ESEA). As
indicated in the Blueprint for Reform (2010), America was once the best educated nation in the
world. A generation ago, the U.S. led all other nations in college completion rates, and in the
same time period, the United States had the highest post-secondary graduation participation rate
among the Organization of Economic Cooperation and Development (OECD) countries.
However, by 2010, according to the Blueprint for Reform, ten countries had surpassed America
in college completion, and the U.S. also dropped from ranking first in the world to 13th
in higher
education participation. This led the federal government to focus on school reforms, with the
goal of ensuring that every student graduating from high school is ready for college or a career,
regardless of their income, race, ethnicity or language background, or disability status. Armed
with these statistics, President Obama stated that, “by 2020, America will once again have the
highest proportion of college graduates in the world” (U.S. Department of Education, 2010, p.1).
In short, aligned with President Obama’s statement and the new federal college and career
readiness standards for all students in English language arts and mathematics; and developing
better assessments aligned with college and career-ready standards , national attention was
focused on helping all students get ready for, get into, and get through college and/or preparing
for a career.
Although public secondary schools are helping students graduate from high school, about
40 percent of high school graduates are not adequately prepared by their high schools to meet the
rigor of college coursework according to recent studies (Hart, 2005; Blueprint for Reform, 2010).
Consequently, high school graduates have to take remedial courses that extend their time in

IMPROVING COLLEGE READINESS, PURSUIT, ACCESS, AND PERSISTENCE OF
DISADVANTAGED STUDENTS
2
college. In addition to this lack of academic readiness, employers agree that today’s high school
education leaves a large proportion of students unprepared for the expectations that they face in
entry-level jobs (Hart, 2005).
In this study, the researcher explores which factors assist or hinder disadvantaged
students in achieving their college and career goals. The purpose of this study is to explore a
range of academic and counseling programs, information, and strategies that can help Paterson
Charter School for Science and Technology (PCSST), as well as other secondary institutions,
design a comprehensive school counseling program that enables students to successfully get into
a college and earn a post-secondary degree. This study also provides readers with practical
examples of successful college readiness strategies through the exploration of college
experiences of former PCSST students who graduated between 2009 and 2013. Furthermore, this
dissertation research study will help both secondary and post-secondary institutions understand
the needs and challenges that disadvantaged students face in their first year of college. Finally,
this study provides key stakeholders in both secondary and post-secondary institutions with
practical partnership strategies to improve their students’ college success and retention by
designing comprehensive school counseling programs.
According to the PCSST 2011-12 school report card, around 90 percent of the students
are Hispanic or African American, and the majority of students come from first generation
college-bound, and low-income families. PCSST is considered a high-poverty school, and
recognizes the importance and challenges of preparing its students to be college and career-
ready. The College Readiness Access and Success Program (CRASP) was initiated and
implemented by the director of the PCSST school counseling department in September, 2009, to
address this need. CRASP is aligned with the American School Counselor Association’s (ASCA)

IMPROVING COLLEGE READINESS, PURSUIT, ACCESS, AND PERSISTENCE OF
DISADVANTAGED STUDENTS
3
National Model (2005), and is a comprehensive model that provides activities to engage and
prepare disadvantaged urban high school students for college and a career.
Overall, this quantitative research study is designed to examine the impacts of CRASP on
PCSST’s graduated students' college readiness, pursuit, access, and persistence in their first year
of college. The study consists of six major sections: introduction, a literature review, CRASP
description, the methodology section, the study findings, a discussion, and the conclusion.
In the first section, the researcher provides a statement of the problem and identifies the
research questions. The second chapter provides a review of the literature and theories regarding
college readiness and retention of students at risk, and lessons learned from the best practices and
previous studies. Within the literature review, the researcher discusses how the previous research
studies have approached the issue of college access and retention of students at risk. The
literature review also addresses how this study relates to and builds on what has been done
substantively and methodologically in preparing minority and disadvantaged students for college
or careers after high school. The third chapter introduces in detail the components, conceptual
model, and theoretical framework that forms the foundation for the “CRASP” approach.
The fourth and fifth chapters are the Methodology and Findings sections of the study,
respectively. In the fourth chapter, the researcher includes a description of the research design,
sampling procedures, data collection, and data analysis methodology, as well as the role of the
researcher, validity and reliability issues. In chapter five, the researcher presents the findings of
the research study. Then, in chapter six, the dissertation study concludes by offering possible
broad implications for educational policy, research, and practice. Overall, this comprehensive
evaluation of CRASP has the potential to help high schools assess their own efforts in meeting

IMPROVING COLLEGE READINESS, PURSUIT, ACCESS, AND PERSISTENCE OF
DISADVANTAGED STUDENTS
4
the needs of disadvantaged students by highlighting a wide range of academic and counseling
interventions available to the key stakeholders.
Definitions and Indicators of Key Terms
Several technical terms are used in this dissertation study. In particular, the study
includes terms such as college readiness, college retention, persistence, matriculation, college
attrition, attainment, and retention. Providing an operational definition of these terms is expected
to help readers better understand the issues discussed in this study of disadvantaged students’
college retention and success. Therefore, definitions of these terms, which may be useful for
readers, are given below.
College Readiness: In the literature, there are four approaches that are primarily used to describe
college readiness. The most common approach is to define college readiness in terms of high
school course-taking patterns, including course titles and the number of credits required for
graduation, combined with the grades students receive in those courses (Callan, Finney, Kirst,
Usdan, & Venezia, 2006). A second approach is to measure college readiness through students’
performance on standardized college entrance test scores, such as the ACT and SAT tests (ACT,
2005). The College Board (2010) provides a third approach, which defines college readiness as
“…when they have the knowledge, skills, and behaviors to complete a college course of study
successfully, without remediation.” Finally, Conley (2007) offers the following approach:
“college readiness is a multi-faceted concept comprising numerous factors, both internal and
external, to the classroom environment” (Conley, 2007, p.12). Conley’s model consists of four
key areas: cognitive strategies, content knowledge, academic behaviors, and contextual skills and
awareness. In general, Conley’s model is promising; however, it does not currently enjoy

IMPROVING COLLEGE READINESS, PURSUIT, ACCESS, AND PERSISTENCE OF
DISADVANTAGED STUDENTS
5
widespread usage since many colleges consider grade point average and the SAT as the best
predictors of college readiness.
College Retention: In general, retention is defined as a percentage measurement that shows how
many students re-enrolled at an institution that they attended the previous year. A retention rate
commonly measures the percentage of freshmen that re-enroll the next academic year as
sophomores (Arnold, 1999, p.5). As mentioned in the report prepared by the Texas Guaranteed
Student Loan Corporation (1999), retention rates are important because they are perceived as
indicators of academic quality and student academic success.
College Matriculation: To officially enroll as a student in a post-secondary institution.
College Persistence: A college student’s continuation of behavior leading to a desired goal, that
helps describe processes related to student goal achievement (Arnold, 1999).
College Pursuit: Showing ongoing effort to get into and through college.
College Attainment: Reaching a desired goal in earning a college degree.
College Attrition: A post-secondary institution’s loss of undergraduate students.
Problem Statement and Research Questions
When the researcher was hired by PCSST as a high school counselor in 2009, he realized
that there was no embedded culture of college pursuit for students at PCSST. According to the
archived student records, the four year college acceptance rate was only around 20 percent. In
conjunction with this college enrollment data, the majority of students were not engaged in
college and career related activities such as FAFSA completion, SAT taking, and completing
college applications. In other words, the researcher noticed that prior to the implementation of
the CRASP, PCSST students were not attempting to take college entrance exams and fill out
college and financial aid applications. In particular, during the 2008/2009 school year, no juniors

IMPROVING COLLEGE READINESS, PURSUIT, ACCESS, AND PERSISTENCE OF
DISADVANTAGED STUDENTS
6
took the PSAT, which is one of the most important indicators of college pursuit. Parallel to the
PSAT data, approximately 60% of the class of 2009 did not take the SAT. In order to assist
PCSST students with planning their careers and post-secondary education, the CRASP was
developed and implemented in September 2009 at PCSST. The main goals of CRASP are to help
PCSST students improve their: (1) post-secondary education and career readiness; (2) college
pursuit; (3) college access, and (4) college persistence.
As more and more students graduated from PCSST and moved on to college and other
post high school graduation options between 2009 and 2013, the researcher, PCSST
administrators, teachers, and parents wanted to know if PCSST graduates who enrolled in
college were able to achieve academic success and stay in college. It is noted that although
CRASP had been conducted for four years at the time of this study, the full impact of CRASP on
students’ college readiness and success had not been measured. The short and long term effects
of CRASP were not fully known due to a lack of data on how PCSST alumni were doing in
college.
In short, the research on CRASP’s effects on college retention fell somewhat behind the
initial CRASP research, which focused primarily on getting PCSST seniors into college after
high school graduation. This new focus on college retention is considered an important
contribution to the PCSST community and literature. To this end, this dissertation study was
conducted to explore PCSST graduates’ experiences in getting ready for college and graduating
successfully. Other than archived student achievement data such as GPA and the SAT, this
researcher developed a comprehensive survey to explore the first-year of PCSST alumni’s
college experiences. The survey results are also expected to explore how PCSST could help its
IMPROVING COLLEGE READINESS, PURSUIT, ACCESS, AND PERSISTENCE OF
DISADVANTAGED STUDENTS
7
former students stay in college and help future PCSST students by revising and improving
CRASP.
Aligned with the research purpose, this study has been guided by three major research
questions. The primary research question is: What are the impacts of CRASP on students' college
readiness, college pursuit, college access, and persistence in their first year of college? The
second research question is: What parts of students’ high school and college experiences are
most critical to help them get ready for college and achieve in college? The third question is:
What major struggles did former PCSST students face in their first year of college? While the
main focus of this study is to address each of these research questions, it also aims to help the
PCSST administration and stakeholders understand how well they are supporting their students’
college readiness, access, and success. By informing these stakeholders of this study’s findings,
it is hoped that a feedback loop can act as a springboard to improve and broaden the reach of
CRASP.
Significance of the Study
This dissertation study focuses on improving college readiness, pursuit, access, and
persistence for disadvantaged students through a comprehensive school counseling program. In
this study, the term “disadvantaged” include African American and Hispanic students, low-
income students, first generation college students, special education students, and ESL students.
These disadvantaged students are a significant part of the college population, and they are more
likely to face attrition (ACT, 2010). Therefore, it is important to understand what interventions
work in preparing disadvantaged students for college. To that end, this research study sought to
extend educators’ knowledge about designing and leading comprehensive school counseling
programs that might help disadvantaged students get ready for college, get into college, graduate
IMPROVING COLLEGE READINESS, PURSUIT, ACCESS, AND PERSISTENCE OF
DISADVANTAGED STUDENTS
8
from college, and ultimately find a job in their chosen field. It also sought to explore effective
partnership strategies between secondary schools and post-secondary institutions so they can
work collaboratively to improve the college and career readiness of disadvantaged students.
For Students
Higher education is increasingly important to career success; entering and completing
college can drastically affect an individual’s career path and lifetime earnings. As shown in
Figure 1 (adapted from Carnevale, Rose, & Cheah, 2011), individuals who have a four-year
bachelor’s degree earn, on average, $2.2 million over a work lifetime, and about 50% more than
workers with only a high school diploma. Lifetime income rises even more with a doctoral or
professional degree; although earning a degree is not the only reason that degree holders have
higher lifetime earnings, it is a contributing factor. Moreover, Williams and Swail (2005)
reported that post-secondary education and career training lead to better employee benefit
packages, better health care, increased social status, longer vacations, and better work conditions.
Therefore, this dissertation study is significant for students because it aims to help disadvantaged
students prepare for college and succeed in college so that they can earn the degrees that will
enable them to earn greater economic and social status.

IMPROVING COLLEGE READINESS, PURSUIT, ACCESS, AND PERSISTENCE OF
DISADVANTAGED STUDENTS
9
Figure 1. Life time earnings by education level (Carnevale, Rose, & Cheah, 2011)
Finally, aside from the positive economic impact of college success, researchers also
emphasize the adverse impact of college failure on an individual’s mental and emotional health.
For instance, Jimerson (2001) noted that retained students are more likely to experience lower
self-esteem relative to promoted peers. In addition, students who drop out of college without
earning their degrees are more likely to experience personal and mental problems, such as
psychological disorders. Thus, this dissertation study, particularly its focus on improving the
college readiness, access and persistence of students, would directly benefit PCSST students,
who need ongoing guidance and support to earn a college degree.
For PCSST and High Schools
We live in the age of accountability. This study, which focuses on building a collective
capacity among stakeholders for improving college readiness and college persistence, will help
1
1.4
1.7
2.2
2.6
3.2
3.6
No HighSchoolDegree
HS Graduate Associate’s Degree
Bachelor'sDegree
Master'sDegree
DoctoralDegree
ProfessionslDegree
Million Dollars

IMPROVING COLLEGE READINESS, PURSUIT, ACCESS, AND PERSISTENCE OF
DISADVANTAGED STUDENTS
10
PCSST become better prepared to address the state’s accountability reports on post-secondary
performance. This study also benefits PCSST by collecting data regarding the percentage of
students who apply to post-secondary schools, the percentage of students who took the SAT and
the percentage of former students who were accepted to college. Moreover, this study helps
PCSST know what percentage of graduated PCSST students enrolled in a post-secondary
institution and stayed in college.
Finally, this study provides information on the efficacy of the PCSST College Readiness
Access and Success Program (CRASP). It will shed light on factors that hinder or help PCSST
students’ college readiness, pursuit, access and persistence. Information obtained from this study
can be used to help improve the CRASP model. The findings of this study can be also helpful
for other secondary schools. In particular, the study can help other urban high schools better
understand the challenges that disadvantaged students face in their first year of college, and the
impacts of programs like CRASP. It can also provide insight into designing high school
programs that can help disadvantaged or minority students enter and succeed in college.
For Society and Economic Growth
As Zumeta, Breneman, Callan, and Finney (2012) reported that over the past five
decades, economists have carefully studied the labor market “returns” on investments in “human
capital” via higher education. The strong and consistent finding of these studies is that higher
education and post-secondary training have paid off well for most individuals. Additionally,
returns to society on its investments in post-secondary education are generally found to be
significantly positive and also offer a wide range of non-pecuniary benefits (Psacharopoulos &
Patrinos 2004; Williams & Swail, 2005; Baum & Payea, 2004; McMahon 2009). Therefore, this

IMPROVING COLLEGE READINESS, PURSUIT, ACCESS, AND PERSISTENCE OF
DISADVANTAGED STUDENTS
11
study’s focus on increasing college readiness and college persistence provides information that
benefits society in several ways, as described below.
First, from an economic perspective, both federal and state governments provide billions
of dollars per year for public K-12 and post-secondary institutions by allocating grants, loans,
and work assistance, as well as tax credits and deductions, to help students finance post-
secondary education (Carnevale, Jayasundera, and Hanson, 2012). However, if students are
poorly prepared and not succeed in college, money as well as their talents, skills, time, and effort
will be wasted, not only for the individual but for society as a whole. This dissertation benefits
society by contributing knowledge about how to better disadvantaged students get into college
and complete it successfully.
In addition to the economic returns to individual, Williams and Swail (2005), as well as
Baum and Payea (2004), have found that post-secondary education improves the quality of life
for a society in a variety of ways. For example, individuals with higher levels of education are
more likely to be a part of organized volunteer work, vote, and give back to their communities in
other ways. Other social benefits include decreased reliance on public assistance, increased tax
revenues, lower demands on the criminal justice system, better parenting skills, and increased
entrepreneurial activity (Watts, 2001). Furthermore, the investment in improving college and
career readiness has been linked to lower incarceration rates, more volunteerism, and more
democratic participation. In reference to these statements, this dissertation research study will
help the Paterson community as a whole, as well as individuals, by exploring and presenting
effective strategies that work to improve the college readiness and success of disadvantaged
students.

IMPROVING COLLEGE READINESS, PURSUIT, ACCESS, AND PERSISTENCE OF
DISADVANTAGED STUDENTS
12
CHAPTER TWO: LITERATURE REVIEW
Over the last two decades, numerous research studies have been conducted on the college
readiness and retention of disadvantaged students. It is very challenging to include all past
research in this dissertation study. Therefore, during the article selection process, the researcher
utilized Cooper’s (1998) four main criteria for inclusion and exclusion of articles from the
literature review. The selected research studies are discussed with sufficient details to provide an
understanding of their relevance, how they contribute to this study, and indicate how this study
moves beyond them. Overall, the literature review focused primarily on empirical, peer-reviewed
studies related to improving the college readiness and retention of students at risk. However,
seminal research in each area of interest was also utilized when necessary to strengthen the
literature review. Furthermore, the majority of studies covered in this review were published in
the last ten years.
In general, this literature review investigates the effects of various interventions and
support programs on disadvantaged high school students’ college preparation and retention. The
literature review is organized to answer the following questions: (a) How has school counseling
changed as the structure and expectations of K-16 education have changed historically?; (b)
What are the social justice issues surrounding college readiness and retention?; (c) What
theoretical framework can be used to understand college readiness and retention for
disadvantaged students?; and (d) What works in preparing disadvantaged students for college
and graduation? Figure 2 provides a literature map of the research indicating how the researcher
organized the literature review. At the end of the literature review, the researcher discusses how
previous research informs this study and describes the components of CRASP in detail.

IMPROVING COLLEGE READINESS, PURSUIT, ACCESS, AND PERSISTENCE OF
DISADVANTAGED STUDENTS
13
•Low income Students
•First Generation Students
•Students of Color
•Human Capital
•Social Capital
•Cultural Capital
•Financial Capial
•Progressive-Era
•Civil Rights Era
•Post Nation-at-Risk Era
•Practices
•Policies
•Research
What Works
Historical Perspective
Social justice issues
Theoretical
Framework
Figure 2. The literature map of the study.
Historical Perspective
Over the past few years, educational stakeholders, researchers, and policy makers have
been specifically focusing on the college and career readiness of disadvantaged students. In this
part of the study, the researcher explores what made the nation turn its attention to preparing
high school graduates, regardless of their gender, race, ethnicity, or socio-economic situation, for
college and careers. Focusing on such questions as: “over the past five decades, what has
changed?” and “why are American students’ college and career readiness very important for the
future of the nation?” is crucial to adopt a historical perspective to understand why federal and
state educational leaders, policy makers, and educators from K-12 and higher education have
been recently significantly focusing on college and career readiness. In order to answer the

IMPROVING COLLEGE READINESS, PURSUIT, ACCESS, AND PERSISTENCE OF
DISADVANTAGED STUDENTS
14
questions above, the researcher identified and applied a historical understanding of the effects of
the three main American education era reforms on college and career readiness during the last
century. In addition, the researcher described how these era reforms since 1890 have shaped the
roles of school counselors and the function of schools.
Progressive-era (1890-1940)
At the beginning of the 20th
century, the United States was becoming increasingly urban
since cities were crowded with immigrants who moved to America from all parts of the world.
Between 1890 and 1930, over 22 million people migrated to the United States, including almost
three million children (Hochschild and Powell, 2008). Therefore, during the progressive era,
educational reformers sought to make significant structural and pedagogical changes in
education. For example, the compulsory school attendance law was passed in 1909, and states
increased their support for schooling. Furthermore, up to the progressive education movement,
the focus of education was the subject matter to be learned. However, with the implementation of
the progressive era reforms, the 20th
century education system started to focus more on the
individual needs of students. In particular, the philosopher and educator John Dewey
significantly influenced American education. John Dewey was passionate for democracy and he
was an advocate for social justice so that all people may share in a common life. He emphasized
the importance of active learning, as well as scientific and measurable educational strategies to
increase the quality of education and student learning. Overall, during the progressive era, the
applied physical, life, and social sciences received growing attention to meet the demands of
industry, business, and agriculture (Reese, 2005).
Similar to K-12 education, events such as the Industrial Revolution, World War I (1914-
1918), and the progressive era reforms also influenced the higher education system in America.

IMPROVING COLLEGE READINESS, PURSUIT, ACCESS, AND PERSISTENCE OF
DISADVANTAGED STUDENTS
15
For example, after 1837, the Historically Black Colleges and Universities (HBCUs) began to
open and admit African American students. Later in 1862, Congress passed the Morrill Act, and
with the implementation of this law, signed by President Abraham Lincoln, colleges and
universities became assisted by federal funding. In addition, eligible states received 30,000 acres
of federal land to establish colleges and universities (Altbach, Berdahl, & Gumport, 2005). At
that time, federal funding for higher education was given to post-secondary institutions to
educate farmers, scientists, and teachers. Then, in 1890, the Second Morrill Act passed, which
provided additional endowments and gave educational opportunities to people of all social
classes. When all things are taken into consideration, post-war prosperity, as well as the various
Morrill Acts, improved the college attendance rate by nearly double between 1920 and 1930
(Lazerson, 1998; Archibald, 2002). In addition, college entrance exams were developed at this
time. As a result, this significant investment in higher education encouraged employers to hire
applicants who possessed college degrees.
While reforms were influencing the structure and function of schools, the roles and
responsibilities of professional school counselors have also historically been changed by the
many influences over the last century. For instance, around the turn of the twentieth century, the
vocational and technical aim of education began to gain significant importance. As a result of
this, the main purpose of schooling was viewed as the way children gained knowledge and skills
for their future careers (Gysbers, 2001). Therefore, the first school counselors, who existed as
vocational counselors nearly 100 years ago, emphasized linking education with work. In
particular, Frank Parsons, known as the “father of guidance”, became a very influential scholar
and played an important role in expanding the concept of vocational guidance (Dahir & Stone,
2012). In short, during the early years of school counseling, the main duties of these vocational

IMPROVING COLLEGE READINESS, PURSUIT, ACCESS, AND PERSISTENCE OF
DISADVANTAGED STUDENTS
16
counselors included preparing students for work based on their personal values, attributes,
aspirations, and interests.
Civil Rights Era (1950-1974)
Between 1950 and 1974, national protests that were focused on equal opportunity for all
deeply influenced school reforms. For example, in the early 1950's, racial segregation in both K-
12 schools and post-secondary institutions was the norm across America. However, in 1954,
because of the Supreme Court’s ruling in Brown vs. the Board of Education of Topeka, Kansas,
African American students gained the opportunity and right to attend predominantly white K-12
schools and colleges (Kluger, 1975). Then, the Civil Rights movement of the 1960’s encouraged
post-secondary institutions to actively recruit black and other minority students. As a result of
the Supreme Court's Brown v. Board of Education decision, and the Civil Rights movement, the
racial diversity of the student population in higher education has been significantly increased.
Furthermore, in 1957, Sputnik 1 was launched by Soviet Union, which was a major
technological advance at that time. The success of Russian scientists triggered competitions on
an international level. In the 1960’s, America focused on exploring funds and resources to
identify and encourage gifted and talented students to attend post-secondary education in the
fields of Science, Technology, Engineering, and Mathematics (STEM) (Tannenbaum, 1958)
because of this competition.
Right after the Civil Rights movement and the National Defense Act, the Higher
Education Act (HEA) was passed in 1965. With the implementation of the Higher Education
Act, the federal government provided financial support to both public and private higher
education institutions, as well as to the individual students. Since 1965, in order to increase the
number of low-income students, the HEA was amended three times by 1980. Furthermore, Pell
IMPROVING COLLEGE READINESS, PURSUIT, ACCESS, AND PERSISTENCE OF
DISADVANTAGED STUDENTS
17
grants, educational loan opportunities with lower interest rates, and early intervention programs
provided both academic and financial aid to the neediest minority students (United States
Department of Higher Education, 1998).
Reforms have been influencing the structure and function of schools, as Dahir (2003)
states, “The history of school counseling has depicted a profession in search of an identity” (p.
345). Parallel to this statement, the role of the school counselors was changed and redefined
during the Civil Rights era, much like the function of K-12 schools and colleges. For example,
this generation of counselors was expected to have the skills and expertise in intelligent
measurements and therapeutic interventions, psychological assessment, and college admission
for the purpose of serving all students (Dahir & Stone, 2012). Later in 1958, the National
Defense Education Act (NDEA) was enacted and provided appropriate funding for the school
counseling profession. As a result, the number of professional school counselors tripled between
1958 and 1967 (Wittmer, 2000). The American School Counselor Association (ASCA) was
founded in 1953 and has had a significant influence on the development of the profession, as
well as the development of school counseling in K-12 schools (Burnham & Jackson, 2000). With
the foundation of the ASCA, professional school counselors had their own credentials, standards,
and guidelines to meet the needs of all students. In addition, the ASCA encouraged school
counselors and key stakeholders to work collaboratively towards their goal of improving
students’ academic, personal-social, and career development.
The Post Nation-at-Risk Reform Era (1980s-Current)
Secretary of Education T. H. Bell created the National Commission on Excellence in
Education on August 26, 1981, directing it to examine the quality of education in the United
States and to make a report to the nation (The National Commission on Excellence in Education,

IMPROVING COLLEGE READINESS, PURSUIT, ACCESS, AND PERSISTENCE OF
DISADVANTAGED STUDENTS
18
1983). This report is viewed as a landmark event in American educational history and contains
practical recommendations for educational improvement, as well as reshaping the structure and
functions of schooling. The National Commission on Excellence in Education gave particular
attention to identifying educational programs that result in notable student success in college.
The Commission's charter also assessed the quality of teaching and learning in the Nation's
public and private schools, colleges, and universities. In addition, this report compared American
schools and colleges with those of other advanced nations (The National Commission on
Excellence in Education, 1983).
The general message of the report was that American schools (both K-12 schools and
post-secondary institutions) were failing to raise a new generation of Americans who possessed
the levels of skill, literacy, and training essential to achieve success in the 21st century. As
Fuhrman (2003) asserted, immediately after A Nation at Risk was released, federal and state
officials began to put together reform packages, particularly for use in improving students’
academic achievement and college readiness. Armed with these reforms, under the influence of
A Nation at Risk, both secondary and post-secondary institutions developed several interventions
and support programs to help students attend and achieve in college.
As the report A Nation at Risk pointed out, the American education system needed to
educate a new generation of students who were literate in science and technology. Parallel to the
findings of this report, Carnevale, Jayasundera, and Hanson (2012) suggested that growing
globalization, computerization, and automation created structural changes in the U.S. economy
and education at the end of the 20th
century. As they indicated “the globalization and automation
led to increased demand for skilled workers and more educated workers” (p.10). It is also
claimed that “by 2020, nearly two out of every three U.S. jobs will require some post-secondary

IMPROVING COLLEGE READINESS, PURSUIT, ACCESS, AND PERSISTENCE OF
DISADVANTAGED STUDENTS
19
education and training” (p.2). In other words, in the coming decade, the majority of jobs will
require a college education. Students who have a high school education or less will be less likely
to be employed in well-paying and prestigious jobs that require utilizing extensive technology
and having cognitive and adaptability skills (Hodkinson, 1992; Goldin & Katz, 2008). As shown
in Figure 3, there is a growing trend that jobs requiring college degrees are more likely to
increase.
Figure 3. Relationship between share of jobs and post-secondary education and training.
Adapted from “Five Education and Training Pathways That Pay Along the Way to the B.A.,” By
A. P. Carnevale, T. Jayasundera, and A. R. Hanson, 2012, p. 2. Copyright 2012 by Georgetown
Public Policy Institute, Center on Education and the Workforce, Georgetown University.
Carnevale and Rose (2011) also reported that by 2025, the United States will need 20
million workers with post-secondary education to economically compete with other nations. Out
of these 20 million workers, it is expected that while 15 million people will hold a bachelor’s
degree, 4 million will earn non-degree post-secondary credentials, and 1 million individuals will
have associate’s degrees. In addition to the baccalaureate pathway, individuals should show

IMPROVING COLLEGE READINESS, PURSUIT, ACCESS, AND PERSISTENCE OF
DISADVANTAGED STUDENTS
20
interest in obtaining career and technical education (CTE) that prepares Americans for secure
middle jobs.
Furthermore, Carnevale, Jayasundera, and Hanson (2012) categorized career and
technical education into the five different pathways at the sub-baccalaureate level: (a) employer-
based training, (b) industry-based certifications, (c) apprenticeships, (d) post-secondary
certificates, and (e) associate’s degrees. They reported that there are 29 million middle jobs in
the United States today. They also define middle jobs as “occupations that require some post-
secondary education and training, but not a Bachelor’s degree, and have average earnings of
$35,000 per year or more” (p.3). Therefore, the nation needs individuals who possess bachelor’s,
associate’s, or a career certificate to compete with other nations.
When all things are taken into consideration, getting a college degree, a career, or career
training can be considered a worthwhile investment of one’s time and resources because
education helps individuals develop high cognitive skills and find prestigious jobs. Additionally,
over a working life, people who have higher degrees such as a bachelor’s, master’s, or doctorate
earn more than comparable people who have no college degree (Zumeta, Breneman, Callan, &
Finney, 2012). This means that individuals need post-secondary training, in baccalaureate or
higher, to meet the expectations of the 21st century labor market. Thus, the current policies,
educators, and K-12 schools have a great tendency to guide and prepare students to get into the
post-secondary education after high school.
As mentioned above, over the last century of American history, federal legislations,
educational reforms, comprehensive school improvement plans, and interventions have been
continuously influencing school systems to examine best practices in education and seek whole
school improvement. After the reports A Nation at Risk, (1983), and What Works, published in

IMPROVING COLLEGE READINESS, PURSUIT, ACCESS, AND PERSISTENCE OF
DISADVANTAGED STUDENTS
21
1987, proved that in order to achieve educational equality for all students of America and to
narrow achievement gaps between and among minority groups and their White and Caucasian
Asian-American counterparts, the federal Elementary and Secondary Education Act (ESEA) of
1965 was reauthorized in 2001 as the No Child Left Behind (NCLB) Act (U.S. Department of
Education, 2001).
With the implementation of NCLB (USDE, 2001), federal legislation has put more
pressure on the K-12 school system in order to increase student achievement and improve the
quality of education. In particular, with the implementation of NCLB, there has been a
significant focus on data-based decision making, standard-based high-stakes testing, standards-
based curriculum, and closing the achievement gap. Furthermore, accountability has become a
driving force in designing and leading comprehensive school counseling services and action
plans to create a positive learning environment for student success (Dahir & Stone, 2012).
Over the last ten years, NCLB has had a significant influence on K-12 education. While
all stakeholders and K-12 institutions were trying to meet the accountability requirements of
NCLB, the Obama Administration proposed to improve No Child Left Behind in 2009.
Therefore, the Blueprint for Reform was released by the U.S. Department of Education, Office of
Planning, Evaluation, and Policy Development in 2010, and proposed reauthorization of the
Elementary and Secondary Education Act (ESEA). This Blueprint Reform (2010) emphasized
four major areas: (1) improving classroom teachers’ and building principals’ effectiveness for
student learning; (2) providing information to families to help them evaluate and improve their
children's schools, colleges, and career readiness; (3) implementing college- and career-ready
standards that build toward college and career readiness by the time students graduate from high
school, and high-quality statewide assessments aligned with these standards; and (4) improving
IMPROVING COLLEGE READINESS, PURSUIT, ACCESS, AND PERSISTENCE OF
DISADVANTAGED STUDENTS
22
student learning and achievement in America's lowest-performing schools by providing intensive
ongoing support and effective systemic interventions.
In general, the main focus of the Blueprint for Reform (2010) is to ensure that every
student in America graduates from high school and is ready for college and a career, regardless
of their gender or ethnicity, race, socio-economic, or family background. As Dahir and Stone
(2012) noted, this educational agenda can be considered the Civil Rights movement of the 21st
century. With a strong emphasis on the importance of post-secondary education, the Blueprint
for Reform (2010) focuses on implementing college and career-ready standards and developing
common assessments aligned with those standards. Furthermore, as this bill moves through
Congress, educators are still waiting for the new ESEA from the President Obama and Congress.
Aligned with the Blueprint for Reform (2010), President Obama signed into law the
American Recovery and Reinvestment Act of 2009 (ARRA), which is a crucial legislation that
lays the foundation for educational reform by supporting investments in innovative strategies that
are likely to lead to improved results for students, long-term gains in school and the school
system capacity, and increased productivity and effectiveness (U.S. Department of Education,
2009, p.2). As USDE (2009) reported:
The ARRA provides $4.35 billion for the Race to the Top Fund, a competitive grant
program designed to encourage and reward states that are creating the conditions for
education innovation and reform; achieving significant improvement in student
outcomes, including making substantial gains in student achievement, closing
achievement gaps, improving high school graduation rates, and ensuring student
preparation for success in college and careers (p.2).
As the USDE (2009) noted, the purpose of Race to the Top is to reward states and school
districts that have demonstrated success in raising student achievement. Then, these successful
states and school districts will offer models and best practices for others to follow and will
spread the best reform ideas across their states, and across the country.

IMPROVING COLLEGE READINESS, PURSUIT, ACCESS, AND PERSISTENCE OF
DISADVANTAGED STUDENTS
23
While the Common Core has been focusing on improving students’ skills and knowledge
to successfully prepare them for college, the Common Career Technical Core (CCTC) has been
emphasizing the necessary skills and knowledge that are important to becoming career-ready. In
particular, in June 2012, Career Technical Education (CTE) state officials announced the CCTC,
a set of standards developed by 42 states for each of the 16 career clusters which include: (a)
Agriculture, Food, and Natural Resources; (b) Architecture and Construction; (c) Arts,
Audio/Video Technology, and Communications; (d) Business Management and Administration;
(e) Education and Training; (f) Finance; (g) Government and Public Administration; (h) Health
Science; (i) Hospitality and Tourism; (j) Human Services; (k) Information Technology; (l) Law,
Public Safety, Corrections and Security; (m) Manufacturing; (n) Marketing; (o) Science,
Technology, Engineering, and Mathematics; and (p) Transportation, Distribution, and Logistics.
After the implementation of the college and career readiness standards, school officials have
been trying to implement effective strategies to give families and communities the information
and resources they need to determine whether or not their students are on track toward college
and career readiness, and to evaluate their schools’ effectiveness.
As indicated above, the world and American economy has shifted over the last five
decades from agricultural to service and technology-oriented jobs that require high-level
cognitive skills and expertise. Therefore, getting into post-secondary education and earning a
college degree have become crucial for individuals to meet the demands of 21st century jobs. In
short, in today’s world, a post-secondary education is considered a very valuable investment for
both individuals and governments. While the importance of higher education has been
significantly increasing, the function, tuitions, environment, and enrollment practices of higher
education over the past two decades have been transformed.

IMPROVING COLLEGE READINESS, PURSUIT, ACCESS, AND PERSISTENCE OF
DISADVANTAGED STUDENTS
24
First, in today’s times, rising college costs and the affordability of a college degree is a
serious concern for students who come from low-income families with no allocated funds to
support their children’s education. Second, at a time when higher education is critically
important, the college admission process and requirements have also been changed. For example,
in the past, high school graduation, good academic standing, and passing college entrance exams
were the only requirements to be accepted into college. However, colleges and universities have
recently been taking a more holistic approach during the college admission process by
incorporating both academic and nonacademic factors for student selection. For instance, in
addition to academic factors such as high school GPA and SAT scores, college admission offices
are requiring that students must submit their college essays, recommendation letters, extra-
curricular activities, and leadership and volunteering experience as well.
Another significant change in the college admission process is the college application
type. In the past, students used to print out an application and mail it to the colleges. However,
recently, many four-year and two-year post-secondary institutions prefer to use the online
application system, even though first-generation college-bound students find applying to college
through the Internet stressful and very complicated. In order to complete the online application,
students must create a user ID and password to begin the online process and submit their
applications through the Internet. In addition, around 500 post-secondary institutions in the
United States recently collaborated with the Common Application that allows students to submit
multiple college applications with the same information put into the system. After students
upload their essays and other supplements, they have to send an online request to their teachers
and school counselors for their recommendations and transcripts to be uploaded to the Common
Application. Even though the online system allows the students to submit and track their
IMPROVING COLLEGE READINESS, PURSUIT, ACCESS, AND PERSISTENCE OF
DISADVANTAGED STUDENTS
25
applications through the Internet, many first generation and low-income disadvantaged high
school students are very frustrated with the online application system. Therefore, they prefer to
print out a completed application and mail it to the colleges.
In general, over the past thirty years, while state and national reformers were aiming to
improve the nation's economy, schools were focusing on raising students’ academic
achievement. Under the influence of A Nation at Risk, the roles and responsibilities of
professional school counselors have also been shifted and redefined. First, by the 1970s and
1980s, school counselors focused on designing and implementing comprehensive school
counseling programs to meet the diverse developmental needs of all students and respond to the
crises or peer conflicts that inevitably occur during the routine school day. Comprehensive
school counseling programs use a holistic and collaborative approach to help students’ academic,
personal, and social development. As Brown and Trusty (2005) and Gysbers and Henderson
(2012) reported that the majority of state departments of education have adopted comprehensive
school counseling programs as the model for school counseling programs in their states to
improve all disadvantaged students’ academic, personal, social, emotional, and career
development.
Recently, the ASCA Professional School Counseling Journal presented its findings on the
implementation of comprehensive counseling programs and associated benefits for students in
six different states: Connecticut, Missouri, Nebraska, Rhode Island, Utah, and Wisconsin
(Lapan, 2012). These six state-level studies focusing on measuring the impacts of comprehensive
school counseling programs provide valuable evidence of the relationship between positive
student educational outcomes and school counseling program organization, student-to-school-

IMPROVING COLLEGE READINESS, PURSUIT, ACCESS, AND PERSISTENCE OF
DISADVANTAGED STUDENTS
26
counselor ratios, counselor time use, and specific school counseling activities such as individual
and group counseling (Carey & Dimmitt, 2012).
In general, it is reported that even though very large implementation gaps exist between
schools in delivering a comprehensive program to all students, comprehensive school counseling
interventions have the capacity to improve a wide range of student outcomes that include higher
ACT test scores, higher state scores in math and reading, higher percentage of ACT takers, lower
disciplinary incidents, better school attendance rates, lower suspension rates, and better
graduation rates (Carey & Dimmitt, 2012; Lapan, 2012). According to the findings of these six
major state studies, when highly trained, professional school counselors deliver ASCA National
Model comprehensive school counseling program services, students receive measurable benefits
in academic, personal, social, and career development.
The Education Trust’s Transforming School Counseling Initiative (TSCI), which was
supported by the Dewitt-Wallace-Reader’s Digest Fund, focused on promoting high academic
achievement for all students and enhancing career development opportunities for all students at
all levels (Baker, 2000). Third, the American School Counselor Association’s ASCA National
Model provides a valuable road map and framework for professional school counselors to
initiate, implement, manage, and evaluate comprehensive counseling programs to help students’
academic, personal-social, mental, and career development. The national model (2003, 2005, and
2012) also encouraged school counselors to partner with key stakeholders in the provision of
academic and counseling services. In general, the ASCA National Model is a very helpful tool in
delivering school counseling services in a systematic way to meet the needs of all students.
Finally, Dahir and Stone’s book, The Transformed School Counselor (2012), helps school
counselors and all other key stakeholders understand the new vision of 21st century school

IMPROVING COLLEGE READINESS, PURSUIT, ACCESS, AND PERSISTENCE OF
DISADVANTAGED STUDENTS
27
counseling by providing very useful information, resources, and real experiences regarding the
multiple roles of professional school counselors in 21st century schools. Dahir and Stone (2012)
assert that in order to improve students’ academic, personal/social, and career development,
transformed school counselors should focus their attention on raising student aspirations and
facilitating effective working relationships among stakeholders including students, teachers, and
parents, as well as community members. Furthermore, transformed school counselors should
utilize data to reform their practice and use data-driven decisions to address the complex needs
of today’s students and schools. It is also noted that to prepare all students to become career and
college-ready, 21st century professional school counselors should act as leaders, advocates,
consultants, coordinators, collaborators, managers of resources, and facilitators.
Finally, Table 1 summarizes important reforms and their influences on K-16 education
and school counseling profession. When all things are taken into consideration, as federal
legislation focuses on college and career readiness, all individuals need to understand that
earning a college degree or getting post-secondary career training is crucial in finding prestigious
and higher paying jobs. As mentioned above, getting a college degree has advantages for both
individuals and the nation. However, the process of preparing young people to be college and
career-ready is complicated and multi-faceted (Hokeer & Brand, 2009). Therefore, to help all
students going on to college and pursuing their careers, high expectations should be set, and
ongoing support and guidance must be given collaboratively in secondary schools and post-
secondary institutions.
Having that in mind, 21st century professional school counselors are required to have
expertise in providing career counseling, assessments, test preparation, academic advising,
mentoring, and financial aid information, as well as college admissions and effective transition

IMPROVING COLLEGE READINESS, PURSUIT, ACCESS, AND PERSISTENCE OF
DISADVANTAGED STUDENTS
28
information. Aligned with these statements, schools and comprehensive school counseling
programs should provide a nurturing environment that helps all students acquire the necessary
knowledge, skills, and attitudes for college and career readiness. In particular, by creating a
community-wide effort, professional school counselors are in a critical position to help students
understand the options they have after high school and maximize their post-secondary
opportunities (Dahir & Stone, 2012).

IMPROVING COLLEGE READINESS, PURSUIT, ACCESS, AND PERSISTENCE OF
DISADVANTAGED STUDENTS
29
Table 1.
The Effect of Reform Eras on School Counseling and K-16 Education.
Eras K-12 Schools Post-Secondary School Counseling
Progressive-Era
(1890-1940)
Post-Industrial
Revolution
Great Migration
World War I
Great
Depression
Focus on the
needs of
individual
learners
Encourage active
learning by doing
Value scientific
strategies
White and
African American
Students are
Segregated
College entrance
examinations
Federal Fund with
Morrill Act
Expansion of
vocational guidance
Started to focus on
personal values,
personal attributes,
aspirations, and
interests.
Civil Rights Era
(1950-1974)
Brown vs.
Board of
Education
Civil Rights
Sputnik 1
National
Defense Act
Higher
Education Act
Schools started to
have racially
diverse student
population
Schools started to
focus more on
Science,
Technology,
Engineering and
Mathematics
(STEM)
Government
provided more
financial support
Pell grants,
educational loan
opportunities
Colleges started
to recruit African
American and
minority students
ASCA
Intelligent &
psychological
measurements
Therapeutic
interventions
College admission
information
Post Nation-at-
Risk Era
(1980s-Current)
A Nation At
Risk Report
NCLB
Race to the Top
CCSS
PARCC
Globalization,
computerization,
and automation
College and
career readiness
for all approach
Narrowing
achievement gaps
Accountability
College retention
and attainment
Financial aid
problems
Holistic
application
process
Diverse student
population
Expertise in college
admission, career
planning
Use Technology
leaders, advocates,
consultants,
coordinators,
collaborators
The Social Justice Issues in College Access and College Success
America has been known as “the land of opportunity.” In terms of college enrollment
and retention of disadvantaged urban high school students, however, America has been a land of
inequality (Lareau, 2003). One of the most serious concerns in the United States today is the lack
of college access and persistence for disadvantaged urban high school students. With these

IMPROVING COLLEGE READINESS, PURSUIT, ACCESS, AND PERSISTENCE OF
DISADVANTAGED STUDENTS
30
thoughts in mind, while the federal government is supporting the states push for college and
career readiness standards and assessments, officials of both K-12 and post-secondary
institutions are exploring effective strategies and interventions to improve the college access and
persistence of students at risk. As Baum and Payea (2004) indicate, despite the progress reforms
have made in improving educational opportunities for minority students, participation in higher
education and graduation from post-secondary institutions differ significantly by family income,
parent education level, and demographic characteristics. The researcher considers this gap in
college enrollment and persistence as a social justice issue that needs to be addressed. In this
dissertation research study, three major groups with low college access and success are of
particular interest: (a) students of color, (b) students from low-income families, and (c) first
generation college students.
Over the last thirty years, (1982 to 2012), minority student enrollment grew at a faster
pace than White enrollment. The representation of minority students in post-secondary
institutions increased from 17% in 1982 to 25.4% in 2012 (NCES, 2012; Smith, 1995). The total
number of minority students increased from 2.06 million to 4.8 million. Demographic
projections indicate that the number of minority students in higher education will continue to
increase (Gordon, 1998). Yet, even though there has been an increase in the number of Hispanic
and Black students who are accepted into college, the gap in college attainment with White, non-
Hispanic student remains large. For example, in 2010, 38.6% of White students earned their
bachelor’s degree, African-American and Hispanic students’ bachelor’s degree completion rates
were 19.4% and 23.3% respectively (NCES, 2011).
Similar to racial and ethnic factors, based on the statistics of the NCES (2008), family
income also plays a crucial role in students’ college enrollment and success. According to

IMPROVING COLLEGE READINESS, PURSUIT, ACCESS, AND PERSISTENCE OF
DISADVANTAGED STUDENTS
31
information from the U.S. Department of Education datasets, each year, like students of color,
students from low-income families are less likely to attend and graduate from college. In other
words, income differences among families tend to have a significant impact on the college
enrollment rates and success of students. In particular, Bailey (2001) examined data from college
graduates in the late 1990s and early 2000s. His study showed that 54 percent of students from
wealthy families, or those with a household income in the top quartile, were able to earn their
college degrees. On the other hand, only 9 percent of students from low-income households,
those with a household income in the bottom quartile, were able complete their degrees.
The limited college access and success of first-generation college students is another
national concern that should be considered a social justice issue. It is widely acknowledged by
the previous studies that the parents’ level of education has a significant impact on their
children’s college access and attainment (ACT, 2005). In particular, as reported in NCES (2010)
students whose parents never enrolled in college are less likely to earn a college degree (40%)
compared to students whose parents have a bachelor’s degree or higher (69.3%).
When all things are taken into consideration, it appears that there are significant, and in
some cases widening, gaps among certain groups of students in terms of college access and
persistence. In particular, it is widely recognized that students of color, first generation students,
and students from low-income households do not have equal access and opportunities to enter
and achieve in college. Therefore, they tend to be underrepresented in public and private post-
secondary institutions. This gap is also considered a social justice issue that needs to be
addressed across the nation. Furthermore, it is unrealistic to expect that this gap in college
enrollment and college success will fully resolve itself without additional intervention and
systemic change.
IMPROVING COLLEGE READINESS, PURSUIT, ACCESS, AND PERSISTENCE OF
DISADVANTAGED STUDENTS
32
Multi-Level Theoretical Framework
This study relies on four capitals to understand the major barriers that disadvantaged
students encounter while getting into and through college: (a) social capital, (b) human capital,
(c) cultural capital, and (d) financial capital. The literature on each of these is briefly reviewed
below.
Social Capital
The social capital concept, originally proposed by Bourdieu (1986), has since been
elaborated on and refined by numerous researchers. In particular, research finds that providing
social capital, which includes a broad network of ongoing and caring relationships, facilitates
disadvantaged minority students’ college access and post-secondary persistence (Tinto, 1975;
ACT, 2005; Perna, 2000; Cates & Schaefle, 2011). In addition, building social capital through an
ongoing and caring relationship plays a vital role in enabling students to gain access to
institutional resources and support that can help students succeed in college (Portes, 1998).
Students with more direct access to supportive personnel and role models who are
knowledgeable about the college admission and financial aid application processes are more
likely to have access to, and succeed in, college (Perna & Tutis, 2005).
It is also noted that the findings and implications of previous college readiness and
college retention research studies also support utilization of the social capital theory to help the
stakeholders understand the challenges of disadvantaged students before and after their college
enrollment. For example, according to Tinto’s (1987) theoretical framework, there are various
dynamic factors that affect students’ college access, persistence, and attainment. In particular,
aligned with the social capital theory, Tinto (1975) reported that the interaction between students
and institution plays a significant role in students’ college persistence and withdrawal behavior.

IMPROVING COLLEGE READINESS, PURSUIT, ACCESS, AND PERSISTENCE OF
DISADVANTAGED STUDENTS
33
Overall, it is widely acknowledged that the parents of minority students are less likely to
guide, support, and engage their children in the college admission process because they do not
have sufficient familiarity with the post-secondary education system and how the college
admission and financial aid processes work (Perez & McDonough, 2008). Aside from the lack of
parental support, the many children from minority or low-income families enroll in large urban
high schools with fever resources to support the college admission process. The Schott
Foundation for Public Education (2010) reports that around 80 percent of African American and
Hispanic students attend poorly resourced, low-performing schools, and a lack of social capital
to navigate the college admission and financial application processes contributes to students
failing to enroll in, or dropping out of, college (Bourdieu, 1986; Carbonaro, 1998; Coleman,
1988; Folkman & Lazarus, 1986; Kim & Schneider, 2005)
Even though there is agreement among researchers that building social capital and
creating an ongoing, caring relationship with students plays a significant role in disadvantaged
students’ college access and persistence (Gandara & Bial, 2001; Hossler, Schmit & Vesper,
1999), there is little consensus regarding how to design and lead comprehensive school
counseling programs and interventions that improve disadvantaged students’ college readiness
and success through building social capital. In other words, it seems that insufficient attention
has been paid in both secondary and post-secondary institutions to how social capital can be
generated.
Human Capital
To identify and define students’ college readiness, the researcher thoroughly examined
prior research on issues related to the college readiness of students. Reviewing other studies was
useful to determine how various college readiness measures have been defined and utilized in

IMPROVING COLLEGE READINESS, PURSUIT, ACCESS, AND PERSISTENCE OF
DISADVANTAGED STUDENTS
34
prior research (Rossi, et al., 2004). For example, Kim, Newton, Downey, and Benton (2010)
report that the best predictors of college persistence and success have been measures of high
school achievement (e.g., grade-point average, achievement tests) followed by generalized
measures of achievement or aptitude (e.g., SAT, ACT). These factors, when averaged, generally
fell into a range of a .50 correlation with measures of college academic success. Aligned with
these previous researches, in this study, the human capital is defined as students’ academic
preparedness.
In general, it is well documented that students’ academic preparedness has a significant
influence on college access and post-secondary persistence (ACT, 2005; Berkner & Chavez,
1997; Adelman, 1999). After high school graduation, whether students are headed for four-year
universities, community colleges, or vocational or technical schools, it is necessary that they
possess the academic foundation and knowledge for getting a degree.
While the academic achievement and academic preparation of students have a significant
impact on the students’ college success, research shows that disadvantaged students begin
college less academically prepared than their counterparts whose parents have college degrees
(Bui, 2002; Choy, 2001; Gladieux & Swail, 1999; Thayer, 2000; Adelman, 1999; DeWitt
Wallance-Readers’ Digest Fund, 1997). Therefore, in this study, disadvantaged students’ lack of
academic preparedness is explained by having a limited human capital. Similarly, Perna and
Titus (2005) identify disadvantaged students’ lack of human capital as: (1) Receiving low scores
from PSAT/SAT/ACT college entrance exams and state exams, (2) Not taking rigorous college
prep courses or curricula during high school years, and (3) Taking remedial courses in the first
year of college.

IMPROVING COLLEGE READINESS, PURSUIT, ACCESS, AND PERSISTENCE OF
DISADVANTAGED STUDENTS
35
The PSAT serves several functions, including identifying students who might succeed in
Advance Placement (AP) courses and helping students prepare for general and subject SAT tests,
which are cited as one of the most important components for college admission (College Board,
2012; Perna & Titus, 2005). As Vaughn (2010) and Cates and Schaefle (2011) noticed, student
participation in the PSAT reflects some knowledge about their academic readiness and
engagement in the college admission process. In other words, participation in the PSAT indicates
that students are thinking about college in their sophomore and junior years, and are displaying a
predisposition for college attendance (p. 323).
Even though there is a strong emphasis on the importance of the PSAT, previous research
shows that even college-qualified minority students do not tend to take college entrance exams
such as the SAT and PSAT (Berkner & Chaves, 1997). For example, in 2011, only 12.4 percent
of African American students and 13.8 percent of Hispanic students took the PSAT in their
junior year. On the other hand, 58.3 percent of White students took the PSAT in their junior year
in 2011. Like PSAT scores, SAT scores are also used to measure the academic readiness of
students (College Board, 2012). On the 2010 SAT, among racial/ethnic groups in America, both
Blacks and Hispanics scored about 250 points below Whites.
In addition to college entrance exams, a second major indicator of academic readiness is
enrolling in high-level advanced courses during the high school years (Adelman, 1999; Berkner
& Chavez, 1997). Students of color and students from low-income parents are more likely to be
scheduled into low-level academic courses and vocational tracks than their more affluent white
counterparts (NCES, 2008; Gamoran et al., 2011). The College Board (2011) reported that
underserved students are not academically ready for college because many urban high schools
serving disadvantaged minority students are less likely to offer rigorous college prep courses, test

IMPROVING COLLEGE READINESS, PURSUIT, ACCESS, AND PERSISTENCE OF
DISADVANTAGED STUDENTS
36
preparation courses, or curricula. Disadvantaged students who lack academic preparedness are
more likely to drop out of college. Thus, failing to enroll in high-level advanced courses during
the high school years can be considered another reason for disadvantaged students’ low college
readiness, persistence, and attainment.
Enrolling in remedial math, reading, and writing courses is also a very strong predictor of
college attrition, and it is the most frequently used measure of college academic readiness and
college success (ACT, 2005, 2010). Based on the NCES’s (2010) statistics in remedial college
course enrollment, approximately 20 percent of first-year students in public 4-year institutions
and 42 percent of first-year students in public 2-year institutions in the United States are enrolled
in remedial courses. The majority of students who take remedial courses in the first year of
college are minority or first generation students who come from low-income families (NCES,
2010). In particular, while only 18 percent of first-year undergraduate White students took
remedial education courses in 2008, 24.7 percent of African American and 23.3 percent of
Hispanic students took remedial education courses.
Financial Capital
In addition to a lack of social or human capital, previous research has reported that
financial capital is another crucial factor that directly or indirectly affects disadvantaged urban
high school students’ college readiness, access, retention, and attainment (ACT, 2004, 2005,
2010; Cabrera, Burkum & La Nasa, 2005; Ishitani & DesJardins, 2002; Grodsky & Jones, 2004;
Holcomb-McCoy, 2010; Paulsen & St. John, 2002). In particular, American College Testing
(ACT) conducted a national study of factors affecting minority students’ college attrition (2010).
Hispanic and African American respondents were asked to rate the degree to which student and
institutional factors affected attrition. Based on this report, the attrition factors with the highest
IMPROVING COLLEGE READINESS, PURSUIT, ACCESS, AND PERSISTENCE OF
DISADVANTAGED STUDENTS
37
impact on Hispanic and African American student retention include adequacy of personal
financial resources, amount of financial aid available to students, and students’ low socio-
economic status, which are highly associated with financial capital.
Based on the previous research cited above, lack of financial capital can be more
specifically defined as: (a) Inability to pay the enrollment and preparation fees of the college
entrance exams, (b) Not having enough funds to participate in college dual enrollment and
summer programs, (c) Having difficulties paying for college tuition and other college-related
expenses. In short, it can be said that the majority of low-income students who lack financial
capital are less likely to be prepared for college.
Consider the following examples: students whose parents have the funds to pay for test
prep programs are more likely to participate in SAT and ACT preparation programs and improve
their test scores (Holcomb-McCoy, 2010). Students whose parents have more financial resources
are more likely to attend colleges’ summer enrichment programs and camps to experience the
college campus life and earn college credits while in high school. College summer institutes and
dual enrollments are great opportunities for high school students to become college ready by
gaining a real college experience early. For instance, one of the most well-known summer
programs is Harvard’s Secondary School Program, which helps high school students explore
subjects not available at their high schools. However, as reported at Harvard Summer School’s
website (2013), if students choose to live on campus during the Harvard’s six-week Secondary
School Program, they have to pay $10,690 dollars, which includes tuition for courses, room, and
board fees. It might be very impossible for disadvantaged students who come from low income
families to find over 10,000 dollars for six week long summer program.

IMPROVING COLLEGE READINESS, PURSUIT, ACCESS, AND PERSISTENCE OF
DISADVANTAGED STUDENTS
38
Cultural Capital
Cultural capital can be understood as building shared norms, high expectations, beliefs,
and values regarding the necessity and importance of post-secondary education which includes
four year universities as well as community colleges, vocational schools and military schools,
Cultural capital, which includes the encouragement, vision, motivations, beliefs, and values of
parents, teachers, counselors, and all other community stakeholders, is considered very valuable
for getting into and graduating from college (Bourdieu, 1986; Perna & Tutis, 2005; Dumais,
2002). Salazar (1997) noticed that cultural capital, which includes high expectations and college
goals, is more likely to be accrued for higher-income White students than lower-income minority
students. Similarly, McDonough (1997) found that middle and upper-class parents possess the
most valued forms of cultural capital, which encourages parents to invest in higher education.
Low educational expectations and low academic standards at home and school leave
disadvantaged minority students less likely to prepare for college and future careers, and less
likely to get accepted into a college and complete their college education. A lack of cultural
capital is conceptualized as low expectations and a lack of encouragement from: (a) parents, (b)
institutions, and (c) community members.
In summary, it is well documented that disadvantaged students do not get proper social,
human, financial, and cultural capitals from their families, friends, communities, and institutions.
Therefore, the current capital inequality causes disadvantaged students to fall behind in college
access, persistence, and attainment. Furthermore, previous studies indicate that disadvantaged
students who have limited capitals need more help and ongoing support from their parents and
institutions in preparing for college and/or careers.
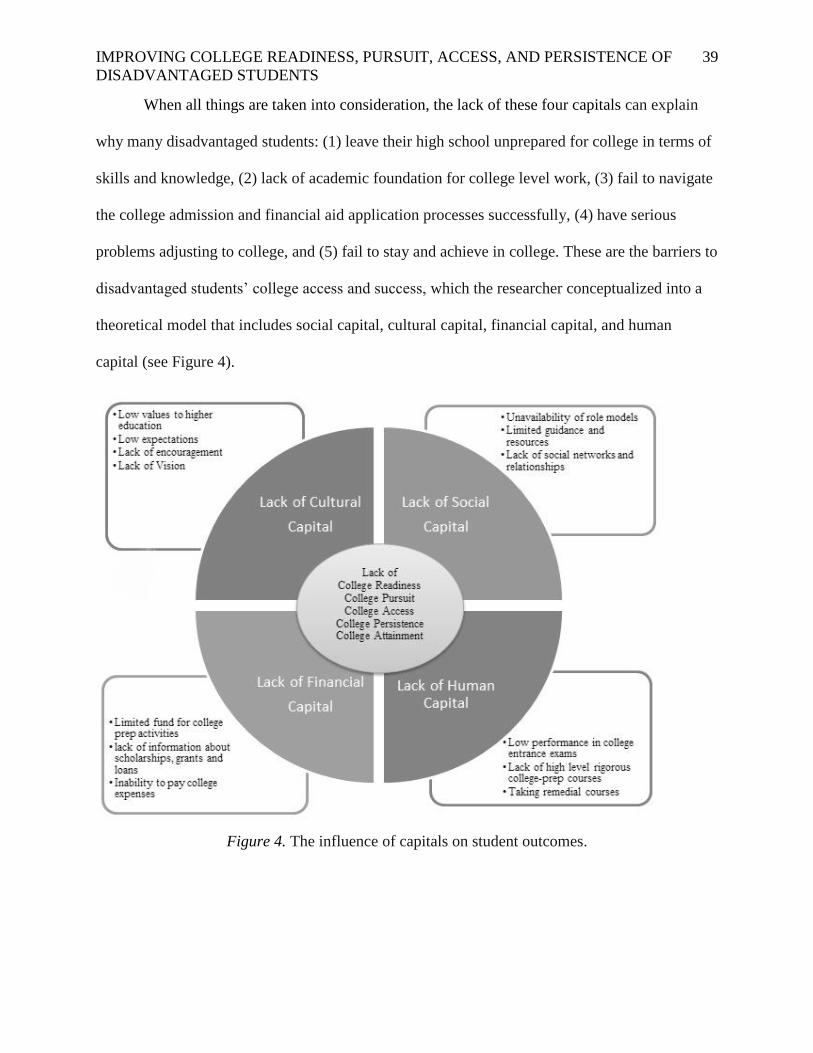
IMPROVING COLLEGE READINESS, PURSUIT, ACCESS, AND PERSISTENCE OF
DISADVANTAGED STUDENTS
39
When all things are taken into consideration, the lack of these four capitals can explain
why many disadvantaged students: (1) leave their high school unprepared for college in terms of
skills and knowledge, (2) lack of academic foundation for college level work, (3) fail to navigate
the college admission and financial aid application processes successfully, (4) have serious
problems adjusting to college, and (5) fail to stay and achieve in college. These are the barriers to
disadvantaged students’ college access and success, which the researcher conceptualized into a
theoretical model that includes social capital, cultural capital, financial capital, and human
capital (see Figure 4).
Figure 4. The influence of capitals on student outcomes.
IMPROVING COLLEGE READINESS, PURSUIT, ACCESS, AND PERSISTENCE OF
DISADVANTAGED STUDENTS
40
What Works in Improving Disadvantaged Students’ College Access, Persistence, and
Attainment?
Over the past three decades, there has been growing attention paid to implementing
alternative college preparation and retention interventions to increase the college access and
success of disadvantaged students. Practitioners, researchers, and policymakers have made
efforts to develop various interventions, treatments, and preventions to improve students’ skills,
knowledge, confidence, and aspirations so they can enroll, stay, and succeed in college (Fenske,
Geranios, Keller, & Moore, 1997; Perna & Titus, 2005). In this part of the dissertation, the
researcher investigates recent strategies, trends, and best practices that help disadvantaged
students achieve their college and career goals. Furthermore, it also articulates important
variables relevant to what works in disadvantaged students’ college readiness, access, and
success. As Lotkowski, Robbins, and Noeth (2004) note, helping students get ready, get into, and
get through college is a long-term investment that requires systemic approaches and
collaborative efforts. With this statement in mind, the next part of the literature review was
designed to answer the following question: “What are the K-12 practices, services, and
interventions that help disadvantaged minority students improve their college readiness, pursuit,
enrollment, and persistence?”
A significant amount of previous research has emphasized the role of high schools and
pre-college experiences in improving students’ college readiness and success. Particularly, they
have revealed that if disadvantaged students receive proper support and guidance during their
high school years, then they are more likely to get into and through college (Adelman, 2006;
College Board, 2010; Lotkowski, Robbins & Noeth, 2004). The review of research regarding the
roles and responsibilities of high schools in promoting disadvantaged students’ college access,

IMPROVING COLLEGE READINESS, PURSUIT, ACCESS, AND PERSISTENCE OF
DISADVANTAGED STUDENTS
41
persistence, and attainment is organized around the eight components of college and career
readiness counseling developed by the College Board National Office for School Counselor
Advocacy in 2010. The eight components are (1) building and promoting students’ college
aspirations; (2) improving students’ academic preparation for college; (3) enhancing students’
personal and social development; (4) providing ongoing support in the college and career
exploration and selection processes, (5) conducting college readiness and career assessments; (6)
preparing an individualized college affordability plan; (7) easing the college admission
processes; (8) helping transition from high school to college.
Building and Promoting Students’ College Aspirations
First-generation college-bound minority students from low-income families tend to have
low college aspirations that prevent them from accessing post-secondary institutions (Howard,
2003; Pitre, 2006; Toldson, 2009). Studies find that that promoting college aspirations, setting
and maintaining high expectations, encouraging students to attend college, and giving equal
access to college preparatory and advanced placement courses are all very important components
of improving college access for disadvantaged students (Howard, 2003; Toldson, Braithwaite &
Rentie, 2009).
Improving Students’ Academic Preparation for College
Developing and delivering high quality instruction and a rigorous high school curriculum
contribute to students’ college retention and success (Adelman, 1999; Choy, 2001; ACT, 2004).
Gandara and Bial (2001) examined evaluative data on the effectiveness of K-12 intervention
programs that are specifically designed to increase disadvantaged students’ access to post-
secondary education. They found that the K-12 interventions appeared to be most effective in
IMPROVING COLLEGE READINESS, PURSUIT, ACCESS, AND PERSISTENCE OF
DISADVANTAGED STUDENTS
42
improving students’ college access when they provided high-quality instruction and academic
advisement (Horn & Nunez, 2000).
Similarly, Hooker and Brand (2010) also studied program evaluations by reviewing and
comparing the impacts of interventions that are designed to improve students’ college readiness.
In their program evaluation study, the areas of rigor and academic support appeared to be the
most important shared aspects of the programs in promoting college readiness and success. A
limitation of this study is that they did not provide specific and descriptive data regarding the
program implementation. However, this information and strategies may not have been provided
by the studies reviewed.
Enhancing Students’ Personal and Social Development
Cabrera and Burkum (2005) provide an overview of college admission criteria employed
in the United States. Based on their study, American colleges and universities employ multiple
admission criteria when screening college applicants including academic performance in college
preparatory courses, high school success and rankings, college entrance exams, written essays,
interviews, recommendations from high school counselors and teachers, involvement in
community service, leadership skills, and participation in work/extracurricular activities.
Parallel to Cabrera and Burkum’s (2001) study, in 2001, the National Association for
College Admission Counseling (NACAC) surveyed 1,600 institutions to identify college
acceptance trends. They found that while accepting students, American colleges and universities
put a heavy emphasis on the academic readiness of students, such as grades in college
preparatory courses (77.8%), high school rankings and college entrance exams (57.7%), and
grades in all subjects (42.6%). However, it seems that there are also non-academic factors such
as the ability to pay (0.9%), samples of written essays (19.6%), interviews (10.6%),

IMPROVING COLLEGE READINESS, PURSUIT, ACCESS, AND PERSISTENCE OF
DISADVANTAGED STUDENTS
43
recommendations from high school counselors (15.1%) and teachers (14.2%), involvement in
community service (8.1%), and participation in work/extracurricular activities (7%) that all
affect post-secondary admission decisions.
As Cabrera and Burkum (2001) found, the college admission criteria of American
colleges and universities has been changing. In the past, post-secondary institutions focused
solely on test scores and high school GPA. However, in the 21st century, non-academic factors
such as the ability to pay, samples of written essays, interviews, recommendations from high
school counselors and teachers, involvement in community services and participation in
work/extracurricular activities are all taken into consideration when colleges are accepting their
students. With that end, College Board (2012) recommends schools to collaborate with key
stakeholders to incorporate support for enrichment and extracurricular engagement into
academics.
Providing Ongoing Support in College and Career Exploration and Selection Processes
As discussed above, the majority of disadvantaged students have lack of the social and
cultural capitals needed to successfully navigate post-secondary pathways. Therefore, high
school counselors’ college and career counseling sessions play a significant role in
disadvantaged students’ college access and success. Mahoney and Merritt (1993) found that a
large portion of disadvantaged students considered both high school counselors and teachers to
be important in helping them make college plans. Similarly, White and Sadlacek (1986) found
that the availability of a strong support system improved college access and retention.
Parallel to these statements, the College Board (2010) recommends that secondary
institutions provide early and ongoing exposure to the experiences and information necessary to
make informed decisions when selecting a college or career that connects the students to

IMPROVING COLLEGE READINESS, PURSUIT, ACCESS, AND PERSISTENCE OF
DISADVANTAGED STUDENTS
44
academic preparation. To provide this type of individualized support to improve college access
and success among underrepresented populations, ASCA (2012) recommends a 250-to-1
student-to-school-counselor ratio. However, as reported on the ASCA’s official website (2012),
the national average was 471-to-1 in the 2010–2011 school year. Without a 250-to-1 student-to-
school-counselor ratio, providing ongoing individualized support for low-income first-generation
students, and preparing them for college and career readiness, does not seem feasible.
Conducting College Readiness and Career Assessments
In recent decades, the advancement of technology and increasing demand for highly
skilled workers has placed a strong and renewed emphasis on the delivery of comprehensive
career development and guidance programs in schools across the United States (Dahir & Stone,
2012, p.419). However, preparing students to select their best career pathways and guiding them
to enroll in an appropriate post-secondary education is not an easy or simple task for educators.
In the USA, there are approximately 4,000 post-secondary institutions, which include four-year
colleges, two-year colleges, career training, and vocational and technical schools. With
thousands of college choices, as well as hundreds of major and minor choices, high school
students face a difficult task in picking a path that is right for them.
Feller (2003) and the U.S. Council on Competitiveness (2007) conclude that the college
and career readiness of students is a very complex situation that requires a collaborative,
systemic approach, as well as a greater investment in comprehensive school counseling and
career guidance programs. This suggests an important role for career assessments and other
career exploration tools to support the students’ college and career aspirations comprehensively
(Dahir & Stone, 2012; The College Board, 2010).

IMPROVING COLLEGE READINESS, PURSUIT, ACCESS, AND PERSISTENCE OF
DISADVANTAGED STUDENTS
45
Preparing Individualized College Affordability Plans
Each year, a significant number of students are either unable to enroll in college or stop
their college education because of financial issues (Burkum & La Nasa, 2005; ACT, 2005). The
College Board (2010) recommends that both secondary and post-secondary institutions provide
students and families with comprehensive information regarding college costs, options for
paying for college, the financial aid and scholarship processes, and eligibility requirements so
they are able to plan in advance and afford a college education. Bettinger, Long, Oreopoulos and
Sanbonmatsu (2009) also report that students who received systemic assistance with the FAFSA
and information about aid are substantially more likely to submit the required financial aid
applications, enroll in post-secondary institution the following fall, and receive more financial
aid. Therefore, they suggest that simplification of the FAFSA application and providing
information for college affordability could be effective ways to improve students’ college access.
Easing the College Admission Processes
Due to a lack of contextual information and lack of guidance about college admission
processes, many disadvantaged students graduate ready to attend four-year colleges, but never
enroll in colleges (Dynarski & Scott, 2007; Hooker & Brand, 2010). Particularly, Griffin, Allen,
Kimura-Walsh, and Yamamura (2007) found that many disadvantaged students do not receive
sufficient guidance and support to select post-secondary paths that match their academic
potential.
Conley (2007) examined the programs and practices of high schools that have evidence
of success in preparing underrepresented students for higher education. Nearly 200 schools were
identified as candidates for inclusion through a literature review and nomination process. The
researchers collected extensive information on each school, and carefully considered the school

IMPROVING COLLEGE READINESS, PURSUIT, ACCESS, AND PERSISTENCE OF
DISADVANTAGED STUDENTS
46
type, location, performance indicators, and, in particular, college readiness activities and
practices to identify exemplary programs. They identified 38 high schools throughout the United
States that had consistently graduated college-ready students from underrepresented groups.
After the 38 schools were selected, the following data collection methods were employed:
interviews, focus groups, online questionnaires, document analysis, and site visitations. Conley
(2007) indicated that participating schools fostered college readiness among students by easing
the college admission processes through building partnerships with post-secondary institutions.
Based on this study, Conley (2007) recommends that secondary institutions provide systemic
guidance in college and career exploration, and the selection processes.
Helping Transition from High School to College
Many programs offering early college experiences were developed in recent years to
accelerate students’ college and career readiness (Swail & Perna, 2002; Rossi, Lipsey &
Freeman, 2004). In particular, the Early College High School Initiative (ECHSI), which was
launched in 2002 with the support of the Bill & Melinda Gates Foundation, helps disadvantaged
students earn both a high school diploma and an associate’s degree, or up to two years of credit
toward a bachelor’s degree. ECHSI’s priority is to serve low-income, first-generation college
students, and English language learners, all of whom are statistically underrepresented in higher
education. In general, the Early College High School Initiative emphasizes underserved urban
high school students’ academic preparation, support, and success in higher education by
providing a comprehensive support system (The Early College High School Initiative, 2009).
It is reported that Early College High Schools have three key features that promote
success for even the most struggling students: (1) small classes; (2) individualized support based
on identified needs; and (3) provisions of a nurturing learning environment. In terms of an

IMPROVING COLLEGE READINESS, PURSUIT, ACCESS, AND PERSISTENCE OF
DISADVANTAGED STUDENTS
47
evaluation approach, ECHSI (2009) utilized both qualitative and quantitative data resources to
measure the impact of the initiative on students’ college readiness. These mixed methods were
used to assess intermediate and long-term outcomes for students attending college courses while
still in high school. In 2007, over 900 students graduated from 17 ECHSs around the country.
Preliminary data showed that: (1) over 65 percent of the graduates were accepted into four-year
colleges or chose to complete an associate’s degree; (2) more than 85 percent graduated with
substantial college credit; and (3) more than 250 early college high school graduates earned
merit-based college scholarships. According to the evaluation report, students in the ECHSs are
doing well academically at both the high school and college levels.
Overall, the study indicates that ECHSs are helping students become college and career
ready. For example, according to American Institutes for Research (2009), Early College
students were significantly more like to graduate from high school than comparison students.
Specifically, eighty-six percent of Early College students graduated from high school, while 81
percent of comparison students graduated from high school. Moreover, they found that Early
College students were significantly more likely to enroll in college than comparison students. It
is also reported that during the study period, 80 percent of Early College students enrolled in
post-secondary institutions, compared with 71 percent for comparison students. Early College
students were also more likely than comparison students to enroll in both two-year and in four-
year colleges or universities (American Institutes for Research, 2009).
In terms of evaluation approach, theory, data collection, and analysis, the evaluation
report of ECHSs were well structured. The mixed method fit the design and purpose of the
evaluation. However, in the evaluation report, there are some parts that could have been
completed differently to improve the quality of the ECHSI evaluation. For instance, the

IMPROVING COLLEGE READINESS, PURSUIT, ACCESS, AND PERSISTENCE OF
DISADVANTAGED STUDENTS
48
evaluation mostly emphasized positive relationships between ECHSs and colleges; it did not
discuss potential tensions and logistical challenges that are present while establishing these
partnerships. In particular, the method colleges and high schools use to collaborate on recruiting
students who might be academically unprepared was not mentioned. Therefore, the evaluation
could have been improved by focusing on some challenges and tensions of building high school
and college partnerships. Furthermore, providing concrete guidelines and case studies for the
college readiness of underprepared students would help improve the effectiveness of the
evaluation. In addition, not enough information was provided regarding the effective
collaborative efforts of high school teachers and college professors. Instead of only describing
the roles of high school teachers, the evaluation could have been improved by offering practical
strategies that indicate how different stakeholders could plan vertical academic curriculums.
Like ECHSs, Upward Bound is another program that focuses on early college
experiences (Swail & Perna, 2002). Upward Bound is supported by the U.S. Department of
Education with the objective of increasing college-going rates in underrepresented students
(NCES, 2001). Upward Bound targets students whose families have low incomes, or who would
be the first in their families to go to college. Overall, Upward Bound provides academic
instruction in mathematics, laboratory sciences, composition, literature, and foreign languages. A
key aspect of the program is the 6-week summer session hosted by a college campus, where
students receive intensive pre-college academic preparation. Extra academic support is provided
in the form of tutoring and academic courses, usually held on Saturdays or after school. Finally,
in order to make students college-ready, financial aid counseling and college counseling services
are also provided for Upward Bound students (Myers & Schirm, 2009).

IMPROVING COLLEGE READINESS, PURSUIT, ACCESS, AND PERSISTENCE OF
DISADVANTAGED STUDENTS
49
The evaluation report of Upward Bound utilized quantitative data to compare Upward
Bound students to similar students in the same schools. Evaluation of the program has focused
on high school retention and the program’s effectiveness in increasing college-going rates. The
findings of past researchers vary. Swail & Perna (2002) found that students who stay in the
program to completion were more likely to go on to college. Results from the third follow-up
data collection suggest that for the average student, Upward Bound (1) increased the number of
high school math credits earned by participants; (2) did not affect other measures of high school
academic preparation; (3) may have increased enrollment at four-year institutions; and (4) did
not affect enrollment at post-secondary institutions more generally when all types of post-
secondary institutions were considered.
In conclusion, when all things are taken into consideration, in order to explain what
works in improving college readiness of disadvantaged students, the researcher utilized the
adaptive version of the Eight Components of College and Career Readiness Counseling are: (1)
build and promote students’ college aspirations; (2) improve students’ academic preparation for
college; (3) encourage students’ engagement to enrichment and extracurricular activities; (4)
provide ongoing support in college and career exploration and selection processes; (5) conduct
college readiness and career assessments; (6) prepare individualized college affordability
planning; (7) ease the college admission processes; (8) help transition from high school to
college by providing early college experiences. These eight components of college and career
readiness counseling which were developed by the College Board (2012) have the capacity to
provide stakeholders with a very helpful and comprehensive framework to build college and
career readiness for all students.

IMPROVING COLLEGE READINESS, PURSUIT, ACCESS, AND PERSISTENCE OF
DISADVANTAGED STUDENTS
50
Limitations of Existing Research
While reviewing the literature for college readiness and college success, the researcher
noted that there are still limitations to the existing research. These include: (a) a lack of research
on the partnership between post-secondary institutions and secondary schools; (b) limited use of
theory to interpret findings and propose recommendations; (c) not estimating budget; (d) validity
issues; (e) lack of a needs assessment; (f) limited focus on the implementation process; and (g)
high attrition rate.
The major argument about the existing college retention studies is that they disregarded
the roles of high schools in improving the students’ college retention. While the literature is
focusing on students’ high school experiences to improve their attainment rates, it was surprising
that the retention studies did not include any strategies that encourage establishing
institutionalized partnerships between post-secondary institutions and secondary schools. In
other words, according to the ACT and College Board retention studies, the role of post-
secondary institutions through policies and practices affecting persistence and graduation is
critical; however, we know little about how both secondary and post-secondary institutions can
work collaboratively and establish institutionalized partnerships to improve disadvantaged
students’ college readiness and attainment. To fill this need, this dissertation study will discuss
effective collaborative retention strategies among post-secondary institutions and secondary
schools.
The second drawback of the previous retention studies is that many of them provided
neither the conceptual framework of their modes, nor a comprehensive theoretical background of
their findings and recommendations. Providing the conceptual framework of their modes or
theoretical background could have been helpful to improve the quality of their findings and

IMPROVING COLLEGE READINESS, PURSUIT, ACCESS, AND PERSISTENCE OF
DISADVANTAGED STUDENTS
51
recommendations. With that end in mind, this dissertation study seeks to fill this gap by
combining and analyzing various capitals to better explain the needs of disadvantaged students
and help them succeed in college. Moreover, this comprehensive theoretical framework is
expected to contribute to the post-secondary institutions’ efforts to increase urban high school
students’ college enrollment, persistence, and graduation.
The third limitation of the previous retention studies is that none of them clearly utilized
the programs’ economic analysis. The estimation of and comparison between costs and benefits
of educational programs is one of the most important considerations in deciding whether to
expand, continue, or terminate (Lipsey & Freeman, 2004). Previous retention studies mentioned
that post-secondary institutions spent a significant amount of time, effort, and money in
increasing the college persistence and attainment of disadvantaged students, but they did not
provide a frame of reference for relating costs to program results. If costs are too high and
irrational, the reward for making the change might be seen as inadequate (Fullan, 2007). It is
noted that in general, the previous retention studies neglected to report on financial issues. Cost
benefits and effectiveness analyses could have been conducted to provide information to help
administrators make decisions about the cost and allocation of resources. It might also be helpful
to educate readers about the cost of implementation and its expected long-term and short-term
outcomes (Lotkowski, Robbins, & Noeth, 2004).
Validity issues can be considered the fourth limitation of the previous research, which
focused on measuring the impacts of comprehensive school counseling programs. In other
words, when the researchers correlated the relationships between program components and
student outcomes, they did not include or mention the potential effects of the students’
demographics and their initial academic achievement, which might directly or indirectly affect

IMPROVING COLLEGE READINESS, PURSUIT, ACCESS, AND PERSISTENCE OF
DISADVANTAGED STUDENTS
52
the positive results. Therefore, this study is different from other studies. While using regression
analysis, the researcher used and included basic student demographics (gender, race, ethnicity,
lunch type, parent’s education, special education, and ESL) as well as their initial GPAs.
The lack of a needs assessment is another limitation of previous studies. Needs
assessments are a fundamental component of program evaluations, as a program cannot
effectively ameliorate a social problem if there is no problem to begin with (Rossi, Lipsey &
Freeman, 2004). Even though there is mounting evidence to support the importance of needs
assessments in program evaluations, a majority of the previous studies did not utilize or mention
any version of a needs assessment process. It seems that many institutions are investing a
significant amount of time, energy, and money on the programs’ interventions without measuring
the actual needs of the students. Therefore, evaluations of previous programs could have been
improved by receiving input from key informants through needs assessments.
Another noticeable weakness of the previous studies is that the program evaluators did
not give detailed examples and specific explanations about the roles and responsibilities of key
stakeholders. In other words, researchers mostly emphasized the impacts of the programs but
they did not explain the implementation process and the assignments of key stakeholders in
detail. The unclear roles of stakeholders and lack of information about the implementation phase
makes it difficult to generalize the potential effectiveness of these programs to anyone other than
the teachers and counselors who were studied. Instead of describing only the program
components, the generalizability of the programs could have been improved by offering practical
strategies indicating how stakeholders would work collaboratively to implement the
interventions.

IMPROVING COLLEGE READINESS, PURSUIT, ACCESS, AND PERSISTENCE OF
DISADVANTAGED STUDENTS
53
Finally, attrition is considered a major problem of research on college readiness
intervention programs that are designed to improve the college readiness of minority or
underserved students. Few researchers either report or know how many students who begin their
program actually complete it (NCES, 2001). For example, in the Upward Bound program,
approximately one third of the students who began the program quit by the end of their first year,
and only about one third of students actually completed the program. Similarly, ECHSI (2009)
did not provide a comprehensive report on how many students who began their program actually
completed the Early College High School. In this case, even though the evaluator of the program
designed a high-quality comprehensive evaluation plan, it is not possible to measure the full
impact of the program because of the high program attrition rate. Because of this gap in data, the
opportunity to develop strategies to control and manage the program attrition rate, which could
have been utilized to increase the quality and effectiveness of the programs, were lost.

IMPROVING COLLEGE READINESS, PURSUIT, ACCESS, AND PERSISTENCE OF
DISADVANTAGED STUDENTS
54
CHAPTER THREE: COMPREHENSIVE COLLEGE READINESS ACCESS AND
SUCCESS PROGRAM (CRASP)
As the chair of the PCSST school counseling department, the researcher has developed
and led CRASP to provide all PCSST students with ongoing academic support, assistance with
financial aid issues, and individualized college and career counseling to help them improve their:
(a) college readiness, (b) college pursuit, (c) college access, and (d) college persistence. In
particular, CRASP was framed using the core qualities and components of the ASCA National
Model® (2005 and 2012) that support a research-based and holistic approach. Thus, this chapter
describes how CRASP incorporates the four components of the ASCA National Model
(American School Counselor Association, 2012): Program Foundation, Delivery System,
Management System, and Accountability.
CRASP Foundation
Aligned with the ASCA National Model® (2012), the elements of CRASP’s foundation
include beliefs, vision statement, mission statement, and program goals.
CRASP belief statement. As guided by the ASCA National Model (2012), the ultimate
belief behind CRASP is that all students deserve the opportunity to attend post-secondary
institutions to help them succeed in life. CRASP’s guiding principle is that all students have self-
worth and an innate potential to achieve in school and throughout their lives. It is the school’s
responsibility to treat all students with dignity and encourage them to discover their own
personal and academic strengths.
Previous studies have showed that when schools design and deliver comprehensive
school counseling programs that are aligned with the ASCA National Model, disadvantaged
students receive measurable benefits in their college and career readiness (Carey & Dimmitt,
2012; Brown & Trusty, 2005; Gysbers & Henderson, 2012). Thus, PCSST counselors believe

IMPROVING COLLEGE READINESS, PURSUIT, ACCESS, AND PERSISTENCE OF
DISADVANTAGED STUDENTS
55
that implementing comprehensive counseling programs plays a vital role in improving the
academic, personal/social, emotional, and career development of students. In accordance with
these beliefs, it is CRASP’s primary focus to ensure that all students receive personalized college
and career guidance and as well as the academic advice to help make decisions, set goals, and
take the necessary actions to achieve their college and career goals.
CRASP vision and mission statements. Building a shared vision and holding every key
stakeholder accountable for creating a college-going culture is also another important component
of the program implementation (ASCA, 2012; Ladson-Billings, 1999). Therefore, the vision
statement of CRASP focuses on helping and guiding the development of effective school
counseling programs and interventions. In particular, both the vision and mission statements
follow PCSST’s school-wide mission statement, as well as the ASCA National Standards and
student competencies.
To that end, CRASP’s vision is to prepare self-directed college and career-ready students
who have high expectations for their education, career, and life. Aligned with this vision,
CRASP’s ultimate goal is to see all of PCSST’s students graduate from high school, enroll in
college, and persist and graduate from college. This vision is communicated with all PCSST
stakeholders through professional development and training activities. During the school-wide
meetings and trainings, the message “all students have the potential to get into, achieve, and
graduate from college if the proper guidance, support, and access to resources are provided,” is
constantly given. It was also strongly emphasized that partnership among counselors, teachers,
parents, administrators, and community members is crucial in supporting students’ college
access, persistence, and attainment.

IMPROVING COLLEGE READINESS, PURSUIT, ACCESS, AND PERSISTENCE OF
DISADVANTAGED STUDENTS
56
The mission statement of CRASP is to help all students reach their full potential by
developing the essential academic, personal/social, and career skills needed to get ready for
college and a career, and become productive citizens of America. Aligned with the program
mission and vision, CRASP aims to improve students’ academic preparedness for college and
provide systemic career information so they can make informed career decisions. In order to
reach out to all students and make all of PCSST’s counseling programs and supportive services
available and accessible, PCSST’s counselors play a very proactive role in the school building by
being visible and accessible at all times.
CRASP goals. Program goals define how the vision and mission will be accomplished
and guide the design of the curriculum and action plans (ASCA, 2012). While developing
program goals, Rossi (2004), The College Board (2010), and the ACT (2008) recommend that
stakeholders utilize comprehensive need assessments that provide the guidance and support
necessary to design and lead systemic academic and counseling services. Therefore, in the
beginning of the school year, PCSST school counselors consult with various key stakeholders to
identify the program goals as well as the needs of students and stakeholders. The feedbacks of
students, teachers, administrators and parents provide a road map for the counselors to develop
and plan necessary interventions and counseling services by identifying current program
strengths and areas where improvement is needed. Overall, CRASP’s goals were developed
using the collaborative efforts of the key stakeholders, which include the school administration,
teachers, and parents, as well as the students themselves. Program goals that are aligned with
students’ needs provide the systemic guidance and support necessary for all PCSST students to
graduate from high school prepared to get into and through college.

IMPROVING COLLEGE READINESS, PURSUIT, ACCESS, AND PERSISTENCE OF
DISADVANTAGED STUDENTS
57
To that end, based on the students’ needs, the PCSST team of professional counselors set
specific goals in five domains, which include (1) college readiness goals (improving GPA, ACT,
SAT, and PSAT scores), (2) college pursuit goals (improving FAFSA applications, scholarship
amount, and the number of college application), (3) college enrollment goals (improving the
percentage of 4-year college enrollment), (4) college persistence goals (improving 1st year
persistence, 2nd
year persistence, 3rd
year persistence, and 4th
year persistence), and (5) college
attainment goals (improving the on-time degree attainment rate).
In order to reach these pre-assigned goals, PCSST school counselors, along with
administrators and teachers, periodically review available data and modify the goals and plan
accordingly. Furthermore, the PCSST counseling department strives to provide ongoing
individualized counseling and necessary educational services. During the goal setting process,
both short-term goals and long-term plans are considered and investments are allocated
accordingly. For instance, CRASP implementation begins in sixth grade. Then, the real impacts
of CRASP will be measured after these students graduate from college. This means that
stakeholders need to wait for a total of eleven years to see the complete products of their
investments.
CRASP Management
The management component of the ASCA National Model (2012) provides PCSST
counselors with organizational assessments and useful tools that have been designed to manage
CRASP. Aligned with the ASCA National Model (2012), in order to deliver and manage
counseling services effectively, PCSST counselors incorporate the following items:
Assessment tools. As the first part of the management component of the ASCA Model
(2012), PCSST counselors utilize the School Counselor Competencies Assessment, which helps

IMPROVING COLLEGE READINESS, PURSUIT, ACCESS, AND PERSISTENCE OF
DISADVANTAGED STUDENTS
58
school counselors self-assess their knowledge, attitudes, abilities, and skills that are necessary to
perform the range of counselor responsibilities in program development, as well as the
foundation, management, delivery, and accountability of CRASP. In addition, the school
counseling program assessment is used to evaluate CRASP. As stated in the ASCA (2012), the
assessment findings help PCSST counselors identify strengths and weaknesses of CRASP and
provide direction for continued program improvement. As the ASCA (2012) indicates, effective
use of time is crucial to implement a successful counseling program to utilize the available
resources efficiently and limit non-counseling duties. In that aspect, PCSST counselors focus on
spending more time on direct counseling services with students, which include systemic
individual counseling sessions and in-class presentations, as well as group counseling sessions
regarding students’ college and career readiness.
In particular, PCSST counselors created individual timetables showing their distribution
of total counseling hours and percentages in order to use their time as effectively as possible. As
ASCA National Model (2012) recommends that PCSST school counselors spend 80% of their
time in direct service with students, with 30% of that time spent on guidance curriculum, around
30% for individual student planning, and 20% for responsive services. Furthermore, the
remaining 20% of the time is set aside for program management and school support services,
such as the school counseling program’s foundation, management, and accountability tasks (p.
43). After PCSST counselors determine the amount of time necessary in each area of the delivery
system, they develop and publish annual, monthly, and weekly calendars to keep students,
parents, teachers, and administrators informed.
Annual counselor agreements. Another tool of the management component of the
ASCA National Model (2012) is an annual agreement. At the beginning of each school year,

IMPROVING COLLEGE READINESS, PURSUIT, ACCESS, AND PERSISTENCE OF
DISADVANTAGED STUDENTS
59
administrators and counselors come together to prepare collaborative agreements which are
aligned with ASCA’s tool that prioritize school counseling activities, timelines, and
implementation plans to improve the PCSST students’ college access, persistence, and
attainment. The agreements include the counselors’ office hours, means of communication,
student assignments, the specific roles and responsibilities of the counselors, distribution of total
school counseling hours, and what materials and supplies are needed. The purpose of these
agreements is to help school counselors ensure to meet each student’s academic, personal/social,
and career needs through comprehensive school counseling programs. Furthermore, these
agreements, which are negotiated with and approved by PCSST administrators, address how the
school counseling program is organized, and what will be accomplished during the school year
(ASCA, 2012).
As indicated in the agreements, school counselors’ duties are divided by grade level and
vary based on expertise and strengths. However, counselors collaborate as a team to make sure
that we are all aware of various issues pertaining to each grade level. This allows them to
become familiar with all students. The school counseling department also meets weekly to
review each counselor’s calendar and make any necessary revisions.
Each PCSST school counselor has an individualized agreement to serve and meet the
needs of each student. In particular, elementary school counselors provide ongoing individual
counseling, elementary character education, academic interventions, and group counseling
services for students’ academic, personal/social, and career development. Furthermore, they
maintain positive relationships with parents, teachers, students, and other staff. Additionally,
elementary school counselors act as Intervention and Referral Service coordinators to provide
appropriate services for special education students. They also conduct in-class presentations,

IMPROVING COLLEGE READINESS, PURSUIT, ACCESS, AND PERSISTENCE OF
DISADVANTAGED STUDENTS
60
which promote early college and career awareness. Both elementary school counselors also serve
as Harassment Intimidation and Bullying (HIB) specialists.
In addition, the PCSST middle school counselors also provide systemic individual
counseling to each student at least three times during the year, track monthly academic progress,
provide group counseling on academic improvement plans, and expose middle school students to
the college admissions and career planning processes. Likewise, the PCSST high school
counselors provide individual academic planning to each high school student at least three times
a year, track academic progress, provide group counseling on topics such as college admissions,
test strategies, and time management, inform students about college and career planning during
the in-class presentations, register students for the SAT, and aid students during their college and
FAFSA application processes. They also organize on-site college visits and instant decision
days, as well as the dual enrollment program. Moreover, all school counselors conduct home
visits in order to increase parental involvement. Finally, they serve as PCSST College Coaching
Program mentors to prepare students for Ivy League and other selective colleges.
Finally, the K-12 school counseling department chair supervises school counselors, and
coordinates and directs several intervention and counseling programs such as the College Dual
Enrollment Program, College Coaching Program, Scheduling Program, Alternative High School
Assessment Program, Interventions, Educational Learning Plans, SAT Prep Program, Instant
Decision Days, Home Visits, National Honor Society Program, and the Alumni Support
Program. The department chair also conducts in-class college and career readiness presentations,
and organizes college on-site admission days, college enrollment trips, and invitations. He also
serves as a district test coordinator for grades K-12, coordinates state tests, and trains the

IMPROVING COLLEGE READINESS, PURSUIT, ACCESS, AND PERSISTENCE OF
DISADVANTAGED STUDENTS
61
teachers. Furthermore, as a school counseling department chair, he also participates in all weekly
administrative meetings to represent the school counselors.
Advisory council. Another tool of the management component of the ASCA National
Model is establishing advisory councils that provide a forum for open dialogue between schools
and communities, and show the perspective of various stakeholders for the counseling program
(Dahir & Stone, 2005). Therefore, as guided by the ASCA National Model (2005), in order to
review and monitor the counseling program activities and make recommendations to improve the
quality of the counseling services, an advisory council is established. The advisory council
represents all key stakeholder groups, which include: (a) a student representative from middle
and high schools, (b) parents, (c) teachers, (d) school counselors, (e) the SAC/HIB coordinator,
(f) administrators, and (g) a community member. Overall, the PCSST advisory council focuses
on initiating, implementing, and sustaining a comprehensive school counseling program that
focuses on improving students’ personal, social, and academic development, as well as college
and career readiness.
Plans and calendars. Effective planning and developing systemic action plans are
necessary to develop and deliver meaningful counseling activities (Dahir & Stone, 2012).
Aligned with this statement, PCSST school counselors use action plans. Each year, PCSST
counselors collaboratively prepare comprehensive action plans to systematically provide
counseling activities and services to students. As the ASCA (2012) recommends, each PCSST
action plan contains: (1) goals to be addressed, (2) related domain areas of national standards and
desired student competencies, (3) a description of the activity, (4) the titles of any packaged or
created curriculum, (5) the timeline in which the activity is to be conducted and completed, (6)
who is responsible for delivery, (7) the method of evaluating school success, (8) expected results

IMPROVING COLLEGE READINESS, PURSUIT, ACCESS, AND PERSISTENCE OF
DISADVANTAGED STUDENTS
62
for students and (9) reflection. The main focus of the action plans is improving student success,
increasing college awareness, and helping students’ SAT preparation, college search, financial
aid, and college applications.
Building a collaborative effort, and designing action plans and calendars play vital roles
in meeting the diverse and complex needs of students in an efficient manner (Dahir & Stone,
2012; College Board, 2012; ASCA, 2012). In line with these focuses, PCSST counselors work
with key stakeholders to address these needs and reach their ultimate goals. They describe the
activities with details in a timeline, and they share responsibilities for expected results.
Moreover, the school data profile, program results data, lesson plans, and monthly and annual
calendars are utilized to outline each counselor’s weekly activities, including in-class
presentations, small-group counseling sessions, individual counseling sessions, career fairs,
college trips, SAT preparation programs, character education activities, college spirit days,
professional development days, home visits, testing timelines, college and financial aid
timelines, and evening workshops that contribute to the students’ academic, personal/social,
emotional, and career development.
CRASP Delivery System
In reference to the ASCA National Model (2012), the delivery system is the main part of
CRASP that offers both direct and indirect counseling services. The list of CRASP components
and their brief descriptions are listed below:
K-12 school core counseling curriculum. As recommended by the ASCA (2012),
CRASP consists of a K-12 counseling curriculum that is comprehensive in scope, preventive in
nature, and developmental in design. Professional PCSST school counselors organize
developmental workshops, in-class presentations, and structured guidance lessons that are

IMPROVING COLLEGE READINESS, PURSUIT, ACCESS, AND PERSISTENCE OF
DISADVANTAGED STUDENTS
63
designed to provide all students with the knowledge and skills required for their college and
career readiness. In order to deliver the K-12 school counseling curriculum, the six full-time
professional PCSST school counselors conduct college and career readiness presentations
systemically for each grade level during the school year. Classroom presentations that are
aligned with the ASCA National Model Standards are infused throughout PCSST’s overall
curriculum and are presented systematically throughout the advisory periods. These workshops
and guidance lessons are modified based on the students’ needs and categorized into four major
domains which are (1) Character Education & Personal Wellness; (2) Knowledge and Life Skills
Building; (3) Career Development; and (4) College Readiness, Access, and Success.
Individual learning plans and academic advising. Aligned with the new accountability
standards, all public schools in New Jersey are strongly encouraged to use the Educational
Proficiency Plan (EPP) to document student work required by 6A:8-4(c-d). Academic advising
and individualized learning plans incorporate students’ personal strengths, skills, abilities,
values, and areas of interest, matching those personal assets with college and career options that
are the most appropriate fit for each student.
The New Jersey Administrative Code also defines a Personalized Student Learning Plan
as:
a formalized plan and process that involves students setting learning goals based
on personal, academic and career interests beginning in the middle school grades
and continuing throughout high school with the close support of adult mentors
that include teachers, school counselors, and parents (N.J.A.C. 6A:8).
Parallel to the expectations of the New Jersey Administrative Codes, one of the areas
that CRASP focuses on is continuous academic improvement of students in grades K-12.

IMPROVING COLLEGE READINESS, PURSUIT, ACCESS, AND PERSISTENCE OF
DISADVANTAGED STUDENTS
64
Therefore, to help all students academically improve, PCSST implement an individual learning
plan that consists of the following components: (1) web-based student information system; (2)
academic data chart that includes students’ individual scores in standardized, diagnostic and
benchmark tests; (3) student survey to identify what the student sees as his/her strengths and
challenges in core subjects or in general; (4) individual proficiency plan that includes goal
setting, action plans and specific recommendations for academic improvement plan, (5) )
communication chart that shows how teachers, counselors, parents, and students work
collaboratively to prepare the individual learning plans, monitor and evaluate the progress made
during the school year.
In order to implement individualized learning plans, the PCSST school counseling
department takes the following steps. First, all school counselors work together and collaborate
with key stakeholders in order to determine the content and logistics of the implementation of
individualized learning plans. Second, based on standardized test results and teachers’
recommendations, unique needs of each student are determined. Third, during the summer staff
orientation, all teachers receive formal training about the implementation of individual learning
plans. In this training, school counselors also provide teachers with resources and materials.
Fourth, after teachers are matched with students, the program starts. During the school year, both
school counselors and administrators follow up on individual learning plans through individual
student and teacher meetings.
Individual college and career counseling sessions. All PCSST counselors are supposed
to meet with each student in grades K-12 for a minimum of three times during the school year to
assist the student in establishing personalized academic, college, and career goals. As
recommended by the National Office for School Counselor Advocacy’s (NOSCA) Eight

IMPROVING COLLEGE READINESS, PURSUIT, ACCESS, AND PERSISTENCE OF
DISADVANTAGED STUDENTS
65
Components of College and Career Readiness Counseling, during the individual counseling
sessions, elementary school counselors focus on “early awareness, knowledge and skills that lay
the foundation for the academic rigor and social development necessary for college and career
readiness” (p.2). Then, during the individual counseling sessions, middle school counselors
provide PCSST students with the opportunities and resources to explore and deepen their college
and career knowledge, and the skills necessary for short and long-term goal setting.
Finally, high school counselors help students select high school courses that play a
crucial role in their college and career readiness. They also focus on creating access to college
and career pathways by offering one-on-one support in college and career exploration and the
selection processes. In particular, aside from conducting college and career assessments and
questionnaires, each student receives one-on-one support for financial application, college
admission portfolio preparation, and successful college transition and adjustment during the
individual counseling sessions.
In general, the content of the individual counseling sessions for each grade and each
student is determined based on the students’ personalized needs. In order to identify each
student’s unique needs, school counselors use several tools that include students’ test scores,
assignment report, discipline report, course grades, attendance report, and teachers’ referrals. It
was also the department’s priority to remain proactive and set up home visits and parent
conferences with early warning signs of little or no college pursuit.
Small group counseling sessions. As a part of the responsive services component of
CRASP, PCSST counselors also organize small group counseling sessions. According to the
students’ needs, the selected topics of small group counseling are: (1) Test Anxiety/Test Taking
Strategies; (2) Anger Management Techniques; (3) Family First; (4) Self-Esteem & Motivation;

IMPROVING COLLEGE READINESS, PURSUIT, ACCESS, AND PERSISTENCE OF
DISADVANTAGED STUDENTS
66
(5) Time Management, Study, and Organization Skills; (6) Personal Wellness; (7) Peer Conflict.
In general, group size is between 6-8 students and based on the group structure, each group
meets for approximately 40 minutes once a week for 5-6 weeks.
College dual enrollment program. Previous research emphasizes the importance of
early college experiences on students’ college readiness, pursuit, and persistence (American
Institutes for Research and SRI International, 2009). The dual enrollment program is the main
way to give students a sense of what college academics are like. In the dual enrollment program,
students who are enrolled in a high school may also be enrolled at a local four-year or two-year
institution. Therefore, to offer early college experience, PCSST has built a partnership with post-
secondary institutions such as Monroe College, DeVry University, and Passaic County
Community College. The college dual enrollment program is designed to allow PCSST students
to receive first-hand college classroom experience by enrolling in several college courses before
they graduate PCSST. This is not only reflected on their high school transcript, but also
contributes earned credits toward their college transcript. Each year, eligible juniors and seniors
take advantage of the dual enrollment program and get a head start on their college experiences.
SAT preparation program. In order to prepare students for college entrance exams,
PCSST entered a partnership with The Princeton Review, and the SAT Ultimate Courses were
offered to PCSST juniors. The Princeton Review’s comprehensive early college preparation
courses introduce students to standardized test preparation techniques and demonstrate the link
between academic subjects and their corresponding question types on college entrance tests. In
order to increase the turnout rate, the SAT Prep Program was offered during school hours.
Students who participated in this program received a SAT preparation guidebook and practice
books. They also had an opportunity to take several full-length SAT practice tests. In general,

IMPROVING COLLEGE READINESS, PURSUIT, ACCESS, AND PERSISTENCE OF
DISADVANTAGED STUDENTS
67
this program provided PCSST with supplemental coursework to give their students an advantage
in the college preparation process. In addition to SAT and PSAT tutoring sessions, PCSST
school counselors also provided students and parents with resources and college entrance test
prep materials.
PSAT and SAT credit elective courses. As indicated by the College Board (2010),
Preliminary Scholastic Aptitude Test (PSAT) and Scholastic Aptitude Test (SAT) provide a path
to opportunities for post-secondary, financial support, and scholarships. It is also noted that
college entrance tests keep pace with what colleges are looking for today (College Board, 2013),
measuring the skills required for success in the 21st century. Therefore, PCSST offers 2.5 credits
elective courses for high school students to prepare them for college entrance exams. In addition
to the PSAT and SAT content, students are schooled on “effective test taking” strategies during
these credit elective courses.
Instant decision days. Organizing on-site college admission days is one of the most
important components of CRASP. Thanks to the school counselors’ collaborative efforts with
post-secondary institutions, around ten instant decision days are organized with various local
colleges and universities each year. PCSST counselors made applying for undergraduate
admission very easy for students by coordinating on-site admissions. During the on-site
admissions, PCSST students’ college application fees are waived. This means that thanks to the
instant decision days, PCSST seniors save an average of 300 dollars on their college
applications. During instant decision days, college admission counselors review seniors’
completed college application files and make acceptances and scholarship decisions on the spot.
The post-secondary institutions that attended PCSST’s instant decision days are: New Jersey
City University, William Paterson University, Bloomfield College, Fairleigh Dickinson

IMPROVING COLLEGE READINESS, PURSUIT, ACCESS, AND PERSISTENCE OF
DISADVANTAGED STUDENTS
68
University, St. Peter University, Monroe College, Felician College, Dover Business College,
Caldwell College, Berkeley College, DeVry University, Lincoln Technical Institute, Passaic
County Community College, and Bergen County Community College, as well as military
schools.
College fairs and college trips. Starting in middle school, PCSST counselors schedule
field trips for PCSST students to visit college open houses and college fairs. In particular,
counselors take students to national and district college fairs, which usually have representatives
from many colleges across the nation. PCSST counselors believe that college fairs that are
sponsored by NACAC and NJACAC are a good way for students to learn about many colleges
and get a brief snapshot of them. Each year, all PCSST seniors also participate in the Historically
Black Colleges and Universities’ (HBCUs) college fair. During the HBCU college fairs, PCSST
senior students get an opportunity to speak to over 50 HBCUs that provide application fee
waivers, scholarship awards, and on-site admissions.
School-wide career day. Each year, the PCSST counseling department holds an annual
Career Day. A total of 485 students from Grade 7 to Grade 12 participated in the Career Day. In
general, PCSST Career Day starts at 8:30 am and ends at 1:00 pm. PCSST school counselors
work collaboratively to invite speakers representing various career fields and various career
schools such as Dover Business School, Berkeley College, DeVry University, Lincoln Technical
Institute, and Passaic County Community College. During the PCSST Career Day, students stay
in their classroom and speakers and presenters from each different career cluster share their
perspective of the career world and give PCSST children first-hand career experience.
Parent-counselor and student conferences. In addition to phone calls, emails, and
letters sent home, each school counselor from grades K-12 arrange individual meetings with

IMPROVING COLLEGE READINESS, PURSUIT, ACCESS, AND PERSISTENCE OF
DISADVANTAGED STUDENTS
69
parents and students to address the specific needs of students. In general, during the parent
counselor and student conferences, school counselors go over students’ academic progress,
personal graduation plan, test scores, attendance and discipline reports, and individual college,
career, and financial aid plan.
Home visitation. At PCSST, it is noted that many parents have difficulties attending
report card nights and parent events because of various reasons such as their very busy and long
work schedules or transportation issues. Therefore, in order to improve parental involvement, the
home visitation program is designed to allow PCSST school counselors, teachers, and
administrators to reach out to parents. Based on the student’s needs, and with the parental
consent, school counselors work with teachers to arrange home visits.
A day also is devoted to professional development activities to train all PCSST staff and
faculty for home visitations. On that day, after the training, all PCSST teachers, administrators,
counselors, and other supportive staff participate in a home visitation. The purpose of the home
visitations is to learn about the student's needs, interests, and concerns to establish
communication and rapport with parents. During these visits, the parents are informed of their
child’s academic progress, as well as any pertinent college and career information. During the
visits, teachers and counselors also chat about the school community, school environment,
programs, and their child’s overall achievement thus far. These visits are considered a friendly
informational visit to let parents and students know about the academic and counseling support
services and programs offered at PCSST.
Teacher tutoring. In order to improve students’ academic development and enhance
student learning, PCSST help students get extra academic support from teachers. In PCSST,
there are three main teacher tutoring services. The first is the intervention period. During the

IMPROVING COLLEGE READINESS, PURSUIT, ACCESS, AND PERSISTENCE OF
DISADVANTAGED STUDENTS
70
intervention periods, a small group of students who need additional help meet with their assigned
teachers from 2:44pm to 3:26pm twice a week and get extra academic support. The second
teacher tutoring service is Saturday school, a program that provides a small group of students
with help to meet their academic goals. Saturday school tutors are certified teachers from
PCSST. They come to the school on Saturdays to teach students who face difficulties in their
classes. The third tutoring service is teachers’ office hours. PCSST students who need extra
academic support go to their teacher’s pre-assigned office hours to ask their questions.
Peer tutoring. In addition to teacher tutoring services, the peer tutoring program is also
designed to help PCSST students who are having difficulties in a course because of a particularly
challenging subject matter, lack of basic foundation, lack of preparation, or other factors. Peer
tutors are PCSST former students or high-achieving volunteer students who have a high level of
knowledge and skill in a specific subject, and are available to all students who are seeking help
to improve. In general, PCSST counselors make arrangements for a high-achieving student to
tutor another student, one who may be doing poorly in a specific class. This sometimes includes
help with homework or project assignments.
High school recognition and reward program. In order to create and promote a school-
wide college-going culture in PCSST and recognize college-ready students, the PCSST school
counselors have implemented several incentives. For example, student college acceptances and
scholarships awards are presented at the (1) Wall of Honor, (2) School Web Site, (3) Graduation
Ceremony, (4) School-wide Assemblies, and (5) Guidance Office. Furthermore, students who
receive a college acceptance are allowed to wear their college t-shirts during certain school days.
Moreover, to encourage and recognize college and career-ready students, one student receives
“the most college and career-ready” award during the graduation ceremony each year.

IMPROVING COLLEGE READINESS, PURSUIT, ACCESS, AND PERSISTENCE OF
DISADVANTAGED STUDENTS
71
PCSST’s school counseling department also initiated the “GOTCHA” Doing Good
Positive Reward Program to reward students who demonstrate positive behavior and/or good
character on a daily basis. In order to implement this program, teachers and staff members are
provided a “GOTCHA” Doing Good ticket book. All staff and faculty are encouraged to give out
these tickets to students daily, as often as they observe positive actions, kind words, or positive
character traits. These tickets are given out at teacher/staff member discretion. Examples
include: Caught you being respectful, caught you showing kindness, caught you following
directions, or caught you doing your classwork. In general, teachers have the freedom to decide
what he/she feels is positive behavior on an individualized basis. Teachers attempt to reward
progress, not perfection. This means that they will attempt to observe each student exhibiting
positive change instead of rewarding the same students multiple times.
Teachers fill out the front of the “GOTCHA” Doing Good ticket with the name of the
student, grade, and section, and on the back of the ticket they are asked to write the positive
behavior they observed. Then, they give the ticket to the student to place into the “GOTCHA”
box, located in the Guidance Office. Each Friday afternoon, two tickets/winners per grade are
selected. Pictures of winners are taken and displayed along with their names on a slide in the
Monday morning assembly, and are also posted on the Guidance bulletin board. Furthermore,
during the morning assembly every Monday, the winners of the weekly prize are announced.
Winners have the opportunity to pick one of the following prizes: fast pass to the head of the
lunch line, lunch with the principal or school counselor, homework pass, pass to organize locker,
teacher helper, or small school supplies.
In addition, to support students’ college application and increase their college knowledge,
PCSST organizes PCSST College Spirit days. Every Thursday during May, school counselors

IMPROVING COLLEGE READINESS, PURSUIT, ACCESS, AND PERSISTENCE OF
DISADVANTAGED STUDENTS
72
encourage teachers to wear their alma mater shirts/sweatshirts that represent the college they
attended and/or graduated from. This gets the students to talk to their teachers about college and
hopefully get them interested in learning more about different colleges. It is also a great way for
teachers to show students that they are proud of attending their college and graduating with a
degree. Teachers are also encouraged to share their college experience with each class. In week
one, teachers are asked to give brief information about their college (size, financial aid
opportunities, location, clubs, sport activities, admission requirements, etc.). In week two,
teachers are encouraged to talk about their college preparation, search, and college application
experiences. In week three, they talk about their college, major and career decision process. In
week four, they share their personal experience about how they paid for their college tuition and
other expenses. In the final week of college spirit days, teachers share their specific
recommendations to stay, achieve, and graduate from college and what works in college success.
AP and honor courses. As indicated by College Board, taking AP courses gives the
students the academic knowledge and skills to help them at their college or university. In
addition, if students score well on the AP Exam, they have an opportunity to earn official college
credits. AP Exam scores are reported on a 5-point scale as follows: (5) extremely qualified,
(4) well qualified, (3) qualified, (2) possibly qualified, or (1) no recommendation. In reference to
these scoring, students who score 3 or above are qualified to receive college credit or advanced
placement. In order to prepare students for AP and college level courses, honor course tracks that
require an intensive amount of challenging assignments and exams are designed. The first AP
course was given at PCSST during 2012-2013, however, starting in September 2013, each
academic department, including mathematics, English, social studies, and science, is offering an
AP course.
IMPROVING COLLEGE READINESS, PURSUIT, ACCESS, AND PERSISTENCE OF
DISADVANTAGED STUDENTS
73
ACCUPLACER test preparation and practices. Recently, in order to assess the
academic readiness of accepted students, many post-secondary institutions began to administer a
college replacement test known as ACCUPLACER that has a computer-adaptive design,
allowing students to get a detailed analysis of their strengths and weaknesses (College Board,
2013). PCSST used several strategies to prepare students for the ACCUPLACER test. First,
PCSST invited local college representatives and admission counselors who provided students
with information about the content of the ACCUPLACER test and how it works in college.
Additionally, PCSST offered ACCUPLACER practice tests for seniors during the school year.
The purpose of the ACCUPLACER practice tests is to improve PCSST students’ skills and help
them become familiar with the style and content of questions asked on an ACCUPLACER test.
Finally, after students complete their preparation, PCSST collaborates with Passaic County
Community College (PCCC) to give senior students the opportunity to take a free official
ACCUPLACER test that provides a personalized analysis of a student’s strengths and
weaknesses.
Personalized FAFSA application support. According to previous studies, the
complexity of the FAFSA application and lack of information appear to be two significant
barriers that hinder disadvantaged students’ FAFSA application. The research also reported that
many students eligible for aid do not apply for FAFSA (Sturrock, 2002; King, 2004; Bettinger et
al., 2009). Therefore, PCSST school counselors offer individualized assistance with FAFSA
completion to each senior student. During one-on-one individual counseling sessions, school
counselors strive to simplify the process of getting financial aid and provide clear information
about the FAFSA process and grant eligibility.

IMPROVING COLLEGE READINESS, PURSUIT, ACCESS, AND PERSISTENCE OF
DISADVANTAGED STUDENTS
74
Providing fee waivers. PCSST school counselors encourage each senior student to apply
to an average of five colleges. With college application fees averaging $35–50 as indicated by
the College Board, applying to several colleges can be expensive for any student. Particularly in
an urban school setting with 90 percent of students enrolled in the free and reduced lunch
program, it may be difficult for many families to subsidize around the $300 college application
fees. Therefore, in order to ease the college application process, PCSST counselors take
advantage of the college application fee waiver program, sponsored by the College Board and
The National Association for College Admission Counseling (NACAC). Each year, counselors
provide eligible PCSST seniors with college application fee waivers so they can complete and
submit their college applications.
In addition, school counselors encourage PCSST students to take the SATs and subject
tests twice. Currently, the fee for general SAT registration is $51. Taking the SAT multiple times
is definitely expensive for the majority of PCSST students. Like college application fee waivers,
the College Board and ACT offer fee waivers to help lower-income students pay for their college
entrance tests. Therefore, PCSST counselors collaborate with the College Board and ACT to
request fee waivers that cover 100% of the registration fees for a single test date. As reported by
the College Board, each eligible PCSST student can use up to two waivers for the SAT and up to
two waivers for SAT Subject Tests, a total of four fee waivers.
Alumni support program. PCSST’s counseling department is also focused on
increasing its alumni students’ college success. Therefore, in order to improve the college
persistence and attainment of each PCSST-graduated student, the alumni support program was
established. Initially, PCSST enrolled in the National Clearinghouse Student Tracker Program
and graduated PCSST students were hired as alumni coordinators to reach out and monitor each

IMPROVING COLLEGE READINESS, PURSUIT, ACCESS, AND PERSISTENCE OF
DISADVANTAGED STUDENTS
75
PCSST alumni. The main role of PCSST alumni coordinators is to support each graduated
student’s college success and graduation. Overall, CRASP’s vision is to provide ongoing support
and guidance to all PCSST alumni so they can succeed in their schools, career, and life. A full
list of alumni support services includes: (a) Offering personalized career counseling sessions; (b)
arranging summer part-time job opportunities; (c) Helping search for scholarships and grants; (d)
Providing mentoring; (e) Internship arrangements; (f) Offering academic advising and tutoring;
(g) Individualized FAFSA application support; (h) Arranging field trips and network events, (i)
Free Access to the PCSST library, gymnasium, and computer laps.
Responsive services. In addition to individual counseling sessions and guidance
curriculum, as recommended by the ASCA National Model (2005), responsive services are also
established to meet the immediate needs of PCSST students, such as grief counseling, peer
pressure, high anxiety, family problems, peer conflicts, a school-wide harassment intimidation
and bullying program, a substance abuse awareness program, a gang involvement prevention
program, and a school-wide referral program. Aside from traditional students, PCSST school
counselors also identify and meet with each at-risk student who needs extra support.
In particular, while all PCSST counselors conduct responsive services for the students’
immediate needs, a large percentage of those services are conducted by the Student Assistance
Counselor (SAC) and crisis specialist. The SAC provides PCSST students with necessary
interventions, referrals, and character education. The specialist works with the school staff on a
daily basis to identify at-risk students, and remains proactive in devising appropriate individual
interventions. The specialist also acts as a Harassment Intimidation and Bullying (HIB)
coordinator, and attends professional in-services and conducts ongoing research on the changing
New Jersey HIB laws to make sure that school’s curriculum reflects the state laws. Finally, the

IMPROVING COLLEGE READINESS, PURSUIT, ACCESS, AND PERSISTENCE OF
DISADVANTAGED STUDENTS
76
HIB coordinator uses school data and extensively collaborates with the dean of students to
prevent any behavioral issues.
CRASP Accountability
With the advent of NCLB (2001), teachers, counselors, and administrators are
increasingly challenged to provide evidence of program accomplishment. Therefore, like all
other stakeholders, school counselors are expected to demonstrate the effectiveness of their
school’s counseling program in measurable terms. With that end, PCSST school counselors use
measurable units and various assessment techniques and strategies to evaluate the program and
hold it accountable, PCSST counselors collect and utilize several tools that link the program to
student achievement. These monitoring and assessment tools are listed below.
First of all, during the departmental meetings, PCSST counselors prepare a results report,
which includes program impacts on students, what worked well, and what needs to be modified
to improve the effectiveness at the end of the each counseling program. After the results report is
prepared, the school counselors share this report with key stakeholders. Second, as recommended
by the ASCA National Model (2012), PCSST counselors utilize the adapted version of ASCA’s
program audit template. These program assessment tools are designed to help counselors
evaluate their own performance and program impacts while delivering counseling services.
In addition, school counselors utilize a six-step accountability process known as
MEASURE to demonstrate the impact of the school counseling program, and to monitor and
evaluate program implementation. Like the program audit tool, MEASURE provides an
accountable data-driven school counseling program to help the counselors collect information
and data to ensure that the PCSST counseling program is comprehensive in design, delivered in a
systemic fashion for all students, and accountable for results (Dahir & Stone, 2012).

IMPROVING COLLEGE READINESS, PURSUIT, ACCESS, AND PERSISTENCE OF
DISADVANTAGED STUDENTS
77
CRASP and Collaborative Effort
During the initiation and implementation of CRASP, the school counselors collaborated
and partnered with various key stakeholders to develop, maintain, and enhance the total
counseling program. In order to make a change and lead the comprehensive counseling program,
professional PCSST school counselors focused on establishing a collaborative effort among key
stakeholders by participating in teachers’ and administrators’ meetings. During these meetings,
the major barriers and challenges that PCSST may encounter in program initiation and
implementation were discussed and identified.
Moreover, the program coordinator worked with school administrators, teachers, and
other key stakeholders to deal with these barriers by offering practical suggestions for program
implementation that focused on improving disadvantaged students’ college readiness, pursuit,
access, and persistence. For example, counselor and teacher partnerships play an important role
in the design and development of effective counseling activities that help students’ college
preparation and enrich their high school success. In particular, school counselors work with
classroom teachers to arrange classroom guidance activities such as college awareness
workshops, test taking strategies, dealing with anxiety, improving study and time management
skills, financial aid workshops, and effective interview techniques.
Additionally, PCSST school counselors and teachers work together in order to prepare
students for the college entrance tests. While the professional school counselors help students
register for SAT and ACT, math and English teachers help PCSST students by teaching useful
SAT-taking techniques. PCSST counselors also participate in weekly grade chair committee
meetings to review and monitor each student’s academic progress with their grade level teachers.
IMPROVING COLLEGE READINESS, PURSUIT, ACCESS, AND PERSISTENCE OF
DISADVANTAGED STUDENTS
78
During these grade chair meetings, counselors and teachers work together to determine which
students are in need of some extra academic support and counseling services.
In addition to collaborating with PCSST teachers, the school counselors work closely
with the school administrators to develop and deliver effective counseling services. For example,
each week, the director of school counseling services attends executive team meetings to
represent all school counselors and inform the school administration team about comprehensive
school counseling programs. The director of school counseling services is considered a
permanent member of the school leadership team.
During the leadership meetings, the director of school counseling services shares school
counselors’ inputs and collaborate with school administrators to initiate and implement
interventions to help get the students ready for college and careers. Thanks to the school
counselors and administration’s partnership, several academic and counseling services have been
initiated and implemented. These include a school-wide SAT prep program, after school
programs, Saturday academic success program, tutoring services, college and career fairs,
PCSST positive awards program, college dual enrollment program, character education program,
college coaching program, college and career readiness courses, and mentoring program.
Furthermore, PCSST school counselors partner with parents. Specifically, the counselors
organize an annual parent workshop series that includes financial aid workshops, college
awareness workshops, and career readiness workshops. Home visits are also arranged for PCSST
students to discuss her/his college and career preparation plans, as well as academic and personal
development activities. The school counselors have prepared a parent handbook to help parents
understand, support, and track the college-bound students’ admission and scholarship application
processes. In order to encourage and inform parents about the college and scholarship application
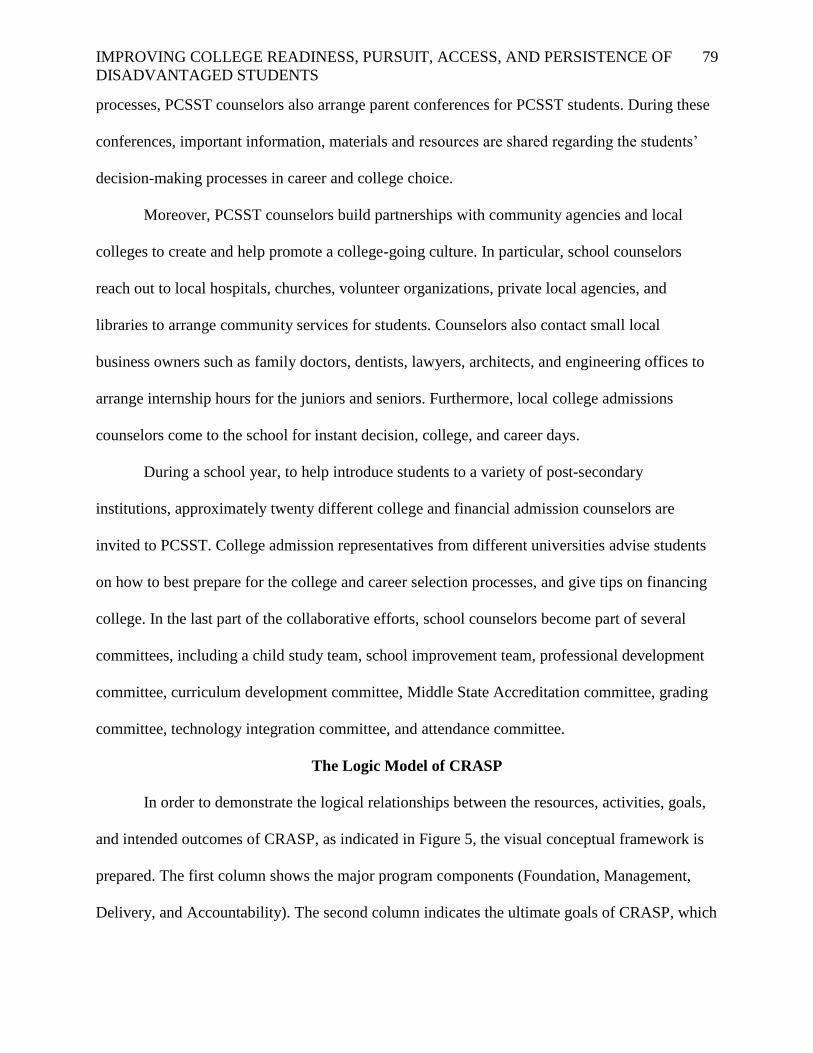
IMPROVING COLLEGE READINESS, PURSUIT, ACCESS, AND PERSISTENCE OF
DISADVANTAGED STUDENTS
79
processes, PCSST counselors also arrange parent conferences for PCSST students. During these
conferences, important information, materials and resources are shared regarding the students’
decision-making processes in career and college choice.
Moreover, PCSST counselors build partnerships with community agencies and local
colleges to create and help promote a college-going culture. In particular, school counselors
reach out to local hospitals, churches, volunteer organizations, private local agencies, and
libraries to arrange community services for students. Counselors also contact small local
business owners such as family doctors, dentists, lawyers, architects, and engineering offices to
arrange internship hours for the juniors and seniors. Furthermore, local college admissions
counselors come to the school for instant decision, college, and career days.
During a school year, to help introduce students to a variety of post-secondary
institutions, approximately twenty different college and financial admission counselors are
invited to PCSST. College admission representatives from different universities advise students
on how to best prepare for the college and career selection processes, and give tips on financing
college. In the last part of the collaborative efforts, school counselors become part of several
committees, including a child study team, school improvement team, professional development
committee, curriculum development committee, Middle State Accreditation committee, grading
committee, technology integration committee, and attendance committee.
The Logic Model of CRASP
In order to demonstrate the logical relationships between the resources, activities, goals,
and intended outcomes of CRASP, as indicated in Figure 5, the visual conceptual framework is
prepared. The first column shows the major program components (Foundation, Management,
Delivery, and Accountability). The second column indicates the ultimate goals of CRASP, which

IMPROVING COLLEGE READINESS, PURSUIT, ACCESS, AND PERSISTENCE OF
DISADVANTAGED STUDENTS
80
are improving students’ college readiness, college pursuit, college access, and college
persistence. Furthermore, the items in the ellipse represent the program’s proximal goals, which
are helping students obtain a high level of academic knowledge, academic habits, personal
qualities, social readiness, emotional readiness, mental readiness, career readies, and financial
readiness. Finally, the framework also dictates that some conditions must be present in order to
initiate, implement, and sustain a comprehensive school counseling program. These required
conditions are considered program essentials. The triangles include the essentials of CRASP
which are: Culture of (a) Ongoing Caring; (b) Ongoing Improvement; (c) Ongoing Partnership;
(d) Ongoing Accountability; (e) Ongoing Dedication; (f) Consistency; (g) College-Going; (h)
Technology Integration; (i) Advocacy; (j) High Expectations, and (j) Differentiation
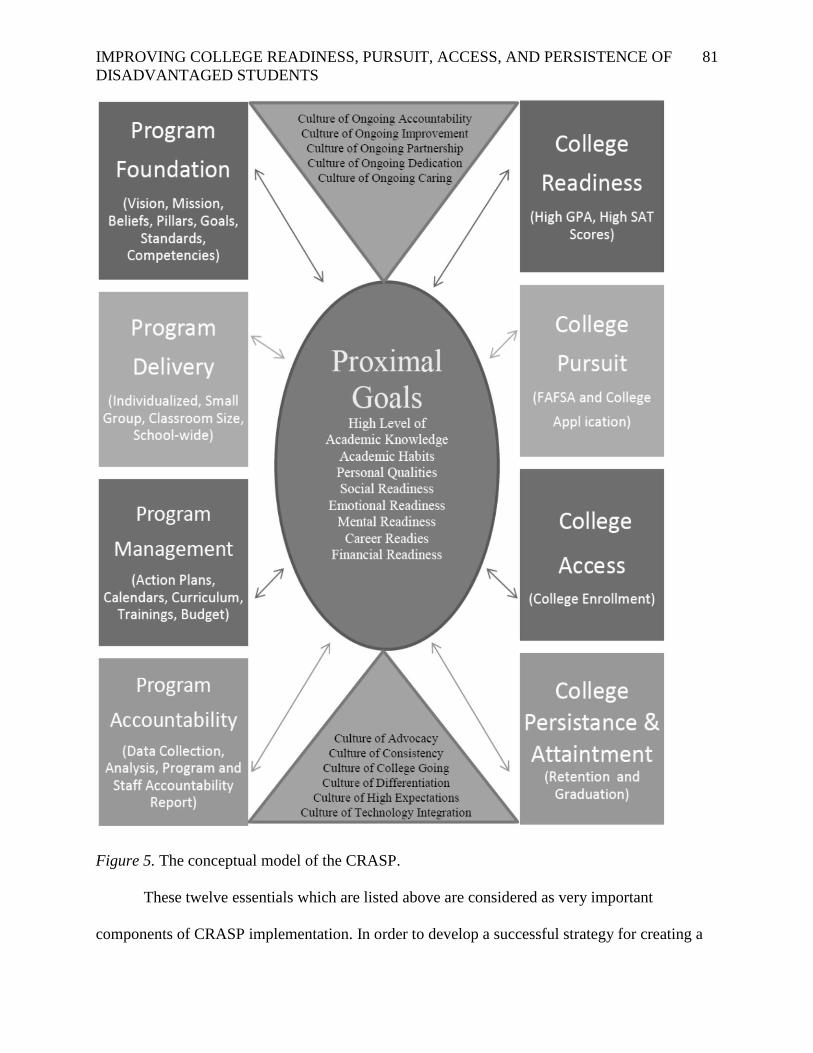
IMPROVING COLLEGE READINESS, PURSUIT, ACCESS, AND PERSISTENCE OF
DISADVANTAGED STUDENTS
81
Figure 5. The conceptual model of the CRASP.
These twelve essentials which are listed above are considered as very important
components of CRASP implementation. In order to develop a successful strategy for creating a

IMPROVING COLLEGE READINESS, PURSUIT, ACCESS, AND PERSISTENCE OF
DISADVANTAGED STUDENTS
82
college-going culture for all students, and to have all program essentials, the program
coordinator and professional school counselors collaborate with school administrators, teachers,
parents and other key stakeholders. As it is noted in the literature review there is no quick fix for
improving the college and career readiness of disadvantaged students. Key stakeholders need to
understand that preparing first-generation and low-income students for college, and providing
them with ongoing support until they graduate from college, requires systemic investments and
planning. The visual conceptual framework of CRASP is prepared to provide stakeholders with a
systemic approach to initiate, implement and institutionalize comprehensive school counseling
services.
Developing a visual framework is important in the program design and implementation.
Having a conceptual framework might help stakeholders see the short and long terms goals of
the comprehensive school counseling program. When all things are taken into consideration, as
Lotkowski, Robbins, and Noeth (2004) note, helping disadvantaged students get ready, get into,
and get through college is a long-term investment that requires multifaceted approaches and
collaborative efforts among various stakeholders and institutions. Therefore, as it is indicated in
the visual conceptual framework of CRASP, disadvantaged students need to receive systemic
and ongoing support and guidance during their high school years to be prepared for post-
secondary education and their future careers. This visual framework is expected to provide
professional school counselors, administrators and key stakeholders with a roadmap to improve
disadvantaged students’ college readiness, pursuit, access, and persistence.
Theoretical Framework of CRASP
According to the literature, the majority of urban high school students do not have the
proper capitals that are necessary for college readiness and success. Therefore, helping
IMPROVING COLLEGE READINESS, PURSUIT, ACCESS, AND PERSISTENCE OF
DISADVANTAGED STUDENTS
83
disadvantaged urban students gain access to these human, social, cultural, and financial capitals
is crucial to helping them fulfill their academic and college goals. Aligned with this approach,
the theoretical framework of the study focuses on creating the collaborative efforts to make these
capitals available for all students so they can develop the coping skills to stay and succeed in
college. As shown in Figure 6, the theoretical approach of CRASP combines and utilizes all four
forms of capital to fully understand what works in the disadvantaged students’ opportunities for
college readiness, pursuit, access, and success.
Particularly, as shown in Figure 6, in this study, building social capital is associated with
(a) building caring relationships, (b) establishing social network support, and (c) providing
college resources and knowledge. Second, building cultural capital is associated with (a) setting
high expectations, (b) encouraging and engaging in college and career activities, and (c) building
norms and values for post-secondary education. Third, building financial capital is associated
with (a) subsidizing college entrance test preparation, (b) offering fee-waivers, and (c) preparing
individualized college affordability plans. Finally, building human capital is associated with (a)
offering rigorous college-prep courses and curriculum, (b) preparing students for college
entrance exams, and (c) preparing and monitoring individual learning and graduation plans.

IMPROVING COLLEGE READINESS, PURSUIT, ACCESS, AND PERSISTENCE OF
DISADVANTAGED STUDENTS
84
Figure 6. The theoretical model of CRASP.

IMPROVING COLLEGE READINESS, PURSUIT, ACCESS, AND PERSISTENCE OF
DISADVANTAGED STUDENTS
85
CHAPTER FOUR: METHODOLOGY
The methodology section contains a detailed description of the research design and
sample selection process, including the data collection, management, and analysis, followed by
the role of the researcher, validity, and reliability issues.
Research Design
The research design and methods for this study are derived from the experiences of a
pilot study conducted in the summer of 2011, which employed quantitative research methods in
order to evaluate the impacts of a comprehensive College Readiness Access and Success
Program (CRASP). Aligned with the research questions, the quantitative data was collected and
analyzed to determine the impacts of CRASP on PCSST students’ college readiness, pursuit,
access, and persistence. Particularly, students’ cumulative GPA, SAT test scores, college
enrollment, college retention rates, and responses to survey questions are used to measure
graduated PCSST students’ outcomes and program impacts.
The data was collected for five years (cohorts 2009, 2010, 2011, 2012, and 2013). The
first cohort (Class of 2009) did not participate in CRASP and serves as the control group. Each
subsequent PCSST cohort had one additional year of CRASP compared to the previous cohort.
This study compares the college experiences and outcomes of PCSST students who participated
in CRASP for different lengths of time (from zero to four years). Archived student data also
provided additional information for student characteristics, including student achievement levels
at high school entry.
While there are some similarities, this is not an interrupted time series because there is
only one pre-test. The design for this study may be viewed as a pre-test followed by multiple
post-tests, similar to an interrupted time series design with only one pre-test point, or as a

IMPROVING COLLEGE READINESS, PURSUIT, ACCESS, AND PERSISTENCE OF
DISADVANTAGED STUDENTS
86
treatment dose-response study in which each succeeding cohort received a higher dose. Thus,
one must predict either an abrupt change after the first year or a steady improvement in outcome
with each year.
In addition to the descriptive statistics (Frequencies, Mean, Median, Mode, Standard
Deviation) the inferential statistics that include the t-test, Analysis of Variance (ANOVA),
multiple regression, and binary logistic regression are used to estimate the effects of CRASP,
controlling for student demographics and abilities prior to CRASP. Aligned with these inferential
statistics techniques, for this study, t-tests, correlational analysis, and regression analyses are
used to determine if there were significant differences (p < .05, two-tailed) between various
aspects of student college readiness, pursuit, access, and persistence. In addition, this
dissertation study describes the experiences of former PCSST students in post-secondary
institutions, with particular attention paid to problems and challenges that encounter in their first
year of college education.
Pilot Study
A pilot study is considered a very important component of a research study, because it
allows researchers to employ surveys to small samples to study and revise the procedures and
questions for a larger study (Berends, 2006). In that aspect, to validate the survey instruments
and determine the reliability of the questions, a pilot study of the survey instruments was
conducted on a small scale during the summer of 2011. The survey questions were administered
to eight participants, each a student who graduated from PCSST. After the participants
completed the survey, they were asked to share their experiences regarding the length of the
survey, content, wording, and clarity of questions, as well as the format of the survey. Pilot
respondents indicated that they were satisfied with the quality of the questions. In particular,

IMPROVING COLLEGE READINESS, PURSUIT, ACCESS, AND PERSISTENCE OF
DISADVANTAGED STUDENTS
87
participants responded that the survey questions were all associated with their college
experiences. However, they pointed out that the length of time it took to complete the survey was
not appropriate. Participants found the seven-page survey too long. The researcher went over all
comprehensive alumni survey items to identify repeating questions. Then, repetitive questions
were eliminated from the alumni survey.
While reviewing the survey items, participants also indicated that some questions were
not clear for them. Therefore, the wording of these questions was changed to improve
readability. Furthermore, section four of the survey contained a list of student and institutional
factors that can affect students’ college success; respondents identified that some of the items
were very similar to each other. Then, the items in the section four were clarified and revised.
In addition to graduated PCSST students, survey questions were reviewed by eight
colleagues, each with an educational background, four with master’s degrees in school
counseling. All items in the five sections were validated as acceptable. The wording of some
questions was changed. Additionally, a total of eight items in sections three and four were
dropped because they were considered close to other items in the same section of the survey.
Finally, based upon the experiences gained from the pilot study and peer review, the
comprehensive alumni survey (Appendix A) was finalized for data collection.
Context, Setting, and Basic Demographics of Participants
This study was conducted at Paterson Charter School for Science and Technology
(PCSST), located in Paterson, New Jersey. The 2000 Census data shows that less than 9% of the
population in Paterson holds a bachelor degree or higher, and over 25% of families are below the
poverty level, with a median household income of $32,778. According to the NJDOE 2012
school report card, the population of PCSST is 1,039 students, and includes grades K through 12.

IMPROVING COLLEGE READINESS, PURSUIT, ACCESS, AND PERSISTENCE OF
DISADVANTAGED STUDENTS
88
As indicated in Figure 7 below, approximately 90% of PCSST students are enrolled in the free
and reduced lunch program. Additionally, 3.4% of the PCSST student population is white, and
85% of the school’s population is African American or Hispanic. While 7.2% of PCSST students
are enrolled in special education programs, 4% of PCSST students receive English as a Second
Language (ESL) support.
Figure 7. PCSST school demographics in 2011-2012.
Based on the NJDOE 2012 school report card and enrollment data, PCSST and the
Paterson Public School District (PPSD) have somewhat similar school demographics. Both the
Paterson Public School District’s and PCSST’s populations mirror the demographic trend of
urban communities in New Jersey: around 90 percent of all students are of Hispanic or African-
American origin, and approximately 10 percent are of Caucasian, Middle Eastern, or Asian
descent. The comparison of these demographics is shown in Figure 8, below. As can be seen,
PCSST has a higher percentage of African-American Students than this district as a whole, and a
much lower percentage of ESL and special education students.
7.9% 4.0%
85.0%
3.4%
44.0% 41.0%
0.0%
10.0%
20.0%
30.0%
40.0%
50.0%
60.0%
70.0%
80.0%
90.0%
100.0%
School Demographics
Special Ed ESL Free and Reduced White Hispanic African American

IMPROVING COLLEGE READINESS, PURSUIT, ACCESS, AND PERSISTENCE OF
DISADVANTAGED STUDENTS
89
Figure 8. School demographics of PCSST and the Paterson Public School District.
The participants were all cohorts (classes 2009-2013) from Paterson Charter School for
Science and Technology (PCSST). The implementation of CRASP began in September 2009.
The first cohort graduated from PCSST in June 2009. Each year, an average of 77 senior students
graduates from PCSST. The research consists of comparing the basic demographics of the
PCSST class of 2009, who never participated in the CRASP, and the class of 2010, 2011, 2012,
and 2013, who participated in the program starting in September 2009. In other words, all
PCSST students from cohort 2009, 2010 2011, 2012, and 2013 are considered the target
population of the study. Table 2 shows the number of students in each cohort, and also gives
numbers of transfer-in and out students from each cohort.
AfricanAmerican
White HispanicFree
ReducedESL Special Ed
PCSST 41% 3% 44% 85% 4% 8%
PPSD 28% 10% 62% 86% 16% 16%
0%
10%
20%
30%
40%
50%
60%
70%
80%
90%
100%%

IMPROVING COLLEGE READINESS, PURSUIT, ACCESS, AND PERSISTENCE OF
DISADVANTAGED STUDENTS
90
Table 2.
The Number of Students in Cohort from 2009 to 2013
Cohort # of Students # of Transfer in
Students
# of Transfer out
Students
2009 77 12 18
2010 79 14 17
2011 75 9 18
2012 74 8 18
2013 79 16 20
Total 384 59 92
PCSST’s Admissions and Enrollment Practices
As reported in the 2012 report card, the admission policy and evaluation criterion for
Paterson Charter School for Science and Technology is non-discriminatory and is designed to
ensure equal opportunity for interested applicants, grades K through 12. Enrollment is open on a
space-available basis. PCSST does not discriminate on intellectual or athletic ability, measures of
achievement or aptitude, status as a handicapped person, proficiency in the English language, or
any other basis that would be prohibited if used by a school district (N.J.S.A18A:36A-7).
Each year, during the enrollment process, existing students had first priority for re-
enrollment, regardless of resident status. An existing student refers to a student currently enrolled
in the charter school. In other words, the priority for enrollment is given to existing students and
their sibling(s) residing in the Paterson school district. If all available spaces are not filled by
existing students and their sibling(s) at the close of the initial recruitment period, enrollment is
then made available to resident students.
Non-resident students apply for admission with the understanding that priority for
enrollment is first given to existing students and their siblings, then to those residing in the
Paterson school district. If all available spaces are not filled by existing students, their siblings,

IMPROVING COLLEGE READINESS, PURSUIT, ACCESS, AND PERSISTENCE OF
DISADVANTAGED STUDENTS
91
and resident students at the close of the initial recruitment period, enrollment is then made
available to non-resident students.
In the event that there are more applications for admission than there are allotted spaces,
a random process for admission in the form of a Lottery Drawing is used to determine enrollment
at PCSST in accordance with N.J.S.A 18A:36A-8(a). In the event that a lottery process is used to
determine enrollment at PCSST, names of applicants continue to be drawn after all available
grade-level spaces have been filled in order to form an enrollment “waiting list”. During the
recruitment period, names remain on the waiting list for enrollment in the subsequent year only.
At the expiration of the waiting list, the parent or guardian is required to apply for admission
again.

IMPROVING COLLEGE READINESS, PURSUIT, ACCESS, AND PERSISTENCE OF
DISADVANTAGED STUDENTS
92
Table 3.
PCSST School Enrollment and Waiting List in 2011-2012
Grade
Level
Max
Enrollment
October 15th
Enrollment
Final
Enrollment
Count
Waiting
List
K 80 80 79 164
Grade 1 80 80 80 90
Grade 2 80 80 79 68
Grade 3 80 80 78 73
Grade 4 80 80 79 66
Grade 5 80 80 78 106
Grade 6 80 84 83 116
Grade 7 84 84 80 119
Grade 8 84 84 81 70
Grade 9 84 84 80 166
Grade 10 84 84 82 63
Grade 11 84 82 80 29
Grade 12 84 82 80 7
In order to explore the trends in basic demographics of PCSST graduated students and
CRASP participation from 2009 to 2013, Table 4 and Table 5 were prepared. Table 4 presents
the results of the one way ANOVA, which was used to test for differences between demographic
information of PCSST CRASP participants and non-CRASP participants prior to the study.
According to the one way ANOVA test results, as can be seen in Table 4, there were no
statistically significant differences between the CRASP students and the comparison group, who
never participated in CRASP, on Hispanic, African American, Gender, Transfer In, Lunch Type,
Parent Education, Initial Grade Point Average, Special Education and English second language
learners at the alpha = .05 level (p-value >.05).
Table 4.
ANOVA of Participants’ Demographic Information by CRASP Participation
Variables Participants N Mean SD Significance
Black 0 77 .506 .503

IMPROVING COLLEGE READINESS, PURSUIT, ACCESS, AND PERSISTENCE OF
DISADVANTAGED STUDENTS
93
1 307 .449 .498 .371
Total 384 .460 .499
Hispanic 0 77 .389 .490
1 307 .423 .494 .591
Total 384 .416 .493
Parent
Education
0 77 .220 .417
1 307 .210 .409 .863
Total 384 .210 .410
Transfer In 0 77 .155 .365
1 307 .149 .357 .896
Total 384 .151 .358
Gender 0 77 .498 .057
1 307 .489 .028 .547
Total 384 .490 .025
LunchType 0 77 .476 .054
1 307 .441 .025 .197
Total 384 .449 .023
SpecialESL 0 77 .270 .031
1 307 .334 .019 .252
Total 384 .322 .016
Initial_GPA 0 77 .793 .090
1 307 .851 .048 .085
Total 384 .842 .043
In addition, Table 5 has also been prepared to show how participants’ basic demographics
and initial GPAs are changed by years spent in CRASP. In reference to Table 5, in terms of years
spent in CRASP, there are statistically significant differences between the students who have
various years of CRASP involvement and the comparison group who did not participate in
CRASP on initial GPA, transfer-in and lunch type. As indicated by Table 5, even though the
demographics mean scores of the CRASP participants and non-participant PCSST students are
slightly different from each other on special education, ESL, gender, parent education, and race,
these differences between the groups are not statistically significant.

IMPROVING COLLEGE READINESS, PURSUIT, ACCESS, AND PERSISTENCE OF
DISADVANTAGED STUDENTS
94
Table 5.
ANOVA Table of Participants’ Demographic Information by Years Spent in CRASP
Variables Years in
CRASP
N Mean SD Significance
Black 0 77 .504 .502
1 90 .444 .499
2 83 .505 .503 .841
3 71 .446 .500
4 63 .438 .500
Total 384 .473 .500
Hispanic 0 77 .336 .474
1 90 .407 .494 .919
2 83 .404 .493
3 71 .419 .497
4 63 .453 .502
Total 384 .395 .489
Parent
Education
0 77 .22 .417
1 90 .18 .384
2 83 .27 .444 .195
3 71 .27 .446
4 63 .13 .336
Total 384 .21 .410
Initial GPA 0 77 2.37 .793
1 90 2.73 .901
2 83 2.44 .874 .002*
3 71 2.70 .759
4 63 2.30 .773
Total 384 2.52 .842
Special/ESL 0 77 .08 .270
1 90 .13 .342
2 83 .12 .328 .828
3 71 .13 .335
4 63 .13 .336
Total 384 .12 .322
(table continues)
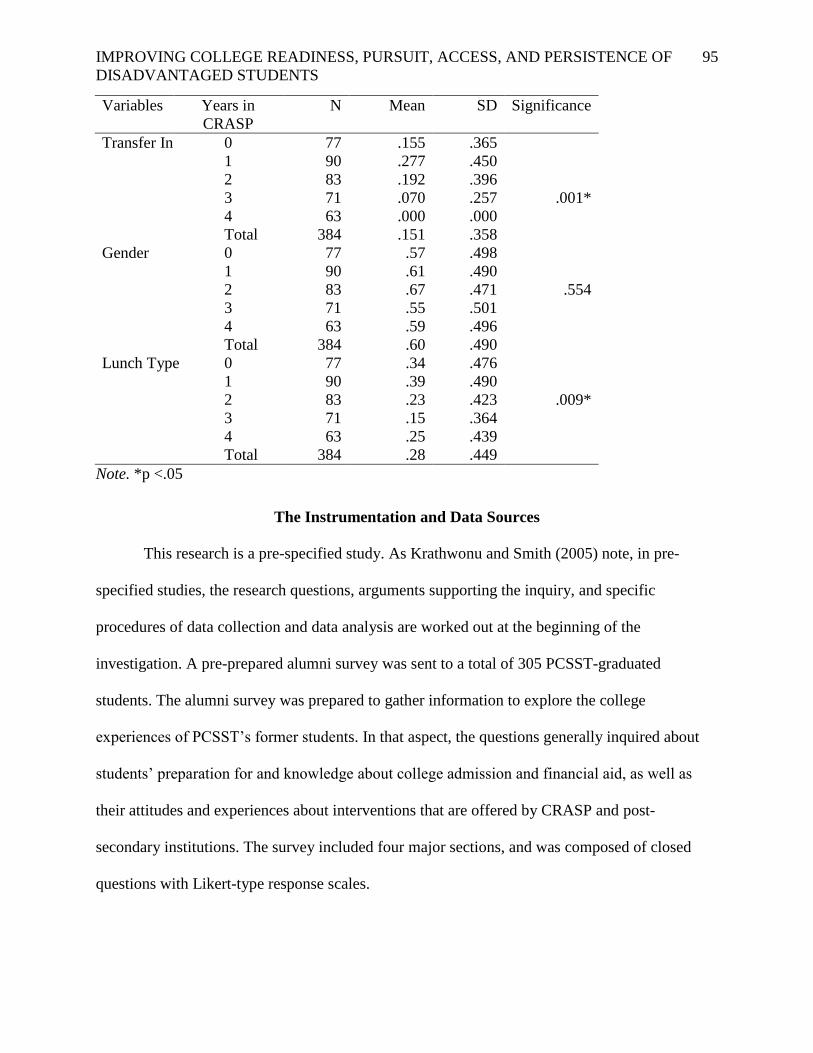
IMPROVING COLLEGE READINESS, PURSUIT, ACCESS, AND PERSISTENCE OF
DISADVANTAGED STUDENTS
95
Variables Years in
CRASP
N Mean SD Significance
Transfer In 0 77 .155 .365
1 90 .277 .450
2 83 .192 .396
3 71 .070 .257 .001*
4 63 .000 .000
Total 384 .151 .358
Gender 0 77 .57 .498
1 90 .61 .490
2 83 .67 .471 .554
3 71 .55 .501
4 63 .59 .496
Total 384 .60 .490
Lunch Type 0 77 .34 .476
1 90 .39 .490
2 83 .23 .423 .009*
3 71 .15 .364
4 63 .25 .439
Total 384 .28 .449
Note. *p <.05
The Instrumentation and Data Sources
This research is a pre-specified study. As Krathwonu and Smith (2005) note, in pre-
specified studies, the research questions, arguments supporting the inquiry, and specific
procedures of data collection and data analysis are worked out at the beginning of the
investigation. A pre-prepared alumni survey was sent to a total of 305 PCSST-graduated
students. The alumni survey was prepared to gather information to explore the college
experiences of PCSST’s former students. In that aspect, the questions generally inquired about
students’ preparation for and knowledge about college admission and financial aid, as well as
their attitudes and experiences about interventions that are offered by CRASP and post-
secondary institutions. The survey included four major sections, and was composed of closed
questions with Likert-type response scales.
IMPROVING COLLEGE READINESS, PURSUIT, ACCESS, AND PERSISTENCE OF
DISADVANTAGED STUDENTS
96
The first section, “Background Information and College Data”, includes the following
items: (1) name; (2) high school graduation year; (3) enrollment status in
degree/certificate/diploma program; (4) parent's highest level of school completed; (5) number of
college applications; and (6) second-year college enrollment.
The second section of the survey was designed to explore the impact of high school
experiences on getting into and achieving in college. All 19 academic and counseling programs
and interventions in PCSST that may make a possible contribution to students’ college goals are
listed in section two. Students were asked to indicate if they participated in these programs when
they were in high school.
The third section of the survey was designed to explore the challenges that students face
while attending college. This section contains a list of student and institutional factors that may
affect students’ college success. In this section, students were asked to indicate to what degree
each factor affected their college success. While the researcher was constructing the items in this
section, he reviewed and utilized the PCSST alumni’s input that was received and collected over
the last three years.
In addition, the researcher reviewed the findings of past college retention research studies
and found that the majority of items in this section are similar to those examined in previous
studies. Eight of the 19 items were very similar to the survey items that are used in the ACT
(2010) “What Works in Student Retention?” that was administered by ACT (2010). After
students rate the items, they were also asked whether or not they dropped out of college. If they
dropped out of college, they were asked to list the reasons. Finally, the last section of the survey
was designed to explore the impact of college experiences on students’ college retention and

IMPROVING COLLEGE READINESS, PURSUIT, ACCESS, AND PERSISTENCE OF
DISADVANTAGED STUDENTS
97
success. In this section, the series of programs and interventions that are possibly offered by their
colleges are listed.
In addition to the survey responses, other data sources were also used. For example, the
researcher used the computerized PCSST student information system, which contains each
student’s demographic information, contact information, GPA, discipline reports, daily
attendance rate, lunch type situation, test results, and report cards. Second, the official College
Board SAT results were used as another data source. Third, the researcher used the “Student
Tracker”, a web-based program designed by National Clearinghouse to help high schools track
their alumni’s college enrollment data. Fourth, NJ Standards Measurement and Resource for
Teaching (NJ SMART), a comprehensive statewide longitudinal data warehouse, was also used
in this study. Finally, the researcher’s individual counseling logs, as well as alumni follow-up
data, were utilized. Table 6 shows how the various data sources were used to gather data to
address the research questions.
Table 6.
Data Sources and the Number with Data
PCSST
Graduated
Cohort
Final
GPA
Data
SAT
Data
College
App Data
1st Year
College
Enroll
2nd
Year
College
Enroll
FAFSA Data
2009 77 77 69 77 77 69
2010 79 79 79 79 79 79
2011 75 75 75 75 75 75
2012 74 74 74 74 74 74
2013 79 79 79 79 79 79
Total 384 384 375 384 384 375
Note. Final GPA data collected from archived school data. SAT data collected from College
Board and NJ SMART. Self-Reported college application data collected from survey/counselor
log/alumni follow-up. First and second year college enrollment data collected from
survey/student tracker program/alumni follow-up. Self-Reported FAFSA data collected from
survey/counselors logs/alumni follow-up.

IMPROVING COLLEGE READINESS, PURSUIT, ACCESS, AND PERSISTENCE OF
DISADVANTAGED STUDENTS
98
Data Collection
The proposed survey was approved by the Rutgers University Institutional Review Board
in July 2012, and it contains minimal risk to the participants. The researcher began to administer
the survey in August 2012. The researcher followed certain procedures to provide the
participants with the least amount of risk possible, and maintained their comfort throughout the
completion of the alumni survey. For example, it was the participants’ decision whether or not
they would like to take part in this study. If they chose to participate, they were able to withdraw
from the study at any time during the research process. Even though the survey does not pose
any psychological, legal, social, or physical harm towards the participants, an electronic letter of
consent was attached to the survey and survey participants were required to electronically
indicate that they had read and consented to participate prior to responding to any further
questions.
The online consent form specified the purpose of the dissertation study, described the
ways in which their contributed information would be used for PCSST programs, and indicated
that participants had the option to withdraw from the study at any time or if they felt any
discomfort. Furthermore, if survey items were not applicable to participants, they were directed
to skip the item or mark the “Does Not Apply” option. Furthermore, if any item requested
information that they did not wish to provide, they were free to omit it.
During the data collection process, a combination of both survey and archived school
data were collected for this investigation. In particular, a mixed-mode strategy that includes
online and in-person was conducted. After the researcher finalized the survey items based on the
pilot study and peer reviews, the survey was prepared in the online Survey Monkey system.
Emails that included the survey link were sent to all PCSST alumni requesting them to complete
the online PCSST Alumni survey. Reminder messages were sent in September, October,

IMPROVING COLLEGE READINESS, PURSUIT, ACCESS, AND PERSISTENCE OF
DISADVANTAGED STUDENTS
99
November, and again in December 2012. Besides group and individual emails, reminder
messages were also sent through a Facebook account.
During the data collection process, PCSST alumni coordinators from different cohorts
helped the researcher reach out and recruit the PCSST students to complete the alumni survey.
Of the email messages sent to PCSST alumni, around 20 messages were returned because the
message was undeliverable. It is assumed that approximately 280 alumni received the online
survey link. In order to increase the number of participants, the researcher invited all former
students to a PCSST Alumni Dinner and Network Event on Wednesday, December 19th
from
5:30pm to 7:30pm. Consequently, a total of 56% of PCSST alumni (171 out of 305) successfully
completed online survey. Table 7 shows the exact number of students in each cohort and also
gives numbers of survey takers from each cohort. The survey was not sent to the class of 2013
because they were still high school students in the fall of 2013.
Table 7.
Survey Takers by Cohort
Cohort # of Students # of Survey Takers
2009 77 44
2010 79 43
2011 75 41
2012 74 43
Total 305 171
After all surveys were collected and coded, results were stored in the alumni tracking
folder that is not available to others. Entry to the survey results requires a passcode. The
information the students supplied on this questionnaire was kept confidential. The participants’
names were requested for research purposes only, and will not be listed on any report. Therefore,
the researcher assigned a specific identification number to each participant. Moreover,

IMPROVING COLLEGE READINESS, PURSUIT, ACCESS, AND PERSISTENCE OF
DISADVANTAGED STUDENTS
100
pseudonyms will be used for all participants in any documents made public, for example articles,
research papers, or research presentations.
During the data collection process, the researcher identified discrepancies in participants’
SAT scores. In order to explain what causes the discrepancy in SAT scores, the researcher
consulted with NJ SMART officials. It is noted that NJ SMART reports students’ most recent
SAT scores in data warehouse. However, in this study, students’ highest SAT scores from each
SAT section are reported. This is because in terms of college admission and financial aid
decision criteria, colleges look at the students' top SAT score. Thus, the researcher did all the
SAT analyses twice to see the differences between highest SAT scores and latest SAT scores.
The second discrepancy noted in NJ SMART college enrollment data was taken from the
National Clearinghouse Student Tracker program. After the researcher consulted with NJ
SMART officials, it was noticed that students who have no social security number are not
included in NJ SMART college enrollment data. It is also noted that students who attend
vocational, technical, career and military schools are not included in the NJ SMART report.
Thus, in order to reach out to students who are not included in the National Clearinghouse
Student Tracker program, data from the PCSST alumni follow-up program was utilized in this
study.
Data Analysis
In order to analyze the quantified data of five different cohorts from 2009 to 2013, the
computer-based SPSS statistics program was used. In order to utilize both descriptive and
inferential statistics, the following steps were taken. First, the closed-ended questionnaires’
responses were numerically coded, and a data set was created in an excel sheet to use the SPSS.
Second, the collected data was compiled according to cohort year. Coded under the student ID
IMPROVING COLLEGE READINESS, PURSUIT, ACCESS, AND PERSISTENCE OF
DISADVANTAGED STUDENTS
101
number, the students’ GPA’s and SAT scores were linked to each other from the school
database. Third, the students’ college enrollment, readiness, and persistence data, as well as
achievement data in high school, were systematically added to the data set.
For this study, after the coding process was completed, the researcher used the
descriptive analysis that includes frequencies (sample, independent and dependent variables), the
measures of central tendency (mean, median, mode), and measures of variability (variance and
standard deviation) as the first step in the data analysis, in order to explore and summarize the
critical characteristics of the predictor variables,. Following the descriptive analysis, t-tests,
crosstabs analysis, and correlational analysis were used to determine if there were significant
differences (p < .05) between various aspects of students’ college readiness and college success
as it relates to CRASP activities. In addition to descriptive analyses, both binary logistic
regression and multiple linear regression analyses were administered using the SPSS program to
examine the effect of CRASP activities on former PCSST students’ college readiness, pursuit,
access, and persistence.
To determine the extent to which the various independent variables (high school initial
GPA, gender, race, lunch type, special education, ESL education, parent education, CRASP
participation, years spent in CRASP) related to the dependent variable (SAT participation rate,
SAT cumulative score, FAFSA completion rate, and college enrollment and retention rates), as
recommended by Green and Salkind (2008), the researcher particularly used the linear regression
analysis, binary logistic regression, and stepwise to analyze how each predictor independent
variable is associated with the dependent variable.
Variables
This section explains the variables used within the study.

IMPROVING COLLEGE READINESS, PURSUIT, ACCESS, AND PERSISTENCE OF
DISADVANTAGED STUDENTS
102
Dependent Variables
As noted in the introduction, this study has been guided by three research questions. The
answers and findings of these research questions will help PCSST administrators, school
counselors, teachers, and other key stakeholders understand how well they are supporting their
students’ college readiness, pursuit, enrollment, and persistence. The first cohort (class of 2009)
did not participate in CRASP. Each succeeding cohort had one additional year of CRASP.
Therefore, aligned with the first research question, the following dependent variables were
identified to compare the college experiences and outcomes of PCSST students who participated
in CRASP for different lengths of time (from zero to four years). Table 8 visualizes the domains,
measures, nature of dependent variable, and coding used to analyze the estimated impact of the
program.
Independent Variables
The independent variables that have possible implications on students’ college readiness,
persistence, and attainment are summarized in Table 9, which visualizes the
independent variables and coding.
The researcher is also interested in knowing more about what parts of students’ high
school and college experiences are most critical to help them stay in college and achieve in
college. In this aspect, the researcher explored the type of interventions or prevention programs
in which students reported they participated and how participation in this program affected their
college readiness, access, and persistence. Table 10 summarizes the CRASP interventions that
can be considered dependent variables influenced.
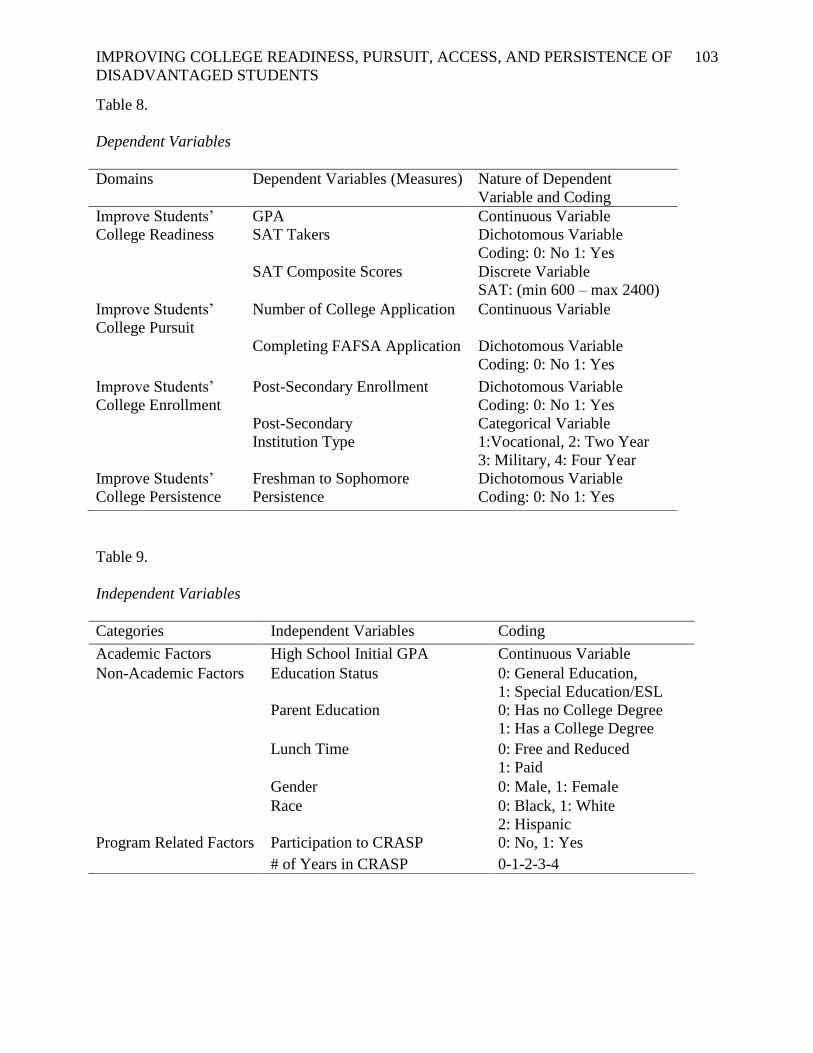
IMPROVING COLLEGE READINESS, PURSUIT, ACCESS, AND PERSISTENCE OF
DISADVANTAGED STUDENTS
103
Table 8.
Dependent Variables
Domains Dependent Variables (Measures) Nature of Dependent
Variable and Coding
Improve Students’
College Readiness
GPA Continuous Variable
SAT Takers Dichotomous Variable
Coding: 0: No 1: Yes
SAT Composite Scores Discrete Variable
SAT: (min 600 – max 2400)
Improve Students’
College Pursuit
Number of College Application Continuous Variable
Completing FAFSA Application Dichotomous Variable
Coding: 0: No 1: Yes
Improve Students’
College Enrollment
Post-Secondary Enrollment Dichotomous Variable
Coding: 0: No 1: Yes
Post-Secondary
Institution Type
Categorical Variable
1:Vocational, 2: Two Year
3: Military, 4: Four Year
Improve Students’
College Persistence
Freshman to Sophomore
Persistence
Dichotomous Variable
Coding: 0: No 1: Yes
Table 9.
Independent Variables
Categories Independent Variables Coding
Academic Factors High School Initial GPA Continuous Variable
Non-Academic Factors Education Status 0: General Education,
1: Special Education/ESL
Parent Education 0: Has no College Degree
1: Has a College Degree
Lunch Time 0: Free and Reduced
1: Paid
Gender 0: Male, 1: Female
Race 0: Black, 1: White
2: Hispanic
Program Related Factors Participation to CRASP 0: No, 1: Yes
# of Years in CRASP 0-1-2-3-4

IMPROVING COLLEGE READINESS, PURSUIT, ACCESS, AND PERSISTENCE OF
DISADVANTAGED STUDENTS
104
Table 10.
CRASP Components
Individual Student Learning Plan
College Dual Enrollment Program
After School Tutoring
Peer Tutoring
SAT Prep Program
SAT Elective Courses (Credit)
Accuplacer Test Preparation
Honor Level Courses
Individual Counseling Sessions
Classroom Presentations
College Fairs and College Trips
Parent and Counselor Meetings
Recognition/Rewards Program
Career Day
Group Counseling Sessions
One on One FAFSA Application
The Home Visitations
College and SAT Fee Waivers
Instant Decision Days
The Role of the Researcher
As the chair of the school counseling department, and a professional school counselor,
the researcher took an active role during the initiation and implementation of the study. The
participants were former students of the researcher. The researcher is well aware that this active
involvement is a potential threat to validity. Moreover, he is also aware that this active
involvement of the researcher could present a conflict of interest since individual school
counseling activities encourage building ongoing and caring relationships between the school
counselors and students. Therefore, participants may have wanted to respond and share their
CRASP experience in a way that would positively highlight CRASP, when their true CRASP
experience might have been negative or differed from what they reported.

IMPROVING COLLEGE READINESS, PURSUIT, ACCESS, AND PERSISTENCE OF
DISADVANTAGED STUDENTS
105
As recommended by Lawson (2011), in order to alleviate this potential conflict of
interest, the researcher clearly explained to his former students that their honest responses not
only aid the school, but would also be appreciated by the researcher. This information was
provided in the survey consent form. There was no incentive attached to any response.
Furthermore, the researcher used Survey Monkey to conduct the surveys online, allowing
participants to share their honest CRASP experience without any pressure. However, it was not
anonymous.
Reliability and Validity
Reliability is a measure of how reproducible the survey data is (Litwin, 1995). Therefore,
it is important to address the issue of reliability and examine strategies that have been developed
to maximize reliability. The validity of a measure is the extent to which it measures what it is
intended to measure (Rossi et al., 2004). In that aspect, the researcher focused on ensuring the
validity and reliability of the instrument. The list of strategies to ensure the reliability and
validity of the study is provided below.
First, the pilot study helped the researcher identify deficiencies. During the pilot study,
the input and peer review of colleagues obtained the reliability of the instrument. Furthermore,
the researcher was very careful, sensitive, and objective while collecting and reporting the
findings. The researcher maintained an active corroboration on the interpretation of collected
information with the key stakeholders and intended users, in order to explore what students see
and feel about the implementation of the program. In particular, the researcher consulted with
other counselors in order to establish validity through collaborative judgment. In other words, he
spent time with his colleagues identifying problems and concerns with the instrumentation.
During the pilot study, the evaluator also initiated and maintained an active corroboration on the

IMPROVING COLLEGE READINESS, PURSUIT, ACCESS, AND PERSISTENCE OF
DISADVANTAGED STUDENTS
106
interpretation of data with the alumni to obtain participants’ input in person and comprehend
what they see and feel about their preparedness for college.
Overall, it has been noted that the study includes and utilizes measures such as SAT, high
school GPA, FAFSA, and college applications, which are identified as predictors of college
admission and success (ACT, 2010) and the College Board (2011). Finally, to ensure accuracy in
reporting facts, and to crosscheck the responses of the participants, the researcher utilized a
variety of sources. For example, in order to validate the accuracy of the survey findings and
obtain a more complete picture of the study, the researcher used multiple data sources that
involved: (1) the school’s computerized data management system, (2) the College Board official
reports, (3) NJ SMART student and data reports, (4) National Clearinghouse Student Tracker
Program reports, (5) peer input, and (6) logs of individual counseling sessions.

IMPROVING COLLEGE READINESS, PURSUIT, ACCESS, AND PERSISTENCE OF
DISADVANTAGED STUDENTS
107
CHAPTER FIVE: FINDINGS
The findings of this study are categorized into three major areas. First, the researcher
investigates how participation in CRASP affects PCSST students’ college readiness, pursuit,
enrollment, and persistence. Second, the researcher indicates which specific components of
CRASP are most effective in improving disadvantaged students’ college readiness, pursuit,
enrollment, and persistence. Finally, in the third part, the researchers explores the challenges that
student face in their first year of college. Overall, to explore how student outcomes are
influenced by CRASP, the researchers developed four visual models to aid the conceptualization.
Model 1: Effects of CRASP on College Readiness
Figure 9. College readiness.

IMPROVING COLLEGE READINESS, PURSUIT, ACCESS, AND PERSISTENCE OF
DISADVANTAGED STUDENTS
108
In reference to previous studies, good academic standing (high school cumulative GPA)
and high scores from college entrance exams (SAT and ACT) are considered the strongest
indicators of college readiness (Adelman, 2006; College Board, 2011). Armed with the findings
of previous research, this study uses high school cumulative GPA and SAT scores as the
measures of college readiness. Therefore, as shown in Figure 9, the researcher used both
descriptive statistics and regression techniques to investigate how students’ GPA, SAT scores,
and SAT taking rate are associated with CRASP participation from 2009 to 2013.
Effect of CRASP on SAT Taking
First, in order to investigate how students’ official SAT taking rate is associated with
CRASP participation, the researcher prepared Table 11, which shows the SAT taking trends by
CRASP participation. As reported in Table 11, without controlling for any other variables or
testing for statistical significance, students’ SAT taking rate is positively related with CRASP
participation. In particular, Table 11 indicates that students who participated in CRASP are more
likely to take the SAT compared to students who never participated in the CRASP program. On
average, while 77% of CRASP participants took the SAT, only 40% of non-participating
students took the SAT before they graduated from high school.
Table 11.
SAT Takers by CRASP Participation
Years in CRASP N Mean SD
No 77 0.4 0.494
Yes 307 0.77 0.422
Total 384 0.7 0.461
As also noted in Table 12, the number of years spent in CRASP is associated with
increasing the percentage of SAT takers. Students who stayed in CRASP for a longer period of
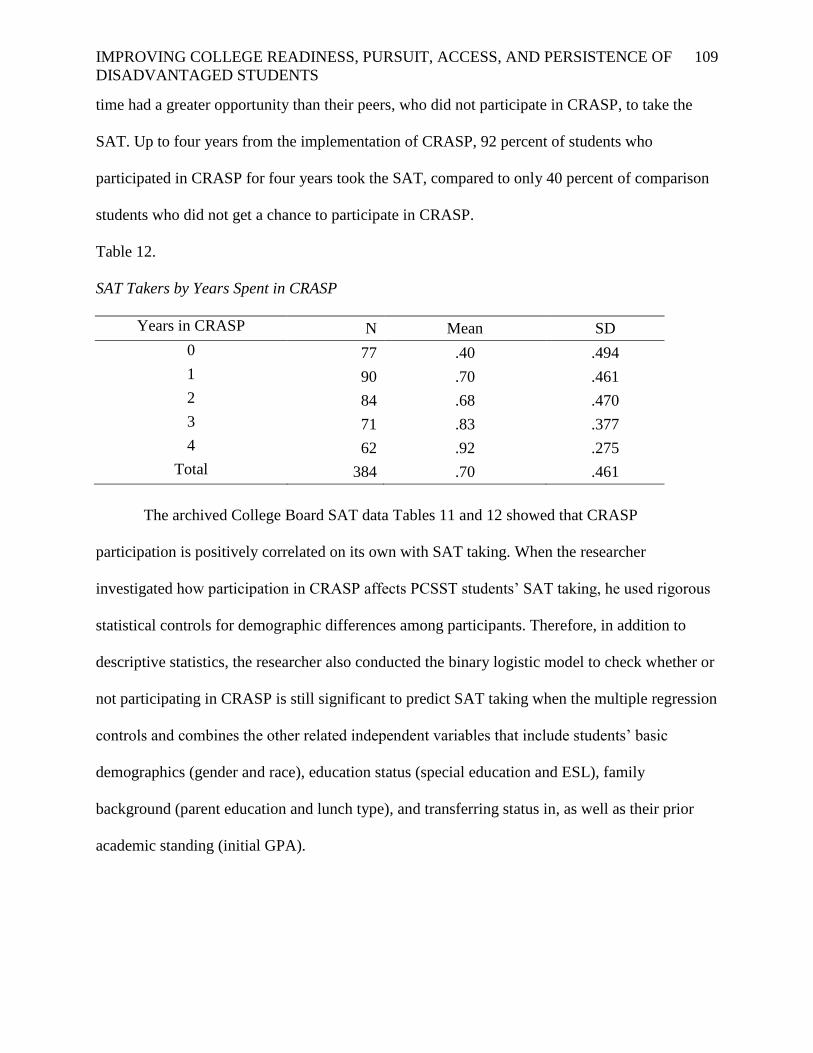
IMPROVING COLLEGE READINESS, PURSUIT, ACCESS, AND PERSISTENCE OF
DISADVANTAGED STUDENTS
109
time had a greater opportunity than their peers, who did not participate in CRASP, to take the
SAT. Up to four years from the implementation of CRASP, 92 percent of students who
participated in CRASP for four years took the SAT, compared to only 40 percent of comparison
students who did not get a chance to participate in CRASP.
Table 12.
SAT Takers by Years Spent in CRASP
Years in CRASP N Mean SD
0 77 .40 .494
1 90 .70 .461
2 84 .68 .470
3 71 .83 .377
4 62 .92 .275
Total 384 .70 .461
The archived College Board SAT data Tables 11 and 12 showed that CRASP
participation is positively correlated on its own with SAT taking. When the researcher
investigated how participation in CRASP affects PCSST students’ SAT taking, he used rigorous
statistical controls for demographic differences among participants. Therefore, in addition to
descriptive statistics, the researcher also conducted the binary logistic model to check whether or
not participating in CRASP is still significant to predict SAT taking when the multiple regression
controls and combines the other related independent variables that include students’ basic
demographics (gender and race), education status (special education and ESL), family
background (parent education and lunch type), and transferring status in, as well as their prior
academic standing (initial GPA).

IMPROVING COLLEGE READINESS, PURSUIT, ACCESS, AND PERSISTENCE OF
DISADVANTAGED STUDENTS
110
Table 13.
Summary of Binary Logistic Regression Analysis for CRASP Participation and Variables
Predicting the SAT Participation (N=384)
Variables B S.E. Wald Df Sig. Exp(B)
Participate CRASP 2.009 .332 36.697 1 .000* 7.455
Parent Education 2.148 .491 19.171 1 .000* 8.569
Initial GPA .848 .187 20.635 1 .000* 2.334
Gender -.096 .275 .121 1 .728 .909
Transfer In -1.146 .349 10.747 1 .001* .318
Lunch Type -.058 .309 .036 1 .850 .943
Special ESL -1.420 .400 12.588 1 .000* .242
Black -.950 .549 2.998 1 .083 .387
Hispanic -.307 .552 .310 1 .578 .736
Constant -1.981 .791 6.277 1 .012 .138
Note. R2=.395 and *p <.05
Before the researcher interpreted the impact of variables on SAT participation, the
assumptions for the regression analysis were checked. First, the Omnibus Tests of Model
coefficient was checked, and it is noted that the model is statistically significant at p <.005. The
null hypothesis “there is no difference between the model with only a constant and the model
with independent variables” was rejected. Therefore, the existence of a relationship between the
independent variables and the dependent variable (SAT Taking) was supported. Second, the
researcher reported the overall accuracy rate in the classification table. The overall accuracy rate
of the model computed by SPSS is 78.1%. When block 0 and block 1 are compared, it is also
reported that the accuracy rate is increased from 69.5% to 77.6%. Third, the researcher reviewed
the model summary, and it is noted that according to the Nagelkerke R Square, 39.5% of the
variability in the SAT takers is associated with selected predictor independent variables.
Referring back to regression Table 13, it is reported that out of nine predictor variables,
five variables were considered as significant at .05 p-value (P Initial GPA = .001, P CRASP Participation =
.001, P Parent Education= .001, P Transfer in= .001 and P Special Ed/ESL= .001). While CRASP participation,

IMPROVING COLLEGE READINESS, PURSUIT, ACCESS, AND PERSISTENCE OF
DISADVANTAGED STUDENTS
111
initial GPA, and parent education were positively associated with SAT taking, it is noted that
there was a statistically significant inverse relationship between SAT taking and transfer-in,
special education, and ESL.
In addition to the logistics regression with CRASP, the researcher reports a second
logistic regression that controls other independent variables and years spent in CRASP.
Referring back to regression Table 13, it is reported that out of nine predictor variables, four
variables were considered significant at .05 p-value (P Initial GPA = .001, P Years in CRASP Participation =
.001, P Parent Education= .001, and P Special Ed/ESL= .001). It is noted that according to the Nagelkerke
R Square, 42.2% of the variability in the SAT takers is associated with selected predictor
independent variables. The effect size of .735 implies that students who stay in CRASP for a
longer amount of time are more likely to take the SAT. Therefore, it is safe to report that the
number of years spent in CRASP has a statistically significant effect on SAT taking when the
multiple regression controls and combines the other related independent variables that include
students’ basic demographics (gender and race), education status (special education and ESL),
family background (parent education and lunch type), and transferring status, as well as their
prior academic standing (initial GPA).

IMPROVING COLLEGE READINESS, PURSUIT, ACCESS, AND PERSISTENCE OF
DISADVANTAGED STUDENTS
112
Table 14.
Summary of Binary Logistic Regression Analysis for Years in CRASP and Variables Predicting
the SAT Participation (N=384)
Variables B S.E. Wald Df Sig. Exp(B)
ParentEducation 2.030 .478 18.076 1 .000* 7.615
Initial GPA .933 .192 23.643 1 .000* 2.543
Gender -.054 .280 .037 1 .848 .948
Transfer In -.603 .345 3.064 1 .080 .547
Lunch Type .111 .314 .126 1 .723 1.118
Special ESL -1.379 .414 11.074 1 .001* .252
Black -1.006 .563 3.200 1 .074 .366
Hispanic -.419 .561 .558 1 .455 .657
How ManyYears .735 .113 42.059 1 .000* 2.086
Constant -1.972 .804 6.017 1 .014 .139
Note. R2=.422 and *p <.05
The binary logistic regression analyses indicated both CRASP participation and the
number of years spent in CRASP are positively associated with SAT taking. However, as this
research study attempts to determine the extent to which specific CRASP interventions help
students the most to take the official College Board SAT, the first two regression models did not
provide enough information regarding the specific effect size of each CRASP component.
Therefore, the researcher conducted the stepwise binary logistic regression model that included
all components of the CRASP and other predictor variables that have the potential to make a
contribution to SAT taking.

IMPROVING COLLEGE READINESS, PURSUIT, ACCESS, AND PERSISTENCE OF
DISADVANTAGED STUDENTS
113
Table 15.
Summary of Stepwise Binary Logistic Regression Analysis for Variables Predicting the SAT
Participation (N=171)
Variable B S.E. Wald df Sig. Exp(B)
ParentEducation 1.836 .638 8.292 1 .004* 6.270
Initial_GPA .843 .282 8.900 1 .003* 2.322
Individual_Learning_Plan 1.900 .510 13.875 1 .000* 6.684
Instant_Decision_Days .879 .453 3.766 1 .052 2.407
HomeVisits 1.304 .546 5.700 1 .017* 3.684
Constant -3.119 .781 15.944 1 .000 .044
Note. R2=.490
In the stepwise binary logistic regression test, it is noted that according to the Nagelkerke
R Square, 49% of the variability in SAT takers is associated with selected predictor independent
variables. The researcher interpreted the coefficient table to identify the significant variables that
are associated with SAT taking. Referring back to stepwise regression Table 15, it is reported
that out of twenty seven predictor variables, only five variables were considered significant at .05
p-value (P Individual Learning Plan = .001, P Initial GPA = .003, P Home visits = .017, and P Parent Education=
.004). Therefore, CRASP components that are individual learning plans and home visits have a
significant effect on SAT taking when the stepwise regression controls and combines the other
related independent variables that include students’ basic demographics, education status, family
background, and transferring status, as well as their prior academic standing.
Effect of CRASP on SAT Composite Scores
The SAT score is considered a strong indicator of college readiness (College Board,
2012). To investigate how students’ SAT composite scores are associated with CRASP
participation, the researcher prepared Table 16, which shows how students’ SAT composite
scores have been changed by CRASP participation.

IMPROVING COLLEGE READINESS, PURSUIT, ACCESS, AND PERSISTENCE OF
DISADVANTAGED STUDENTS
114
Table 16.
SAT Composite Scores by CRASP Participation
CRASP Participation # of Students # of SAT Takers Mean SD
No 77 31 1209.03 263.393
Yes 307 236 1234.83 230.242
Total 384 267 1231.84 233.937
As reported in Table 10, the average SAT score of CRASP students is higher than
students who did not participated in CRASP. In other words, CRASP students performed slightly
better than non-CRASP students on their SAT scores.
Table 17.
SAT Composite Scores by Years Spent in CRASP
Years in CRASP
N
Mean Std. Deviation
0 31 1209.03 263.393
1 63 1209.84 244.115
2 57 1195.79 223.926
3 59 1283.56 205.324
4 57 1251.05 240.109
Total 267 1231.84 233.937
The researcher also prepared Table 17, which shows how students’ SAT composite
scores have been changed by years spent in CRASP. The data suggests some increase in SAT
composite scores from the first two to the second two cohorts of CRASP students. The average
SAT composite score of students who participated in CRASP for one or two years is 1203.1. The
average SAT composite score of students who participated in CRASP for three or four years is
1267.6.
When the researcher analyzed achieved SAT data, he realized that there were some
discrepancies between official College Board SAT data and the State report card. The SAT

IMPROVING COLLEGE READINESS, PURSUIT, ACCESS, AND PERSISTENCE OF
DISADVANTAGED STUDENTS
115
average composite score in the school report card does not seem to be exactly the same as the
one that is reported in this study. Therefore, the researcher contacted NJ SMART officials to
explain discrepancies between archived College Board SAT data and State report card data. NJ
SMART officials informed the researcher that State report card only reports the most recent
score for students. However, when making decisions in college admission and financial aid, the
majority of colleges look at the students' highest SAT scores from each section instead of the
most recent score. That is why students tend to take the SAT multiple times to improve their
SAT scores. The implications for this study are to do the SAT analyses twice to explore the
difference between the full SAT composite score and the composite SAT score from the last time
the test was taken.
Table 18.
SAT composite scores from the last time the test was taken by CRASP participation
CRASP
Participation
# of Students # of SAT Takers Mean SD
No 77 31 1167.42 273.593
Yes 307 236 1187.03 224.351
Total 384 267 1184.76 230.107
Table 18 shows that instead of full SAT composite score, when we report SAT composite
scores from the last time the test, CRASP students’ SAT average composite scores decreased
from 1234.76 to 1187.03. Similarly, Non-CRASP students SAT average composite scores
decreased from 1209.03 to 1167.42. In other words, the average composite SAT score of both
CRASP and non-CRASP participants decreased 47.73 and 41.61, respectively.
The descriptive data table showed the average SAT composite scores of CRAP and non-
CRASP participants. However, a true estimate of CRASP’s impact must go beyond the
descriptive statistics and be grounded in inferential statistics that control for other predictor
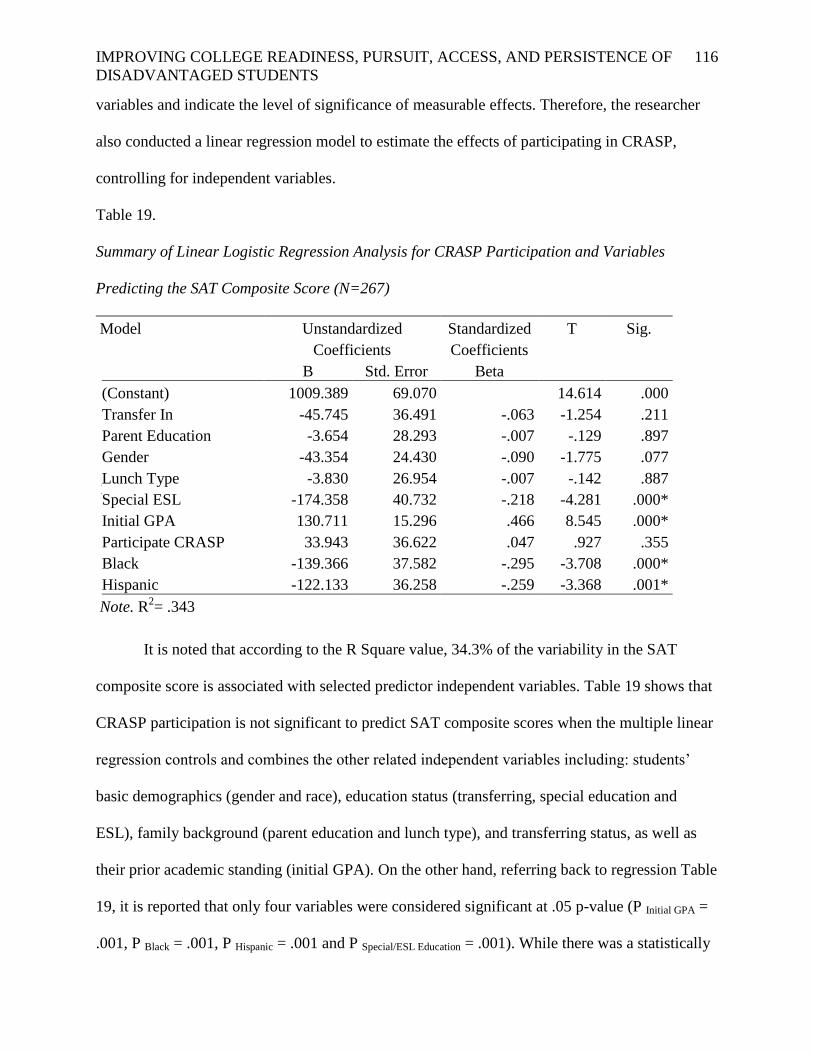
IMPROVING COLLEGE READINESS, PURSUIT, ACCESS, AND PERSISTENCE OF
DISADVANTAGED STUDENTS
116
variables and indicate the level of significance of measurable effects. Therefore, the researcher
also conducted a linear regression model to estimate the effects of participating in CRASP,
controlling for independent variables.
Table 19.
Summary of Linear Logistic Regression Analysis for CRASP Participation and Variables
Predicting the SAT Composite Score (N=267)
Model Unstandardized
Coefficients
Standardized
Coefficients
T Sig.
B Std. Error Beta
1
(Constant) 1009.389 69.070 14.614 .000
Transfer In -45.745 36.491 -.063 -1.254 .211
Parent Education -3.654 28.293 -.007 -.129 .897
Gender -43.354 24.430 -.090 -1.775 .077
Lunch Type -3.830 26.954 -.007 -.142 .887
Special ESL -174.358 40.732 -.218 -4.281 .000*
Initial GPA 130.711 15.296 .466 8.545 .000*
Participate CRASP 33.943 36.622 .047 .927 .355
Black -139.366 37.582 -.295 -3.708 .000*
Hispanic -122.133 36.258 -.259 -3.368 .001*
Note. R2= .343
It is noted that according to the R Square value, 34.3% of the variability in the SAT
composite score is associated with selected predictor independent variables. Table 19 shows that
CRASP participation is not significant to predict SAT composite scores when the multiple linear
regression controls and combines the other related independent variables including: students’
basic demographics (gender and race), education status (transferring, special education and
ESL), family background (parent education and lunch type), and transferring status, as well as
their prior academic standing (initial GPA). On the other hand, referring back to regression Table
19, it is reported that only four variables were considered significant at .05 p-value (P Initial GPA =
.001, P Black = .001, P Hispanic = .001 and P Special/ESL Education = .001). While there was a statistically

IMPROVING COLLEGE READINESS, PURSUIT, ACCESS, AND PERSISTENCE OF
DISADVANTAGED STUDENTS
117
significant positive relationship between SAT composite score and initial GPA, it is noted that
there were a statistically significant inverse relationship between SAT composite score and
Black, Hispanic, special education, and ESL.
The researcher also reports second logistic regression that controls the independent
variables and years spent in CRASP. Referring to regression Table 20, according to the
Nagelkerke R Square, 37.5% of the variability in the full SAT composite scores is associated
with selected predictor independent variables. It is reported that besides initial GPA, Black,
Hispanic, special education, and ESL, the number of years spent was considered significant at
.05 p-value (P Years in CRASP Participation = .001). The effect size of 33.711 implies that students who
stay in CRASP for a longer amount of time are more likely to receive higher SAT scores.
Therefore, it is safe to report that the number of years spent in CRASP has a statistically
significant effect on the full SAT composite scores when the multiple regression controls and
combines the other related independent variables that includes students’ basic demographics
(gender and race), education status (special education and ESL), family background (parent
education and lunch type), and transferring status, as well as their prior academic standing (initial
GPA).

IMPROVING COLLEGE READINESS, PURSUIT, ACCESS, AND PERSISTENCE OF
DISADVANTAGED STUDENTS
118
Table 20.
Summary of Linear Logistic Regression Analysis for Years in CRASP and Variables Predicting
the SAT Composite Score (N=267)
Model Unstandardized
Coefficients
Standardized
Coefficients
t Sig.
B Std. Error Beta
1
(Constant) 942.510 64.092 14.706 .000
Transfer In -20.095 36.213 -.028 -.555 .579
Parent Education 5.186 27.558 .010 .188 .851
Gender -43.654 23.823 -.091 -1.832 .068
Lunch Type 8.657 26.515 .017 .326 .744
Special ESL -171.337 39.735 -.214 -4.312 .000*
Initial GPA 137.722 15.042 .491 9.156 .000*
Black -148.540 36.730 -.314 -4.044 .000*
Hispanic -123.803 35.351 -.263 -3.502 .001*
How Many Years 33.711 8.997 .191 3.747 .000*
Note. R2=.375
The linear regression analysis indicated that CRASP participation is positively related to
SAT composite scores. However, as this research study attempts to determine the extent to which
specific CRASP interventions help students the most to get higher SAT scores, the first
regression model did not provide enough information about the specific effect size of each
CRASP component. Therefore, the researcher conducted a stepwise regression model that
included the components of CRASP that have the potential to make a contribution to SAT
composite scores. In addition to CRASP components, other independent variables are included in
the stepwise regression model.
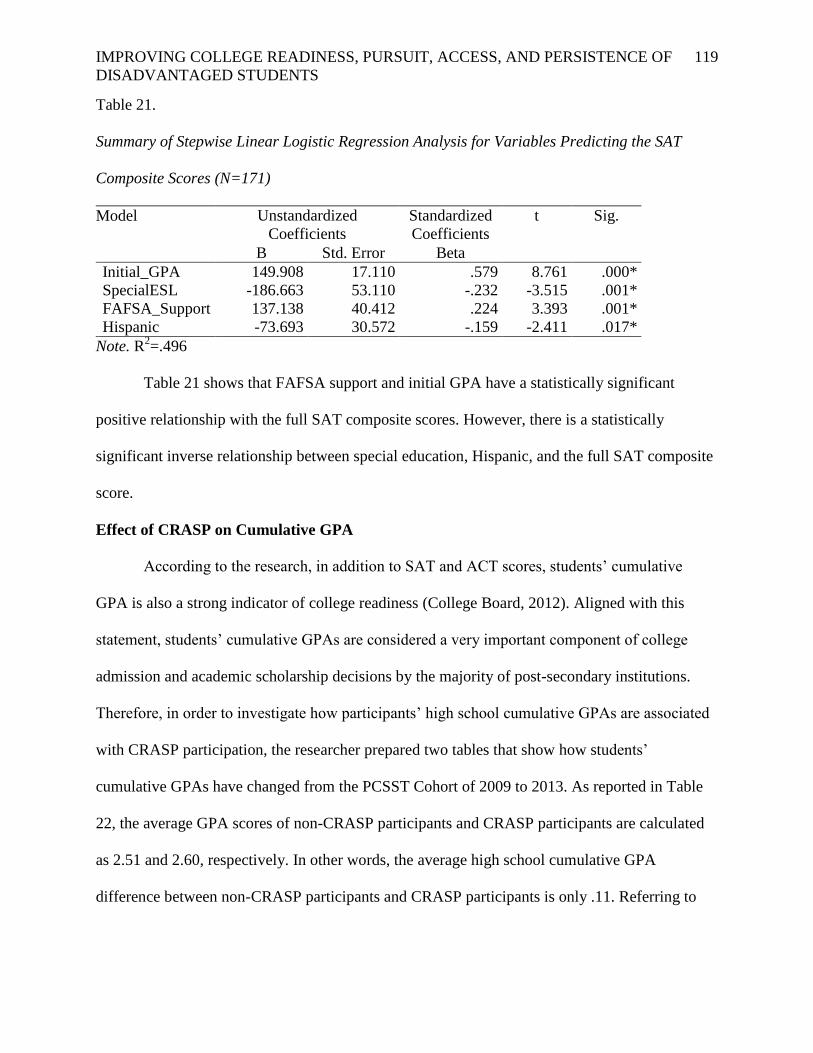
IMPROVING COLLEGE READINESS, PURSUIT, ACCESS, AND PERSISTENCE OF
DISADVANTAGED STUDENTS
119
Table 21.
Summary of Stepwise Linear Logistic Regression Analysis for Variables Predicting the SAT
Composite Scores (N=171)
Model Unstandardized
Coefficients
Standardized
Coefficients
t Sig.
B Std. Error Beta
Initial_GPA 149.908 17.110 .579 8.761 .000*
SpecialESL -186.663 53.110 -.232 -3.515 .001*
FAFSA_Support 137.138 40.412 .224 3.393 .001*
Hispanic -73.693 30.572 -.159 -2.411 .017*
Note. R2=.496
Table 21 shows that FAFSA support and initial GPA have a statistically significant
positive relationship with the full SAT composite scores. However, there is a statistically
significant inverse relationship between special education, Hispanic, and the full SAT composite
score.
Effect of CRASP on Cumulative GPA
According to the research, in addition to SAT and ACT scores, students’ cumulative
GPA is also a strong indicator of college readiness (College Board, 2012). Aligned with this
statement, students’ cumulative GPAs are considered a very important component of college
admission and academic scholarship decisions by the majority of post-secondary institutions.
Therefore, in order to investigate how participants’ high school cumulative GPAs are associated
with CRASP participation, the researcher prepared two tables that show how students’
cumulative GPAs have changed from the PCSST Cohort of 2009 to 2013. As reported in Table
22, the average GPA scores of non-CRASP participants and CRASP participants are calculated
as 2.51 and 2.60, respectively. In other words, the average high school cumulative GPA
difference between non-CRASP participants and CRASP participants is only .11. Referring to

IMPROVING COLLEGE READINESS, PURSUIT, ACCESS, AND PERSISTENCE OF
DISADVANTAGED STUDENTS
120
Tables 22 and 23, the researcher also did not notice a steady increase in GPA by CRASP
participation.
Table 22.
Final High School Cumulative GPA by CRASP Participation
CRASP Participation N Mean SD
No 77 2.51 .684
Yes 307 2.60 .722
Total 384 2.58 .715
Table 23.
Final High School Cumulative GPA by Years Spent in CRASP
Years in CRASP N Mean Std. Deviation
0 77 2.51 .684
1 90 2.65 .779
2 84 2.47 .725
3 71 2.69 .701
4 62 2.60 .643
Total 384 2.58 .715
The archived GPA data table shows that the CRASP participants’ high school average
cumulative GPA is .11 higher than non-CRASP participants. In addition to descriptive statistics,
the researcher also estimated the linear regression model for the effect of participating in CRASP
on cumulative GPA when other independent variables including students’ demographics (gender
and race), education status (special education and ESL), transferring status, family background
(parent education and lunch type), and prior academic standing (initial GPA) are included.

IMPROVING COLLEGE READINESS, PURSUIT, ACCESS, AND PERSISTENCE OF
DISADVANTAGED STUDENTS
121
Table 24.
Summary of Linear Logistic Regression Analysis for CRASP Participation and Variables
Predicting GPA (N=384)
Model Unstandardized
Coefficients
Standardized
Coefficients
t Sig.
B Std. Error Beta
(Constant) .945 .102 9.302 .000
Transfer_In -.170 .052 -.086 -3.274 .001*
ParentEducation .097 .048 .055 2.007 .046*
Gender .105 .039 .072 2.704 .007*
LunchType -.005 .043 -.003 -.118 .906
SpecialESL -.071 .059 -.032 -1.209 .227
Initial_GPA .684 .024 .806 27.996 .000*
Black -.160 .064 -.111 -2.495 .013*
Hispanic -.064 .063 -.044 -1.005 .316
ParticipateCRASP -.042 .047 -.023 -.886 .376
Note. R2=.738
Table 25.
Summary of Linear Logistic Regression Analysis for Years Spent in CRASP and Variables
Predicting GPA (N=384)
Model Unstandardized
Coefficients
Standardized
Coefficients
t Sig.
B Std. Error Beta
(Constant) .872 .101 8.666 .000
Transfer In -.154 .053 -.078 -2.899 .004*
Parent Education .099 .048 .057 2.052 .041*
Gender .104 .039 .071 2.679 .008*
Lunch Type .006 .043 .004 .133 .894
Special ESL -.077 .059 -.035 -1.305 .193
Initial GPA .683 .024 .804 28.093 .000*
Black -.161 .064 -.113 -2.528 .012*
Hispanic -.066 .063 -.046 -1.048 .295
How Many Years .021 .014 .040 1.484 .139
Referring to both Tables 24 and 25, neither CRASP participation nor years spent in
CRASP was significant to predict final cumulative high school GPA when other independent

IMPROVING COLLEGE READINESS, PURSUIT, ACCESS, AND PERSISTENCE OF
DISADVANTAGED STUDENTS
122
variables including students’ demographics (gender and race), education status (transferring,
special education and ESL), transferring status, family background (parent education and lunch
type), and prior academic standing (initial GPA) are included. In other words, these regression
analyses indicate that the CRASP participation and years spent in CRASP are not linearly
associated with a higher probability of having a high cumulative GPA. However, these findings
show that initial GPA, parent education, gender, transferring-in, and race are the most significant
direct contributors to predicting variance in high school cumulative GPA, while holding all other
predictor variables constant.
Model 2: Effects of CRASP on College Pursuit
The researcher also designed Model 2 to conceptualize “College Pursuit”. In particular,
students’ number of post-secondary applications, FAFSA completion, and the type of earned
scholarship were determined as the indicators of “College Pursuit”.
Figure 10. Effects of CRASP on post-secondary pursuit.

IMPROVING COLLEGE READINESS, PURSUIT, ACCESS, AND PERSISTENCE OF
DISADVANTAGED STUDENTS
123
Effect of CRASP on Post-Secondary Application
The number of post-secondary applications is considered an important indicator of
college pursuit. To investigate how the number of post-secondary applications is associated with
CRASP participation, the researcher prepared a data table that shows how students’ number of
college applications has been changed by CRASP participation. As reported in Tables 26 and 27,
it appears that students who participated in CRASP are likely to apply to more post-secondary
institutions compared to students who never participated in CRASP. Particularly, it appears that
CRASP students had a higher average (4.61) than non-CRASP students (2.04) of the number of
college applications.
Table 26.
Number of Post-Secondary Applications by CRASP Participation
CRASP
Participation
N Mean SD
No 69 2.04 1.882
Yes 307 4.61 3.005
Total 376 4.14 3.000
Table 27.
Number of Post-Secondary Applications by Years Spent in CRASP
Years in CRASP N Mean SD
0 69 2.04 1.882
1 90 3.41 2.458
2 84 3.98 2.689
3 71 5.92 2.956
4 62 5.69 3.282
Total 376 4.14 3.000
In addition to descriptive statistics, the researcher also estimated linear regression
models. Referring to regression Tables 28 and 29, it is reported that both CRASP participation
and the numbers of years spent in CRASP have a significant effect on the number of post-

IMPROVING COLLEGE READINESS, PURSUIT, ACCESS, AND PERSISTENCE OF
DISADVANTAGED STUDENTS
124
secondary applications when other related independent variables that include students’ basic
demographics (gender and race), education status (special education and ESL), family
background (parent education and lunch type), transferring status, and prior academic standing
(initial GPA) are included. It appears that PCSST students who stay in CRASP for a longer
amount of time are more likely to have a higher post-secondary application rate. In addition,
initial GPA, lunch type, parent education, special education, and ESL are significantly associated
with post-secondary application rates.
Table 28.
Summary of Linear Logistic Regression Analysis for CRASP Participation and Variables
Predicting the Number of Post-Secondary Applications (N=376)
Model Unstandardized
Coefficients
Standardized
Coefficients
T Sig.
B Std. Error Beta
(Constant) .284 .674 .422 .673
Transfer In -.823 .347 -.099 -2.370 .018*
Parent Education .965 .322 .132 2.996 .003*
Gender .138 .260 .023 .529 .597
Lunch Type -.668 .289 -.100 -2.312 .021*
Special ESL -1.446 .396 -.155 -3.656 .000*
Initial GPA 1.254 .163 .354 7.678 .000*
Black -1.214 .426 -.202 -2.847 .005*
Hispanic -1.033 .419 -.170 -2.462 .014*
Participate CRASP 2.290 .326 .296 7.017 .000*
Note. R2=.347

IMPROVING COLLEGE READINESS, PURSUIT, ACCESS, AND PERSISTENCE OF
DISADVANTAGED STUDENTS
125
Table 29.
Summary of Linear Logistic Regression Analysis for Years in CRASP and Variables Predicting
the Number of Post-Secondary Applications (N=376)
Model Unstandardized Coefficients Standardized
Coefficients
T Sig.
B Std. Error Beta
(Constant) -.276 .610 -.453 .651
Transfer In -.042 .324 -.005 -.129 .897
Parent Education .956 .294 .131 3.258 .001*
Gender .168 .237 .027 .708 .480
Lunch Type -.328 .266 -.049 -1.235 .217
Special ESL -1.397 .360 -.150 -3.877 .000*
Initial GPA 1.389 .148 .392 9.381 .000*
Black -1.315 .389 -.218 -3.381 .001*
Hispanic -1.110 .383 -.183 -2.901 .004*
How Many Years 1.010 .088 .454 11.542 .000*
Note. R2=.457
The linear regression models indicated that CRASP participation and years spent in
CRASP are positively related with the number of post-secondary applications. However, as this
research study attempts to determine the extent to which specific CRASP interventions help
students the most to apply post-secondary institutions, the first regression model did not provide
enough information about the specific effect size of each CRASP component. Therefore, the
researcher estimated a stepwise linear regression model that includes the components of CRASP
that have the potential to make a contribution to the post-secondary application rate.
In addition to CRASP components, other variables were included in the second
regression model. Table 30 shows that FAFSA support, initial GPA, Hispanic, instant decision
days, dual enrollment program, SAT prep program, and parent education have a statistically
significant relationship with the number of post-secondary applications. Referring back to
stepwise linear regression Table 30, according to the R Square, 65% of the variability in the post-
secondary applications is associated with selected predictor independent variables.

IMPROVING COLLEGE READINESS, PURSUIT, ACCESS, AND PERSISTENCE OF
DISADVANTAGED STUDENTS
126
Table 30.
Summary of Stepwise Linear Logistic Regression Analysis for Variables Predicting the Number
of College Applications (N=171)
Model Unstandardized
Coefficients
Standardized
Coefficients
t Sig.
B Std.
Error
Beta
(Constant) -.661 .487 -1.355 .177
Instant Decision Days 2.090 .312 .358 6.690 .000*
Initial GPA .891 .162 .280 5.505 .000*
Dual Enroll Program 1.644 .351 .238 4.688 .000*
SAT Prep Prog 1.025 .293 .182 3.495 .001*
Parent Education .729 .330 .111 2.210 .028*
Hispanic -.660 .272 -.117 -2.424 .016*
FAFSA Support .751 .334 .110 2.245 .026*
Note. R2=.650
Effect of the CRASP on FAFSA Application
As reported in the literature review, minority students are less likely to complete their
financial aid application because they do not have sufficient familiarity with the post-secondary
education system, and how the financial aid processes and FAFSA work (College Board, 2010;
Burkum & La Nasa, 2003; ACT, 2005; Bettinger, Long, Oreopoulos & Sanbonmatsu, 2010).
Therefore, in order to investigate how students’ FAFSA completion rate is associated with
CRASP participation, the researcher prepared a data table that shows the percentage of students
who completed their FAFSA applications by CRASP participation. As reported in Tables 31 and
32, it appears that students who participated in CRASP are more like to complete their FAFSA
compared to students who never participated in CRASP. Particularly, while 83 % of CRASP
participants completed their FAFSA application, only 71% of non-participating students
completed their FAFSA application.

IMPROVING COLLEGE READINESS, PURSUIT, ACCESS, AND PERSISTENCE OF
DISADVANTAGED STUDENTS
127
Table 31.
FAFSA Completion by CRASP Participation
CRASP
Participation
N Mean Std. Deviation
No 69 .71 .457
Yes 307 .83 .373
Total 376 .81 .392
Table 32.
FAFSA Completion by Years Spent in CRASP
Years in CRASP N Mean SD
0 69 .71 .457
1 90 .72 .450
2 84 .82 .385
3 71 .92 .280
4 62 .92 .275
Total 376 .81 .392
In addition to descriptive statistics, the researcher also estimated linear regression
models. Referring to regression Tables 33 and 34, it is reported that both CRASP participation
and the numbers of years spent in CRASP have a significant effect on FAFSA applications when
other related independent variables that include students’ basic demographics (gender and race),
education status (special education and ESL), family background (parent education and lunch
type), transferring status, and prior academic standing (initial GPA) are included. It appears that
PCSST students who stay in CRASP for a longer amount of time are more likely to complete
their FAFSA applications. In addition, parent education, special education, and ESL are
significantly associated with FAFSA application.

IMPROVING COLLEGE READINESS, PURSUIT, ACCESS, AND PERSISTENCE OF
DISADVANTAGED STUDENTS
128
Table 33.
Summary of Linear Logistic Regression Analysis for CRASP Participation and Variables
Predicting the FAFSA Completion (N=376)
Model B S.E. Wald df Sig. Exp(B)
Black -.830 .558 2.212 1 .137 .436
Hispanic -.409 .559 .536 1 .464 .664
Transfer In -.502 .353 2.031 1 .154 .605
Parent Education 1.613 .513 9.872 1 .002* 5.019
Gender -.062 .286 .047 1 .828 .940
Lunch Type -.410 .310 1.741 1 .187 .664
Special ESL -1.094 .397 7.588 1 .006* .335
Initial GPA .248 .184 1.827 1 .176 1.282
Participate CRASP .795 .328 5.875 1 .015* 2.215
Constant .981 .780 1.582 1 .208 2.668
Note. R2=.146
Table 34.
Summary of Linear Logistic Regression Analysis for Years in CRASP and Variables Predicting
the FAFSA Completion (N=376)
Model B S.E. Wald df Sig. Exp(B)
Black -.948 .578 2.694 1 .101 .387
Hispanic -.531 .575 .852 1 .356 .588
Transfer In -.215 .359 .359 1 .549 .806
Parent Education 1.623 .514 9.947 1 .002* 5.066
Gender -.048 .293 .027 1 .870 .953
Lunch Type -.300 .317 .895 1 .344 .741
Special ESL -1.140 .408 7.805 1 .005* .320
Initial GPA .275 .185 2.200 1 .138 1.317
How Many Years .472 .116 16.643 1 .000* 1.604
Constant .771 .797 .937 1 .333 2.162
Note. R2=.195
The binary regression models indicated that CRASP participation is positively related
with completing FAFSA applications. However, as this research study attempts to determine the
extent to which specific CRASP interventions help students the most to complete their FAFSA
applications, the first regression models did not provide enough information about the specific

IMPROVING COLLEGE READINESS, PURSUIT, ACCESS, AND PERSISTENCE OF
DISADVANTAGED STUDENTS
129
effect size of each CRASP component. Therefore, the researcher conducted a stepwise regression
model that includes components of the CRASP that have the potential to make a contribution to
the FAFSA. In addition to CRASP components, other variables were included in the stepwise
regression model.
Table 35.
Summary of Stepwise Binary Logistic Regression Analysis for Variables Predicting the FAFSA
Completion (N=171)
Model B S.E. Wald df Sig. Exp(B)
Parent Education 2.155 1.102 3.828 1 .050* 8.631
Indiv. Learning_Plan 1.852 .653 8.055 1 .005* 6.372
Peer Tutoring 1.601 .827 3.747 1 .053 4.960
Instant Decision_Days 2.306 .636 13.127 1 .000* 10.029
FAFSA Support 3.099 .664 21.752 1 .000* 22.175
Constant -2.778 .709 15.351 1 .000 .062
Note. R2=.597
Table 35 shows that FAFSA support, parent education, individual learning plan, and
instant decision days have a statistically significant positive relationship with the FAFSA
application.
Model 3: Effect of CRASP on Post-Secondary Enrollment
According to the New Jersey State Department of Education (2012), high school
students’ college enrollment after high school graduation is considered a graduation and post-
secondary indicator. In reference to the U.S. Department of Education Blue Print Reform (2010)
and New Jersey State Department of Education’s official public school performance report
standards, in this study, post-secondary enrollment rates in four-year and two-year colleges,
military, vocational, and technical schools are used as the indicators of post-secondary readiness.
The researcher used both descriptive statistics and regression techniques to investigate how

IMPROVING COLLEGE READINESS, PURSUIT, ACCESS, AND PERSISTENCE OF
DISADVANTAGED STUDENTS
130
students’ post-secondary enrollment rate is associated with CRASP participation from 2009 to
2013.
Figure 11. Effects of CRASP on post-secondary enrollment.
First, in order to investigate how students’ college enrollment rate is associated with
CRASP participation, the researcher prepared a data chart that shows students’ college
enrollment from PCSST Cohort 2009 to 2013. As reported in Tables 36 and 37, it appears that
students’ college enrollment rate is positively associated with students’ CRASP participation.
Students who participated in CRASP are more likely to enroll in a post-secondary institution
compared to students who never participated in CRASP. On average, while 90% of CRASP
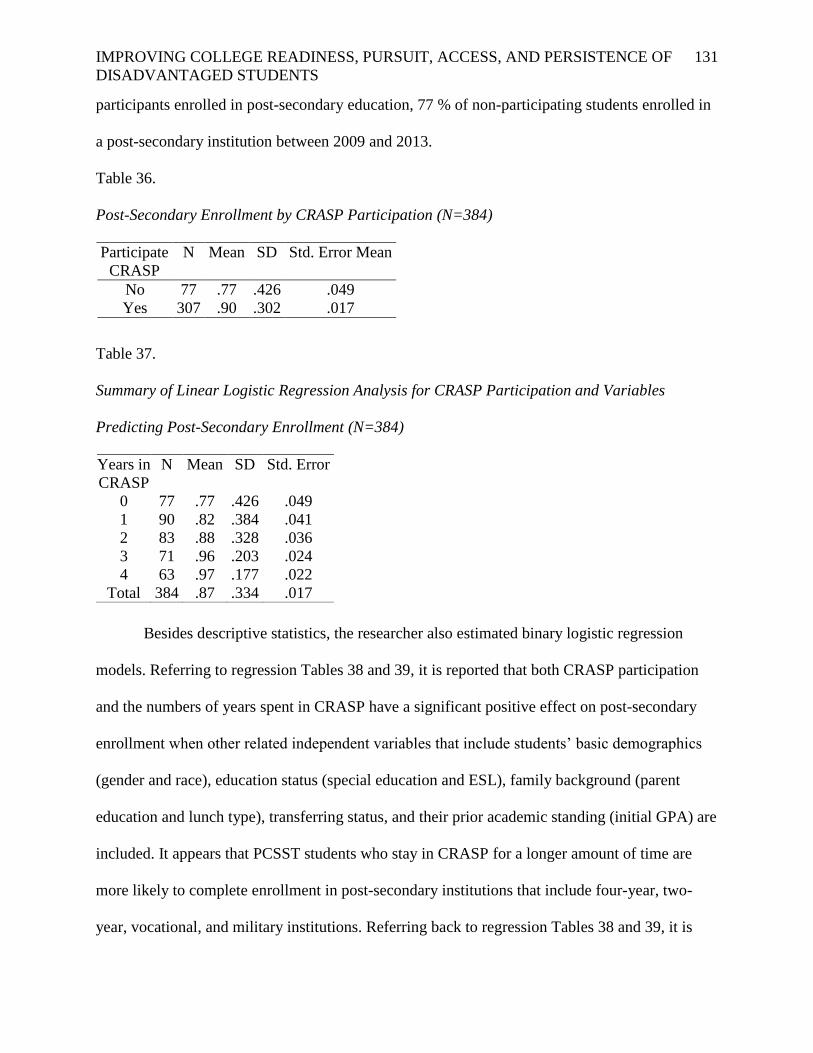
IMPROVING COLLEGE READINESS, PURSUIT, ACCESS, AND PERSISTENCE OF
DISADVANTAGED STUDENTS
131
participants enrolled in post-secondary education, 77 % of non-participating students enrolled in
a post-secondary institution between 2009 and 2013.
Table 36.
Post-Secondary Enrollment by CRASP Participation (N=384)
Participate
CRASP
N Mean SD Std. Error Mean
No 77 .77 .426 .049
Yes 307 .90 .302 .017
Table 37.
Summary of Linear Logistic Regression Analysis for CRASP Participation and Variables
Predicting Post-Secondary Enrollment (N=384)
Years in
CRASP
N Mean SD Std. Error
0 77 .77 .426 .049
1 90 .82 .384 .041
2 83 .88 .328 .036
3 71 .96 .203 .024
4 63 .97 .177 .022
Total 384 .87 .334 .017
Besides descriptive statistics, the researcher also estimated binary logistic regression
models. Referring to regression Tables 38 and 39, it is reported that both CRASP participation
and the numbers of years spent in CRASP have a significant positive effect on post-secondary
enrollment when other related independent variables that include students’ basic demographics
(gender and race), education status (special education and ESL), family background (parent
education and lunch type), transferring status, and their prior academic standing (initial GPA) are
included. It appears that PCSST students who stay in CRASP for a longer amount of time are
more likely to complete enrollment in post-secondary institutions that include four-year, two-
year, vocational, and military institutions. Referring back to regression Tables 38 and 39, it is

IMPROVING COLLEGE READINESS, PURSUIT, ACCESS, AND PERSISTENCE OF
DISADVANTAGED STUDENTS
132
also noted that parent education, initial GPA, special education, and ESL are significantly
associated with post-secondary enrollment.
Table 38.
Summary of Linear Logistic Regression Analysis for CRASP Participation and Variables
Predicting Post-Secondary Enrollment
Model B S.E. Wald df Sig. Exp(B)
Participate CRASP 1.092 .356 9.428 1 .002* 2.980
Transfer In -.771 .395 3.812 1 .051 .463
Parent Education 1.818 .656 7.685 1 .006* 6.162
Gender -.423 .343 1.522 1 .217 .655
Lunch Type -.348 .358 .945 1 .331 .706
Special ESL -1.104 .460 5.748 1 .017* .332
Initial GPA .413 .220 3.529 1 .060 1.511
Black -.545 .618 .778 1 .378 .580
Hispanic .263 .643 .167 1 .683 1.301
Constant .764 .895 .730 1 .393 2.148
Note. R2=.182
Table 39.
Summary of Linear Logistic Regression Analysis for Years in CRASP and Variables Predicting
the Post-Secondary Enrollment
B S.E. Wald df Sig. Exp(B)
Transfer In -.470 .397 1.402 1 .236 .625
Parent Education 1.763 .651 7.342 1 .007* 5.831
Gender -.399 .347 1.320 1 .251 .671
Lunch Type -.251 .364 .477 1 .490 .778
Special ESL -1.109 .474 5.473 1 .019* .330
Initial GPA .451 .221 4.180 1 .041* 1.570
Black -.641 .638 1.007 1 .316 .527
Hispanic .139 .661 .044 1 .834 1.149
CRASP Years .575 .143 16.175 1 .000* 1.778
Constant .607 .915 .441 1 .507 1.835
Note. R2=.225
The binary logistic regression models indicate that CRASP participation and years spent
is CRASP are positively related with post-secondary enrollment. However, as this research study

IMPROVING COLLEGE READINESS, PURSUIT, ACCESS, AND PERSISTENCE OF
DISADVANTAGED STUDENTS
133
attempts to determine the extent to which specific CRASP interventions help students the most to
enroll in post-secondary institutions, the first regression models did not provide enough
information about the specific effect size of each CRASP component. Therefore, the researcher
conducted a stepwise regression model that includes the components of the CRASP that have the
potential to make a contribution to post-secondary enrollment. In addition to CRASP
components, other variables are included in the stepwise regression model.
Table 40.
Summary of Stepwise Binary Logistic Regression Analysis for Variables Predicting the Post-
Secondary Enrollment (N=171)
Model B S.E. Wald df Sig. Exp(B)
Parent Education 2.063 1.087 3.604 1 .058 7.872
Peer Tutoring 19.147 5.285 .000 1 .997 206.363
Instant Decision Days 2.041 .725 7.921 1 .005* 7.695
HomeVisits 2.499 1.142 4.794 1 .029* 12.176
Goup Counseling -2.032 .967 4.410 1 .036* .131
Constant .315 .351 .805 1 .370 1.371
Note. R2=.437
Table 40 shows that instant decision days and home visits have a statistically significant
positive relationship with post-secondary enrollment. However, there was a statistically
significant inverse relationship between group counseling meetings and post-secondary
enrollment. This relationship is certainly not an intended effect of group counseling meetings,
and its implications are discussed in the next chapter.

IMPROVING COLLEGE READINESS, PURSUIT, ACCESS, AND PERSISTENCE OF
DISADVANTAGED STUDENTS
134
Model 4: Effect of CRASP on Freshman to Sophomore Post-Secondary Persistence
Figure 12. Effect of CRASP on freshman to sophomore post-secondary persistence.
Finally, in order to investigate how students’ freshman to sophomore post-secondary
persistence rate is associated with CRASP participation, the researcher prepared a data table that
shows PCSST students’ first year post-secondary persistence from 2009 to 2013. When the
researcher conducted descriptive and inferential statistics, he looked at the percentage of students
enrolled as freshman who returned as sophomores.
As reported in Table 41, on average, while 80% of CRASP participants enrolled as a
sophomore student, only 68 % of non-participating students enrolled in a post-secondary
institution as a sophomore student at any time during first three years after high school.
Table 41.
Freshman to Sophomore Persistence by CRASP Participation
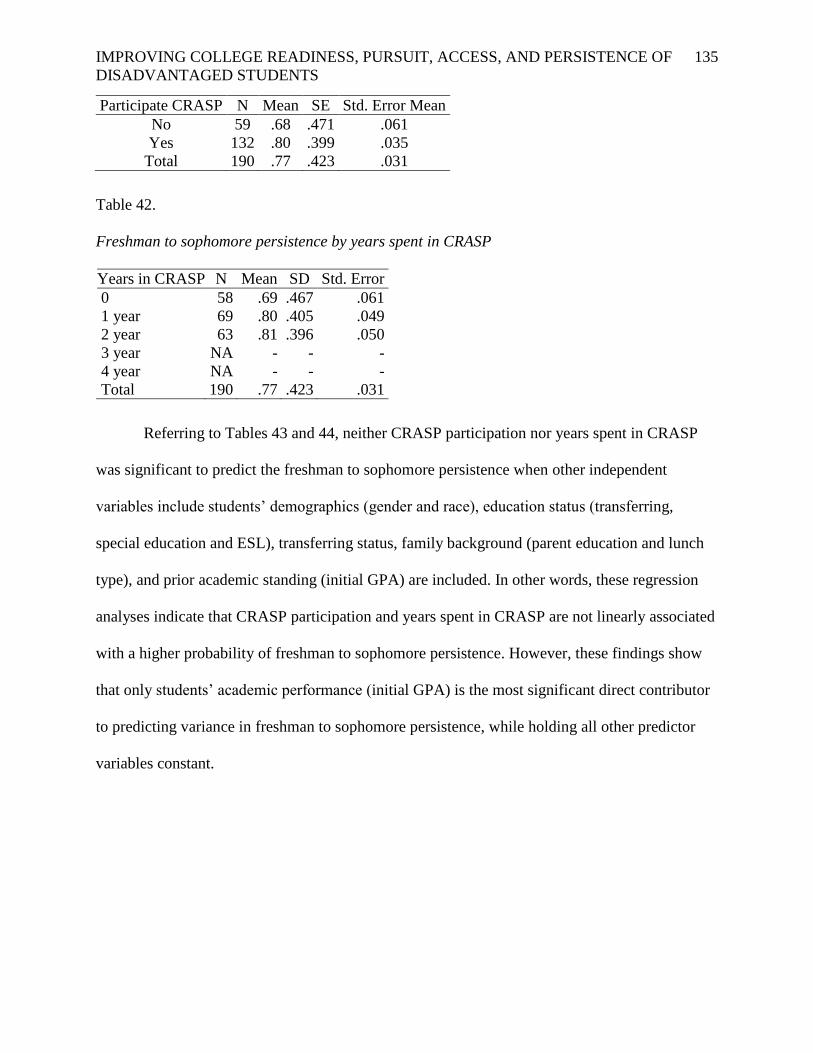
IMPROVING COLLEGE READINESS, PURSUIT, ACCESS, AND PERSISTENCE OF
DISADVANTAGED STUDENTS
135
Participate CRASP N Mean SE Std. Error Mean
No 59 .68 .471 .061
Yes 132 .80 .399 .035
Total 190 .77 .423 .031
Table 42.
Freshman to sophomore persistence by years spent in CRASP
Years in CRASP N Mean SD Std. Error
0 58 .69 .467 .061
1 year 69 .80 .405 .049
2 year 63 .81 .396 .050
3 year NA - - -
4 year NA - - -
Total 190 .77 .423 .031
Referring to Tables 43 and 44, neither CRASP participation nor years spent in CRASP
was significant to predict the freshman to sophomore persistence when other independent
variables include students’ demographics (gender and race), education status (transferring,
special education and ESL), transferring status, family background (parent education and lunch
type), and prior academic standing (initial GPA) are included. In other words, these regression
analyses indicate that CRASP participation and years spent in CRASP are not linearly associated
with a higher probability of freshman to sophomore persistence. However, these findings show
that only students’ academic performance (initial GPA) is the most significant direct contributor
to predicting variance in freshman to sophomore persistence, while holding all other predictor
variables constant.

IMPROVING COLLEGE READINESS, PURSUIT, ACCESS, AND PERSISTENCE OF
DISADVANTAGED STUDENTS
136
Table 43.
Summary of linear logistic regression analysis for CRASP participation and variables predicting
freshman to sophomore persistence (N=191)
Model B S.E. Wald Df Sig. Exp(B)
Participate CRASP .560 .394 2.025 1 .155 1.751
Transfer In -.228 .530 .185 1 .667 .796
Parent Education .412 .512 .646 1 .421 1.510
Gender -.163 .392 .174 1 .677 .849
Lunch Type .480 .427 1.266 1 .260 1.616
Special ESL 1.176 .830 2.010 1 .156 3.243
Initial GPA 1.143 .273 17.573 1 .000* 3.135
Black -.495 .851 .338 1 .561 .610
Hispanic -.040 .863 .002 1 .963 .960
Constant -1.858 1.124 2.733 1 .098 .156
Note. R2 = .266
Table 44.
Summary of Linear Logistic Regression Analysis for Years in CRASP and Variables Predicting
Freshman to Sophomore Persistence (N=191)
Model B S.E. Wald df Sig. Exp(B)
Transfer In -.134 .534 .063 1 .802 .874
Parent Education .396 .515 .593 1 .441 1.487
Gender -.164 .391 .175 1 .676 .849
Lunch Type .532 .430 1.533 1 .216 1.703
Special ESL 1.193 .837 2.032 1 .154 3.298
Initial GPA 1.171 .275 18.106 1 .000* 3.226
Black -.513 .849 .365 1 .546 .599
Hispanic -.045 .861 .003 1 .958 .956
CRASP Years .409 .238 2.967 1 .085 1.506
Constant -1.970 1.134 3.018 1 .082 .139
Note. R2
= .273
Furthermore, in order to explore how participants’ post-secondary persistence has been
changed by institution type, the researcher prepared another table that shows the summary of
students’ post-secondary persistence rate by institution type.

IMPROVING COLLEGE READINESS, PURSUIT, ACCESS, AND PERSISTENCE OF
DISADVANTAGED STUDENTS
137
Table 45.
Freshman to Post-Secondary Persistence by Institution Type and Years in CRASP
Institution Type N Mean SD Std. Error
Vocational Schools 13 .77 .439 .122
2 Year Community Colleges 114 .67 .473 .044
Military Schools 3 1.00 .000 .000
4 Year Colleges 61 .93 .250 .032
Total 191 .76 .425 .031
As noted in Table 45, while 93% of students persist in four-year colleges and universities,
only 67% of students enrolled in community colleges as sophomores at any time during the first
three years after high school. Furthermore, students’ second year persistence was calculated high
in military and vocational schools, but their sample sizes are too small.
The Challenges Disadvantaged Students Face in College
This study also explored the challenges that graduated PCSST students face in their first
year of post-secondary education. Particularly, in the alumni survey, PCSST students were asked
to indicate which factors affected their post-secondary attendance and persistence. As shown in
Table 46, out of 171 participants, 76 percent of PCSST students reported that financial issues
were moderate or main challenges in their first year of post-secondary education. It appears that
financial problems are the major challenge reported by the participants. Additionally, findings
show that time management (51%), lack of support at college (49%), having a job (44%), low
commitment (43%), adjustment problems (36%), failing grades (34%), and family problems
(33%) are other major challenges PCSST students encounter while trying to earn their college or
career degree.

IMPROVING COLLEGE READINESS, PURSUIT, ACCESS, AND PERSISTENCE OF
DISADVANTAGED STUDENTS
138
Table 46.
The Rank of Challenges Students Face in College (N=171)
Rank Challenges students face in the first year of college %
1 Financial Issues 76%
2 Time Management 51%
3 Lack of Support at College 49%
4 Having Job 44%
5 Low Commitment 43%
6 Adjustment Problems 36%
7 Failing Grades 34%
8 Family Problems 33%
9 Remedial Courses 29%
10 Negative Peer Influence 18%
11 Attendance Issues 18%
12 Transportation Problems 17%
13 Health Problems 16%
14 Pregnancy / Parenting 12%
15 Homesick 9%
Reasons of Discontinuity
Finally, in order to explore the dropout reasons of PCSST students, the researcher asked
discontinued PCSST students why they stopped attending their post-secondary institution. The
reported dropout reasons are categorized into five areas. As shown in Table 47, the rank of these
five main factors that led students to drop out from post-secondary education are: (1) financial
problems (37.5%), pregnancy/parenting (20%), academic problems (19.2%), other personal
problems (15%), and lost interest/commitment (8.3%). It is noted that these reported findings are
also strongly supported by prior research (ACT, 2005; Ishitani & DesJardins, 2002; College
Board, 2012). However, it was surprising to see that 20% of discontinued PCSST students (24
out of 120) stopped their post-secondary education because of pregnancy or parenting. This
relationship is certainly not an intended effect of CRASP and its implications are discussed in the
next chapter.

IMPROVING COLLEGE READINESS, PURSUIT, ACCESS, AND PERSISTENCE OF
DISADVANTAGED STUDENTS
139
Table 47.
Dropout Reasons (N=120)
Dropout Reasons Frequency Valid Percent
Financial Problems 45 37.5
Pregnancy/Parenting 24 20.0
Academic Problems 23 19.2
Other Personal Problems 18 15.0
Lost Interest/Commitment 10 8.3
Total 120 100.0

IMPROVING COLLEGE READINESS, PURSUIT, ACCESS, AND PERSISTENCE OF
DISADVANTAGED STUDENTS
140
CHAPTER SIX: DISCUSSION
This study provides evidence that disadvantaged students’ college readiness, pursuit and
access are improved by their participation in the comprehensive College Readiness Access and
Success Program (CRASP). CRASP participation is associated with increased percentages of
students making the necessary preparations to apply to college (number of post-secondary
applications, participation in the SAT, SAT composite scores) and enrolling in post-secondary
institutions. The study did not find a relationship between participation in CRASP, final high
school cumulative GPA, and second-year post-secondary persistence. This chapter moves
beyond these results to describe their implications for practice and policy.
Implication for Practices and Polices in Improving College Readiness
This section suggests specific practices and policies for improving the college readiness
of disadvantaged minority students. Suggested practices and policies are grouped into three
categories based on their immediate goals: (a) improving student participation in college
entrance exams, (b) improving student performance on these exams, and (c) improving student
high school success, as measured by their cumulative grade point average (GPA).
Improving Students’ Participation in College Entrance Exams
This study found that students who participated in CRASP were more likely to take the
SAT compared to students who never participated in CRASP. In addition, initial GPA, parent
education, having an individual learning plan, participating in home visits, and participating in
instant decision days were associated with taking the SAT. The relationships between initial
GPA and parent education and SAT are well established (Baum & Payea, 2004; NCES, 2011;
Bailey, 2001; Bui, 2002; Baum & Payea, 2004; Choy, 2001; Thayer, 2000; Berkner & Chaves,
1997). It is not surprising that high-achiever students whose parents have a college degree are

IMPROVING COLLEGE READINESS, PURSUIT, ACCESS, AND PERSISTENCE OF
DISADVANTAGED STUDENTS
141
more likely to take the SAT. In terms of school practices to improve the SAT participation rate,
PCSST counselors and key stakeholders should focus more on helping students who have low
GPAs and increase the number of students with individual learning plans, home visits, and
instant decision days
PCSST counselors arrange home visitations for students to discuss the students’ college
and career preparation plans, as well as SAT registration requirements and timelines. In addition
to home visits, while school counselors prepare students for instant decision days and develop
individual learning plans, they talk about the importance of the SAT in the college admission
process, and also provide academic advising about effective SAT preparation techniques and the
registration timeline. These three programs may help students develop a stronger belief in the
importance of post-secondary education (Perna & Tutis, 2000; Dumais, 2002).
Another important component of the home visits, individual learning plans and instant
decision days that may explain their effectiveness is that they inform students and parents about
the availability of fee-waivers. The current fee of general SAT registration is $51.00. Taking the
SAT and subject SATs multiple times is definitely expensive for disadvantaged students, which
is why something as simple as fee waivers may help students attend post-secondary education.
Helping and guiding students to use fee waivers can be considered building social and financial
capital for low-income students (College Board, 2012; Cabrera, Burkum & La Nasa, 2005;
Grodsky & Jones, 2004; Holcomb-McCoy, 2010).
Improving Students’ Performance on College Entrance Exams
The literature review revealed that students’ college entrance test scores are the primary
indicator of academic preparedness, and high SAT/ACT scores have a significant influence on
college access and post-secondary persistence (College Board, 2012; ACT, 2005; Perna & Titus,

IMPROVING COLLEGE READINESS, PURSUIT, ACCESS, AND PERSISTENCE OF
DISADVANTAGED STUDENTS
142
2005; Martinez & Klopott, 2005; Berkner & Chavez, 1997; Adelman, 1999; Tyack, 1974). This
study found only three variables - initial GPA, special education, and FAFSA support - with a
significant effect on SAT composite scores. Students with higher GPAs are more likely to have
a strong academic foundation and the necessary skills to get high SAT scores. Therefore,
students who have low GPAs should be encouraged to participate in SAT enrichment programs
at PCSST.
The findings also indicate that special education and ESL students have lower SAT
scores compared to general education students. Therefore, another action for PCSST counselors
and key stakeholders to take is to give extra attention to the needs of special education and ESL
students. Another implication for practice is that PCSST counselors should also pay particular
attention to ensuring that these student populations apply for and receive all the SAT/ACT test
accommodations to which they are entitled through their Individualized Education Plans
(“IEPs”) or Section 504 accommodations.
Finally, it was interesting to see that individual FAFSA support is associated with higher
SAT scores. The relationship between FAFSA support and SAT composite scores could be
explained by students’ motivation to receive full or partial scholarships from post-secondary
institutions. Students who achieve high SAT scores also have an increased likelihood of
receiving academic scholarships, but they must complete their FAFSA application in order to get
these scholarships. Applying this to future practices, PCSST counselors should emphasize the
importance of getting high SAT scores to receive academic scholarships during individual
counseling sessions. If students see the connection between SAT scores and the amount of
expected scholarship, they might work to improve their SAT scores.

IMPROVING COLLEGE READINESS, PURSUIT, ACCESS, AND PERSISTENCE OF
DISADVANTAGED STUDENTS
143
Even though the school’s SAT average composite scores increased significantly,
PCSST’s SAT composite scores from the last time the test was taken by CRASP participation
are still below the NJDOE’s expectations. According to the NJDOE’s standards (2012), at least
the 40% of the SAT takers must get 1550 or above to meet the state requirements. Based on the
2012-13 performance report, only 5% of PCSST SAT takers received 1550 or above. Therefore,
based on this study’s findings and prior research already cited in the Literature Review section of
this paper, in order to improve SAT scores even further, the following recommendations are
suggested.
First, PCSST should offer a more rigorous curriculum along with individual academic
support at every grade level. If PCSST students could take challenging and rigorous classes that
include Advance Placement (AP) and Honor level courses, these opportunities would be the ideal
preparation for improving their achievement levels on college entrance exams (College Board,
2012; Hart, 2005).
Even though PCSST collaborates with a private company to conduct an SAT preparation
program during and after school and on weekends, the findings indicate that the SAT prep
programs sponsored by the school did not have a significant impact on improving SAT scores. In
other words, the study highlights the need to reevaluate these SAT preparation programs. Instead
of relying on one SAT program supported by an external company, PCSST could train its
teachers to integrate SAT curriculum into their lessons. Based on prior research, if trained
mathematics and English teachers provide high-quality instruction and academic advising for the
SATs throughout the high school years, students are more likely to achieve higher SAT
composite scores (Gandara & Bial, 2001). If math and English teachers are knowledgeable about
SAT questions, they could develop self-paced manuals and SAT study guides to prepare students

IMPROVING COLLEGE READINESS, PURSUIT, ACCESS, AND PERSISTENCE OF
DISADVANTAGED STUDENTS
144
for the SATs, starting from grade nine. Aside from SAT training, aligned with their needs,
teachers should also participate in other professional development and training activities that will
help them deliver the high quality instruction.
Additionally, PCSST should leverage the fact that each PCSST high school student
receives an iPad from the school, and utilize online test preparatory methods and lessons.
PCSST’s IT department should collaborate with PCSST math, English, and guidance counseling
departments to download useful SAT preparation and practice applications. Moreover, the peer
tutoring program could also be used to improve SAT scores of students who are in need of
academic support. Finally, some students might not have enough money to purchase a SAT test
preparation book. Therefore, buying several SAT/ACT preparation books for the school library
might improve students’ access to and use of these books to prepare for the SAT/ACT tests.
Improving Students’ High School GPA
CRASP students did not have significantly higher GPA. As GPA predicts students’
college readiness and success, improving the academic or cognitive development of students can
be considered one of the most important aspects of K-12 schools. The findings indicate that
Male, African American, and transfer students at PCSST have lower cumulative GPAs compared
to their peers, which suggests that counselors, teachers, and other stakeholders should prioritize
extra support and guidance for these students. In addition to current practices in place, PCSST
stakeholders should explore alternative ways to improve the academic performance of male
students and students of color. For example, PCSST should develop a system to identify at-risk
students who have a low GPA in early grades and prepare intensive individual learning plans that
might help them improve academically (Lotkowski, Robbins, & Noeth, 2004). This process
could start in Grade 3. Therefore, PCSST should utilize systemic early assessment and support
IMPROVING COLLEGE READINESS, PURSUIT, ACCESS, AND PERSISTENCE OF
DISADVANTAGED STUDENTS
145
programs to determine which students need extra help in core subjects. In order to increase the
number of high-achieving students whose initial GPA is 3 or above, ongoing extra support and
academic advising should be provided while they are still in elementary school and throughout
high school.
Once at-risk students who have a low GPA are identified, the teachers of these students
should be informed of their requisite areas in need of improvement so they can plan
differentiated instruction and lesson plans accordingly. Each teacher must thus receive proper
training in order to acquire the knowledge and skills to deliver differentiated instruction.
Moreover, aligned with the new performance evaluation requirements that include Student
Growth Objectives (SGOs), each teacher and counselor must be held accountable for each at-risk
student’s academic growth.
PCSST implements tutoring services to ensure that all students who are not proficient
receive additional instruction based on their needs. Because of this design, it would be expected
that students would gain from this instruction and that those gains would be measurable on GPA
improvement. However, this study shows that tutoring services at PCSST are not significantly
associated with improvements in students’ GPAs. To increase the effectiveness of tutoring
services, PCSST must revisit the design of teacher tutoring sessions that are currently offered
after school or weekends. Students’, teachers’, and school counselors’ feedback must be taken
into consideration while designing effective PCSST tutoring services that could help students
improve their academic performance.
Implication for Practices and Policies in Improving College Pursuit
This section describes specific CRASP practices that could be used by educators to
improve disadvantaged students’ pursuit of college entrance. Consistent with the research
IMPROVING COLLEGE READINESS, PURSUIT, ACCESS, AND PERSISTENCE OF
DISADVANTAGED STUDENTS
146
findings, the suggested practices are described in two categories of intervention: (a) improving
students’ college applications, and (b) improving students’ FAFSA completion rates.
Improving Students’ College Application
Based on the new NJDOE (2012) school performance assessment standards,
all public schools in New Jersey are held accountable for their post-secondary enrollment and
retention. In order to get students into college, students must complete the first step - college
application. If students do not attempt to apply to a post-secondary institution, they will have no
chance of getting into a college. Therefore, it is crucial to help disadvantaged students
successfully navigate their college application process so they can have the opportunity to get
official college acceptance letters.
This study found that students who participated in CRASP are significantly more likely
to apply to post-secondary institutions compared to students who never participated in the
CRASP program. Particularly, it is reported that in addition to initial GPA and parent education,
individual FAFSA support, the dual enrollment program, SAT prep program, and instant
decision days have a significantly positive effect on the number of college applications when the
multiple regression controls and combinations of other related independent variables are
included in the analysis.
This suggests that PCSST students who participate in instant decision days, FAFSA
support, SAT prep, and college dual enrollment programs apply to significantly more colleges
compared to those who were not involved in these activities. This significant positive impact of
these four CRASP programs can be explained by building social, cultural, and financial capitals
(Bourdieu, 1986; Carbonaro 1998; Coleman, 1988; Folkman & Lazarus, 1986). For example,
during the SAT prep program, in addition to tutoring, instructors provide students with resources,

IMPROVING COLLEGE READINESS, PURSUIT, ACCESS, AND PERSISTENCE OF
DISADVANTAGED STUDENTS
147
strategies, and knowledge in order to successfully navigate the college search and admission
process (social and cultural capital).
Furthermore, encouraging students to participate in college dual enrollment programs
could be also considered building a cultural and social capital because it sets high expectations
and establishes values for post-secondary education. While dual enrollment programs help
PCSST students experience and learn about how the college system works, taking college-level
courses outside of the high school could also help students become more self-directed and
independent, willing to take the initiative and responsibility for their own college applications.
Findings also show that similar to the dual enrollment program, students who participate
in instant decision days have a significantly higher rate of college applications. This is not
surprising. The instant decision days could explain this increase in college applications because
during the college instant decision days, PCSST seniors have the opportunity to meet with
official financial aid and college admission counselors in person to gain firsthand knowledge of
the college admissions and financial aid processes. This is also considered building social capital
that helps PCSST students navigate the complex college admission process (Bourdieu, 1977;
Perna & Tutis, 2000; Dumais, 2002). Moreover, while instant decision days ease students’
college applications, they also help build financial capital because undergraduate admissions and
financial aid decisions are now simplified with on-site admissions, and the waiving of PCSST
students’ college application fees.
Finally, findings show that there is a statistically significant inverse relationship between
Hispanic students and the number of college applications. This finding is supported by the
previous research that race has a significant impact on students’ college applications and post-
secondary education plans (Gamoran et al., 2011). Similar to previous research findings,

IMPROVING COLLEGE READINESS, PURSUIT, ACCESS, AND PERSISTENCE OF
DISADVANTAGED STUDENTS
148
Hispanic students’ average college application rate is lower than their peers. The implication for
practice is that PCSST stakeholders must pay extra-attention to the college applications of
Hispanic students by putting them on counselors’ priority lists while doing college applications.
Improving Students’ FAFSA Completion Rates
FAFSA is the largest provider of student financial aid in the nation. In order to get any
type of scholarship, financial aid, grant, or loan, many colleges require students to complete
FAFSA applications. The findings of this study indicate that CRASP participation’s estimated
impact is statistically significant on improving the FAFSA completion rate. Particularly, this
study found that participating in instant decision days, individual learning plans, parent
education, and FAFSA support are the most significant direct contributors to predicting variance
in PCSST students’ FAFSA completion rates. The implication of this finding for the stakeholders
at PCSST is that the professional school counselors should continue to very proactively help
each student complete financial aid applications.
The researcher assumes that if students do not have accurate information regarding
scholarships, grants, and loans, they might not develop a realistic college affordability plan. As a
consequence, they face serious difficulties paying college tuition and other college-related
expenses that cause dropout in the long run. Furthermore, the researcher recommends that
instead of starting financial aid counseling sessions in grade 12, counselors should begin to
inform parents and students about scholarships in middle school. PCSST counselors should talk
to middle school students about the cost of college education and effective strategies to earn
scholarships. Students should get the main message that college is expensive, but there are
several alternative ways to pay college tuition and other expenses.
IMPROVING COLLEGE READINESS, PURSUIT, ACCESS, AND PERSISTENCE OF
DISADVANTAGED STUDENTS
149
Implication for Practices and Policies in Improving Post-Secondary Access
The results of this study assert that CRASP’s estimated impact was statistically
significant on improving PCSST students’ post-secondary enrollment. Therefore, this section
describes specific practices and policies that can help PCSST stakeholders improve college
access for disadvantaged students. Particularly, the findings of the study show that there is a
statistically significant positive relationship between parent education, instant decision days, and
home visits. The first implication of these findings is that PCSST counselors must be more
concerned about first-generation students who are less likely to receive proper support during
their college application and enrollment process.
Second, instant decision days could explain the increase in PCSST students’ post-
secondary enrollment because instant decision days provide PCSST students with an opportunity
to meet directly with college admissions counselors and ask their questions regarding college
admission and financial aid. Furthermore, the instant decision days ease and speed up the PCSST
students’ college application process because students get an opportunity to receive an
immediate answer about whether or not they receive college acceptance and academic
scholarship. This support system can be considered building social and cultural capitals that are
necessary for college enrollment. Moreover, as CRASP essentials dictate PCSST and post-
secondary partnership, the findings of this study suggest that the PCSST school counseling
department should continue to organize the instant decision days to improve students’ post-
secondary enrollment.
Third, the findings of this study indicate that home visits’ impact is statistically
significant on post-secondary enrollment. It seems that students whose homes are visited are
more likely to enroll in post-secondary institutions. During the home visitations, both students
IMPROVING COLLEGE READINESS, PURSUIT, ACCESS, AND PERSISTENCE OF
DISADVANTAGED STUDENTS
150
and parents receive information about the college admission process. They are also informed
about the college enrollment process and successful post-secondary education transition.
Therefore, it is expected that parents who are now knowledgeable about the college admission
and enrollment process will encourage their children to enroll in college and are more likely to
do so. Aligned with CRASP’s essentials, this parental involvement in and commitment to
improving their student’s chances of college enrollment likely results in parental encouragement
for college enrollment, and may explain the significant variance in post-secondary enrollment
rate.
Finally, the findings show that there is a statistically significant inverse relationship
between group counseling meetings and post-secondary enrollment. This relationship is
certainly not an intended effect of group counseling meetings. In general, based on the needs,
referred students who need extensive support participate in systemic, small group counseling
sessions such as test anxiety, test taking strategies, and anger management techniques. In these
small group sessions, school counselors interact with each referred student and build caring
relationships. It is surprising that these students have a significantly lower college enrollment
rate compared to their peers. Thus, the implication of this for the school counselors at PCSST is
that during the group counseling sessions, in addition to selected topics, school counselors
should provide the resources and knowledge that help referred students enroll in post-secondary
institutions.
Disadvantaged students’ college readiness and success is a very complex and ongoing
process. Therefore, the causality for college access might not run in one particular direction. It
means there might be multiple explanations for low college access of students who were referred

IMPROVING COLLEGE READINESS, PURSUIT, ACCESS, AND PERSISTENCE OF
DISADVANTAGED STUDENTS
151
to small group counseling sessions. For example, it could be that counselors are more likely to
meet with students who are in difficulty.
Implication for Practices and Policies to Improve Freshman to Sophomore Post-Secondary
Persistence
As indicated in the literature review, disadvantaged minority students are less likely than
non-disadvantaged students to stay in college and earn their degree (Stillman, 2009; NCES,
2011). PCSST students’ enrollment in post-secondary education does not guarantee their degree
attainment. Therefore, it is critical for PCSST administrators, school counselors, and other
stakeholders to understand and interpret the college persistence results for practical implications.
The findings of this study estimate that CRASP students did not significantly outperform
comparison students in freshman to sophomore post-secondary persistence. Most importantly,
only initial GPA was found to be statistically significant in estimating PCSST students’ freshman
to sophomore persistence. The implications of college persistence outcomes and suggestions for
policies and practices at PCSST are discussed below.
The findings of this study highlighted two gaps in PCSST students’ freshman to
sophomore post-secondary persistence. First, it is noted that the first year college persistence of
students who attend two-year community colleges is much lower than the students who attend
four-year colleges. Particularly, the second-year college persistence of PCSST students who
attend to community colleges and four-year colleges are calculated as 67% and 93%,
respectively. Therefore, it appears that PCSST students’ four-year and two-year persistence rate
is not the same. The freshman to sophomore persistence is significantly lower in two-year
colleges. The implication for practice is that PCSST must pay extra attention to improving the
college retention of students who attend community colleges. Particularly, it is noted that the

IMPROVING COLLEGE READINESS, PURSUIT, ACCESS, AND PERSISTENCE OF
DISADVANTAGED STUDENTS
152
majority of students attend the local community college, Passaic County Community College
(PCCC). Therefore, it is important to build an institutionalized partnership with PCCC to
monitor and support its students’ college success. Aligned with the mission of the PCSST alumni
support program, PCSST should request an office room to provide PCSST students with
tutoring, advising, career, and financial aid counseling.
Second, the findings indicate that compared to other sub groups, freshman to sophomore
college persistence is significantly lower among students who have a low initial GPA. This is a
crucial finding for PCSST stakeholders because starting from grade 9, PCSST teachers and
counselors can identify and provide long-term systemic support to academically low-performing
students who are less likely to stay and earn their college degree. It is expected that paying extra
attention to and providing academically low-performing students with intensive individualized
support for their academic development may improve their college persistence. While teachers
offer systemic academic support, PCSST school counselors should proactively reach out and
engage these students in college readiness activities by offering individual and group counseling
meetings so they may have a higher chance of getting into and through college.
Helping Disadvantaged Students Deal with Challenges
In this study, students reported financial issues, time management, lack of support at
college, having a job, and low commitment as the top five major challenges PCSST graduated
students encounter while they are trying to succeed in college. By far the most commonly
reported challenge was financial difficulty. Both post-secondary institutions and PCSST should
focus on personalized financial aid counseling services to prepare disadvantaged students
financially for college. While PCSST counselors proactively help students and parents

IMPROVING COLLEGE READINESS, PURSUIT, ACCESS, AND PERSISTENCE OF
DISADVANTAGED STUDENTS
153
understand the financial aid process, post-secondary institutions should design simpler college
and financial aid applications.
In addition, both post-secondary institutions and PCSST should focus more on building
time management, study, and organization skills. It is also suggested that in order to help
students utilize the available college resources such as the library, tutoring, and counseling
services, PCSST counselors provide more lessons on effective post-secondary transition. At the
same time, early alert and systemic interventions should be offered by post-secondary
institutions to create nurturing environments for disadvantaged minority students. Instead of one
or two-day regular orientations, ongoing and long-term academic advising and mentoring
services should be provided to disadvantaged minority students during their post-secondary
education.
Having a part-time or full-time job outside of the college campus is a significant
challenge for PCSST students. Therefore, while PCSST helps seniors arrange a work and school
schedule, post-secondary institutions should find alternative ways to expand their work-study
programs for at-risk students. Finally, the low commitment of students indicates that PCSST
counselors must do more research to find and arrange alternative strategies to improve the self-
motivation of students so they can complete their college education.
In addition to the most commonly reported challenges, it was surprising to see that 20%
of discontinued PCSST students (24 out of 120) stopped their post-secondary education because
of pregnancy or parenting. This suggests that PCSST might revise the preventative programs and
school counseling curriculum by including comprehensive healthy relationship lessons. PCSST
counselors could also invite graduated young parents to share the challenges of taking care of a
child and attending college.

IMPROVING COLLEGE READINESS, PURSUIT, ACCESS, AND PERSISTENCE OF
DISADVANTAGED STUDENTS
154
Implication for Counselor Education and State Policy
The findings of this study resonate with previous research clearly indicating that school
counselors play a very crucial role in helping students get ready for college, get into college, and
get through college (College Board, 2012; Lapan, 2012). Having that in mind, the findings of
this study also acknowledge the importance of school counselor education programs and state
policies. In order to prepare 21st century professional school counselors, implications for
counselor educators and policy makers are discussed below.
First, it is important to take into consideration that preparing disadvantaged minority
students for college and a career requires multi-faceted approaches and collaborative efforts.
Therefore, federal and state officials should encourage school counselor educators to redesign
their curriculum and training activities to help equip future school counselors with the proper
skills, resources, and knowledge to meet the needs of a diverse student population. When school
counselor educators educate school counseling students about how to implement a
comprehensive school counseling program, they should also help school counseling students
gain skills and knowledge about preparing and delivering college and career counseling
activities. Particularly, besides accountability, leadership, advocacy and collaboration, school
counseling curriculum and programs should ensure that future professional school counselors
have skills, resources, and expertise in providing career counseling, standardized test
preparation, academic advising, mentoring, financial aid information, college admissions and
effective post-secondary education transition information (ASCA, 2012; Carey & Dimmitt,
2012; Lapan, 2012).
In addition, as recommended by the six state level studies, professional school counselors
need to use comprehensive data, prioritize college and career-readiness counseling activities, and

IMPROVING COLLEGE READINESS, PURSUIT, ACCESS, AND PERSISTENCE OF
DISADVANTAGED STUDENTS
155
focus on implementing a differentiated school counseling program delivery that meets the needs
of all students, including special education and ESL students. Particularly, special education
students with a learning disability need systemic and ongoing supportive services. Therefore,
school counseling programs should provide future counselors with proper training so they can
understand the needs of special education students by developing responsive services, guidance
curriculum, and assessing their needs and abilities to make them ready for college and a career
(Carey & Dimmitt, 2012).
In addition, based on the ASCA’s statistics, the average ratio of students to counselors in
middle and high schools is around 500 to 1. The American School Counselor Association
recommends a ratio of 250 to 1. However, in urban schools, for one school counselor to provide
ongoing individualized support to 250 low-income first-generation students and prepare them for
college and career readiness does not seem to be a realistic and feasible practice. Therefore, in
order to provide an intensive individualized college and career counseling session for each
student from grades 6 to 12, this study recommends each urban school have one school counselor
for every 160 students.
As emphasized by the ASCA National Model (2012), balancing counseling and non-
counseling duties is also vital in effective program initiation and implementation. In order to
maximize the effectiveness of school counselors, state and district officials encourage school
administrators not to assign professional school counselors non-counseling duties. Instead of
non-counseling assignments, school counselors and the school administration team should come
together to plan the logistics and feasibility of effective delivery of college and career readiness
activities. The researcher recommends that starting from middle school years, professional

IMPROVING COLLEGE READINESS, PURSUIT, ACCESS, AND PERSISTENCE OF
DISADVANTAGED STUDENTS
156
counselors should provide each student with intensive individual college and career counseling
services to make them well informed regarding their college and career plans.
Recently, while measuring schools’ performances in college and career readiness,
NJDOE (2012) solely focused on students’ participation in college readiness tests such as the
SAT or PSAT and in rigorous coursework as defined by participation in AP courses in English,
math, social studies, and science. Instead of only relying on students’ test participation and test
scores, the researcher suggests NJDOE develop an integrated and comprehensive college and
career readiness portfolio assessment that requires each student to develop and present his/her
own personalized (a) interest profile, (b) ability assessment, (c) job readiness skill assessment,
(d) graduation plan, (e) growth plan, (f) personal-social development plan, (g) post-secondary
education selection plan, (h) short and long-term life and career goals, (i) research project, (j)
personal qualities checklist, (k) leadership project, (l) college affordability plan, (m) community
service project, (n) college essay, (o) recommendation letters, (p) standardized test results, (r)
resume, and (s) college readiness journal.
Limitation of the Study
As with all studies, in interpreting the results of this study, the reader must take several
limitations into consideration. First, 95 percent of the participants are African American or
Hispanic, and White and Asian students are not adequately represented in this study. In addition
the whole sample was from one school. Students’ characteristics and unique institutional factors
might account for some of the outcomes. Also, a limitation is that this study looked at PCSST
cohorts at one point in time. However, college achievement and retention are progressive
concepts that require ongoing monitoring and assessment.

IMPROVING COLLEGE READINESS, PURSUIT, ACCESS, AND PERSISTENCE OF
DISADVANTAGED STUDENTS
157
An important methodological limitation is that students were not randomly assigned to
attend the charter school or to participate in CRASP different numbers of years, or to participate
in the various specific activities of CRASP. Participation in CRASP and the number of years of
participation are chosen by the students and their families. As a result the student and family
background characteristics that are associated with these choices are potentially confounded with
CRASP and its components when estimating their relationships to the program’s desired
outcomes.
This study attempted to control for pre-existing characteristics of the students and their
families that may have been associated with these choices. However, the study cannot guarantee
that selection bias due to other unmeasured background characteristics does not affect the results.
Particularly, there are two separate problems. First, the sample is not necessarily representative.
Charter schools are public schools of choice. Parents chose the charter they thought it would get
their children successfully through high school and college. Therefore, the estimates of the
effects of CRASP may be biased by selection. After parents and students select to go charter
schools, it is their decision to stay or leave charters. Selection bias is cue to who chose to go for
different numbers of years. As a result, this study cannot be considered to represent the general
population of urban students, even within its geographic location, limiting generalizability of
findings beyond the charter school where it was conducted
Another methodological limitation of the study is the use of the self-reported student data
in college enrollment, college persistence, FAFSA application, parent education, scholarship
type, and number of college applications. However, in order to determine whether respondents
gave honest answers to survey questions, as mentioned above, the researcher used multiple
resources such as College Board reports, the National Clearing House Student Tracker Program

IMPROVING COLLEGE READINESS, PURSUIT, ACCESS, AND PERSISTENCE OF
DISADVANTAGED STUDENTS
158
reports, and peer inputs to verify respondents' answers to many key questions which increase
confidence in the self-report.
A limitation with respect investigation of the effects of participation in specific CRASP
components is that this was measured simply as a yes or no. Additional insights might have been
gained if data had been available on the frequency and the quality of PCSST students’
participation in CRASP. However, this was not measured. The long list of CRASP components
can be also considered another limitation; because of the difficulty students might have recalling
participation in all of them. CRASP has a total of 19 interventions, and during the high school
years students are encouraged to participate in these CRASP activities. Students might
participate in several CRASP activities but they might not necessarily remember the specific
names of the CRASP activities in which they were involved. To address this limitation, the
researcher crosschecked all students’ responses with his counseling logs or peers.
Another limitation relates to the research design. There was only one time point prior to
the implementation of CRASP to use to estimate the impact of CRASP. The only cohort who did
not participate in CRASP is the class of 2009. As a result it was not possible to estimate a time
trend prior to CRASP and the number of non-CRASP comparison students is limited. It would
have been better to have more consecutive cohorts who did not participate in program.
There are also two other important limitations of this study. One is attrition bias due to
students leaving PCSST. Based on the school’s archived data, around twenty percent of each
cohort who enter leaves PCSST before their graduation and the researcher was not able to follow
up with them in terms of their college enrollment and success. In order to address this limitation,
the researcher conducted an ANOVA to compare the compare leavers and stayers on entry GPA
and family background. According to the ANOVA test results; there were no statistically

IMPROVING COLLEGE READINESS, PURSUIT, ACCESS, AND PERSISTENCE OF
DISADVANTAGED STUDENTS
159
significant differences between the leavers and stayers on entry GPA and family background.
The other limitation is that the researcher, who was actively involved in the research, is also the
creator and evaluator of CRASP. This means that he has much knowledge and many insights into
the program, and while this is useful it also can be considered a potential source of bias.
Implications for Future Research
Throughout these findings and discussion, this researcher has attempted to measure the
impact of CRASP. Aligned with this purpose, this study indicates that CRASP participation is
associated with improving the college readiness, pursuit and access of disadvantaged PCSST
students who mostly come from first generation and low-income parents. In addition to the
general effects of CRASP, the individual impact of each CRASP intervention component was
measured. These findings inspired the researcher to ask new questions that can lead to further
research, and these questions may have a broader impact and additional applications for practice.
For example, some important questions remain regarding CRASP's implementation. First, can
CRASP have the same or similar impact on other urban high schools that serve mostly
disadvantaged minority students? Since this study was limited to one location, this researcher
intends to replicate this study at other public urban schools in New Jersey and other states to
investigate whether or not the same or similar results are found.
These findings provided evidence that CRASP has positive effects on disadvantaged
students’ college readiness, pursuit and access. However, we don’t yet have enough information
about how CRASP affects students’ college attainment. Therefore, future research can
investigate the impact of CRASP on college attainment. One avenue of future research would be
to compare the graduation rates of CRASP participants and non-CRASP participants. This
attainment research could be considered as a continuation of this study, and could also provide
IMPROVING COLLEGE READINESS, PURSUIT, ACCESS, AND PERSISTENCE OF
DISADVANTAGED STUDENTS
160
valuable information about improving disadvantaged students’ college graduation rates. In order
to conduct this future study, this researcher will continue to collect data from graduated students.
Finally, in this study, this researcher only utilized quantitative data such as SAT scores,
GPA, college enrollment, and retention data. Quantitative data analysis techniques were used to
measure the impacts of CRASP on students’ college readiness and success. Therefore, future
research might want to utilize a mixed-methods or qualitative method approach to investigate
students’ individual experience with CRASP participation. Instead of quantitative measures,
future research might want to use open-ended questions or interviews to explore the ways in
which PCSST students felt CRASP prepared them for college, as well as their own experiences
which fall into the human capital, social capital, cultural capital, or financial capital areas of
exploratory research. Unlike quantitative methodology, a mixed methods or qualitative research
design encourages participants to share their own feelings of college and career readiness due to
their experiences in the CRASP program.
Conclusion
Educators seek to solve problems that interfere with disadvantaged students’ low college
readiness, access and persistence. This study offers school counselors, teachers, school
administrators, and policy makers with practical information and strategies in designing and
implementing comprehensive counseling programs. In line with the new college and career
readiness accountability standards, the findings of this study urge for further investigations of
creating research-based and innovative comprehensive school counseling programs that might
cater to the diverse needs of students.
The findings of this research support the view that when highly trained professional
school counselors and educational leaders deliver comprehensive counseling programs such as

IMPROVING COLLEGE READINESS, PURSUIT, ACCESS, AND PERSISTENCE OF
DISADVANTAGED STUDENTS
161
CRASP, students receive measurable benefits in their college readiness, pursuit, and access. In
addition there is a hint that college persistence is associated with numbers of years of CRASP.
Thus, school districts should be aware that to prepare all students to become college and career
ready, high expectations should be set and ongoing support and guidance must be given
collaboratively through comprehensive school counseling programs (Carey & Dimmitt, 2012;
Lapan, 2012; College Board, 2010; Coleman, 1988). Particularly, to design and lead
comprehensive school counseling programs, school counselors should also act as leaders,
advocates, consultants, coordinators, collaborators, managers of resources, and facilitators so all
students can be college and career ready regardless of their gender, ethnicity, race, socio-
economic, or family background (Dahir & Stone, 2012).
This study provides insight into what needs to be done to help disadvantaged students get
ready for college, get into college, succeed in college, and graduate from college. The American
education system faces huge challenges in providing equal access and opportunities for all
children across the nation because there are significant, and in some cases widening, gaps among
different student populations in terms of college access, retention, and attainment. This study
suggests that the origins of the higher education gap for African American, Hispanic, first
generation, and low-income students is in a lack of human capital and accessing social, cultural,
or financial capitals. This current capital inequality causes disadvantaged students to fall behind
in college readiness, access, persistence, and attainment. The researcher considers this gap in
college access and success as a social justice issue that needs to be addressed. Comprehensive
counseling programs such as CRASP that increase access to these capitals provide promise for
reducing the gap in college readiness, pursuit and access.

IMPROVING COLLEGE READINESS, PURSUIT, ACCESS, AND PERSISTENCE OF
DISADVANTAGED STUDENTS
162
When all things are taken into consideration, to improve disadvantaged students’ college
readiness, pursuit, access, and persistence, school counselors, administrators, and all other key
stakeholders must work collaboratively address this inequality in our public schools system. It
appears that comprehensive counseling programs have the capacity to improve students’ college
readiness, pursuit and access by offering systemic interventions. To do this, however, national
and state officials must mandate all urban high schools to implement comprehensive counseling
programs such as CRASP which has four major components: (1) program foundation, (2)
systemic delivery system, (3) program management system, and (4) shared accountability. With
the contribution of comprehensive school counseling programs, in the near future, America could
regain its leadership in education and once again have the highest proportion of college
readiness, college access, and college graduation in the world.

IMPROVING COLLEGE READINESS, PURSUIT, ACCESS, AND PERSISTENCE OF
DISADVANTAGED STUDENTS
163
REFERENCES
ACT. (2004a). ACT policy report, the role of academic and non-academic factors in improving
college retention, Iowa City, IA: Author.
ACT. (2004b). What works in student retention? (Research Report). Iowa City, IA: Author.
ACT. (2005). National college retention and persistence to degree rates, Iowa City, IA: Author.
Retrieved from www.act.org/research/policymakers/pdf/retain_2005.pdf
ACT. (2007). National college retention and persistence to degree rates, Iowa City: Author.
Retrieved from www.act.org/research/policymakers/pdf/retain_2007.pdf
ACT. (2010). What works in student retention survey? (Research Report). Iowa City, IA: Author.
Retrieved from
http://www.act.org/research/policymakers/pdf/droptables/AllInstitutions.pdf
Adelman, C. (1999). Answers in the toolbox: Academic intensity, attendance patterns, and
bachelor's degree attainment. (PLLI 1999–8021). Washington, DC: U.S. Department of
Education.
Adelman, C. (2006). The toolbox revisited: Paths to degree completion from high school through
college. Washington, D.C.: U.S. Department of Education. Retrieved from
www.ed.gov/rschstat/research/pubs/toolboxrevisit/index.html
Altbach, P. G., Berdhal R. O., Gumport, P. J., (2005). Harsh realities: The professoriate faces a
new century. In P. G. Altbach, R. O. Berdahl & P. J. Gumport (Eds.), American Higher
Education in The Twenty-First Century: Social, Political, and Economic challenges (pp.
287-314). Baltimore, MD: Johns Hopkins University Press.
American Council on Education (2006). Missed opportunities: Students who do not apply for
financial aid. ACE Center for Policy Analysis and American Council on Education Issue
Brief. Retrieved from http://www.nassgap.org/library/docs/missed_opps_revisited.pdf
IMPROVING COLLEGE READINESS, PURSUIT, ACCESS, AND PERSISTENCE OF
DISADVANTAGED STUDENTS
164
American Institutes for Research, and SRI International (2009). Fifth annual early college high
school initiative evaluation synthesis report six years and counting: The ECHSI matures.
Retrieved from http://www.air.org/files/ECHSI_Eval_Report_2009_081309.pdf
American School Counselor Association. (2005). The ASCA national model: A framework for
school counseling programs (2nd ed.). Alexandria, VA: Author.
American School Counselor Association. (2012). The ASCA national model: A framework for
school counseling programs (3rd ed.). Alexandria, VA: Author.
Archibald. R. B. (2002). Redesigning the financial aid system: Why colleges and universities
should switch roles with the federal government. Baltimore, MD: The Johns Hopkins
University Press.
Arnold, A. (1999). Retention and persistence in postsecondary education a summation of
research studies. Texas Guaranteed Student Loan Corporation. Retrieved from
http://www.tgslc.org/pdf/persistence.pdf
Astin, A.W. (1984). Student involvement: A developmental theory for higher education. Journal
of College Student Personnel, 25, 297-308.
Avery, C. (2010). The effects of college counseling on high-achieving, low income students.
National Bureau of Economic Research Working Paper No.16359. Retrieved from
http://www.nber.org/papers/w16359
Baker, R. W. & Siryk, B. (1984). Measuring adjustment to college. Journal of Counseling
Psychology, 31, 179-189.
Baker, R. W. & Siryk, B. (1989). Student adaptation to college questionnaire manual. Los
Angeles, CA: Western Psychological Services.

IMPROVING COLLEGE READINESS, PURSUIT, ACCESS, AND PERSISTENCE OF
DISADVANTAGED STUDENTS
165
Baker, S. B. (2000). School counseling for the twenty-first century. Upper Saddle River, NJ:
Prentice-Hall.
Bailey, T. R. (2001). Community colleges in the 21st century: challenges and opportunities.
Paper presented at Workshop on the Impact of the Changing Economy on the Education
System. National Academy of Sciences,Washington DC.
Baum, S. & Payea, K. (2004). Education pays: The benefits of higher education for individuals
and society. Washington, DC: College Board.
Beal, P. E., & Noel, L. (1980). What works in student retention? Iowa City, Iowa: American
College Testing Program.
Berkner, L. K., & Chavez, L. (1997). Access to postsecondary education for the 1992 high
school graduates. (Statistical Analysis Report, NCES 98-105). Washington, DC: U.S.
Department of Education, Office of Educational Research and Improvement, National
Center for Education Statistics.
Berends, M. (2006). Survey Research Methods in Educational Research. In J. Green, G. Camilli,
& P. Elmore (Eds.), Handbook of Complementary Methods for Research in Education
(pp. 623-640). Mahwah, NJ: Lawrence Erlbaum Associates.
Bettinger, E. P., Long, B. T., Oreopoulos, P. & Sanbonmatsu, L. (2009). The role of
simplification and information in college decisions. Cambridge, MA: National Bureau of
Economic Research.
Bourdieu, P. (1986). The forms of capital. In J. G. Richardson (Ed.), Handbook of Theory and
Research for the Sociology of Education, (pp. 241-258). New York, NY: Greenwood
Press.

IMPROVING COLLEGE READINESS, PURSUIT, ACCESS, AND PERSISTENCE OF
DISADVANTAGED STUDENTS
166
Brigman, G., & Campbell, C. (2003). Helping students improve academic achievement and
school success behavior. Professional School Counseling, 7, 91-98.
Brown, D., & Trusty, J. (2005). Designing and leading comprehensive school counseling
programs: Promoting student competence and meeting student needs. Belmont, CA:
Thomson Brooks/Cole.
Bui, K.V.T. (2002). First-generation college students at a four-year university: Background
characteristics, reasons for pursuing higher education, and first-year experiences. College
Student Journal, 36, 3-11
Burnham, J. J., & Jackson, C. M. (2000). School counselor roles: Discrepancies between actual
practice and existing models. Professional School Counseling, 4(1), p.41.
Cabrera, A. F., Burkum, K. R. & La Nasa, S. M. (2005). Pathways to a four year degree:
Determinants of transfer and degree completion. In A. Seidman (Ed.). College Student
Retention: A Formula for Student Success (pp. 155-209). Santa Barbara, CA:
ACE/Praeger series on Higher Education
Cabrera, A. F. and La Nasa, S. M. (2003). Hispanics in higher education. In J. Forest & K.
Kinser (Eds.). Higher Education in the United States: An Encyclopedia Santa Barbara,
CA: ABC-CLIO.
Callan, P. M., Finney, J. E., Kirst, M. W., Usdan, M. D. & Venezia, A. (2006). Claiming
common ground: State policymaking for improving college readiness and success. San
Jose, CA: The Institute for Educational Leadership, The National Center for Public
Policy and Higher Education, The Stanford Institute for Higher Education Research
Campbell, C. A., & Dahir, C. A. (1997). Sharing the vision: The ASCA National Standards for
School Counseling Programs. Alexandria, VA: American School Counselor Association.

IMPROVING COLLEGE READINESS, PURSUIT, ACCESS, AND PERSISTENCE OF
DISADVANTAGED STUDENTS
167
Carbonaro, W. J. (1998). A little help from my friend's parents: Intergenerational closure and
educational outcomes. Sociology of Education, 71, 295-313.
Carey, J. C., & Dimmitt, C. (2012). School counseling and student outcomes: Summary of six
statewide studies, Professional School Counselor, 16(2), 146-153. DOI:
10.5330/PSC.n.2012-16.146
Carnevale, A. P., Jayasundera, T., & Cheah, B. (2012). The college advantage: weathering the
economic storm. Washington, DC: Georgetown University Center on Education and the
Workforce. Retrieved from http://cew.georgetown.edu/collegeadvantage/
Carnevale, A. P., Jayasundera, T. & Hanson R. (2012). Five education and training pathways
that pay along the way to the B.A. Washington, DC: Center on Education and the
Workforce, Georgetown University.
Carnevale, A. P. & Rose, S. J. (2011). Career technical education & career pathways.
Washington, DC: Georgetown University Center on Education and the Workforce.
Carnevale, P. A., Rose, S. J. and Cheah, B. (2011). The college payoff: education, occupations,
and lifetime earnings. Washington, DC: Georgetown University Center on Education and
the Workforce.
Cates, J., & Schaefle, S. (2011). Examining the relationship between key elements of a college
preparation program and the college readiness of at risk students. Journal of Latinos and
Education 10(4) 320-334.
Chata, C. C., & Loesch, L. C. (2007). Future school principals’ views of the roles of professional
school counselors. Professional School Counseling, 11, 35-41
Choy, S. P. (2001). Students whose parents did not go to college: Postsecondary access,
persistence, and attainment (NCES 2001-126). Washington, DC: U.S. Department of

IMPROVING COLLEGE READINESS, PURSUIT, ACCESS, AND PERSISTENCE OF
DISADVANTAGED STUDENTS
168
Education, National Center for Education Statistics. Retrieved from
http://nces.ed.gov/pubs2001/2001126.pdf
College Board. (2010). The eight components of college and career readiness counseling.
Retrieved from
http://media.collegeboard.com/digitalServices/pdf/nosca/10b_2217_EightComponents_
WEB_100625.pdfCollege Board (2011).
College Board. (2012). SAT® report: Only 43 percent of 2012 college-bound seniors are college
ready. Retrieved from http://press.collegeboard.org/releases/2012/sat-report-only-43-
percent-2012-college-bound-seniors-college-ready
College Board. (2013) College-bound seniors: Total group profile [national] report, selected
years, 1986-87 through 2009-10. Retrieved from
http://professionals.collegeboard.com/data-reports-research/sat/cb-seniors-2010.
Coleman, J. S. (1988). Social capital in the creation of human capital. American Journal of
Sociology, 94, S95-S120.
Conley, D. T. (2007). Toward a comprehensive conception of college readiness. Eugene, OR:
Educational Policy Improvement Center.
Cooper, H. (1998) Synthesizing research: A guide for literature reviews, (3rd ed.). Thousand
Oaks, CA: Sage Publications.
Crockett, D. S., Habley, W. R., Cowart, S. C. (1987). The ACT national survey of academic
advising: Preliminary report. Iowa City, IA: American College Testing Program.
Dahir, C., & Stone, C. (2003). Accountability: A M.E.A.S.U.R.E. of the impact school
counselors have on student achievement. Professional School Counseling, 6, 214-221.

IMPROVING COLLEGE READINESS, PURSUIT, ACCESS, AND PERSISTENCE OF
DISADVANTAGED STUDENTS
169
Dahir, C. A. & Stone, C. B. (2012). The transformed school counselor, (2nd ed.). Thousand
Oaks, CA: Brooks/Cole.
DeWitt Wallace-Reader’s Digest Fund. (1997). Recruiting, preparing, and retaining teachers for
American’s schools: Progress report--Pathways to Teaching Careers. New York, NY:
DeWitt Wallace- Pathways Reader’s Digest Fund
Dumais, S., (2002) Cultural capital, gender, and school success: The role of habitus. Sociology of
Education, 75(1), 44–68.
Dynarski, S. M., & Scott-Clayton, J. E. (2007). Pell grants on a postcard: A proposal for simple
and predictable federal student aid. Hamilton Project Discussion Paper. Washington,
D.C. The Brookings Institution. Retrieved from
http://users.nber.org/~dynarski/200702dynarski-scott-clayton.pdf
Feller, R. W. (2003). Aligning school counseling, the changing workplace, and career
development assumptions. Professional School Counseling, 6(4), 262–271.
Fenske, R. H., Geranios, C. A., Keller, J. E., & Moore, D. E. (1997). Early intervention
programs: Opening the door to higher education (ASHE-ERIC Higher Education Report
Vol. 25, No. 6). Washington, DC: George Washington University, Graduate School of
Education and Human Development.
Folkman, S., Lazarus, R. S., Dunkel-Schetter, C., DeLongis, A., & Gruen, R. (1986). The
dynamics of a stressful encounter: Cognitive appraisal, coping and encounter outcomes.
Journal of Personality and Social Psychology, 50, 992-1003.
Fullan, M. (2007). The new meaning of educational change (4th ed.). New York, NY: Teachers
College Press.

IMPROVING COLLEGE READINESS, PURSUIT, ACCESS, AND PERSISTENCE OF
DISADVANTAGED STUDENTS
170
Fuhrman, S. (2003). Riding waves, trading horses. The twenty-year effort to reform education. In
D. T. Gordon (Ed.), A Nation Reformed? American Education 20 Years After A Nation At
Risk (pp. 7-22).Cambridge, MA: Harvard Education Press.
Gamoran, A., Lopez Turley, R. N., Turner, A., & Fish, R., (2011). Effects of a multi-family
intervention on social capital and child outcomes. Evanston, IL: Society for Research On
Educational Effectiveness.
Gandara, P. & Bial, D. (2001). Paving the way to postsecondary education: K-12 interventions
for underrepresented youth. Washington, DC: National Center for Education Statistics.
Gordon, F. L. (1998). A study of non-cognitive variables and perception of alienation for
minority students at three 2-year colleges. (Unpublished doctoral dissertation). Rutgers
University, New Brunswick, NJ.
Gladieux, L., & Swail, W. S. (1999). Financial aid is not enough: Improving the odds for
minority and low-income students. In J. E. King (Ed.), Financing A College Education:
How It Works, How It’s Changing (pp. 177-197). Phoenix, AZ: Oryx Press.
Goldin, C. D., & Katz, L. F. (2008). The race between education and technology. Cambridge,
MA: Belknap/Harvard University Press.
Green, S. B., & Salkind, N. J. (2008). Using SPSS: Analyzing and understanding data. Upper
Saddle River, NJ: Pearson Education, Inc.
Griffin, K., Allen, W., Kimura-Walsh, E., & Yamamura, E. K. (2007). Those who left, those
who stayed: Exploring the educational opportunities of high achieving black and Latina/o
students at magnet and nonmagnet Los Angeles high schools (2001-2002). Educational
Studies, 42, 229-247.
IMPROVING COLLEGE READINESS, PURSUIT, ACCESS, AND PERSISTENCE OF
DISADVANTAGED STUDENTS
171
Grodsky, E; & Jones, M. (2004). Real and imagined barriers to college entry: Perceptions of
cost. Retrieved from http://escholarship.org/uc/item/7v87v3j0
Gysbers, N. C. (2001). School guidance and counseling in the 21st century: Remember the past
into the future. Professional School Counseling, 5(2), 96.
Gysbers, N. C., & Henderson, P. (2012). Developing and managing your school guidance
program. Alexandria, VA: American Counseling Association.
Habley, W. R. (2004). The status of academic advising: Findings from the ACT sixth national
survey (Monograph No. 10). Manhattan, KS: National Academic Advising Association.
Harper, S. R., Patton, L. D., & Wooden, O. S. (2009). Access and equity for African American
students in higher education: A critical race historical analysis of policy efforts. Journal
of Higher Education, 80(4), 389-414.
Harvard Summer School (2013), Secondary School Program. Retrieved from
http://www.summer.harvard.edu/programs/secondary-school
Hart, P. (2005). Rising to the challenge: Are high school graduates prepared for college and
work? Washington, DC: Achieve Inc.
Hochschild J. L & Powell B. M. (2008). Racial reorganization and the United States Census
1850-1930: Mulattoes, half-breeds, mixed parentage, hindoos, and the mexican race.
Studies in American Political Development, 22(1), 59-96.
Hooker, S., & Brand, B. (2010). College knowledge: A critical component of college and career
readiness. New Directions For Youth Development, 127, 75-85.
Holcomb-McCoy, C. (2007). School counseling to close the achievement gap: A social justice
framework for success. Thousand Oaks, CA: Corwin Press.

IMPROVING COLLEGE READINESS, PURSUIT, ACCESS, AND PERSISTENCE OF
DISADVANTAGED STUDENTS
172
Holcomb-McCoy, C. (2010). Involving low income parents and parents of color in college
readiness activities: An exploratory study. Professional School Counseling, 14(1), 115-
124.
Hodkinson, H. L. (1992). A demographic look at tomorrow. Washington, DC: Institute for
Educational Leadership Inc./Center for Demographic Policy.
Horn, L., & Nunez, A. (2000). Mapping the road to college: First-generation students’ math
track, planning strategies, and context of support. Washington, DC: National Center for
Education Statistics.
Howard, T. C. (2003) A tug of war for our minds: African American High School students’
perceptions of their academic identities and college aspirations. The High School Journal,
87(1), 4-17.
Hossler, D., Schmit, J., & Vesper, N. (1999). Going to college. How social, economic, and
educational factors influence the decisions students make. Baltimore, MD: Johns
Hopkins University Press.
Ishitani, T. T., & DesJardins, S. L. (2002, June). A longitudinal investigation of dropout from
college in the United State. Paper presented at the AIR 42nd Annual Forum, Toronto,
Canada.
Jimerson, S. R. (2001). Meta-analysis of grade retention research: Implications for practice in the
21st century. School Psychology Review, 30, 313-330.
Kim, D., & Schneider, B. (2005). Social capital in action: Alignment of parental support in
adolescents’ transition to postsecondary education. Social Forces, 84(2), 1181–1206.
Kim, E., Newton, F., Downey, R., & Benton, S. (2010). Personal Factors Impacting College
Student Success. College Student Journal, 44(1), 112-125

IMPROVING COLLEGE READINESS, PURSUIT, ACCESS, AND PERSISTENCE OF
DISADVANTAGED STUDENTS
173
Kluger, R. (1975). Simple justice: The history of Brown v. Board of Education and Black
America's struggle for equality. New York: Knopf
Krathwohl, D. R., & Smith, N. L. (2005). How to prepare a dissertation proposal: Suggestions
for students in education and the social and behavioral sciences. Syracuse, NY: Syracuse
University Press.
Ladson-Billings, G. (1999) Preparing teachers for diverse populations: A critical race theory
perspective, Review of Research in Education, 24, 211–247.
Lapan, R. T., Gysbers, N. C., & Petroski, G. F. (2001). Helping seventh graders be safe and
successful: A statewide study of the impact of comprehensive guidance and counseling
programs. Professional School Counseling, 6(3), 186-198.
Lapan, T. R. (2012). Comprehensive School Counseling Programs: In Some Schools for Some
Students But Not in All Schools for All Students. Professional School Counselor, 16(2),
DOI: 10.5330/PSC.n.2012-16.84
Lareau, A. (2003), Unequal childhoods, Berkeley, CA: University of California Press.
Lawson, L. J. (2011). AVID Participation for College Readiness and Success, (Unpublished
Doctoral Dissertation). California State University, Sacramento, CA.
Lazerson, M. (1998). The disappointments of success: Higher education after World War II.
Annals of The American Academy of Political and Social Science, 559, 64-76.
Litwin, M. (1995). How to measure survey reliability and validity. Thousand Oaks, CA: Sage
Publications.
Lotkowski, V. Robbins, S., & Noeth, R. (2004) The role of academic and non-academic factors
in improving college retention, Retrieved from www.atc.org/research/policy/index.htlm

IMPROVING COLLEGE READINESS, PURSUIT, ACCESS, AND PERSISTENCE OF
DISADVANTAGED STUDENTS
174
Mahoney, J. S.,& Merritt, S. R.(1993). Educational hope of black and white high school seniors
in Virginia. Journal of Educational Research, 87(1), 31.
Martinez, M., & Klopott, S. (2005). The link between high school reform and college access and
success for low-income and minority youth. Washington, DC: American Youth Policy
Forum and Pathways to College Network.
McDonough, P. M. (1997). Choosing colleges: How social class and schools structure
opportunity. Albany: SUNY Press.
McGannon, W., Carey, J., & Dimmitt, C. (2005). The current status of school counseling
outcome research (Research Monograph No. 2). Amherst, MA: University of
Massachusetts, Center for School Counseling Outcome Research.
McMahon, W. W. (2009). Higher learning, greater good: The private and social benefits of
higher education. Baltimore, MD: Johns Hopkins University Press.
Myers, D. & Schirm, A. (2009). The Impacts of Upward Bound: Final Report on Phase I of the
National Evaluation. Retrieved from http://www.ed.gov/offices/OUS/PES
/higher/upward.pdf
National Center for Education Statistics. (2001). Digest of education statistics. Washington, DC:
U.S. Department of Education.
National Center for Education Statistics. (2002). Descriptive summary of 1995-96 beginning
postsecondary students. (NCES 2003-151). Washington, DC: U.S. Department of
Education. Retrieved from http://nces.ed.gov/pubs2003/2003151.pdf.
National Center for Educational Statistics. (2008a). America’s high school graduates: Results
from the2005 NAEP high school transcript study. Washington, DC: U.S. Department of
Education.

IMPROVING COLLEGE READINESS, PURSUIT, ACCESS, AND PERSISTENCE OF
DISADVANTAGED STUDENTS
175
National Center for Education Statistics. (2008b). Digest of education statistics. Washington,
DC: Department of Education.
National Center for Education Statistics. (2010). 2002 Educational Longitudinal Study: Second
follow-up. Washington, DC: Author.
National Center for Education Statistics. (2011a). Degrees conferred by public and private
institutions. Washington, DC: U.S. Department of Education. Retrieved from
http://nces.ed.gov/programs/coe/indicator_dai.asp
National Center for Education Statistics. (2011b). Postsecondary institutions and price of
attendance in the United States: 2010–11, degrees and other awards conferred: 2009–10,
and 12-month enrollment: 2009–10. Washington, DC: U.S. Department of Education.
Retrieved from http://nces.ed.gov/pubs2011/2011250.pdf
National Center for Education Statistics. (2011c). Projections of education statistics to 2020.
Washington, DC: U.S. Department of Education. Retrieved from
http://nces.ed.gov/programs/projections/projections2020/figures/figure_01.asp?referrer=li
st
National Center for Education Statistics. (2011d). Tuition and fees, student loans, and default
rates. Washington, DC: U.S. Department of Education. Retrieved from
http://nces.ed.gov/programs/coe/indicator_tld.asp.
National Center for Education Statistics. (2012a). Annual earnings of young adults. Washington,
DC: U.S. Department of Education. Retrieved from
http://nces.ed.gov/programs/coe/indicator_er2.asp

IMPROVING COLLEGE READINESS, PURSUIT, ACCESS, AND PERSISTENCE OF
DISADVANTAGED STUDENTS
176
National Center for Education Statistics. (2012b). Characteristics of undergraduate institutions.
Washington, DC: U.S. Department of Education. Retrieved from
http://nces.ed.gov/programs/coe/indicator_psi.asp.
National Center for Education Statistics. (2012c). Educational attainment. Washington: U.S.
Department of Education. Retrieved from
http://nces.ed.gov/programs/coe/indicator_eda.asp
National Center for Education Statistics. (2012d). Elementary and secondary education.
Washington, DC: U.S. Department of Education. Retrieved from
http://nces.ed.gov/programs/coe/tables/table-lrs-1.asp
National Center for Educational Statistics. (2012e). Postsecondary graduation rates.
Washington, DC: U.S. Department of Education. Retrieved from
http://nces.ed.gov/programs/coe/indicator_pgr.asp.
National Center for Education Statistics. (2012f). Price of attending an undergraduate
institution. Washington, DC: U.S. Department of Education. Retrieved from
http://nces.ed.gov/programs/coe/indicator_cst.asp
National Center for Education Statistics. (2012g). Postsecondary graduation rates. Washington,
DC: U.S. Department of Education. Retrieved from
http://nces.ed.gov/programs/coe/indicator_pgr.asp
National Center for Education Statistics. (2012h). Public high school retention rates.
Washington, DC: U.S. Department of Education. Retrieved from
http://nces.ed.gov/programs/coe/indicator_lrs.asp#info.

IMPROVING COLLEGE READINESS, PURSUIT, ACCESS, AND PERSISTENCE OF
DISADVANTAGED STUDENTS
177
National Center for Education Statistics. (2012i). Undergraduate enrollment. Washington, DC:
U.S. Department of Education. Retrieved from
http://nces.ed.gov/programs/coe/indicator_hep.asp
National Commission on Excellence in Education (1983). A Nation at Risk: The Imperative for
Educational Reform. A Report to the Nation and the Secretary of Education United
States Department of Education. Retrieved from
http://www2.ed.gov/pubs/NatAtRisk/index.html
New Jersey Administrative Code 6A:8. (2012) standards and assessment for student
achievement. Retrieved from
http://www.state.nj.us/education/code/current/title6a/chap8.pdf
New Jersey Department of Education. (2013). A Guide for implementing for PSLP Retrieved
from http://www.state.nj.us/education/ser/pslp/PSLPGuide.pdf
NJSMART. (2012). Student performance. The official web site for the State of New Jersey.
Retrieved from http://www.nj.gov/education/njsmart/performance/
The Organization for Economic Co-operation and Development. (2006). Education at a Glance.
Retrieved from http://www.oecd.org/education/skills-beyond-
school/educationataglance2006-tables.htm
Paulsen, M. B., & St. John, E. P. (2002). Social class and college costs: Examining the financial
nexus between college choice and persistence. The Journal of Higher Education, 73(2),
189–239.
Pérez, P. A. & McDonough, P. M. (2008). Understanding Latina and Latino college choice: A
social capital and chain migration analysis. Journal of Hispanic Higher Education 7(3):
249-265

IMPROVING COLLEGE READINESS, PURSUIT, ACCESS, AND PERSISTENCE OF
DISADVANTAGED STUDENTS
178
Perna, L.W. (2000). Differences in the decision to enroll in college among African Americans,
Hispanics, and Whites. Journal of Higher Education, 71, 117-141.
Perna, L. W., & Titus, M. (2005). The relationship between parental involvement as social
capital and college enrollment: An examination of racial/ethnic group differences.
Journal of Higher Education, 76, 485-518.
Perna, L. W., & Swail, W. S. (2002). Pre-college outreach and early intervention programs. In D.
E. Heller (Ed.), Condition of Access: Higher Education For Lower Income Students (pp.
97-112). Westport, CT: Praeger Publishers.
Pitre, P. E. (2006). College choice: A study of African American and White students’ aspirations
and perceptions related to college attendance. College Student Journal, 40(3) 562-574.
Portes, A. (1998). Social Capital: Its Origins and Applications in Modern Sociology. Annual
Review of Sociology 24, 1-24.
Psacharopoulos, G., & Patrinos, H. A. (2004). Returns to investment in education: A further
update. Education Economics 12. 111-134.
Reese, W. J. (2005) America's public schools from the common school to "No Child Left
Behind". Baltimore: The John Hopkins University Press.
Rossi, P. H., Lipsey, M. W., & Freeman, H. E. (2004). Evaluation: A systematic approach (7th
Ed.). Thousand Oaks, CA: Sage Publications.
Salazar, R. (1997). A social capital framework for understanding the socialization of racial
minority children and youths. Harvard Educational Review, 67, 1-40.
Schott Foundation for Public Education (2010). The Schott 50 state report on public education
and Black males. Retrieved from http://schottfoundation.org/publications/schott-2010-
black-male-report.pdf

IMPROVING COLLEGE READINESS, PURSUIT, ACCESS, AND PERSISTENCE OF
DISADVANTAGED STUDENTS
179
Smith, T. M. (1995). The educational progress of Hispanic students. Findings from "The
condition of education 1995," (No. 4). Washington, DC: National Center for Education
Statistics.
Stillman, M. (2009). Making the case for the importance of student retention. Retrieved from
www.pacrao.org/docs/resources/writersteam/StillmanMakingTheCaseForStudentRetentio
n.pdf
Stone, C., & Dahir, C. (2004). School counselor accountability: A measure of student success.
Upper Saddle River, NJ: Pearson.
Student Tracker for High Schools. (2012). National Student Clearinghouse. Retrieved from
http://www.studentclearinghouse.org/high_schools/studenttracker/
Tannenbaum, A. J. (1958). History of interest in the gifted. In N. B. Henry (Ed.), The fifty-
seventh yearbook of the National Society for the Study of Education (pp. 21–38).
Chicago: University of Chicago Press.
Thayer, P. B. (2000). Retention of students from first generation and low income backgrounds.
Opportunity Outlook, May, 2-8.
Tinto, V. (1975). Dropout from higher education: A theoretical synthesis of recent research.
Review of Educational Research, 45, 89-125.
Tinto, V. (1987). Leaving college: Rethinking the causes and cures of student attrition. Chicago:
University of Chicago Press.
Tyack, D. (1974). The one best system. Cambridge, MA: Harvard University Press.
Toldson, I., Braithwaite, R., & Rentie, R. (2009), Promoting college aspirations among school-
age black American males. Bradford, United Kingdom: Emerald Group Publishing
Limited.
IMPROVING COLLEGE READINESS, PURSUIT, ACCESS, AND PERSISTENCE OF
DISADVANTAGED STUDENTS
180
U.S. Census Bureau. (2002). The big payoff: Educational attainment and synthetic estimates of
work-life earnings. Retrieved from http://www.census.gov/prod/2002pubs/p23-210.pdf
U.S. Department of Education. (2010). A blueprint for reform: The reauthorization of the
Elementary and Secondary Education Act. Washington, DC: Author.
U.S. Department of Education. (2001). No Child Left Behind Act of 2001 (H.R.1). Washington,
DC: Author.
U.S. Department of Education. (2009). Race to the Top Program executive summary. Retrieved
from http://www2.ed.gov/programs/racetothetop/executive-summary.pdf
U.S. Department of Education. (2010). 2003-04 and 2007-08 national postsecondary student aid
study. Retrieved from http://www.census.gov/population/www/socdemo/sch_cost.html
U.S. Department of Education. (2012a). The condition of education 2011 (NCES 2012-045),
Indicator 45. Washington: Author. Retrieved from
http://nces.ed.gov/fastfacts/display.asp?id=40.
U.S. Department of Education. (2012b ). The Census Bureau's annual report on school
enrollments. Retrieved from
http://www.census.gov/population/www/socdemo/school.html
U.S. Department of Education. (2012c). The condition of education 2012 (NCES 2012-045),
Indicator 33.
U.S. Department of Higher Education. (1998). Amendments to the Higher Education Act of 1965.
Retrieved from http://www.ed.gov/policy/highered/leg/hea98/sec701.html
U.S. Department of Labor. (2003). Education pays: Unemployment and earnings for full-time
wage and salary workers age 25 and over, by educational attainment. Retrieved from
http://www.bls.gov/emp/emptab7.htm

IMPROVING COLLEGE READINESS, PURSUIT, ACCESS, AND PERSISTENCE OF
DISADVANTAGED STUDENTS
181
U.S. Council on Competitiveness. (2007). Where America stands. Retrieved from
http://www.compete.org/images/uploads/File/PDF%20Files
Vaughn, I. (2010). Reform in an urban school district: The role of PSAT results in promoting
advanced placement course-taking. Education & Urban Society, 42(4), 394-406.
Watts, A. (2001). Education and the common good. Frankfort, KY: Long-Term Policy Research
Center
White, T. J., & Sedlacek, W. E. (1986). Noncognitive predictors of grades and retention for
specially admitted students. Journal of College Admissions, 3, 20-23.
Williams, A, & Swail, W. S. (2005). Is more better? The impact of postsecondary education on
the economic and social well-being of American society. Washington, DC: Educational
Policy Institute, Inc.
Wittmer, J. (2000). Managing your school counseling program: K-12 developmental strategies
(2nd ed). Minneapolis, MN: Educational Media Corporation.
Zumeta, W., Breneman, D. W. , Callan, P. M. &Finney, J. E (2012). Financing American higher
education in the era of globalization. Cambridge, MA: Harvard Education Press.

IMPROVING COLLEGE READINESS, PURSUIT, ACCESS, AND PERSISTENCE OF
DISADVANTAGED STUDENTS
182
APPENDIX: PCSST ALUMNI SURVEY
Hi PCSST Graduates,
This is Mr. Yavuz, the college guidance counselor.
PCSST school counseling department is looking for ways to help more students in going
to college. We need your help so we can do a better job. I will be glad, if you can respond to the
items on this alumni survey honestly and as accurately as possible. We will use this information
to better serve our students.
If every class helps us out this way, imagine how the school will be in a few years! The
information you supply on this survey will be kept confidential. Your name is requested for
research purposes only and will not be listed on any report. You may choose not to participate,
and you may withdraw at any time during the study procedures. In addition, you may choose not
to answer any questions with which you are not comfortable. Thanks for your collaboration
SECTION I—BACKGROUND INFORMATION and COLLE DATA
1. My name is______________________________ and graduated in ______ (year).
2. After high school, I enrolled in: Vocational/Technical School___, Two-Year College___,
Four-Year College___, Military School___ , Did not enroll in any Post-Secondary
Institution___, College but then I dropped out from college____.
3. The highest level of education my family/parent has: Elementary School___, Middle
School___, High School___ Vocational School___, Military School___, 2 Year College___,
Four-Year College___, Master Degree___, Doctoral Degree___, Did not go to school___
4. How many colleges did you apply in your senior year?______________________
5. Did you complete the FAFSA application? _______________________________
6. After you completed your first year in college, have you enrolled for a second year?
___________
SECTION II—THE IMPACT OF HIGH SCHOOL PROGRAMS ON GETTING READY
FOR COLLEGE
Please indicate if you participated in the following when you were in high school.

IMPROVING COLLEGE READINESS, PURSUIT, ACCESS, AND PERSISTENCE OF
DISADVANTAGED STUDENTS
183
Offered Programs, Services and Interventions Did you participate?
YES NO
1. Individual Student Learning & Intervention Plan Yes No
2. College Dual Enrollment Program Yes No
3. After School or Saturday School Teacher Tutoring Yes No
4. Peer Tutoring Yes No
5. SAT Prep Program Yes No
6. SAT Elective Courses (Credit) Yes No
7. Accuplacer Test Preparation in Grade 12 Yes No
8. Honor Level Courses Yes No
9. Individual College and Career Counseling Sessions Yes No
10. Classroom Workshops Yes No
11. Instant Decision Days Yes No
12. College Fairs and College Trips Yes No
13. Parent and Counselor Meetings Yes No
14. High School Recognition/Rewards Program Yes No
15. Career Fairs Yes No
16. One on One FAFSA Application Support Yes No
17. The Home Visitations Yes No
18. Using Fee Waivers Yes No
19. Group Counseling Sessions Yes No
PLEASE COMPLETE THE NEXT SECTIONS, IF YOU HAVE ATTENDED/ ARE ATTENDING
A POST-SECONDARY INSTITUTION
SECTION III: CHALLENGES WHILE ATTENDING COLLEGE

IMPROVING COLLEGE READINESS, PURSUIT, ACCESS, AND PERSISTENCE OF
DISADVANTAGED STUDENTS
184
This section contains a list of student and institutional factors that can affect students’
college success. Please indicate to what degree does each factor affect your success?
Factors that may affect students’ college success: 1: Main Challenge
2: Moderate Challenge
3: Minor Challenge
4: Not Challenge
1. Financial Problems 1 2 3 4
2. Attendance Problems 1 2 3 4
3. Lack of Time Management and Study Skills 1 2 3 4
4. Negative Peer Influence 1 2 3 4
5. Lack of Parent Support 1 2 3 4
6. Low level of Commitment to Earn a College Degree 1 2 3 4
7. Having a Job 1 2 3 4
8. Family Problems 1 2 3 4
9. Transportation Problems 1 2 3 4
10. Pregnancy/Child 1 2 3 4
11. Health Problems 1 2 3 4
12. Taking Remedial Courses 1 2 3 4
13. Adjustment Problems 1 2 3 4
14. Home Sick 1 2 3 4
15. Unavailability of Support at College 1 2 3 4
16. Failing Grades in College 1 2 3 4
17. If you dropped out of college, please can you select the reason?
1. Financial Issues______
2. Pregnancy/Parenting______
3. Lost Interest in College_____
4. Academic Problems______
5. Other Personal Problems_____
SECTION IV—THE IMPACT OF COLLEGE EXPERIENCES ON STUDENTS
Listed below is a series of academic and counseling programs, services, and interventions that are
possibly offered by your college.

IMPROVING COLLEGE READINESS, PURSUIT, ACCESS, AND PERSISTENCE OF
DISADVANTAGED STUDENTS
185
Please indicate if you participated in the support program at your college.
Academic and Counseling Programs, Services and
Interventions
Did You
Participate?
NO YES
1. Individual Academic Advising No Yes
2. College Instructors’ Office Hours No Yes
3. Tutoring and Academic Support Services No Yes
4. Peer Tutoring No Yes
5. Personal Counseling Services No Yes
6. Financial Aid Counseling No Yes
7. Clubs and Extracurricular Activities No Yes
8. College Summer Programs No Yes
9. Orientation and Information Sessions No Yes
10. Educational Opportunity Fund (EOF) Program No Yes
11. Freshman Seminars No Yes
12. Remedial Courses No Yes
13. Career Center No Yes