OKLAHOMA UNEMPLOYMENT INSURANCE TAX RATES
31
Transcript of OKLAHOMA UNEMPLOYMENT INSURANCE TAX RATES


OKLAHOMA UNEMPLOYMENT INSURANCE TAX RATES BY INDUSTRY, ESTABLISHMENT SIZE AND COUNTY
1st QUARTER 2013 to 1st QUARTER 2018
Oklahoma Employment Security Commission
Richard McPherson, Executive Director
Economic Research and Analysis Division Lynn Gray, Director & Chief Economist
Prepared by
Shirley Zhang, Programs Manager Monty Evans, Senior Economist
Will Rogers Memorial Office Building
Economic Research and Analysis Division, 4th Floor N P.O. Box 52003
Oklahoma City, OK 73152-2003 Phone: (405) 557-7172
Fax: (405) 525-0139
E-mail: [email protected]
February 2019
This publication is issued and is part of the activities of the Oklahoma Employment Security Commission as authorized by the Oklahoma Employment
Security Act. An electronic copy has been deposited with the Publishing Clearinghouse of the Oklahoma Department of Libraries
Equal Opportunity Employer/Program
Auxiliary aids and services are available upon request for individuals with disabilities

TABLE OF CONTENTS
INTRODUCTION Map 1: 2018 State Unemployment Insurance (UI) Trust Fund Solvency Levels.............................................….….1 Table 1: 2008-2019 Oklahoma Taxable Wage Base and Tax Rate Ranges for Employers…..………...……………………….2 Chart 1: Oklahoma Unemployment Insurance Benefits Paid Out, 2008-2018……………….......................………………...3 Chart 2: Oklahoma UI Contributions, Benefits, and Unemployment Rates, 2008-2018………………..……………………....4 Chart 3: Oklahoma UI Trust Fund Balance and Unemployment Rates, 2008-2018.............................................….…5
SECTION I: INDUSTRY CHARTS Chart 1: Oklahoma Unemployment Insurance Contributions by Industry, 1st Quarter 2013…….....…………….6 Chart 2: Oklahoma Paid UI Tax Rates by Industry, 1st Quarter 2013…..……………………………….....………………….7 Chart 3: Oklahoma Unemployment Insurance Contributions by Industry, 1st Quarter 2018……......……………8 Chart 4: Oklahoma Paid UI Tax Rates by Industry, 1st Quarter 2018..……….........................................………….9 Chart 5: Change in Oklahoma UI Contributions by Industry, 1st Quarter 2013 to 1st Quarter 2018.....10 Chart 6: Change in Oklahoma UI Tax Rates by Industry, 1st Quarter 2013 to 1st Quarter 2018.............11
SECTION II: ESTABLISHMENT SIZE CHARTS Chart 1: Oklahoma Unemployment Insurance Contributions by Size, 1st Quarter 2013…..…….....….............……12 Chart 2: Oklahoma Paid UI Tax Rates by Size, 1st Quarter 2013………....……………………..…………...........……………13 Chart 3: Oklahoma Unemployment Insurance Contributions by Size, 1st Quarter 2018……...........…….......……14 Chart 4: Oklahoma Paid UI Tax Rates by Size, 1st Quarter 2018…………………………...............…………………………15 Chart 5: Change in Oklahoma UI Contributions by Size, 1st Quarter 2013 to 1st Quarter 2018…............…16 Chart 6: Change in Oklahoma UI Tax Rates by Size, 1st Quarter 2013 to 1st Quarter 2018…....................17
SECTION III: STATEWIDE MAPS Map 1: Unemployment Insurance Contributions by County, 1st Quarter 2013…………..........………….................18 Map 2: Unemployment Insurance Paid Tax Rates by County, 1st Quarter 2013….........………………...................19 Map 3: Unemployment Insurance Contributions by County, 1st Quarter 2018….........…………………..................20 Map 4: Unemployment Insurance Tax Rates by County, 1st Quarter 2018……..…………..........………....................21 Map 5: Change in UI Contributions by County, 1st Quarter 2013 to 1st Quarter 2018…......………………….....22 Map 6: Difference in UI Paid Tax Rates by County, 1st Quarter 2013 to 1st Quarter 2018……..………….......23

INTRODUCTION

Page 1
At the beginning of 2018, twenty-four states including Oklahoma reached what is considered the minimal level of adequate UI fund solvency.
• In the 2007-09 recession and its aftermath, 36 states depleted their unemployment insurance (UI) funds and were forced to take advances from the Federal government to continue paying benefits.
• Oklahoma’s level of adequate solvency was 1.69 (values greater than one are considered the minimum level for adequate state solvency), and ranked the eighth highest in the nation.
• For 2018, thirty states met the eligibility criteria for interest-free borrowing.

Page 2
UI taxes paid by employers on employee wages flow into the state’s UI Trust Fund and are the source of benefit payments to eligible claimants.
• Only that portion of employee earnings up to the taxable wage base are subject to UI taxes. The percentage of total wages taxed changes depending upon the conditional factor of the trust fund. Many states (unlike Oklahoma) have fixed taxable wage bases that do not change as wages increase and this has been a significant contributing factor to those funds becoming underfunded and insolvent.
• Oklahoma’s taxable wage base is between 40 and 50 percent of Annual Average Wage depending on the Conditional Factor for the year.
• The employer tax rate is determined based on the employer’s history with the Unemployment Insurance system. That is, employers that have higher UI claims filed by their former employees will pay higher taxes in future years to repay these higher costs.
• Oklahoma’s rate range is between 0.1 and 9.2 percent of Taxable Wage Base depending on Conditional Factor for the year. All new employers have an assigned tax rate of one and one-half percent (1.5%) until sufficient experience history exists.
Category 2008 2009 2010 2011 2012 2013 2014 2015 2016 2017 2018 2019
Conditional Factor NONE NONE NONE D D D B NONE NONE NONE NONE NONE
New Employer Tax Rate 1.5% 1.2% 1.0% 1.0% 1.0% 2.0% 2.4% 2.2% 1.5% 1.5% 1.5% 1.5%
Tax Rate Range 0.1-5.5% 0.1-5.5% 0.1-5.5% 0.3-9.2% 0.3-9.2% 0.3-9.2% 0.2-7.3% 0.1-5.5% 0.1-5.5% 0.1-5.5% 0.1-5.5% 0.1-5.5%
Taxable Wage Base $13,600 $14,200 $14,900 $18,600 $19,100 $20,100 $18,700 $17,000 $17,500 $17,700 $17,600 $18,100
Maximum Weekly Benefit $392 $409 $430 $358 $368 $386 $440 $490 $505 $510 $506 $520
% of Average Weekly Wage 60% 60% 60% 50% 50% 50% 55% 60% 60% 60% 60% 60%
Maximum Benefit Amount $8,500 $8,900 $9,300 $7,400 $7,700 $8,000 $9,400 $10,600 $10,900 $11,100 $11,000 $11,300
% of Average Annual Wage 25% 25% 25% 20% 20% 20% 23% 25% 25% 25% 25% 25%
Taxable Wage Base $13,600 $14,200 $14,900 $18,600 $19,100 $20,100 $18,700 $17,000 $17,500 $17,700 $17,600 $18,100
% of Average Annual Wage 40% 40% 40% 50% 50% 50% 45% 40% 40% 40% 40% 40%
Average Annual Wage $34,005 $35,496 $37,274 $37,246 $38,250 $40,123 $41,630 $42,458 $43,779 $44,276 $43,875 $45,133
Table 1: Oklahoma Taxable Wage Base and Tax Rate Ranges for Employers

Page 3
UI benefits paid out are determined by the number of people laid off, the wages earned and the claims duration.
• Maximum weekly benefit is between 50 and 60 percent of average weekly wage and maximum benefit amount is between 20 to 25 percent of average annual wage.
• Following September 2008, initial claims jumped over 140 percent from almost 9,200 to nearly 22,200 in December 2008.
• UI benefits paid also increased nearly 50 percent from over 16.2 million to almost 23.9 million during the same period.
• The 2015-2016 downturn in the energy sector caused an increase in both claims and benefit payouts.

Page 4
As the unemployment rate goes up and more employees are laid off, benefits paid out increase, lowering the trust fund balance.
• As unemployment rate goes up and more employees are laid off, benefits paid out increase, which lowers the trust fund balance and benefits (past 20 quarters paid) ratio and changes conditional factors from none to A, B, C, and D.
• Employers pay the lowest tax/contribution rates with no conditional factor and highest with Conditional Factor ‘D’.

Fluctuations in statewide unemployment cause Oklahoma’s UI Trust Fund balance to rise and fall with benefit payouts triggering conditional factors.
• The Great Recession took a heavy toll on Oklahoma’s UI Trust Fund, as elevated benefit payouts depleted the trust fund by 75.5 percent from May 2008 to March 2011.
• Due to the sharp drop in the trust fund balance during that time period, Conditional Factor ‘D’ came into effect from 2011 to 2013.
• As the trust fund balance returned to healthy levels by 2014, conditional factors moved to ‘none’ in 2015. However, the 2015-2016 downturn in the energy sector caused an increase in benefit payouts and a decline in the trust fund but not enough of a decline to force the state back into conditional factors.
Page 5

SECTION I: INDUSTRY CHARTS

Manufacturing led all other Oklahoma industries for the highest level of UI contributions in the 1st quarter of 2013.
• Oklahoma uses an experience-rating system to determine the tax/contribution rate for each establishment covered by the Oklahoma Employment Security Act, meaning an employer’s tax rate is based in part on their history with Unemployment.
• During the 1st quarter of 2013, manufacturing paid 17.0 percent of all total contributions while its employment share was only 9.0 percent.
• Health Care and Social Assistance had the largest employment share (13.6 percent) , but only paid 8.6 percent of total contributions. Page 6

Construction had the highest paid UI tax rate among all Oklahoma industries in the 1st quarter of 2013.
• Employer contribution rates are also determined by Conditional Factors, that is a measure of the Unemployment Insurance systems health used to arrive at the employer contribution rate schedule for a given year.
• Conditional Factors range from none (the lowest) to ‘D’ (the highest).
• In 2013, Oklahoma’s Unemployment Insurance system was under the highest Conditional Factor ‘D’.
Page 7

During the 1st quarter of 2018, Manufacturing led all Oklahoma industries for the highest level of UI contributions.
• Manufacturing paid 19.2 percent of all total contributions while its employment share was only 8.7 percent.
• Health Care and Social Assistance had the largest employment share (13.7 percent) , but only paid 6.8 percent of total contributions.
• Mining, Quarrying, & Oil & Gas Extraction and Construction paid 14.7 and 11.4 percent of total contributions respectively while their respective share of employment was 3.2 and 5.1 percent.
Page 8

Mining, Quarrying, & Oil & Gas Extraction had the highest paid UI tax rates among all Oklahoma industries in the 1st quarter of 2018.
• UI tax rates dropped significantly for most industries due to the rate schedule moving from Conditional Factor ‘D’ in 2013 to none in 2018.
• Mining, Quarrying, & Oil & Gas Extraction had the highest UI tax rate among all other industries at 2.3 percent in the 1st quarter of 2018, and was the only industry that had a higher UI tax rate than it did five years ago.
Page 9

The level of employer UI contributions declined for all major Oklahoma industry groups from 1st quarter 2013 to 1st quarter 2018.
• From 1st quarter 2013 to 1st quarter 2018, Manufacturing had the largest drop in UI contributions, tumbling $17,531,346, for a 43.5 percent decline.
• During the same period, Agriculture, Forestry, Fishing and Hunting saw the largest percent decline falling 70.3 percent.
• Educational Services saw the smallest decline in UI contributions, at -$859,574.
Page 10
-$828,930
-$1,680,390
-$1,655,403
-$14,756,358
-$17,531,346
-$6,392,305
-$11,207,764
-$4,024,205
-$4,362,466
-$6,168,626
-$2,444,609
-$8,130,729
-$1,653,300
-$12,415,250
-$859,574
-$12,405,827
-$2,840,442
-$4,931,744
-$2,529,901
-$1,752,068
-20,000,000 -15,000,000 -10,000,000 -5,000,000 0
Agriculture, Forestry, Fishing and Hunting
Mining, Quarrying, and Oil and Gas Extraction
Utilities
Construction
Manufacturing
Wholesale Trade
Retail Trade
Transportation and Warehousing
Information
Finance and Insurance
Real Estate and Rental and Leasing
Professional, Scientific, and Technical Services
Management of Companies and Enterprises
Administrative and Support and Waste Management and…
Educational Services
Health Care and Social Assistance
Arts, Entertainment, and Recreation
Accommodation and Food Services
Other Services (except Public Administration)
Public Administration
Chart 5: Change in Oklahoma UI Contributions by Industry, 1st Quarter 2013 to 1st Quarter 2018

From 1st quarter 2013 to 1st quarter 2018, most major Oklahoma industry groups also saw their UI tax rates decline.
• Construction saw the largest decrease in UI tax rates, declining from a rate of 3.9 percent in 2013 to 1.6 percent in 2018.
• Administrative and Support and Waste Management and Remediation Services and Information also saw significant UI tax rate declines of 2.0 and 1.7 percent respectively.
• Utilities had the smallest decline in UI tax rates and Mining, Quarrying, & Oil & Gas Extraction was the only industry that had a rate increase from 2.1 percent in 2013 to 2.3 percent in 2018.
Page 11

SECTION II: ESTABLISHMENT SIZE CHARTS

In the 1st quarter of 2013, business establishments with 100 to 249 employees paid the highest level of UI contributions.
• The 100 to 249 employee size range of business establishments represented 15.9 percent of total statewide employment and 1.5 percent of total statewide business establishments in the 1st quarter of 2013. However, this size group paid the most contributions: 21.0 percent of total contributions.
• The 1 to 4 employee business establishment size represented 43.8 percent of total establishments, the largest share of total statewide business establishments in the 1st quarter of 2013, but the smallest share of total employment at 5.9 percent. The total contributions paid is only 4.7 percent of total contributions.
Page 12

Business establishments with 100 to 249 employees also paid the highest UI tax rate in the 1st quarter of 2013.
• Business establishments employing 50 to 99 workers paid the second-highest UI tax rate at 2.4 percent in the 1st quarter of 2013.
• The lowest UI tax rate in 1st quarter 2013 was 1.2 percent for business establishments with more than 1,000 employees.
Page 13

In the 1st quarter of 2018, business establishments employing 100 to 249 and 20 to 49 workers paid the highest levels of UI contributions.
• The 20 to 49 employee size range of business establishments represented 17.7 percent of total statewide employment and 8.5 percent of total statewide business establishments in the 1st quarter of 2018. However, this size group paid the second most contributions – 18.7 percent of total contributions. Business establishments employing 100 to 249 workers paid the largest share of the contributions at 19.6 percent with 15.8 percent of total employment and 1.5 percent of total business establishments .
• The 1 to 4 employee business establishment size represented 44.6 percent of total establishments, the largest share of total statewide business establishments in the 1st quarter of 2018, but the smallest share of total employment at 6.0 percent. The total contributions paid was only 5.0 percent of total contributions. Page 14

Business establishments with 50 to 99 and 100 to 249 employees had the highest paid UI tax rate in the 1st quarter 2018.
• Business establishments with 50 to 99 and 100 to 249 employees had the highest paid UI tax rate at 1.2 percent in the 1st quarter 2018. Firms with 20 to 49 and 250 to 499 employees paid contributions at 1 and 1.1 percent UI tax rates respectively.
• The lowest paid UI tax rate was in the 1,000+ employee size range at 0.5 percent in the 1st quarter of 2018.
Page 15

Business establishments employing 100 to 249 workers saw the largest drop in UI contributions from 1st quarter 2013 to 1st quarter 2018.
• From 1st quarter 2013 to 1st quarter 2018, business establishments employing 100 to 249 workers had the largest drop in UI contributions, tumbling $26,637,030 for a 53.4 percent decline.
• During the same period, business establishments employing 500 to 999 workers saw the largest percent decline falling 67.2 percent.
Page 16

Business establishment of every size range saw their UI tax rates decline from 1st quarter 2013 to 1st quarter 2018.
• Business establishment sizes all saw significant UI tax rate declines of 1.1 percent or more except for the size employing 1 to 4 workers and the size employing 1,000 or more.
• Business establishments employing 100 to 249 workers and employing 0 employees saw the largest decreases in UI tax rates, each declining 1.5 percent, from 2.6 percent in 2013 to 1.2 percent in 2018 and from 2.0 percent in 2013 to 1.5 percent in 2018 respectively.
• Business establishments employing 1,000+ workers had the smallest decline in UI tax rates edging down from 1.2 percent in 2013 to 0.5 percent in 2018. Page 17

SECTION III: STATEWIDE MAPS

In 1st quarter 2013, Oklahoma County led all other counties for the highest level of UI contributions.
• In the 1st quarter of 2013, Oklahoma County had 27.9 percent of total statewide employment and 24.0 percent of firms statewide. It also paid the highest share of the total contributions (27.5 percent).
• Tulsa County followed, claiming 21.5 percent of total statewide employment and 19.8 percent of total statewide firms. It also paid the second highest share of the total contributions (26.7 percent).
• Cimarron County had the lowest level of UI contributions but also had the smallest share of statewide employment at 0.04 percent and smallest share of firms at 0.08 percent.
Page 18

Employers in Love County paid the lowest Unemployment Insurance tax rate in the 1st quarter of 2013.
• In the 1st quarter of 2013, employers in Love County paid the lowest UI tax rate than any other county at 0.7 percent.
• Cimarron County had the second-lowest paid UI tax rate at 0.9 percent in the 1st quarter of 2013.
• Hughes County had the highest UI tax rate in 1st quarter 2013 at 3.5 percent.
Page 19

In 1st quarter 2018, Oklahoma County again led all other counties for the highest level of UI contributions.
• By the 1st quarter of 2018, Oklahoma County’s share of statewide employment had grown to 28.3 percent and 25.4 percent of firms statewide. Its share of the total contributions was about at 27.7 percent.
• Tulsa County, the second-highest UI contributor, saw its share of statewide employment grow to 22.2 percent and 20.3 percent of total statewide firms. Its share of the total contributions was about at 25.6 percent.
• Cimarron County, once again, had the smallest level of UI tax contributions and saw no change in its share of statewide employment (0.05 percent) or firms (0.09 percent).
Page 20
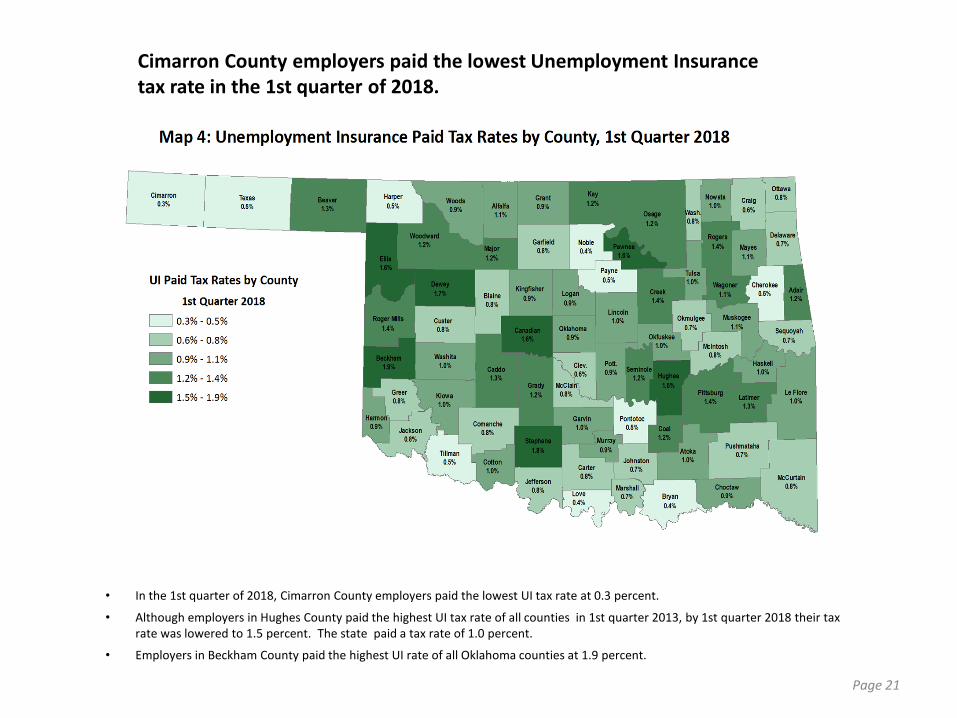
Cimarron County employers paid the lowest Unemployment Insurance tax rate in the 1st quarter of 2018.
• In the 1st quarter of 2018, Cimarron County employers paid the lowest UI tax rate at 0.3 percent.
• Although employers in Hughes County paid the highest UI tax rate of all counties in 1st quarter 2013, by 1st quarter 2018 their tax rate was lowered to 1.5 percent. The state paid a tax rate of 1.0 percent.
• Employers in Beckham County paid the highest UI rate of all Oklahoma counties at 1.9 percent.
Page 21

From 1st quarter 2013 to 1st quarter 2018, employers in all but three Oklahoma counties saw reductions in levels of UI contributions.
• Tulsa County employers saw the largest dollar amount reduction in UI contributions in 1st quarter 2018, dropping $33,040,771 from 1st quarter 2013 levels.
• Oklahoma County employers saw the second-largest decline in UI contributions at -$ 32,471,215. Coal County employers had the smallest dollar amount reduction in UI contributions at -$142.
• However, Alfalfa, Beaver and Canadian counties saw UI contributions increases in 1st quarter 2018. Page 22

From 1st quarter 2013 to 1st quarter 2018, employers in all but four Oklahoma counties saw reductions in UI tax rates as conditional factors moved from ‘D’ to ‘None’.
• As mentioned earlier, due to the sharp drop in Oklahoma’s UI Trust Fund balance during the Great Recession, Conditional Factor ‘D’ came into effect from 2011 to 2013.
• From 1st quarter 2013 to 1st quarter 2018, Pushmataha and McCurtain counties had the largest drop in UI tax rates falling 2.3 percentage points.
• Three counties (Beaver, Ellis and Roger Mills) saw increases in UI tax rates while Alfalfa county saw no change in UI tax rate.
Page 23

31
This workforce product was funded by a grant awarded by the U.S. Department of Labor’s Employment and Training Administration. This product was created by the recipient and does not necessarily reflect the official position of the U.S. Department of Labor. The U.S. Department of Labor makes no guarantees, warranties, or assurances of any kind, express or implied, with respect to such information, including any information on linked sites and including, but not limited to, accuracy of the information or its completeness, timeliness, usefulness, adequacy, continued availability, or ownership. This product is copyrighted by the institution that created it. Internal use by an organization and/or personal use by an individual for non-commercial purposes is permissible. All other uses require the prior authorization of the copyright owner.