Oklahoma Toxic Release Inventory 2006 Report · Oklahoma Department of ... of a wide variety of...
56
Oklahoma Toxic Release Inventory 2006 Report
Transcript of Oklahoma Toxic Release Inventory 2006 Report · Oklahoma Department of ... of a wide variety of...

Oklahoma
Toxic Release Inventory 2006 Report


Department of Environmental Quality • 3
Contents I. Executive Summary ..................................................................................................4
II. Background ..............................................................................................................5
III. TRI Reporting Requirements ....................................................................................7
IV. Limitations of TRI Data ............................................................................................9
V. 2006 TRI Overview .................................................................................................11
VI. 2006 Tier II Overview .............................................................................................26
VII. Facilities Reporting in 2006 ....................................................................................28
VIII. Chemicals Reported in 2006 ..................................................................................33
IX. Persistent, Bioaccumulative and Toxic Chemicals ....................................................44
X. Glossary of Terms ....................................................................................................52
Prepared by: Jami MurphyOklahoma Department of
Environmental Quality707 N. Robinson
P.O. Box 1677Oklahoma City, OK 73101-1677

4 • TRI Report 2006
Executive SummaryThe 2006 Toxics Release Inventory
(TRI) indicates environmental releases of toxic chemicals relative to total toxic wastes in Oklahoma continue to trend downward. TRI is part of the federal Emergency Planning and Community Right to Know Act (EPCRA) and is administered by the U.S. Environmental Protection Agency (EPA). The law requires covered facilities in Oklahoma to submit annual reports to the Oklahoma Department of Environmental Quality (DEQ) which compiles a TRI database for the entire state. The TRI reports provide information on legal emissions, transfers, treatment and reuse of over 600 toxic chemicals used in the manufacture or processing of a wide variety of products. Covered industries engage in manufacturing, coal-fired electric power generation, commercial hazardous waste disposal, solvent recovery or serve as bulk petroleum terminals. Facilities in these categories also must have the equivalent of at least 10 full time employees and use one or more listed toxic chemicals. For 2006, DEQ received 1,247 reports from 324 Oklahoma facilities.
Releases and transfers of chemicals used in the State are regulated under permits issued by state and federal agencies. Releases are the quantities of chemical emissions going directly to air, water, onto land or into deep underground injection wells. Transfers are the quantities of chemicals discharged into public sewers and off-site landfills or removed to other disposal facilities. Re-use includes the quantity of recycled chemicals and the quantity consumed in energy recovery operations. The figure
for treatment is both on-site and off-site treatments that neutralize or destroy the toxic chemicals. The sum of these activities yields the figure for total production related wastes generated in the State in 2006.
Oklahoma companies reported 25.5 million pounds released in 2006. Air emissions continued to decline significantly as did disposals to underground injection wells. The TRI numbers indicate that total air releases decreased by almost 20 percent since 2000. Reuse, primarily recycling, increased from 2000 to 2006 by 36.2 million pounds, an increase of over 36 percent. Over 54 million pounds of chemicals were destroyed by treatment, and 4.3 million pounds of chemicals were transferred off-site for proper disposal. The total of these numbers sets the quantity of Total Production Related Wastes at 183.9 million pounds in the State for 2006.
Expansions in the program since 1994 both doubled the number of reportable chemicals and also required additional industries to report, making reductions even more significant. Enacted seven years ago, the Persistent, Bioaccumulative and Toxic (PBT) rule greatly lowered reporting thresholds for TRI chemicals with these characteristics. Chemicals classified as PBTs possess the potential to seriously impact the environment and are tracked at significantly lower levels under the new requirements. The total for all releases of PBT chemicals was 476,471 pounds in 2006 or less than two percent of total releases Statewide. This is the nineteenth year the DEQ has compiled TRI information and this is the eighth summary report.

Department of Environmental Quality • 5
Background
continued on next page...
In 1984, a release of deadly methyl isocyanate gas in Bhopal, India resulted in the deaths of thousands living near a chemical plant. Soon after, a serious, although not fatal, chemical release occurred at a similar plant in West Virginia. These incidents emphasized the need for communities to be informed of hazardous materials in their midst and to plan for possible chemical emergencies. In response, the United States Congress passed Title III of the Superfund Amendments and Reauthorization Act (SARA), also known as EPCRA, on October 16, 1986. The fundamental purposes of the Act are to provide the public with information about toxic chemicals used and stored within communities, thereby raising public awareness of potential chemical hazards, and to encourage local planning for chemical emergencies. Section 313 of this Bill, known as the TRI, requires covered industries that manufacture, process or otherwise use any of over 600 listed toxic chemicals to annually report releases and waste management of these chemicals to the EPA and to states. Also, under Section 312, the Hazardous Chemical Inventory (Tier II), sites storing certain hazardous chemicals or materials must report to states, first responders and Local Emergency Planning Committees (LEPC) once a year. By mandate, data contained in the TRI and Tier II are available to the public.
Facilities covered by TRI report total quantities of wastes generated, quantities released and the maximum amounts of listed toxic chemicals present on-site during the calendar year. Releases of listed chemicals are reported according to the media into which they enter: air, water, land or underground injection. Quantities of waste chemicals transferred off-site for treatment, disposal, or reuse also are reported. The Pollution Prevention Act of 1990 requires
additional data describing waste streams and measures taken to reduce the quantities of reportable chemicals used. The change underscores the importance of pollution prevention and encourages development and implementation of measures for reducing toxic wastes. Since 1991, TRI has contained information on the re-use of chemicals, including quantities recycled or combusted for energy recovery along with methods used for reducing the volume of toxic chemicals used. Treatment numbers reported include both on-site and off-site treatments to neutralize or reduce the effects of specific chemicals. The total of release, transfer, treatment and re-use numbers yields a value for the total production-related wastes generated annually.
Tier II reports describe chemical storage, including information on the type and location of storage containers and the maximum and average quantities stored. Reports are filed with the state, appropriate LEPCs, and local fire departments. Beginning with the 2006 data, DEQ mandated on-line submission of Tier II data and offered grants to LEPCs that disseminate the information for their respective counties to responding fire departments.
The DEQ receives TRI report forms annually from those Oklahoma industries covered by Section 313. The DEQ compiles and maintains a TRI database, reconciles it to the EPA database, analyzes the data and publishes a summary. In 2007, DEQ received and processed 1,247 reports from 324 facilities for the 2006 reporting year. Because the intent of the TRI is to provide information for the public, it frequently is the first set of data supplied to and examined by citizens or citizen workgroups in the resolution of complaints against a specific facility. Schools, hospitals and others frequently use the information in determining site selections. Toxic Release

6 • TRI Report 2006
Inventory data is used as an indicator of the progress facilities or industries achieve in waste reduction, and the dissemination of TRI data can encourage dialogue between citizens and industries. Trends in TRI data frequently serve as markers for the progress of environmental programs.
Similarly, the agency receives Tier II reports from throughout the State and constructs a database yearly; however, EPA does not receive Tier II forms and therefore does not maintain a database. For Reporting Year 2006, DEQ received 33,702 Tier II forms, 1,124 of those describing storage of a chemical designated as an Extremely Hazardous Substance (EHS).
Toxic Release Inventory data describe use, releases, waste management and pollution prevention activities for
individual chemicals and Tier II reports storage of hazardous chemicals and materials. The information generated by these programs is available from the DEQ for use by emergency managers, fire departments, LEPCs, emergency medical services, law enforcement and the general public. Local entities then can use the data to identify potential chemical hazards and prepare for chemical emergencies, allowing for faster and more efficient responses. Additional copies of this report or more in depth information about TRI or Tier II reporting or other EPCRA programs may be obtained by contacting DEQ’s Customer Services Division/SARA Title III Programs at 405-702-1000 or at 1-800-869-1400 or by visiting the DEQ website at: http://www.deq.state.ok.us/CSDnew/saratitleiii/index.htm

Department of Environmental Quality • 7
TRI Requirements
NAICS Industrial Group111998 All Other Misc. Crop Farming211112 Natural Gas Liquid Extraction212111 Bituminous Coal & Lignite Surface Mining212112 Bituminous Coal & Underground Mining212113 Anthracite mining212221 Gold Ore Mining212222 Silver Ore Mining212231 Lead Ore & Zinc Ore Mining212234 Copper Ore & Nickel Mining212229 Other Metal Ore Mining212324 Kaolin and Ball Clay Mining212325 Mining212393 Other Chemical & Fertilizer Mining212399 All Other Nonmerallic Mineral Mining221111 Hydroelectric Power Generation221112 Fossil Fuel Electric Power Generation221113 Nuclear Electric Power Generation221119 Other electric Power Generation221121 Electric bulk Pwer Transmission Control221122 Electric Power Distribution311--- Food Manufacturing312--- Beverage & Tobacco Manufacturing313--- Textile Mills314--- Textile Product Mills315--- Apparel Manufacturing316--- Leather and Allied Products321--- Wood Products322--- Paper Manufacturing323--- Printing & Related Activities324--- Petroleum & Coal Products325--- Chemical Manufacturing326--- Plastics & Rubber Products327--- Nonmetallic Mineral Products331--- Primary Metal Manufacturing332--- Fabricated Metal Products333--- Machinery Manufacturing334--- Computer & Electronic Products335--- Electrical Equipment, Appliances & Components336--- Transportation Equipment Manufacturing337--- Furniture & Related Products339--- Misc. Manufacturing424690 Chemical & Allied Products Wholesalers424710 Petroleum Bulk Stations & Terminals425110 Business to Business Electronics425120 Wholesale Trade Agents & Brokers488390 Other Support Activities for Water Transportation511110 Newspaper Publishers511120 Periodical Publishers511130 Book Publishers511140 Directory and Mailing List Publishers511191 Greeting Card Publishers511199 All Other Publishers512220 Integrated Record Production/Distribution
Table 1
continued on next page...
A plant, factory or other facility is subject to TRI and must annually report releases, transfers and waste management activities if it meets all three of the following criteria:
• IsincludedinoneofthecoveredNorthAmerican Industrial Classification System (NAICS) codes. (Table 1);
• Hastenormorefull-timeemployees(orthe equivalent 20,000 hours per year);
• Manufactures, imports, processes orotherwise uses any of 643 listed toxic chemicals or chemical categories in quantities greater than the specified thresholds. The threshold quantity for toxic chemicals manufactured, imported or processed is 25,000 pounds over the calendar year. For other uses, the threshold quantity is 10,000 pounds over the calendar year, with the exception of PBTs.
Facilities required to report to TRI engaged primarily in a wide range of manufacturing activities. Additional industries linked to manufacturing were added for 1998 including fossil fuel electricity generation plants, hazardous waste treatment, storage and disposal sites, bulk petroleum terminals, chemical wholesalers and some mining activities are required to report under the program. Initially, covered industries were listed by Standard Industrial Classification (SIC) codes; however, 2006 is the initial year for facilities to be identified and report using NAICS codes. All industries operating under former SIC codes are included in the currently covered NAICS codes.
A facility may need to report if it used one or more of the listed chemicals, even if it had no chemical releases, as reporting thresholds are based on the quantities of

8 • TRI Report 2006
512230 Music Publishers516110 Internet Publishing & Broadcasting541710 Research & Development in Science & Engineering562112 Hazardous Waste Collection562211 Hazardous Waste Treatment and Disposal562212 Solid Waste Landfill562213 Solid Waste Combustors & Incinerators562219 Nonhazardous Waste Treatment & Disposal562920 Materials Recovery Facilities811490 Pleasure Boat Building & Repair928110 National Security
Table 1 (continued...)
chemicals manufactured, processed or used rather than discharges or emissions. The abbreviated Form A may be used for reporting if the total quantity released of a chemical or chemical group is less than 500 pounds and the total amount manufactured, processed or otherwise used is less than 1,000,000 pounds.
Exemptions to the reporting requirements for Section 313 are designed to reduce the burden associated with comparatively small quantities of chemicals used and are applicable in limited circumstances. The de minimis concentration exemption applies to reporting if the chemical comprises less than 1 per cent (<1%) of a mixture, even though the total quantity of the chemical exceeds the reporting threshold. However, for TRI listed chemicals also classified by the Occupational Safety and Health Administration (OSHA) as carcinogenic, the de minimis concentration drops to less than 0.1 per cent (<0.1%). The de minimis concentration exemption applies only to those chemicals manufactured, and does not apply to wastes that are processed or otherwise used. Owners of leased property may not be required to report to TRI, nor are the majority of activities in analytical laboratories. Toxic chemicals that are parts of the structural components of a facility
as well as chemicals used for janitorial or facility maintenance are exempted from reporting even if quantities used would exceed threshold requirements. Freon in air conditioners used solely for employee comfort is exempt from TRI reporting, as is chlorine used to treat on-site potable water. Other exemptions for personal use may apply. Reportable chemicals taken into a facility from the environment are exempt, for example, any quantities of reportable chemicals in intake water. Chemicals contained in materials used to maintain or refuel motor vehicles need not be reported provided the vehicles are used only by the facility. The article exemption applies to any item already manufactured before reaching a facility and whose end use is more or less dependent on the shape or design of the item, the article is not significantly modified and 313 chemicals are released during the normal processing or otherwise use of the item while at the reporting facility. For additional information about the article exemption and other exemptions, general TRI reporting and threshold quantities, contact the EPA Region 6, DEQ, or visit the following website: http://epa.gov/tri/
Reporting Year 2000 was the first year for implementation of the rule for PBT chemicals, and 2001 was the first year the Final Rule for lead was in effect. Thresholds for PBTs are far lower and no distinction is made between the reporting thresholds for manufacture, process or otherwise use. The de minimis concentration exemption does not apply to reporting of PBTs. A table listing PBT chemicals and a more detailed description of the program is included in the section “TRI Persistent, Bioaccumulative and Toxic Chemicals” in this report.

Department of Environmental Quality • 9
Limitations of TRI Data
continued on next page...
The TRI provides information on quantities of specific toxic chemicals released and managed by facilities covered under Section 313 of SARA Title III. As such, TRI is the most comprehensive overview available on chemical usage, releases and waste management. Responsible use of this information can enable the public to identify and better understand potential chemical hazards in their communities. From there, citizens can delineate plans of action in the event of chemical emergencies and work with industry and government to reduce toxic releases. However, there are limitations to consider when using TRI data.
The majority of releases reported in TRI are regulated by State or Federal permits. Transfers to off-site locations for treatment, storage or disposal also are regulated, as are on-site disposals. For example, sites permitted under RCRA Subtitle C are strictly regulated and monitored to insure that human exposure and impact to the environment are minimal. It should not be construed that all TRI releases have direct deleterious effects. Prior to 1998, only manufacturing facilities were required to report to the TRI. And while the addition of seven industrial categories expanded TRI reporting to make it more representative, not all sources of toxic materials are covered. For example, neither transportation emissions nor releases from small facilities are reported.
Toxic Release Inventory expanded for RY 1995 to double the number of covered chemicals or chemical groups. At present, over 600 chemicals and chemical groups known to impact human health, the environment, or both are reported. As extensive as the current list is, it does not include every toxic chemical used in industry. Chemicals reportable under TRI vary greatly in individual toxicity and persistence in the environment. For example, the release of a small quantity
of a highly toxic material, whose usage may fall below the reporting threshold, could pose a more serious health or environmental hazard than a large release of a less toxic chemical. The rule for PBT chemicals is an initial step in addressing the variability. (See “Chemicals Reported in 2006”, on page 33) Toxic Release Inventory reporting requirements are based on the quantities of chemicals used and facility classifications, rather than on the quantities of chemicals released. The different media into which toxic chemicals are released greatly affects exposure levels and the means of exposure, (inhalation, dermal absorption or ingestion). For example, disposal to underground injection wells are reported as a releases even though the potential impact on public health or environmental is minimal. Quantities in the TRI database are totals for a given year; and peak concentrations or accidental discharges are not specifically sited. Therefore, health assessments or environmental risks/exposures based solely on TRI data are not valid.
Facilities are required to base numbers reported to TRI on monitoring data when available. However, if actual process data are not available, TRI figures can be based on estimates. In fact, much of the data reported is estimated. Although EPA publishes estimation guidance, several techniques can be used. Variations between similar facilities may result from the use of different estimation methodologies or differences in technologies. A facility’s production level may change from year to year and consequently affect the quantities of chemicals handled. Productivity ratios

10 • TRI Report 2006
are provided by facilities for each reporting year and can be used for normalizing year-to-year comparisons of quantities released or managed; however, this assumes a direct linear relationship between production levels and wastes generated, which is not always accurate. For example, total wastes may fall as productivity improves due to waste reduction or improved process efficiency. Also productivity ratios will not take into account chemical releases resulting from any remedial action or one-time event. These factors also must be considered when reviewing TRI data.
Continued expansions in reporting, such as the increase in the number of reportable chemicals and the addition of industrial categories, reflect efforts to build the TRI into an increasingly comprehensive database. Changes in the program, however, necessitate that the data be viewed with caution when making comparisons from year to year or facility to facility. Many of the chemical releases and waste management reported in the TRI are permitted under State programs, and data from these regulatory programs should provide additional information to clarify citizens about toxic chemicals in the environment.

Department of Environmental Quality • 11
2006 TRI Overview
���������������������������������������������������������
�������������������������������������������������������������������������
������������
���������������������
������������������������
������������������������
�����������������������
���������������������
���������������������������
� � ��� � � � �
� � � �
���� ��
�
�
� �
�
�
���
���
� � ��
�
�� � � �
�
� � �
��
��
�
�
�
�
��
�
Fifty-one of seventy-seven Oklahoma counties contain at least one industrial facility that meets the requirements for TRI reporting, and a total of 324 facilities reported for 2006. (Figure A) Of those counties with reporting facilities located in them, only six had total TRI releases exceeding one million pounds. These include the major metropolitan areas of Oklahoma City and Tulsa, counties accessing the Port of Catoosa and counties with wood processing/paper manufacturing facilities, nitrogen fertilizer plants or major treatment, storage and disposal sites. Information on releases and waste management in individual counties is found in Table 2.
Total production related wastes were 183.9 million pounds in 2006, as reported under TRI. (Figure B) According to the TRI data, over 83.8 percent of industrial wastes in the State were managed through reuse and treatment. (Figure C)
For 2006, Oklahoma companies reported:• 25.5millionpoundsreleased• 4.3millionpoundstransferredfordisposal• 99.2millionpoundsreused• 54.9millionpoundstreated
Total releases were:• 15.1millionpoundsreleasedtoair• 6.9millionpoundsreleasedtolandor
permitted landfills
Figure Acontinued on page 14...

12 • TRI Report 2006
County # Fac. Air Land Injection Water One Time Tot. On-Site Rels. Trans. Disposal Tot. Energy Rec. Tot. Recycling Total Reuse Treatment POTW Treat. Tot. Treatment TPRWAdair 2 52,811 0 0 0 0 52,811 0 12,949 0 12,949 0 0 0 62,535Alfalfa 0 0 0 0 0 0 0 0 0 0 0 0 0 0 0Atoka 0 0 0 0 0 0 0 0 0 0 0 0 0 0 0Beaver 0 0 0 0 0 0 0 0 0 0 0 0 0 0 0Beckham 0 0 0 0 0 0 0 0 0 0 0 0 0 0 0Blaine 1 0 0 0 0 0 0 0 0 0 0 0 0 0 0Bryan 3 155,030 0 0 0 0 155,030 37,137 23,384 535,717 559,101 0 0 0 397,724Caddo 0 0 0 0 0 0 0 0 0 0 0 0 0 0 0Canadian 9 49,152 0 0 0 0 49,152 755 286,358 269,196 555,554 126,180 57,885 184,065 685,304Carter 8 246,332 0 0 182,956 0 429,288 207,881 1,628,519 78,064 1,706,583 4,609,041 4 4,609,045 11,481,033Cherokee 2 235 0 0 0 0 235 5 0 0 0 0 0 0 248Choctaw 1 251,133 275,203 0 0 0 526,336 0 0 0 0 0 0 0 589,176Cimarron 0 0 0 0 0 0 0 0 0 0 0 0 0 0 0Cleveland 3 8,868 0 0 5 7,684 16,557 16,836 0 109,454 109,454 0 0 0 309,408Coal 0 0 0 0 0 0 0 0 0 0 0 0 0 0 0Comanche 4 36,999 29 0 450 0 37,478 76,475 0 300,022 300,022 14,744 4,466 19,210 941,216Cotton 0 0 0 0 0 0 0 0 0 0 0 0 0 0 0Craig 1 0 0 0 0 0 0 0 0 16,942,276 16,942,276 0 0 0 6,961,686Creek 12 10,085 15,502 0 0 0 25,587 427,160 0 251,108 251,108 21,032 0 21,032 1,684,538Custer 4 15,505 0 0 0 0 15,505 0 26,800 1,445 28,245 303,102 0 303,102 141,250Delaware 0 0 0 0 0 0 0 0 0 0 0 0 0 0 0Dewey 1 0 0 0 0 0 0 0 0 0 0 0 0 0 0Ellis 0 0 0 0 0 0 0 0 0 0 0 0 0 0 0Garfield 5 2,739,077 0 0 775,258 0 3,514,335 98 540,000 4,915,000 5,455,000 1,400,000 0 1,400,000 10,974,921Garvin 1 127,756 1,280 0 61,543 2 190,581 197,386 255,124 15,556 270,680 521,789 0 521,789 732,840Grady 5 39,349 0 0 0 14 39,363 17,325 0 147,497 147,497 0 0 0 258,908Grant 0 0 0 0 0 0 0 0 0 0 0 0 0 0 0Greer 0 0 0 0 0 0 0 0 0 0 0 0 0 0 0Harmon 0 0 0 0 0 0 0 0 0 0 0 0 0 0 0Harper 0 0 0 0 0 0 0 0 0 0 0 0 0 0 0Haskell 0 0 0 0 0 0 0 0 0 0 0 0 0 0 0Hughes 1 0 0 0 0 0 0 0 0 0 0 0 0 0 0Jackson 0 0 0 0 0 0 0 0 0 0 0 0 0 0 0Jefferson 1 11,546 0 0 0 0 0 0 0 0 0 0 0 0 0Johnston 0 0 0 0 0 0 0 0 0 0 0 0 0 0 0Kay 10 596,160 2,709 0 42,967 153 641,989 56,785 9,125 98,020 107,145 2,862,576 1,119 2,863,695 6,712,230Kingfisher 2 36,174 0 0 0 0 36,174 0 478 1,231,988 1,232,466 0 0 0 175,119Kiowa 0 0 0 0 0 0 0 0 0 0 0 0 0 0 0Latimer 1 0 0 0 0 0 0 0 0 0 0 0 0 0 0Leflore 3 258,188 0 0 0 0 258,188 524,107 0 0 0 0 0 0 724,635Lincoln 1 3,240 5,890 0 0 0 9,130 0 0 3,240 3,240 5,890 0 5,890 20,580Logan 0 0 0 0 0 0 0 0 0 0 0 0 0 0 0Love 0 0 0 0 0 0 0 0 0 0 0 0 0 0 0Major 1 1324 4,011,085 0 0 0 4,012,409 0 0 0 0 152,451 0 152,451 1,426,697Marshall 3 117,090 2,440 0 0 0 119,530 33,356 4,130 4,493 8,623 0 0 0 112,238Mayes 12 173,860 717,901 0 1,375,422 0 2,267,183 465 656,499 7,124,063 7,780,562 15,467,383 8 15,467,391 21,865,487Mcclain 0 0 0 0 0 0 0 0 0 0 0 0 0 0 0Mccurtain 7 3,289,723 301,153 0 614,200 0 4,205,076 50,553 56 94 150 10,644,248 5 10,644,253 13,583,962Mcintosh 1 12,640 0 0 0 0 12,640 0 0 0 0 0 0 0 21,915Murray 0 0 0 0 0 0 0 0 0 0 0 0 0 0 0Muskogee 9 958,400 16,245 0 36,324 14,838 1,025,807 348,647 0 1,639,428 1,639,428 706,959 0 706,959 4,386,197Noble 3 247,455 0 0 1,230 0 248,685 26,709 0 86,221 86,221 328,462 0 328,462 706,037Nowata 2 0 0 0 0 0 0 0 0 0 0 0 0 0 0Ofuskee 0 0 0 0 0 0 0 0 0 0 0 0 0 0 0Oklahoma 48 656,439 0 0 12 6,776 663,227 86,629 32,654 787,477 820,131 12,009,092 27,859 12,036,951 5,039,415Okmulgee 2 0 0 0 20,505 0 20,505 0 0 38,345 38,345 0 18,604 18,604 42,289Osage 1 996,650 0 240 0 0 996,890 0 390,290 34,476,000 34,866,290 0 0 0 35,472,780Ottawa 3 288,358 0 0 0 0 288,358 0 0 19,070 19,070 4,248 39,105 43,353 380,777Pawnee 0 0 0 0 0 0 0 0 0 0 0 0 0 0 0Payne 4 144,796 0 0 0 3 144,799 104,797 8,145 463,126 471,271 71,226 0 71,226 856,727Pittsburg 2 22,593 244,513 0 0 0 267,106 85,145 0 874,191 874,191 183,700 0 183,700 4,114,466Pontotoc 2 61,663 7,146 0 0 0 68,809 0 29,357 0 13,071 434,184 0 434,184 545,727Pottawatomie 7 77,770 0 0 0 0 77,770 17,354 0 26,500 26,500 28,130 5,030 33,160 366,291Pushmataha 1 250 0 0 0 0 250 796 4,622 0 4,622 0 0 0 1,880RoGer Mills 0 0 0 0 0 0 0 0 0 0 0 0 0 0 0Rogers 25 1,910,998 671,100 0 160,487 200 2,742,785 294,082 11,424 14,639,891 14,651,315 2,378,675 68,228 2,446,903 13,883,533Seminole 3 72,053 0 0 0 0 72,053 0 0 0 0 0 0 0 88,112Sequoyah 2 26,874 3,516 0 0 0 30,390 0 0 0 0 0 0 0 56,267Stephens 5 12,789 0 0 0 0 12,789 0 0 1,492,948 1,492,948 0 0 0 94,988Texas 3 4,209 0 0 0 0 4,209 15 0 0 0 120,000 120,000 240,000 272,492Tillman 1 0 0 0 0 0 0 83,415 0 0 0 0 0 0 24,150Tulsa 81 825,734 1,468 52,868 73,603 0 953,673 895,661 1,937,626 6,052,682 7,990,308 1,899,970 1,178 1,901,148 10,303,225Wagoner 5 803 0 0 5 0 808 0 0 101,282 101,282 0 0 0 91,044Washington 4 1,900 0 1,369 69 1 3,339 703,379 0 119,236 119,236 0 250 0 938,718Washita 0 0 0 0 0 0 0 0 0 0 0 0 0 0 0Woods 2 9,960 0 0 0 0 9,960 0 0 0 0 0 0 0 13,146Woodward 4 555,500 72,010 0 63,300 14,500 705,310 869 83,500 206,269 206,269 306,000 0 306,000 1,399,928
Table 2

Department of Environmental Quality • 13
County # Fac. Air Land Injection Water One Time Tot. On-Site Rels. Trans. Disposal Tot. Energy Rec. Tot. Recycling Total Reuse Treatment POTW Treat. Tot. Treatment TPRWAdair 2 52,811 0 0 0 0 52,811 0 12,949 0 12,949 0 0 0 62,535Alfalfa 0 0 0 0 0 0 0 0 0 0 0 0 0 0 0Atoka 0 0 0 0 0 0 0 0 0 0 0 0 0 0 0Beaver 0 0 0 0 0 0 0 0 0 0 0 0 0 0 0Beckham 0 0 0 0 0 0 0 0 0 0 0 0 0 0 0Blaine 1 0 0 0 0 0 0 0 0 0 0 0 0 0 0Bryan 3 155,030 0 0 0 0 155,030 37,137 23,384 535,717 559,101 0 0 0 397,724Caddo 0 0 0 0 0 0 0 0 0 0 0 0 0 0 0Canadian 9 49,152 0 0 0 0 49,152 755 286,358 269,196 555,554 126,180 57,885 184,065 685,304Carter 8 246,332 0 0 182,956 0 429,288 207,881 1,628,519 78,064 1,706,583 4,609,041 4 4,609,045 11,481,033Cherokee 2 235 0 0 0 0 235 5 0 0 0 0 0 0 248Choctaw 1 251,133 275,203 0 0 0 526,336 0 0 0 0 0 0 0 589,176Cimarron 0 0 0 0 0 0 0 0 0 0 0 0 0 0 0Cleveland 3 8,868 0 0 5 7,684 16,557 16,836 0 109,454 109,454 0 0 0 309,408Coal 0 0 0 0 0 0 0 0 0 0 0 0 0 0 0Comanche 4 36,999 29 0 450 0 37,478 76,475 0 300,022 300,022 14,744 4,466 19,210 941,216Cotton 0 0 0 0 0 0 0 0 0 0 0 0 0 0 0Craig 1 0 0 0 0 0 0 0 0 16,942,276 16,942,276 0 0 0 6,961,686Creek 12 10,085 15,502 0 0 0 25,587 427,160 0 251,108 251,108 21,032 0 21,032 1,684,538Custer 4 15,505 0 0 0 0 15,505 0 26,800 1,445 28,245 303,102 0 303,102 141,250Delaware 0 0 0 0 0 0 0 0 0 0 0 0 0 0 0Dewey 1 0 0 0 0 0 0 0 0 0 0 0 0 0 0Ellis 0 0 0 0 0 0 0 0 0 0 0 0 0 0 0Garfield 5 2,739,077 0 0 775,258 0 3,514,335 98 540,000 4,915,000 5,455,000 1,400,000 0 1,400,000 10,974,921Garvin 1 127,756 1,280 0 61,543 2 190,581 197,386 255,124 15,556 270,680 521,789 0 521,789 732,840Grady 5 39,349 0 0 0 14 39,363 17,325 0 147,497 147,497 0 0 0 258,908Grant 0 0 0 0 0 0 0 0 0 0 0 0 0 0 0Greer 0 0 0 0 0 0 0 0 0 0 0 0 0 0 0Harmon 0 0 0 0 0 0 0 0 0 0 0 0 0 0 0Harper 0 0 0 0 0 0 0 0 0 0 0 0 0 0 0Haskell 0 0 0 0 0 0 0 0 0 0 0 0 0 0 0Hughes 1 0 0 0 0 0 0 0 0 0 0 0 0 0 0Jackson 0 0 0 0 0 0 0 0 0 0 0 0 0 0 0Jefferson 1 11,546 0 0 0 0 0 0 0 0 0 0 0 0 0Johnston 0 0 0 0 0 0 0 0 0 0 0 0 0 0 0Kay 10 596,160 2,709 0 42,967 153 641,989 56,785 9,125 98,020 107,145 2,862,576 1,119 2,863,695 6,712,230Kingfisher 2 36,174 0 0 0 0 36,174 0 478 1,231,988 1,232,466 0 0 0 175,119Kiowa 0 0 0 0 0 0 0 0 0 0 0 0 0 0 0Latimer 1 0 0 0 0 0 0 0 0 0 0 0 0 0 0Leflore 3 258,188 0 0 0 0 258,188 524,107 0 0 0 0 0 0 724,635Lincoln 1 3,240 5,890 0 0 0 9,130 0 0 3,240 3,240 5,890 0 5,890 20,580Logan 0 0 0 0 0 0 0 0 0 0 0 0 0 0 0Love 0 0 0 0 0 0 0 0 0 0 0 0 0 0 0Major 1 1324 4,011,085 0 0 0 4,012,409 0 0 0 0 152,451 0 152,451 1,426,697Marshall 3 117,090 2,440 0 0 0 119,530 33,356 4,130 4,493 8,623 0 0 0 112,238Mayes 12 173,860 717,901 0 1,375,422 0 2,267,183 465 656,499 7,124,063 7,780,562 15,467,383 8 15,467,391 21,865,487Mcclain 0 0 0 0 0 0 0 0 0 0 0 0 0 0 0Mccurtain 7 3,289,723 301,153 0 614,200 0 4,205,076 50,553 56 94 150 10,644,248 5 10,644,253 13,583,962Mcintosh 1 12,640 0 0 0 0 12,640 0 0 0 0 0 0 0 21,915Murray 0 0 0 0 0 0 0 0 0 0 0 0 0 0 0Muskogee 9 958,400 16,245 0 36,324 14,838 1,025,807 348,647 0 1,639,428 1,639,428 706,959 0 706,959 4,386,197Noble 3 247,455 0 0 1,230 0 248,685 26,709 0 86,221 86,221 328,462 0 328,462 706,037Nowata 2 0 0 0 0 0 0 0 0 0 0 0 0 0 0Ofuskee 0 0 0 0 0 0 0 0 0 0 0 0 0 0 0Oklahoma 48 656,439 0 0 12 6,776 663,227 86,629 32,654 787,477 820,131 12,009,092 27,859 12,036,951 5,039,415Okmulgee 2 0 0 0 20,505 0 20,505 0 0 38,345 38,345 0 18,604 18,604 42,289Osage 1 996,650 0 240 0 0 996,890 0 390,290 34,476,000 34,866,290 0 0 0 35,472,780Ottawa 3 288,358 0 0 0 0 288,358 0 0 19,070 19,070 4,248 39,105 43,353 380,777Pawnee 0 0 0 0 0 0 0 0 0 0 0 0 0 0 0Payne 4 144,796 0 0 0 3 144,799 104,797 8,145 463,126 471,271 71,226 0 71,226 856,727Pittsburg 2 22,593 244,513 0 0 0 267,106 85,145 0 874,191 874,191 183,700 0 183,700 4,114,466Pontotoc 2 61,663 7,146 0 0 0 68,809 0 29,357 0 13,071 434,184 0 434,184 545,727Pottawatomie 7 77,770 0 0 0 0 77,770 17,354 0 26,500 26,500 28,130 5,030 33,160 366,291Pushmataha 1 250 0 0 0 0 250 796 4,622 0 4,622 0 0 0 1,880RoGer Mills 0 0 0 0 0 0 0 0 0 0 0 0 0 0 0Rogers 25 1,910,998 671,100 0 160,487 200 2,742,785 294,082 11,424 14,639,891 14,651,315 2,378,675 68,228 2,446,903 13,883,533Seminole 3 72,053 0 0 0 0 72,053 0 0 0 0 0 0 0 88,112Sequoyah 2 26,874 3,516 0 0 0 30,390 0 0 0 0 0 0 0 56,267Stephens 5 12,789 0 0 0 0 12,789 0 0 1,492,948 1,492,948 0 0 0 94,988Texas 3 4,209 0 0 0 0 4,209 15 0 0 0 120,000 120,000 240,000 272,492Tillman 1 0 0 0 0 0 0 83,415 0 0 0 0 0 0 24,150Tulsa 81 825,734 1,468 52,868 73,603 0 953,673 895,661 1,937,626 6,052,682 7,990,308 1,899,970 1,178 1,901,148 10,303,225Wagoner 5 803 0 0 5 0 808 0 0 101,282 101,282 0 0 0 91,044Washington 4 1,900 0 1,369 69 1 3,339 703,379 0 119,236 119,236 0 250 0 938,718Washita 0 0 0 0 0 0 0 0 0 0 0 0 0 0 0Woods 2 9,960 0 0 0 0 9,960 0 0 0 0 0 0 0 13,146Woodward 4 555,500 72,010 0 63,300 14,500 705,310 869 83,500 206,269 206,269 306,000 0 306,000 1,399,928

14 • TRI Report 2006
Figure B
• 54,800poundsdisposedinundergroundinjection wells
• 3.4 million pounds discharged tosurface waters.
• 44,000 pounds of one time releases(Figure D)
ReleasesTotal on-site releases include
all discharges to air, land, water or underground injection wells of any TRI reportable chemicals that occur within a facility’s property lines. Permitted, non-permitted and accidental releases are reported. Oklahoma companies reported 25.5 million pounds released in 2006, a decrease of almost 33 percent since industries were added for 1998. (Figure E) On-site releases accounted for only 13.9 percent of the Total Production Related Wastes managed in 2006 in Oklahoma.
0
50
100
150
200
250
1995 1996 1997 1998 1999 2000 2001 2002 2003 2004 2005 2006
210
167
144
130
143 142.6 140.9149.7 148.9
158.6 163.9
183.9
TOTAL PRODUCTION RELATED WASTES
MILLION POUNDS
Number of Reportable Chemicals Doubled in 1995 Nitrate Reporting Initiative Begun in 1999 Seven Industrial Categories Added in 1998 PBT Rule Enacted in 2000
Total air releases are the sum of permitted stack releases and fugitive air releases, and also can be considered point source or non-point source emissions respectively. Fugitive emissions result largely from the natural volatility of some chemical compounds and are defined as any air releases that do not go through a confined air stream. Evaporation, equipment leaks or releases from building ventilation systems are possible sources of fugitive releases. Stack air releases occur through confined air streams such as stacks, ducts or pipes. Overwhelmingly stack releases are permitted and regulated under the Clean Air Act. For 2006, 79.8 percent of all reportable on-site air releases in Oklahoma were stack emissions. (Figure F)
Total air releases as reported under TRI appeared to increase significantly from 1997 to 1998 when new industries

Department of Environmental Quality • 15
Figure C
continued on page 19...
13.9%
29.8%54.0%
2.3%
TOTAL PRODUCTION RELATED WASTES BY ACTIVITY
Releases Treatment
Reuse Transfers- Disposal
added to the program reported for the first time, especially coal-fired electric utilities. However, the change in quantities reported to TRI for air releases indicated an increase in the actual number of facilities reporting rather than a true increase in reportable air emissions. Yet even with the rise in the number and size of facilities beginning with RY 1998, total air releases as reported to TRI continue to decrease, dropping 8.3 million pounds or 35 percent in the past eight years, from the time the new reporting facilities were introduced. (Figure G) For RY 2006, total air emissions continued to decrease, demonstrating the goal of cleaner air in Oklahoma is being attained through the continued success between DEQ sponsored programs and the efforts of industries.
Total on-site releases to land include surface impoundments, land application, use of permitted landfills or other releases
to land within the boundaries of a facility. A significant increase in the numbers reported for total land releases also occurred for RY 1998 when industrial waste handlers permitted under RCRA Subtitle C were required to report to TRI for the first time. (Figure H) Disposal by this type of facility accounted for 16 percent of total releases in 2006 (see Facilities Reporting in 2006) and over 58 percent of all land releases. (Figure I) Additionally, Oklahoma treatment, storage, and disposal facilities receive transfers from both in-state and out-of-state sites for managed disposal of toxic wastes. Transfers made from in-state facilities to in-state TSD’s result in a “double counting effect”, first as off-site transfers for disposal then as releases to RCRA Subtitle C landfills and surface impoundments.
Disposals to deep underground injection wells are considered as releases

16 • TRI Report 2006
59.1%
13.4% 0.2%
27.1%
0.2%
TOTAL RELEASES BY MEDIUM
Air Water UG Injection Land One-time
Figure D
0.0
5.0
10.0
15.0
20.0
25.0
30.0
35.0
40.0
95 96 97 98 99 00 01 02 03 04 05 06
28.4
26.424.9
38.0
32.8
28.8
25.5 25.6 24.9 25.4
23.5
25.5
TOTAL ON-SITE RELEASES
MILLION POUNDS
Number of Reportable Chemicals Doubled in 1995 Nitrate Reporting Initiative Begun in 1999Seven Industrial Categories Added in 1998 PBT Rule Enacted in 2000
Figure E

Department of Environmental Quality • 17
Figure F
Figure G
20.2%
79.8%
AIR RELEASES BY EMISSION TYPE
FUGITIVE (NONPOINT) AIR RELEASES
STACK AIR (POINT) AIR RELEASES
0
5
10
15
20
25
95 96 97 98 99 00 01 02 03 04 05 06
23.5
21.6
18.3
23.4
18.2 18.717.4 17.15
15.9 15.6 15.3 15.1
TOTAL RELEASES TO AIR
MILLION POUNDS
Number of Reportable Chemicals Doubled in 1995 Nitrate Reporting Initiative Begun in 1999 Seven Industrial Categories Added in 1998 PBT Rule Enacted in 2000

18 • TRI Report 2006
Figure H
Figure I
0.0
1.0
2.0
3.0
4.0
5.0
6.0
7.0
8.0
9.0
95 96 97 98 99 00 01 02 03 04 05 06
0.66
0.11
0.73
7.25
8.85
4.95
5.47 5.35
4.22 4.364.78
6.90
TOTAL RELEASES TO LAND
MILLION POUNDS
Number of Reportable Chemicals Doubled in 1995 Nitrate Reporting Initiative Begun in 1999Seven Industrial Categories Added in 1998 PBT Rule Enacted in 2000
58.1%
22.5%
<0.1% 7.8% 0.1% 11.4%
LAND RELEASES BY MEDIUM
RCRA C Landfills Other Landfills RCRA C Surface Impound. Other Surface Impound. Land Application Other Land Disposal

Department of Environmental Quality • 19
continued on next page...Figure J
under TRI, however, this type of waste management has an extremely low potential for human exposure or contact with the environment. The effects of large facilities on TRI reporting are seen in the numbers for releases to permitted underground injection wells. While the overall trend for releases to this medium also continues to decline, the drastic reductions seen in 2001, 2002, 2005 and 2006 resulted from changes in the business of a single facility. (Figure J)
A dramatic increase in reported releases to surface waters began with the 2000 data as a result of EPA’s Nitrate Reporting Initiative, EPA reinterpretation of the reporting of aqueous nitrate compounds. Specifically, the Nitrate Initiative addressed the under or non-reporting of water dis-sociable nitrates. The resultant increase in surface waters releases represented an
0.0
0.5
1.0
1.5
2.0
2.5
3.0
3.5
4.0
4.5
95 96 97 98 99 00 01 02 03 04 05 06
0.1
1.0
1.7
4.4
2.62.5
0.005 0.013
1.31.16
0.061 0.054
TOTAL RELEASES TO UNDERGROUND INJECTION WELLS
MILLION POUNDS
Number of Reportable Chemicals Doubled in 1995 Nitrate Reporting Initiative Begun in 1999Seven Industrial Categories Added in 1998 PBT Rule Enacted in 2000
improvement in reporting accuracy rather than an actual increase in the quantities released. (Figure K) Two of the five industries in the State reporting the largest total surface water releases, nitrogenous fertilizer producers and soybean mills, also report the majority of nitrate compounds releases. For 2006, 138 facilities reported discharges into Oklahoma streams and rivers.
TransfersTransfers to off-site facilities for disposal
decreased slightly from 2005 to 2006. The current figures however are only 29 percent of those reported for 1991, indicating that the trend toward waste reduction and on-site management continues even as TRI reporting has expanded. (Figure L) Only 9.9 percent of post production wastes managed off-site was transfers for disposal.

20 • TRI Report 2006
0.0
2.0
4.0
6.0
8.0
10.0
12.0
14.0
16.0
89 90 91 92 93 94 95 96 97 98 99 00 01 02 03 04 05 06
9.3
12.9
15.0
9.7
12.1
7.0
5.0
3.03.6
2.92.2
3.44.2 4.2
4.6 4.2 3.94.3
TOTAL TRANSFERS FOR DISPOSAL
MILLION POUNDS
Number of Reportable Chemicals Doubled in 1995 Nitrate Reporting Initiative Begun in 1999 Seven Industrial Categories Added in 1998 PBT Rule Enacted in 2000
Figure K
Figure L
0.00
0.50
1.00
1.50
2.00
2.50
3.00
3.50
4.00
95 96 97 98 99 00 01 02 03 04 05 06
0.620.50
0.720.80
0.31
2.462.39
2.92
3.46
3.89
3.173.41
TOTAL RELEASES TO SURFACE WATERS
MILLION POUNDS
Number of Reportable Chemicals Doubled in 1995 Nitrate Reporting Initiative Begun in 1999Seven Industrial Categories Added in 1998 PBT Rule Enacted in 2000

Department of Environmental Quality • 21
Figure M
continued on next page...
In 2006, the majority of off-site transfers, 42 percent, were managed in landfills (Figure M) Releases to Publicly Owned Treatment Works (POTW) consist of water discharges made into sanitary drains and sewers that then are received and treated by wastewater treatment plants. These are counted chiefly as transfers for treatment (see Treatment, below) with the exception of wastewater containing metals and metal compounds, which are counted as transfers for disposal. However, transfers to POTW of metals and metal compounds account for only 0.1 percent of all transfers for disposal in 2006.
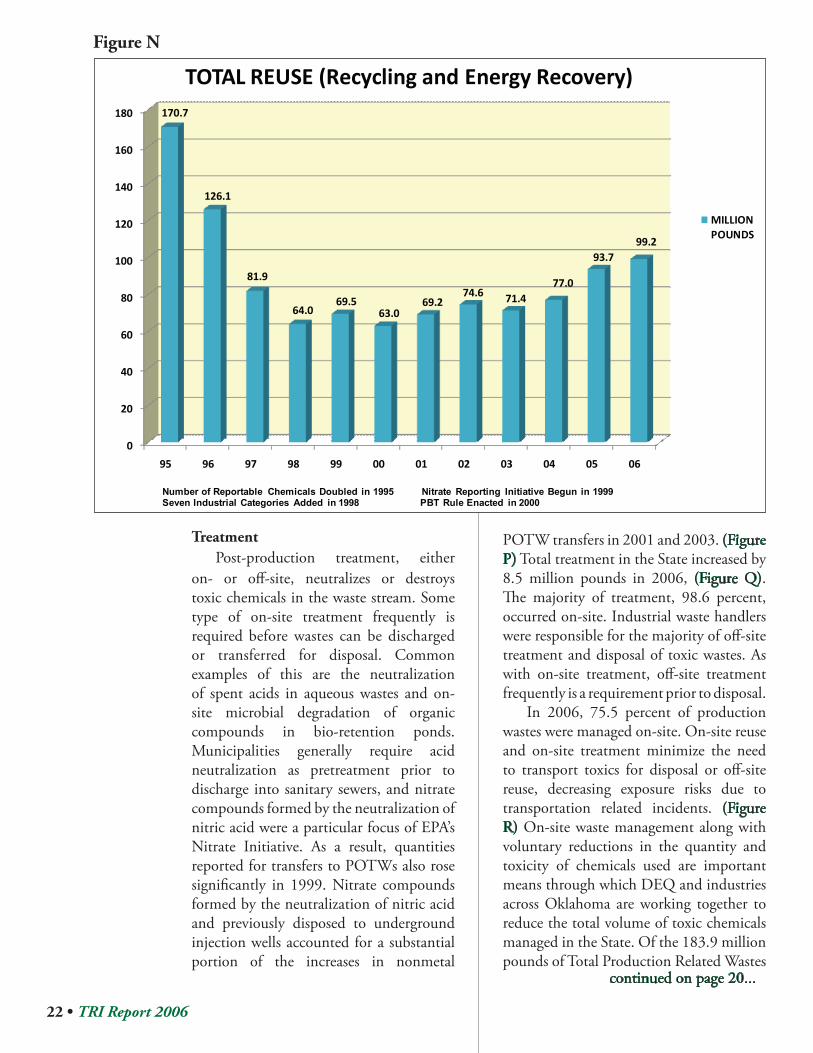
ReuseTotal reuse as defined by TRI is the
sum of recycling and energy recovery both on- and off-site. Reuse in Oklahoma
was reported as 99.2 million pounds in 2006. (Figure N) Over half, 54 percent, of reported total production related wastes were managed through reuse; 88.4 percent of wastes of wastes managed off-site were reused. (Figure O) The Oklahoma Department of Environmental Quality’s Pollution Prevention Program established and maintains a waste exchange list that promotes the use, reuse, or recycling of industrial waste streams as do some industrial waste handlers. This type of reuse not only reduces the quantities of toxic chemicals that ultimately find their way into the environment, but also in many instances, reduces the need to manufacture some of these chemicals, thus eliminating other potential wastes.
5.7%
40.7%
<0.1%
42.0%
1.5%
<0.1% 0.5%
6.1%
0.4%2.4%
0.5%
0.1%
OFF-SITE TRANSFERS FOR DISPOSAL BY ACTIVITY
Storage Only Stabilization, Metals WW Treatment, Metals Other Landfills
RCRA C Landfills Land Treatment Other Land Disposal UG Inj. Class I
UG Inj Class II-V Other Management. Unknown POTW, Metals
22 • TRI Report 2006
Figure N
continued on page 20...
TreatmentPost-production treatment, either
on- or off-site, neutralizes or destroys toxic chemicals in the waste stream. Some type of on-site treatment frequently is required before wastes can be discharged or transferred for disposal. Common examples of this are the neutralization of spent acids in aqueous wastes and on-site microbial degradation of organic compounds in bio-retention ponds. Municipalities generally require acid neutralization as pretreatment prior to discharge into sanitary sewers, and nitrate compounds formed by the neutralization of nitric acid were a particular focus of EPA’s Nitrate Initiative. As a result, quantities reported for transfers to POTWs also rose significantly in 1999. Nitrate compounds formed by the neutralization of nitric acid and previously disposed to underground injection wells accounted for a substantial portion of the increases in nonmetal
POTW transfers in 2001 and 2003. (Figure P) Total treatment in the State increased by 8.5 million pounds in 2006, (Figure Q). The majority of treatment, 98.6 percent, occurred on-site. Industrial waste handlers were responsible for the majority of off-site treatment and disposal of toxic wastes. As with on-site treatment, off-site treatment frequently is a requirement prior to disposal.
In 2006, 75.5 percent of production wastes were managed on-site. On-site reuse and on-site treatment minimize the need to transport toxics for disposal or off-site reuse, decreasing exposure risks due to transportation related incidents. (Figure R) On-site waste management along with voluntary reductions in the quantity and toxicity of chemicals used are important means through which DEQ and industries across Oklahoma are working together to reduce the total volume of toxic chemicals managed in the State. Of the 183.9 million pounds of Total Production Related Wastes
0
20
40
60
80
100
120
140
160
180
95 96 97 98 99 00 01 02 03 04 05 06
170.7
126.1
81.9
64.069.5
63.069.2
74.6 71.477.0
93.799.2
TOTAL REUSE (Recycling and Energy Recovery)
MILLION POUNDS
Number of Reportable Chemicals Doubled in 1995 Nitrate Reporting Initiative Begun in 1999Seven Industrial Categories Added in 1998 PBT Rule Enacted in 2000

Department of Environmental Quality • 23
0
200
400
600
800
1000
1200
1400
91 92 93 94 95 96 97 98 99 00 01 02 03 04 05 06
156.2189.3 177.4 151.3 155
254
483
579
975
708.8
1126.7
1270.1
941.1
563.6
442
365.7
TOTAL TRANSFERS TO POTWS (nonmentals)
THOUSAND POUNDS
Number of Reportable Chemicals Doubled in 1995 Nitrate Reporting Initiative Begun in 1999Seven Industrial Categories Added in 1998 PBT Rule Enacted in 2000
9.9%
1.7%
83.0%
5.4%
OFF-SITE WASTE MANAGEMENT
OFF-SITE TRANSFERS FOR DISPOSAL OFF-SITE TREATMENT
OFF-SITE RECYCLING OFF-SITE ENERGY RECOVERY
Figure O
Figure P

24 • TRI Report 2006
75.5%
24.5%
TOTAL PRODUCTION RELATED WASTES MANAGED
ON-SITE WASTE MANAGEMENT
OFF-SITE WASTE MANAGEMENT
0
10
20
30
40
50
60
95 96 97 98 99 00 01 02 03 04 05 06
11.6
17.2
37.9
25.6
38.4
47.9
42.0
45.348.0
52.1
46.4
54.9
TOTAL TREATMENT
MILLION POUNDS
Number of Reportable Chemicals Doubled in 1995 Nitrate Reporting Initiative Begun in 1999Seven Industrial Categories Added in 1998 PBT Rule Enacted in 2000
Figure Q
Figure R

Department of Environmental Quality • 25
18.3%
39.0%
40.1%
2.5%
ON-SITE WASTE MANAGEMENT
ON-SITE RELEASES ON-SITE TREATMENT
ON-SITE RECYCLING ON-SITE ENERGY RECOVERY
Figure S
reported for 2006, only 2.3 percent of these were transferred off-site for disposal.
Toxics Release Inventory looks at the total picture of releases and transfers as well as reuse activities and treatment; analysis of the data can be used as an index of the success of prevention and reduction measures. Often states report a reduction in total releases while reporting a corresponding increase in off-site disposals, essentially transferring toxic wastes from one location to another rather than management through reuse, treatment or reductions in wastes or process chemicals. Oklahoma continues to see its total releases as percentages of Total Production Related Wastes diminish along with a decrease in off-site transfers; releases relative to TPRW decreased six percent in the past six years and in 2006, releases accounted for only 18.3 percent of on-site waste management. (Figure S)
Toxic Release Inventory data can be used for targeting facilities, industries or specific chemicals for pollution prevention efforts. The 2006 Oklahoma TRI data reflect the continued success of voluntary programs sponsored by DEQ and cooperation from industries.
The Oklahoma Department of Environmental Quality provides assistance to businesses wanting to reduce the overall volume of toxic chemicals used and also offers strategies for the best reuse techniques. For additional information and business assistance regarding pollution prevention and source reduction measures, contact the DEQ Land Protection Division/Pollution Prevention Programs at 405-702-5100 or 1-800-869-1400, or visit the DEQ website at: http://www.deq.state.ok.us/LPDnew/p2index.htm

26 • TRI Report 2006
0
200
400
600
800
1000
1200
1400
1600
1800
2000
IMPACT OF OIL & GAS SITES ON TIER II REPORTING
2006 TOTAL TIER II REPORTS
2006 OIL & GAS REPORTS
2006 Tier II Overview
Figure T
The owners or operators of all facilities or sites that store hazardous substances on-site must submit Tier II reports annually for each hazardous material stored. Forms are submitted to DEQ acting as an agent of the Oklahoma Emergency Response Commission (OHMERC), and also to appropriate LEPC, and responding local fire departments. Tier II forms require specific information describing the quantities and locations of hazardous substances as defined under the OSHA Hazard Communication Standard, which states that a hazardous chemical or substance is any substance for which a facility must maintain a Material Safety Data Sheet (MSDS). Additionally, a chemical or substance is reportable if the material is present on the site for at least 24 continuous hours in a quantity that equals to or exceeds the reporting threshold. Within
the same program, EPA lists over 250 materials as EHS, and specifies a threshold planning quantity (TPQ) for each. For an EHS the threshold for Tier II reporting is either the TPQ or 500 pounds whichever is lower. The reporting threshold for all other covered substances is 10,000 pounds. Tier II reports also provide the name and address of the owner or operator and two emergency contacts that can be used by emergency responders 24 hours a day.
Over 31,000 of the 33,702 Tier II reports submitted for 2006 were from Oil and Gas sites that include tank batteries as well as production sites. (Table 3) The correlation between total number of Tier II sites and the number of Oil and Gas Tier II sites is based in the State’s petroleum and natural gas production industries. (Figure T) A total of 1,124 reports were received by

Department of Environmental Quality • 27
County Total TIER II Oil & Gas EHS Reports Reports Facilities Adair 24 0 5Alfalfa 387 380 4Atoka 19 10 3Beaver 1,722 1,715 4Beckham 535 518 9Blaine 842 821 6Bryan 31 18 2Caddo 988 967 13Canadian 1,267 1,204 24Carter 728 695 15Cherokee 19 0 6Choctaw 9 0 3Cimarron 83 76 4Cleveland 185 146 19Coal 103 99 3Comanche 174 93 29Cotton 15 8 6Craig 74 57 9Creek 425 365 23Custer 1,625 1,582 22Delaware 23 0 7Dewey 832 816 6Ellis 906 901 0Garfield 1,077 1,008 33Garvin 1,110 1,089 6GradY 1,393 1,353 15Grant 374 358 14Greer 11 3 6Harmon 6 2 2Harper 683 679 1Haskell 305 297 2Hughes 221 211 2Jackson 26 4 14Jefferson 19 13 2Johnston 11 0 3Kay 160 121 16Kingfisher 1,500 1,471 9Kiowa 70 57 7Latimer 169 162 2Leflore 198 168 14Lincoln 343 322 9Logan 530 511 8Love 122 115 4Major 1,982 1,968 3Marshall 53 35 7Mayes 52 5 21Mcclain 564 550 4Mccurtain 23 0 12Mcintosh 136 127 4Murray 33 17 6Muskogee 72 8 23Noble 824 810 9Nowata 282 271 7Okfuskee 158 151 2Oklahoma 940 533 201Okmulgee 79 53 12Osage 440 386 13Ottawa 23 0 11Pawnee 136 116 6Payne 246 199 20Pittsburg 493 466 11Pontotoc 137 123 4Pottawatomie 290 249 17Pushmataha 23 14 4Roger Mills 1,656 1,653 1Rogers 86 2 32Seminole 416 389 7Sequoyah 44 28 8Stephens 1,033 1,009 8Texas 913 894 14Tillman 29 11 9Tulsa 444 4 206Wagoner 35 3 11Washington 87 56 15Washita 546 531 8Woods 1,003 983 8Woodward 1,080 1,068 9Totals 33,702 31,127 1,124
Table 3
DEQ from sites storing one or more EHS. Initially there would seem to be no
correlation between the quantities of stored materials as reported to Tier II and total reported releases under TRI. However comparison between counties ranked according to EHSs stored and counties with the most reported TRI chemicals released, all six counties reporting over a million pounds of TRI releases are among the ten counties with the most EHS chemicals stored. Not all of the greater than 250 EHS chemicals are found on the list of over 600 chemicals reportable under TRI; however, sufficient numbers of chemicals are common to both lists and therefore both programs. While TRI and Tier II satisfy different intentions under the law, facilities reporting under both provide a great deal of chemical information to address public concerns and use for emergency planning. (See Chemicals Reported in 2006)

28 • TRI Report 2006
Facilities Reporting in 2006
NAICS Code Industrial Classification Total Releases, lbs.325311 Nitrogenous Fertilizer Production 5,967,281562211 Hazardous Waste Treatment & Disposal 4,065,027322130 Paperboard Mill 3,276,936221112 Fossil Fuel Electic Power Generation 3,095,701324110 Petroleum Refining 1,496,587311222 Soybean Processing 1,375,168325110 Petrochemical Manufacturing 969,890928110 National Security 914,567311615 Poultry Processing 577,292327121 Brick & Structural Clay Tiles 346,032336612 Boat Building 313,500321219 Reconsitituted Wood Products 291,876332431 Metal Can Manufacturing 186,645332999 Misc. Fabricated Metal Product Manufacturing 182,942311223 Other Oilseed Processing 140,108333618 Engine Equipment Manufacturing 87,926 All Others 2,188,043 25,475,521
Table 4
For RY 2006, 324 Oklahoma facilities reported to TRI, operating under 131 NAICS codes. The EPA expanded TRI in RY 1998 with the addition of seven industrial categories. The added categories, initially listed under SIC codes, are linked to manufacturing by providing power, managing products, managing wastes, or providing limited raw materials for the manufacturing sector.
Manufacturing facilities continue to be the majority of TRI reporters in the State, comprising 307 of 324 facilities reporting for 2006. (Table 4) However, the industries added in RY 1998 continued to impact the data for Oklahoma. Coal-fired electrical plants and commercial hazardous waste management facilities permitted under the Resource Conservation and Recovery Act (RCRA) Subtitle C are two of the categories added for 1998 and together accounted for over 28 percent of all on-site releases in Oklahoma for 2006. Seven of the 25 facilities with the largest
total on-site releases reported the first time for under the 1998 changes and all of these were operational prior to 1998.
The top 25 facilities in terms of largest total on-site releases produced 89.1 percent of releases reported for 2006. (Table 5) However, six of the facilities ranked in the top 25 for releases are also among the 25 facilities reusing toxic chemicals in largest quantities. The facilities practicing greatest reuse by quantity recycled and use for energy recovery accounted for 94.6 percent of total reuse in 2006. As with the overall numbers for reuse, the majority of recycling and energy recovery, 71.4 percent occurred on-site. (Table 6) Chemicals reused on-site do not leave the boundaries of the facility.
Together the ten industrial classifications reporting the largest on-site releases account for 87 percent of reportable releases in the State, (Figure U), with the top 21 industries in terms of on-site releases accounting for 91.4 percent. A brief discussion of the industries with the largest total on-site releases follows.
Nitrogenous Fertilizers Production- NAICS 325311 (SIC 2873)
The use of agricultural chemicals essential to Oklahoma’s agricultural base is not covered under TRI; however, the manufacture of these chemicals and the precursors used to produce them are reportable. Facilities manufacturing nitrogenous fertilizers were the largest source of releases in 2006 as reported to TRI. These facilities produce hydrogen and nitrogen gases from methane (natural gas), then through a catalytic process produce ammonia that is condensed to anhydrous ammonia and finally oxidized to form ammonium nitrate. Methanol is a secondary product of this process. Ammonia accounts for over 91 percent of all TRI chemicals released by this industry.

Department of Environmental Quality • 29
continued on page 31...
Table 5Rank Facility Facility Primary Total Industrial Name County NAICS Releases, Classification Code lbs. Hazardous Waste 1 Clean Harbors-Lone Mountain Major 562211 4,012,409 Treatment & Disposal2 Koch Nitrogen Co. Garfield 325311 3,514,110 Nitrogenous Fertilizer Production3 Weyerhaeuser Co. McCurtain 322130 3,276,951 Paperboard Mill4 Terra Nitrogen LP Verdigris Plant Rogers 325311 1,755,367 Nitrogenous Fertilizer Production5 Solae, Pryor Mayes 311222 1,375,158 Soybean Processing6 Baker Petrolite Corp. Osage 325110 969,890 Petrochemical Manufacturing Northeastern Station Plant- American 7 Electric Power Rogers 221112 856,768 Fossil Fuel Electric Power Generation Grand River Dam Authority 8 Coal Fired Complex Mayes 221112 824,683 Fossil Fuel Electric Power Generation 9 Terra International (Oklahoma) Inc. Woodward 325311 688,230 Nitrogenous Fertilizer Production Tyson Foods Inc. 10 Broken Bow Processing Plant McCurtain 311615 577,292 Poultry Processing11 U.S. Army Fort Sill Comanche 928110 543,357 National Security Conoco-Phillips, 12 Ponca City Facility Kay 324110 532,877 Petroleum Refining13 Western Farmers Electric Co-op. Choctaw 221112 526,336 Fossil Fuel Electric Power Generation14 Muskogee Generating Station - OGE Muskogee 221112 433,780 Fossil Fuel Electric Power Generation Georgia-Pacific 15 Consumer Products LP Muskogee 322121 413,911 Paper Mill16 Sinclair, Tulsa Refining Co. Tulsa 324110 339,904 Petroleum Refining Valero Refining Co. - 17 Oklahoma Valero Ardmore Refinery Carter 324110 312,972 Petroleum Refining18 Tracker Marine LLC Ottawa 336612 288,220 Boat Building U.S. Army Mcalester 19 Army Ammunitions Pittsburg 928110 267,106 National Security20 Sooner Generating Station- OGE Noble 221112 246,442 Fossil Fuel Electric Power Generation21 AES Shady Point LLC Le Flore 221112 207,691 Fossil Fuel Electric Power Generation22 Wynnewood Refining Co. Garvin 324110 190,578 Petroleum Refining Rexam Beverage Can Co. 23 RE: Oklahoma City Plant Oklahoma 332431 186,645 Metal Can Manufacturing Dominance Industries Inc. 24 (DBA Pan Pacific Products) McCurtain 321219 165,387 Reconstituted Wood Products Boral Bricks Of Texas 25 LP Muskogee Plant Muskogee 327121 162,249 Brick & Structural Clay Tiles Plant
Nitrogen fertilizers production is also the second largest source of nitrate compounds releases in the State. Due to the very large quantities of anhydrous ammonia used and stored and the volatility of ammonia, fugitive air emissions are the chief medium for releases from nitrogen fertilizer plants. (See Chemicals Reported in 2006)
Industrial Waste Handlers Permitted Under RCRA Subtitle C- NAICS 562211 (SIC 4953)
Industrial waste handlers permitted to operate RCRA Subtitle C landfills for
hazardous wastes disposal appear to be considerable sources of environmental releases in the State. While some materials transferred to these facilities are neutralized through treatment, the bulk of hazardous wastes managed are disposed into highly regulated and monitored landfills. The toxicity and quantities of chemicals managed at this type of facility can be substantial; however, the risks of public exposure or adverse environmental effects from disposal to a RCRA Subtitle C site are low. Additionally, transfers from Oklahoma facilities to in-state hazardous

30 • TRI Report 2006
Rank Facility Name County Total Recycling Industrial & Energy Classification Recovery, lbs.1 Baker Petrolite Corp. Osage 34,865,810 Petrochemical Manufacturing Eaton Aeroquip Inc. 2 Vinita Facility Craig 16,942,276 Fluid Power Valve & Hose Fitting Manufacturing Terra Nitrogen 3 LP Verdigri S. Plant Rogers 7,577,800 Nitrogenous Fertilizer Production4 American Castings LLC. Mayes 6,966,554 Iron Foundries 5 Centrilift Cable Plant Rogers 5,571,254 Copper Wire (Except Mechanical) Drawing 6 Koch Nitrogen Co. Garfield 5,455,000 Nitrogenous Fertilizer Production7 Sheffield Steel Corp. Tulsa 3,558,658 Iron & Steel Mills8 Baker Petrolite Corp. Tulsa 1,886,860 Misc. Chemical Product & Preparation Manufacturing Valero Refining Co.- 9 Ardmore Refinery Carter 1,696,625 Petroleum Refining Halliburton Energy Service- 10 Duncan Manufacturing Center Stephens 1,482,300 Oil & Gas Field Equip. Manufacturing AC & Heating Equip. & Commercial & Industry 11 Temtrol, Inc. Kingfisher 1,232,466 Refrigeration Manufacturing U.S. Army Mcalester Army 12 Ammunition Plant Pittsburg 820,559 National Security13 Hawk Corp. Wellman Products Rogers 632,500 Powder Metallurgy Part Manufacturing 14 Norit Americas Inc. Mayes 621,479 Misc. Chemical Product & Preparation Manufacturing Acme Engineering & 15 Engineering & Corp. Muskogee 515,500 Ind. & Commercial Fan & Blower Manufacturing16 Simmons Metal Container Muskogee 504,793 Metal Can Manufacturing American Foundry Group LLC. 17 Alloy 2 Facility Muskogee 472,130 Steel Foundries 18 National Standard LLC. Payne 463,126 Steel Wire Drawing 19 Sulzer Chemtech, Tulsa Tulsa 440,002 Misc. Fabricated Metal Product Manufacturing20 Gemini Coatings Inc. Canadian 435,267 Paint & Coating Manufacturing21 Sulzer Chemtech USA Tulsa 405,000 Misc. Fabricated Metal Product Manufacturing22 Roll-Offs USA Bryan 389,857 Misc. Fabricated Metal Product Manufacturing Valmont Coatings- Oklahoma Metal Coating, Engraving & Allied Ser., 23 Galvanizing Rogers 357,100 Exc. Jewelry & Silverware24 Goodyear Tire & Rubber Co. Comanche 300,022 Tire Manufacturing 25 Wynnewood Refining Co. Garvin 270,680 Petroleum Refining
Table 6

Department of Environmental Quality • 31
continued on next page...
waste treatment, storage and disposal sites result in a ‘‘double counting” effect, that is, the chemicals reported as transferred in-state for treatment, storage or disposal will be counted again in the quantities of releases reported by the TSD. Similarly, transfers of chemicals from out-of-state facilities for disposal to RCRA Subtitle C landfills located in Oklahoma are counted as releases in this state. Consequently Oklahoma’s total land releases rose significantly when this industrial sector was required to report to TRI.
Paperboard Mills- NAICS 322130 (SIC 2631)Another industry utilizing large
amounts of volatile chemicals is paperboard manufacturing. Pulp paper is formed into various pressed paper products, a process which uses both ammonia and
methanol. Methanol increasingly is used by this industry as an alternative to more toxic organo-chloride compounds, and paperboard mills accounted for over 85 percent of reportable methanol releases in 2006. Permitted stack air releases of methanol account for 71 percent of all releases for this industry in 2006.
Fossil Fuel Electric Power Generation- NAICS 221112 (Coal-Fired Utilities- SIC 4911)
This industry was required to report for the first time for 1998 and contributed to a significant rise in Oklahoma’s figures for land and air releases. Electricity generating plants in the State utilize coal as a source of all or part of their fuel. All power generating plants operating in Oklahoma consume fossil fuels to generate electricity.
23.4%
16.0%12.9%
12.2%
5.9%
5.4%3.8%
3.6% 2.3% 1.4% 1.2%
1.1% 0.7% 0.7%0.5%
0.3%8.6%
TOTAL RELEASES BY INDUSTRIAL SECTOR
Nitrogenous Fertilizer Production Hazardous Waste Treatment & Disposal
Paperboard Mill Fossil Fuel Electic Power Generation
Petroleum Refining Soybean Processing
Petrochemical Manufacturing National Security
Poultry Processing Brick & Structural Clay Tiles
Boat Building Reconsitituted Wood Products
Metal Can Manufacturing Misc. Fabricated Metal Product Manufacturing
Other Oilseed Processing Engine Equipment Manufacturing
All Others
Figure Ucontinued on next page...

32 • TRI Report 2006
Seven fossil fuel powered utilities reported chemical usage above thresholds for 2006. The majority of chemicals reported by this industry are either components of bituminous coal or formed during its combustion. (See Chemicals Reported in 2006) For example, 95 percent of on-site barium compounds releases in 2006 came from this industry. Overwhelmingly chemicals releases by fossil fuel-fired utilities are permitted, stack air emissions, and these are greatly reduced through the use of in-line air scrubbers and neutralizers. Comparatively small quantities of metallic compounds are released through stack air emissions; the bulk of these compounds are found in residual ashes and released into permitted on- and off-site landfills.
Petroleum Refining- NAICS 324110 (SIC 2911)
Petroleum refining is the physical, thermal and chemical separation of crude oil into its major distillation fractions which then are processed through separation and conversion steps into finished petroleum products. The chief products of this industry fall into three categories: fuels such as gasoline, diesel, liquefied petroleum gas, jet fuel and kerosene; finished nonfuel products such as solvents, lubricating oils and greases, petroleum wax and jelly, asphalt and coke; and chemical industry feed-stocks such as naphtha, ethane, propane, butane, ethylene, propylene, butadiene, benzene, toluene and xylenes. The latter
are primary materials for a large number of products, including pesticides, paints, waxes, thinners, solvents, detergents, refrigerants, resins, sealants, latex, plastics and synthetic fibers. Petroleum fuels comprise about 40 percent of the total energy consumed in the U.S., based on BTUs. Approximately 90 percent of the petroleum products used in the U.S. is fuels, with gasoline accounting for about 43 percent of the total. Five petroleum refineries were operational in Oklahoma in 2006, and together accounted for approximately six percent of total on-site releases in the State for the year. Petroleum refining was the chief source for reportable releases of polyaromatic compounds (PACs), in particular benzo(g,h,i)perylene in Oklahoma in 2006.
Soybean Mills- NAICS 311222 (SIC 2075)Soybean mills process soybeans through
fermentation and extract proteins to form a variety of products for human and livestock consumption. Nitrate compounds are the largest reportable component in the waste streams of this industry, and figures for releases of these compounds were greatly affected by the Nitrate Reporting Initiative begun in 1999. Increases in reported nitrates released by this industry alone resulted in an increase in excess of three times that for all reported releases to surface water in the State combined. As striking as the increase appears, it represented an improvement in the accuracy of reporting nitrates rather than an actual increase in discharges of these compounds.

Department of Environmental Quality • 33
20.7%
12.7%12.1%
5.9%
4.1%
3.9%
3.4%
2.6%2.3%
2.1%1.9% 1.8% 1.7% 1.7% 1.5%1.2% 1.1%
1.1%1.0%
0.5%
0.5%0.4%
0.4%
15.5%
TRI CHEMICALS RELEASES
Ammonia Nitrate Compounds Methanol Barium Compounds Hydrogen Fluoride
Toluene Hydrochloric Acid Aerosols Copper Styrene Manganese Compounds
Ethylene Xylenes Chromium Compounds Sulfuric Acid Aerosols Lead Compounds
Glycol Ethers n-Hexane Zinc Compounds Copper Compounds Nickel Compounds
Ethylene Glycol PBTs, less Lead Compounds 1,2,4- Trimethyl benzene All Others
Chemicals Reported in 2006
Figure V
Oklahoma facilities reported the manufacture, process or otherwise use of 123 listed toxic chemicals or chemical groups for 2006. The chemicals released in greatest quantities are illustrated in Figure V. The ten chemicals released in greatest quantities are discussed below, and together ammonia, nitrate compounds, methanol, barium compounds, hydrogen fluoride, toluene, hydrochloric acid aerosols, copper, styrene and manganese compounds accounted for 69.8 percent of all chemicals released or managed, as defined by TRI. (Table 7) The chemicals reported for 2006 are largely a reflection of commerce in the State.
Ammonia remained the chemical released in the largest quantities in Oklahoma during 2006, as in previous years and accounted for 20.7 percent of all toxic chemicals released in Oklahoma for the year.
This compound is a component of fertilizers and stock feeds, and over 91 percent of ammonia releases came from this industry. Ammonia gas is used by other industries as a refrigerant, while ammonia solutions are used in paper pulping operations and food processing. (Figure W) Twenty-six facilities reported a total of over five million pounds of ammonia released in 2006; however total ammonia releases decreased by over 25 percent from 2004 to 2006.
Due to its volatility, 98 per cent of reported ammonia releases are air emissions. Ammonia gas produces highly irritating and corrosive vapors and is an inhalation and dermal hazard. Skin contact with ammonia vapor or compressed gas may result in cryogenic burns as well. Nitrogen fertilizers production uses anhydrous gaseous ammonia, which is hygroscopic and
continued on next page...

34 • TRI Report 2006
91.8%
3.2% 1.0%
1.0%
1.0%0.5%
0.5%0.5%
0.2%0.2%0.1%
0.1%
SOURCES OF AMMONIA RELEASES
Nitrogenous Fertilizer Production Petroleum Refining Powder Metallurgy Part Manufacturing
Paperboard Mill Cookie and Cracker Manufacturing Cement Manufacturing
Poultry Processing Hazardous Waste Treatment & Disposal Paper Mill
Dairy Product Manufacturing Animal Slaughtering, except Poultry All Others
Rank Chemical Or Chemical Group Total Releases, lbs.1 Ammonia 5,261,4022 Nitrate Compounds 3,223,5533 Methanol 3,094,9834 Barium Compounds 1,505,3375 Hydrogen Fluoride 1,051,3136 Toluene 1,004,8217 Hydrochloric Acid Aerosols 863,4548 Copper 655,5109 Styrene 574,29110 Manganese Compounds 531,27111 Ethylene 482,70712 Xylenes 462,00113 Chromium Compounds 439,88014 Sulfuric Acid Aerosols 433,81415 Lead Compounds 378,59116 Glycol Ethers 306,37317 n-Hexane 281,50418 Zinc Compounds 272,95319 Copper Compounds 257,57820 Nickel Compounds 135,96421 Ethylene Glycol 125,23722 PBTs, less Lead Compounds 95,27323 1,2,4- Trimethyl benzene 92,462 All Others 3,945,249
Table 7
Figure W
therefore extremely damaging to the mucus membranes of the eyes and respiratory tract.
Nitrate compounds are another group of nitrogen containing chemicals and are chiefly released by soybean mills and fertilizer production. (Figure X) This group of chemicals was reported by a total of 22 facilities in the State in 2006 and accounted for 12.7 percent of total releases. At ambient temperatures, nitrates exist as solid salts containing the nitrate ion, for example, sodium nitrate, silver nitrate and ammonium nitrate. However, in aqueous solutions, the form in which most nitrate compounds are used and released, the compounds dissociate to form negatively charged nitrate ions and the corresponding cautions. The production of water dis-sociable nitrates in waste streams, frequently formed by nitric acid neutralization, often

Department of Environmental Quality • 35
continued on next page...
42.1%
31.4%
17.1%
8.8%
0.6%
0.1%
SOURCES OF NITRATE COMPOUNDS RELEASES
Soybean Processing Nitrogenous Fertilizer Production Poultry Processing
Petroleum Refining Misc. Food Manufacturing Commercial Lithographic Printing
Figure X
was excluded from the calculations of numbers reported to TRI. Beginning with RY 1999, EPA’s Nitrate Initiative sought to improve the accuracy of nitrate release numbers by addressing the under reporting of water dissociable nitrate compounds. Additional clarification stated that nitrate anions formed by the dissociation of any nitrate-containing chemical are reportable, regardless of whether the compound itself is listed under Section 313. As a result of the Nitrate Initiative, Oklahoma saw a substantial increase in the overall numbers reported for nitrates and a consequential and dramatic increase in the figures for releases to surface waters, POTWs and landfills as well as in treatment figures. Solutions of nitrate compounds can be disposed into deep underground injection wells, and in fact, injection is the means of disposal used most often by industrial waste management operations handling these chemicals. This method of disposal
presents an extremely small risk of human exposure. Certain geological formations may cause naturally high concentrations of nitrates in potable groundwater.
Prolonged ingestion of high concentrations of nitrates oxidizes the iron in hemoglobin to form methemoglobin in the blood leading to methemoglobinemia (“blue-baby” syndrome). Children and in particular infants under age six months are most susceptible to this disease and most likely to suffer long term deleterious effects from it.
Methanol, also known as methyl alcohol or wood alcohol, is a common industrial solvent, and was reported by 36 facilities in 19 different industrial classifications for total releases of over three million pounds. Primary users of methanol in Oklahoma are the wood processing and paper production industries. Methanol also is a secondary product of ammonia fertilizer plants. (Figure Y) It is highly

36 • TRI Report 2006
85.4%
3.8%3.7% 1.9% 1.8% 1.6%
0.8% 0.4%
0.2%
0.4%
SOURCES OF METHANOL RELEASES
Paperboard Mill Reconsitituted Wood Products
Nitrogenous Fertilizer Production Sawmills
Petroleum Refining Paper Mills except newsprint
Commercial Lithographic Printing Misc. Chemical Product & Prep. Manufacturing
Chemical & Allied Products Merchant Wholesalers All Others
Figure Ycontinued on page 38...
volatile and flammable, and virtually all releases of methanol are permitted air emissions. Exposure to vapors can result in eye irritation, headaches, fatigue and drowsiness; exposure to high doses may cause temporary coma. Methanol is highly water soluble and ingestion of the compound can cause permanent blindness, liver damage and death; however, the risk of this means of exposure from environmental contaminants is very low.
Barium is a naturally occurring metal, and small quantities of barium containing compounds can be present naturally in the soils of Oklahoma. Barium compounds have varied industrial uses, however, under TRI reporting requirements, these chemicals were reported chiefly as managed industrial wastes from non-combustible components of coal found in the ash produced by coal-fired electrical plants. (Figure Z) Fly ash
along with other barium compounds most frequently is disposed to land through the use of permitted sanitary landfills, RCRA Subtitle C regulated disposal facilities and surface impoundments. Barium compounds accounted for 5.0 percent of total TRI releases in the State in 2006.
The ability of barium compounds to create health or environmental hazards is dependent on the water solubility of individual compounds and the toxicity of each. Generally, relatively high concentrations of barium are required to be toxic or hazardous. Ingestion is the most common means of exposure, although the dust of dry barium compounds may pose an inhalation hazard. Potential health effects from exposure to high concentrations of barium or barium compounds are gastric irritation, muscle

Department of Environmental Quality • 37
71.7%
25.7%
1.3% 0.9%0.4%
<0.1%
SOURCES OF HYDROGEN FLUORIDE RELEASES
Fossil Fuel Electic Power Generation Brick & Structural Clay Tiles Truck Trailer Manufacturing
Petroleum Refining Basic Inorganic Chemical Manufacturing All Others
94.9%
3.0% 2.1%<0.1%
SOURCES OF BARIUM COMPOUNDS RELEASES
Fossil Fuel Electic Power Generation Paperboard Mill
Hazardous Waste Treatment & Disposal All Others
Figure Z
Figure AA

38 • TRI Report 2006
47.5%
12.8%
10.2%
6.5%
4.4%
4.0%2.5%
2.3% 2.2%1.9%
1.2%
1.0%
0.8%
0.8%
0.6%
1.3%
SOURCES OF TOLUENE RELEASES
Petrochemical Manufacturing Petroleum Refining
Commercial Gravure Printing Misc. Fabricated Metal Product Manufacturing
Heavy Duty Truck Manufacturing Motor & Generator Manufacturing
Misc. Chemical Prod. & Prep. Manufacturing Paint & Coating Manufacturing
Heavy Gauge Metal Tank Manufacturing Engine Equipment Manufacturing
Custom Woodwork & Millwork Manufacturing Magnetic & Optical Recording Media Manufacturing
Aircraft Manufacturing Aircraft Parts & Auxiliary Equipment Manufacturing
Other Plastics Product Manufacturing All Others
Figure BB
fatigue, cardiac arrhythmia, and damage to internal organs. Barium sulfate (barite) is excluded from TRI reporting.
Hydrogen fluoride is a colorless gas with a sharp, acrid odor. It is hygroscopic and readily dissolves in water to form hydrofluoric acid. In its gaseous state, releases occur to the air and inhalation is the means of exposure. Even at low levels hydrogen fluoride is an eye, skin and respiratory irritant as hydrofluoric acid is formed when the gas comes into contact with moisture in these organs. Acute inhalation exposure at high concentrations may cause pulmonary edema and cardiac arrhythmia. Hydrofluoric acid is extremely corrosive and may cause severe burns.
Hydrogen fluoride is formed during coal combustion and this is the largest source of releases in the State. (Figure AA) Other common uses are as a catalyst or hardener
or an agent to etch glass. Fifteen facilities reported hydrogen fluoride releases for 2006.
Toluene, also known as methyl benzene or toluol, is an aromatic compound and is a clear, colorless liquid at ambient temperature and pressure with a sweet, pungent odor. It is a widely used industrial solvent, a component of paints, inks, adhesives, degreasers and cleaning agents, and used for chemical extractions. (Figure BB) During petroleum refining, toluene is isolated, and back blended into fuels. It also is a by-product of styrene production. Toluene accounted for 3.9 percent of total releases in 2006 and was reported by thirty-six facilities. Because of its volatility, the majority of toluene released to the environment is through stack or fugitive air emissions.
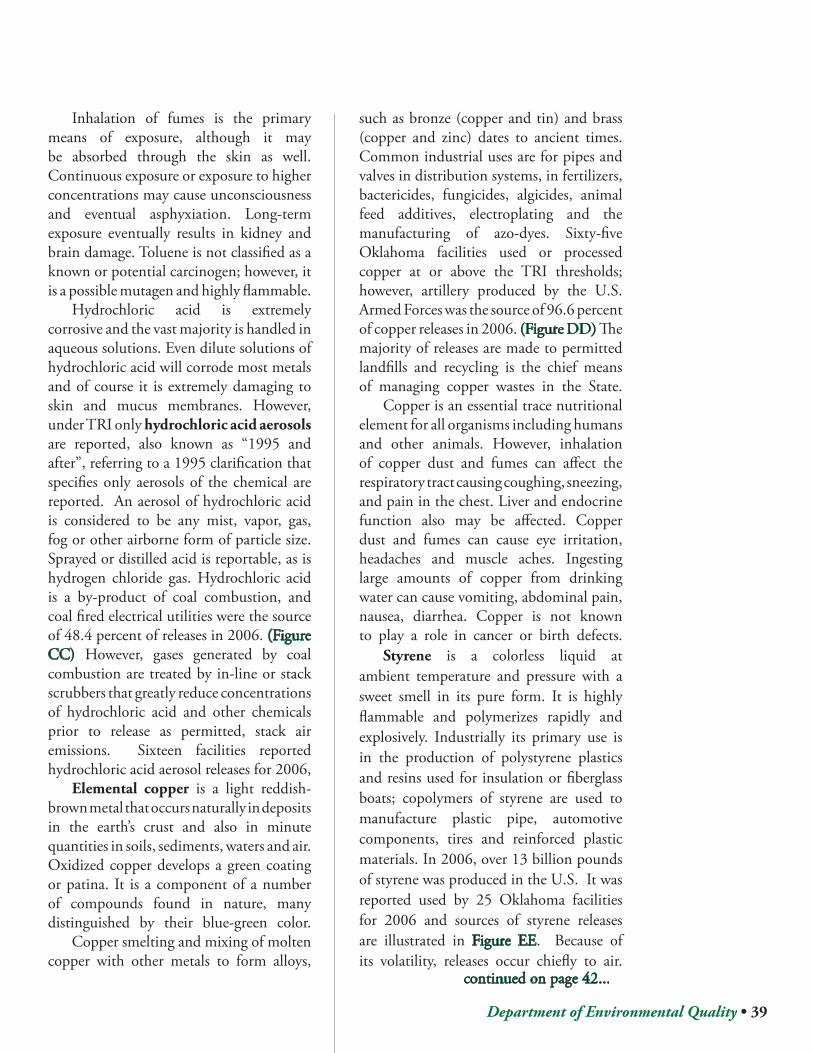
Department of Environmental Quality • 39
continued on page 42...
Inhalation of fumes is the primary means of exposure, although it may be absorbed through the skin as well. Continuous exposure or exposure to higher concentrations may cause unconsciousness and eventual asphyxiation. Long-term exposure eventually results in kidney and brain damage. Toluene is not classified as a known or potential carcinogen; however, it is a possible mutagen and highly flammable.
Hydrochloric acid is extremely corrosive and the vast majority is handled in aqueous solutions. Even dilute solutions of hydrochloric acid will corrode most metals and of course it is extremely damaging to skin and mucus membranes. However, under TRI only hydrochloric acid aerosols are reported, also known as “1995 and after”, referring to a 1995 clarification that specifies only aerosols of the chemical are reported. An aerosol of hydrochloric acid is considered to be any mist, vapor, gas, fog or other airborne form of particle size. Sprayed or distilled acid is reportable, as is hydrogen chloride gas. Hydrochloric acid is a by-product of coal combustion, and coal fired electrical utilities were the source of 48.4 percent of releases in 2006. (Figure CC) However, gases generated by coal combustion are treated by in-line or stack scrubbers that greatly reduce concentrations of hydrochloric acid and other chemicals prior to release as permitted, stack air emissions. Sixteen facilities reported hydrochloric acid aerosol releases for 2006,
Elemental copper is a light reddish-brown metal that occurs naturally in deposits in the earth’s crust and also in minute quantities in soils, sediments, waters and air. Oxidized copper develops a green coating or patina. It is a component of a number of compounds found in nature, many distinguished by their blue-green color.
Copper smelting and mixing of molten copper with other metals to form alloys,
such as bronze (copper and tin) and brass (copper and zinc) dates to ancient times. Common industrial uses are for pipes and valves in distribution systems, in fertilizers, bactericides, fungicides, algicides, animal feed additives, electroplating and the manufacturing of azo-dyes. Sixty-five Oklahoma facilities used or processed copper at or above the TRI thresholds; however, artillery produced by the U.S. Armed Forces was the source of 96.6 percent of copper releases in 2006. (Figure DD) The majority of releases are made to permitted landfills and recycling is the chief means of managing copper wastes in the State.
Copper is an essential trace nutritional element for all organisms including humans and other animals. However, inhalation of copper dust and fumes can affect the respiratory tract causing coughing, sneezing, and pain in the chest. Liver and endocrine function also may be affected. Copper dust and fumes can cause eye irritation, headaches and muscle aches. Ingesting large amounts of copper from drinking water can cause vomiting, abdominal pain, nausea, diarrhea. Copper is not known to play a role in cancer or birth defects.
Styrene is a colorless liquid at ambient temperature and pressure with a sweet smell in its pure form. It is highly flammable and polymerizes rapidly and explosively. Industrially its primary use is in the production of polystyrene plastics and resins used for insulation or fiberglass boats; copolymers of styrene are used to manufacture plastic pipe, automotive components, tires and reinforced plastic materials. In 2006, over 13 billion pounds of styrene was produced in the U.S. It was reported used by 25 Oklahoma facilities for 2006 and sources of styrene releases are illustrated in Figure EE. Because of its volatility, releases occur chiefly to air.

40 • TRI Report 2006
96.6%
1.3% 1.3%
0.5%
0.2%
SOURCES OF COPPER RELEASES
National Security Secondary Alloying of Aluminum
Powder Metallurgy Part Manufacturing Power Boiler & Heat Exchanger Manufacturing
All Others
48.4%
30.1%
8.8%
6.0%5.4% 1.3%
0.1%
SOURCES OF HYDROCHOLORIC ACID AEROSOLS RELEASES
Fossil Fuel Electic Power Generation Paper Mills except newsprint
Brick & Structural Clay Tiles Paperboard Mills
Misc. Chemical Product & Prep. Manufacturing Petroleum Refining
Plastics & Resin Manufacturing
Figure CC
Figure DD

Department of Environmental Quality • 41
Figure EE
Figure FF
38.9%
24.6%
18.8%
5.7%4.6%
2.9% 2.4% 1.4%
0.4% 0.2%<0.1%
SOURCES OF STYRENE RELEASES
Boat Building Traveling Crane, Hoist & Monorail System Manufacturing
Other Plastics Product Manufacturing Plastics Plumbing Fixture Manufacturing
Cut Stone & Stone Product Manufacturing Plastics Pipe & Pipe Fitting Manufacturing
Plastics Material & Resin Manufacturing Plastics & Rubber Industry Machinery Manufacturing
National Security Photographic Film, Paper, Plate Chemical Manufacturing
All Others
52.0%
31.6%
15.3%0.7%0.2%
0.2%
SOURCES OF MANGANESE COMPOUNDS RELEASES
Paperboard Mill Hazardous Waste Treatment & Disposal Fossil Fuel Electic Power Generation
Iron and Steel Mills National Security All Others

42 • TRI Report 2006
Styrene exposure occurs chiefly through inhalation although it can be absorbed through the skin and ingested as well. Exposure to styrene vapors is irritating to eyes and mucous membranes, causes nausea and inflammatory reactions. Excessive or prolonged exposure may cause neurotoxicity including intoxication, fatigue and impaired memory and attention as well as decreased ability to distinguish colors. Chronic effects of exposure may include hearing loss and liver damage.
Manganese is the twelfth most common element and a component of many common minerals, although it does not occur naturally as a pure metal. Manganese compounds ranked tenth as the chemical or chemical group released in greatest quantities statewide in 2006, and was reported by 29 facilities. Industrial applications for manganese-containing compounds are many. (Figure FF) Ferromanganese mixtures improve the strength and hardness of carbon steel, stainless steel, high-temperature steel, tool steel, cast iron and alloys and manganese compounds contained in steel account for the largest amount of these chemicals reported to TRI nationally. These compounds also are components of
ash from coal-fired electrical utilities, and in Oklahoma this accounts for the majority releases after disposal to RCRA Subtitle C landfills. Manganese compounds are used in glazes, varnishes and ceramics.
Manganese through manganese compounds is another trace element essential in the diet for human health. Ingestion of large quantities or inhalation of particulates of manganese compounds has toxic effects similar to those for copper exposure. The central nervous system is targeted and a combination of mental and emotional disturbances coupled with poor hand and body coordination are symptomatic of a disease called manganism. Weakness and lethargy may ensue as well. The symptoms progress with continued exposure that eventually causes Parkinson-like tremors and difficulty in walking which are irreversible.
The list of chemicals and chemical families reportable under TRI continues to change. Beginning with RY 1995, the list increased from 313 to over 600 chemicals or chemical groups. The PBT Rule went into effect in 2000 (see Persistent, Bioaccumulative, Toxic Chemicals, below). The Final Rule for Lead, which set the reporting threshold for lead or lead compounds at 100 pounds per year, applied for the first time in 2001. Concerned parties outside of the EPA may petition the agency to add or delete chemicals from the list.
The materials reported to Tier II as stored in greatest quantities for 2006 are listed in Table 8. Five of the materials reported stored in greatest quantities, crude oil, gasoline, diesel fuel, hydrogen sulfide and butane are directly related to Oklahoma’s energy production industries. With the exception of hydrogen sulfide and ammonia, the only EHSs listed, the Tier II reporting threshold for all other chemicals or materials is 10,000 pounds greater.
Rank Chemical/Material Reported 2006 Total Stored, lbs.1 Crude Oil 30,420,300,0002 Coal 3,508,100,0003 Cement, Asphalt 2,328,435,3214 Gasoline 2,036,323,7985 Diesel 1,661,761,8136 Fly Ash 1,028,035,7547 Propane 541,594,6168 Ammonia 453,070,8799 Kerosene 426,081,35610 Methanol 266,700,41811 Hydrogen Sulfide 250,901,63412 Toluene 128,918,33213 Urea 119,350,00014 Petroleum Coke 75,000,00015 Ammonium Nitrate 59,644,814 Total 43,304,218,735
Table 8

Department of Environmental Quality • 43
Ammonia, as with TRI reporting, was by far the EHS stored in greatest quantities due to the production and storage of nitrogenous fertilizers. Hydrogen sulfide from “sour gas” wells at oil production sites was not reported or underreported in previous years. While hydrogen sulfide is reportable under TRI, oil and gas production activities are not covered by that program, therefore hydrogen sulfide from “sour gas” wells at oil production sites is not reported to TRI. Because Tier II covers only storage, chemicals produced as wastes or byproducts such as nitrate compounds frequently are unreported. Chlorine is reportable under both programs, however; significantly greater quantities are reported to Tier II as municipal water treatment plants are not covered under TRI. Hydrofluoric acid also is reportable under TRI and is an EHS. Methanol while not an EHS ranked tenth by total quantities reported under Tier II and was the third TRI chemical released in greatest quantities.
Ammonia, its sources and effects were discussed in the above TRI section. The other EHS reported in greatest quantities under Tier II is considered below.
Hydrogen sulfide as stated is a byproduct of oil and natural gas production, making this industry the greatest source of reported hydrogen sulfide in the State. However, hydrogen sulfide also is produced
naturally as well as from other industrial processes such as sewage treatment plants, swine farms, and pulp and paper operations, petroleum refineries and petrochemical plants, natural gas plants, food processing, and tanneries. Hydrogen sulfide is a poisonous, highly flammable, colorless gas with a characteristic odor of rotten eggs, the unpleasant scent associated with “sewer gases”. Mixtures of the gas and air are explosive. It can be detected by smell at fairly low concentrations in air, however, at high concentrations, the human ability to smell the gas can be lost and causing hydrogen sulfide to be very dangerous. The primary means of exposure is through inhalation although the chemical is irritating to the eyes and mucous membranes. Exposure affects the central nervous system and may result in unconsciousness. Prolonged exposure may result in death. Inhalation of gas may cause pulmonary edema as a delayed effect. Rapid evaporation of the compressed liquid may cause frostbite. Combustion of hydrogen sulfide produces toxic sulfur oxides.
Information provided on the storage of hazardous and potentially dangerous materials to the Hazardous Chemical Inventory is intended both to protect emergency responders and facilitate planning for chemical emergencies.

44 • TRI Report 2006
TRI Persistent, Bioaccumulative and Toxic Chemicals
Table 9PBT Chemicals and Thresholds Manufacture, Process And Otherwise Use Thresholds Aldrin 100 lbs./Yr.Lead 100 lbs./Yr.Lead Cmpds. 100 lbs./Yr.Methoxychlor 100 lbs./Yr.Pendimethalin 100 lbs./Yr.Polycyclic Aromatic Cmpds. (PASs) 100 lbs./Yr.Tetrabromobisphenol A 100 lbs./Yr.Trifluralin 100 lbs./Yr.Chlordane 10 lbs./Yr.Benzo(g,h,i) Perylene 10 lbs./Yr.Heptachlor 10 lbs./Yr.Hexachlorobenzene 10 lbs./Yr.Isodrin 10 lbs./Yr.Mercury 10 lbs./Yr.Mercury Cmpds. 10 lbs./Yr.Octachlorostyrene 10 lbs./Yr.Polychlorinated Biphenyls (PCBs) 10 lbs./Yr.Pentachlorobenzene 10 lbs./Yr.Toxaphene 10 lbs./Yr.Dioxin And Dioxin-Like Cmpds. 0.1 gm/Yr.
The most significant recent change to the list of chemicals reportable under TRI was the 1999 Final Rule on Persistent, Toxic and Bioaccumulative chemicals, (64 CFR 58666). Chemicals designated as PBTs are of particular concern as they are demonstrated to be highly toxic, difficult to destroy, tend not to degrade but persist in the environment and accumulate in the body tissues of humans and wildlife, (bioaccumulate). Implementation of the PBT rule should be viewed as a step in addressing one of the chief limitations of TRI data, specifically, the wide variability in toxicity between different chemicals. Beginning with RY 2000, reporting thresholds for eighteen chemicals or chemical groups classified as persistent, bioaccumulative, toxic were lowered substantially. With the Final Rule for Lead and Lead Compounds promulgated for RY 2001 (66 CFR 4500), the list was completed to its current form. (Table 9) Thresholds take into account both the individual
toxicity of the given chemical and the risks for exposure to it. Seven chemicals and two chemical families previously not reportable under Section 313 were added to the list as part of the final PBT rule. The present PBT list is composed of organo-chlor pesticides, other highly chlorinated or brominated aromatic compounds, chemicals with multiple, linked aromatic rings (polyaromatic compounds), and two heavy metals reported as elements or compounds.
The lowered thresholds apply to all reportable activities, that is, no alternate thresholds for ‘otherwise use’ are applicable. Use of Form A is disallowed for any PBT chemical. The de minimus concentration exemption is not applicable for any PBT chemical, with the exception of lead containing alloys. Persistent, Bioaccumulative and Toxic chemical thresholds do not apply to lead contained in stainless steel, brass or bronze alloys. When lead or lead compounds contained in these alloys are reported, the 25,000 pound threshold for produce and manufacture and the 10,000 pound threshold for otherwise use remain in effect.
Oklahoma companies reported eleven PBT chemicals for 2006. (Table 10) Over one half of TRI facilities in the State reported at least one PBT chemical for a total of 193 facilities. Despite the frequency of PBTs reported, these chemicals nominally affect TRI data for the State. Less than two percent of all TRI releases and only about seven percent of total production related wastes reported in Oklahoma for 2006 resulted from releases, transfers or other management of PBTs.
Lead and lead compounds accounted for almost 96 percent of all PBT releases reported for 2006. Of the 12.87 million pounds of PBTs reported, 11.57 million pounds came from recycling of lead and lead containing compounds. This was the

Department of Environmental Quality • 45
Table 10 Facilities Air Land UI Water One-Time Total Transfers Treatment Reuse TPRW Releases Releases Releases Releases Releases Releases
Benzo(g,h,i) Perylene 17 140.0 9.0 0.0 7.0 0.0 156.0 37.0 53.0 70,504.0 70,750.0Dioxins 20 12.0 gm 13.0 gm 0.0 gm 0.0 gm 0.0 gm 25.0 gm 5.0 gm 0.0 gm 0.0 gm 30.0 gmHexachlorobenzene 1 0.0 12.0 0.0 0.0 0.0 12.0 0.0 0.0 0.0 12.0Lead 55 1,670.0 74,069.0 0.0 4.0 14,485.0 90,228.0 73,472.0 0.0 8,881,999.0 9,045,699.0Lead Compounds 53 365,774.0 519.0 427.0 0.0 366,720.0 103,963.0 0.0 2,692,832.0 3,163,515.0Mercury 6 278.0 29.0 0.0 1.0 0.0 308.0 96.0 0.0 3.0 407.0Mercury Compounds 17 1,374.0 3,071.0 0.0 5.0 0.0 4,450.0 601.0 0.0 0.0 5,051.0Polychlorinated Biphenyls (PCBs) 1 3.0 10,013.0 0.0 0.0 0.0 10,016.0 0.0 0.0 0.0 10,016.0Polycyclic Aromatic Compounds (PACs) 21 2,280.0 382.0 0.0 9.0 0.0 2,671.0 2,207.0 3,148.0 555,016.0 563,042.0Tetrabromo-bis-phenol A 1 7.0 0.0 0.0 0.0 0.0 7.0 0.0 7,000.0 0.0 7,007.0Trifluralin 1 1,903.0 0.0 0.0 0.0 0.0 1,903.0 0.0 0.0 0.0 1,903.0 Totals 193 7,655.0 453,359.0 519.0 453.0 14,485.0 476,471.0 180,376.0 10,201.0 12,200,354.0 12,867,402.0
All TPRW parameters are expressed in pounds except "Dioxins" which are expressed in grams.
continued on page 48...
fourth year that the 100-pound threshold applied for both lead and lead compounds. While the reported numbers for releases of both increased with the implementation of the 2001 Final Rule, this does not indicate greater quantities of these chemicals were released into the environment but rather is indicative of an improvement in the reporting of these chemicals. It is important to note that those facilities reporting the greatest usage and waste management for lead and compounds use primarily lead containing alloys and therefore continue to report under the higher thresholds.
Fifty-five Oklahoma facilities reported lead releases in 2006. The Armed Forces is the major source of elemental lead releases. (Figure GG) Other industrial sectors using lead include the production of inorganic chemicals, miscellaneous chemical products and steel wire drawing.
Industries reporting total releases of lead compounds are shown in Figure HH. Over 83 percent of these ‘releases’ were permitted land disposals at highly regulated RCRA Subtitle C hazardous waste facilities. Releases to these sites have extremely minimal potential for adverse impacts on the environment or human health.
Mercury compounds are trace constituents of coal and crude oil, and are released in minute quantities by the combustion of these fuels. Trace quantities of naturally occurring mercury in native rock also accounts for the production of mercury compounds in hydraulic cement kilns. However, 65.7 per cent of all mercury compounds releases reported in 2006 were permitted land disposals into highly regulated RCRA Subtitle C landfills. (Figure II) Chemicals manufactured and distributed for sole use in industrial processes were the major source of elemental mercury releases, (Figure JJ), with petroleum refining, paper mills and cement kilns making up the balance. The health hazards of mercury and compounds are well documented, it is important to keep the scale in perspective. For 2006, only 308 pounds of mercury were reported released throughout the entire State with combined releases of mercury and mercury compounds less than twenty-six thousandths of one percent (.00258%) of total releases reported in Oklahoma for 2006.
Polyaromatic compounds (PACs), also known as polynuclear aromatics (PNAs) or polycyclic aromatic hydrocarbons (PAHs)

46 • TRI Report 2006
83.7%
3.8%2.9%
2.8%2.5% 1.3%
0.9%0.7% 0.5%
0.2%
0.7%
SOURCES OF LEAD COMPOUNDS RELEASES
Hazardous Waste Treatment & Disposal Fossil Fuel Electic Power Generation Paper Mills except Newsprint
National Security Paperboard Mill Cement Manufacturing
Lime Manufacturing Iron and Steel Mills Petroleum Refining
Misc. Chemical Prod. & Prep. Manufacturing All Others
95.1%
2.3%1.0%
0.7% 0.3%
0.3%
0.1%
SOURCES OF LEAD RELEASES
National Security Basic Inorganic Chemical Manufacturing
Misc. Chemical Prod. & Prep. Manufacturing Steel Wire Drawing
Iron Foundries Secondary Alloying of Aluminum
All Others
Figure GG
Figure HH

Department of Environmental Quality • 47
35.4%31.8%
22.4% 10.4%<0.1%
SOURCES OF MERCURY RELEASES
Misc Chemical Product & Prep Manufacturing Petroleum Refining
Cement Manufacturing Paper Mills except Newsprint
All Others
Figure II
Figure JJ
65.7%
32.9%
0.6%
0.3%0.2%
0.1%
<0.1%
SOURCES OF MERCURY COMPOUNDS RELEASES
Hazardous Waste Treatment & Disposal Fossil Fuel Electic Power Generation Paperboard Mill
Petroleum Refining Lime Manufacturing Cement Manufacturing
All Others

48 • TRI Report 2006
67.4%
12.5%
9.7%
8.8%
0.7%
0.6% 0.1%
0.1%
0.1%
SOURCES OF POLYCYCLIC AROMATIC COMPOUNDS RELEASES
Petroleum Refining Fossil Fuel Electic Power Generation
Paperboard Mill Asphalt Paving & Roofing Materials Manufacturing
Tire Manufacturing Petroleum & Coal Products Manufacturing
Petroleum Bulk Stations & Terminals Basic Inorganic Chemical Manufacturing
All Others
Figure KKcontinued on page 50...
describe a group of related chemicals that generally occur as complex mixtures rather than as discrete compounds. These chemicals are byproducts of incomplete combustion of fossil fuels or incineration of organic materials such as wood or garbage. Polyaromatics are natural components of crude oil and are produced during petroleum refining. (Figure KK) As major constituents of carbon black, tire manufacturing also is a significant source of PAC releases. While benzo(ghi)perylene is a polyaromatic compound, it is the only one of these chemicals listed as a separate PBT. There are no specific commercial uses of benzo(ghi)perylene alone although like other PACs it is produced by incomplete combustion. As would be expected, the largest source of benzo(ghi)perylene releases, petroleum refining, is the same as that for polyaromatics in general. (Figure LL)
Dioxin and dioxin-like chemicals refers to a group of chlorinated aromatic compounds containing the dioxin linkage, that is, a double substitution of oxygen in an aromatic ring. These chemicals once were used as defoliants and pesticides; however, in the past 20 years the only dioxins manufactured for commercial use in the United States are extremely small quantities for research purposes. Dioxins are the only TRI chemicals reported in grams with a reporting threshold of 0.1 gram. Releases of dioxins in 2006 totaled only 25 grams, or 0.053 pounds. No dioxins were reported transferred, treated or reused. Dioxins are incidentally produced as byproducts from combustion of fossil fuels or incineration of organic materials, formed as paper pulp is bleached, or appear as impurities in chlorinated pesticides. (Figure MM)

Department of Environmental Quality • 49
continued on page 50...
Figure LL
Figure MM
84.0%
6.8%
4.3% 1.9% 1.9% 1.2%
SOURCES OF BENZO(g,h,i)PERYLENE RELEASES
Petroleum Refining Paperboard Mill Fossil Fuel Electic Power Generation
Petroleum & Coal Products Manufacturing Tire Manufacturing All Others
55.3%
15.1%
9.8%
7.7%
3.3%3.2% 1.5% 1.3% 3.0%
SOURCES OF DIOXINS RELEASES
Paperboard Mill Fossil Fuel Electic Power Generation
Asphalt Paving Mixture and Block Manufacturing Cement Manufacturing
Iron & Steel Mills Paper Mills except Newsprint
Reconsitituted Wood Products Sawmills
All Others

50 • TRI Report 2006
The most commonly known dioxin, tetrachlorodibenzo-p-dioxin (2,3, 7,8-TCDD) is highly toxic and classified as a known carcinogen; however, as with most families of chemicals, there is a wide variability in toxicity between 2,3,7,8-TCDD and other congeners. Toxic Release Inventory reporting for dioxin and dioxin-like compounds requires the distribution between seventeen of the most chlorinated dioxin compounds be reported as well. Therefore, assumptions concerning the toxicity of reported dioxins require analyzing the distribution of compounds.
Tetrabromobisphenol A is used as a reactive flame retardant in epoxy, vinyl esters and polycarbonate resins and in polymers, polystyrenes, phenolic resins, adhesives, paper, and textiles. It was reported by only one facility in the State for 2006 with total releases of seven pounds.
Reported releases of polychlorinated biphenyls (PCBs) in 2006 were by a single landfill permitted under RCRA Subtitle
C, that is, these chemicals were managed by an Oklahoma TSD rather than generated or used by an in-state industry.
Modifications and additions to the list of PBT chemicals should be expected. For example, EPA deferred a decision in the final rule on dicofol, a pesticide, until the agency further evaluates data on its persistence. Cobalt and cobalt compounds were considered for the initial PBT list as well; however, EPA deferred the decision pending more investigation into the bioaccumulative properties of these chemicals. Another pesticide, mirex, already considered a PBT for Pollution Prevention activities could eventually be listed as such for TRI reporting, and additionally benzo(a)pyrene, another PAC, could be separated out for discreet reporting. As with previous expansions in TRI reporting, future changes in PBT reporting will make the data more representative and thereby better inform the public of chemical risks in the community.

This publication is issued by the Department of Environmental Quality as authorized by Steve Thompson, Executive Director. Copies have been printed at a cost of $1.35 each. Copies have been deposited with the Publications Clearinghouse of the Oklahoma Department of Libraries. 06/09. CMullins\CustomerService\TRI\TRI Report 2006\TRI1up.indd

52 • TRI Report 2006
GlossaryAcid aerosols- Mists, vapors, gas, fog
and other airborne forms of any particle size of a chemical; current TRI usage refers to aerosols of sulfuric acid or hydrochloric acid.
Bioaccumulation- The process by which organisms may accumulate chemical substances in their bodies. The term refers to both uptakes of chemicals from water and from ingested foods and sediment residues.
Chemical Abstract Service (CAS); numerical designations for chemicals generated under the CAS system are discrete identifiers.
de minimis- An exemption to TRI reporting whereby any chemical or chemical group that comprises less than 1% of a mixture need not be reported even if the total quantity of the chemical exceeds the threshold quantity. If Occupational Safety and Health Administration (OSHA) list the chemical or chemical group as a carcinogen, the de minimis concentration drops to 0.1%.
DEQ- Oklahoma Department of Environmental Quality
Extremely Hazardous Substance (EHS)- any of over 250 chemicals listed as such under by the Hazardous Chemical Inventory (Tier II) under Section 302 of SARA Title III
EPA- the federal Environmental Protection Agency
EPCRA- Emergency Planning and Community Right to Know (see SARA Title III)
Energy Recovery- Recovery of useful energy from waste mainly through combustion of chemical waste.
Facility- Defined for the purposes of TRI reporting as all buildings, equipment, structures and other stationary items which are located on a single site or on contiguous or adjacent sites and which are owned or operated by the same entity.
Form A- The abbreviated version of the Toxic Chemical Release Inventory Form for TRI reporting, used when total releases of chemical or chemical group during a calendar year do not exceed 500 pounds and the total amount manufactured, processed or otherwise used does not exceed one million pounds. Form A is actually a certification statement attesting to these conditions. More than one chemical or group can be reported on one Form A.
Form R- The Toxic Chemical Release Inventory Form standard for TRI reporting. Facility information and activities relating to a specific chemical are stated on a Form R along with releases and the media into which the chemical is released, transfers and treatment of wastes, and sources reductions and reuse.
Fugitive (Non-Point) Air Releases- Emissions to the air that are not conveyed through stacks, vents, ducts, pipes or other confined air streams. Examples include equipment leaks from valves, pump seals, flanges, compressors, sampling connections, open-ended lines and evaporative losses from surface impoundments and spills.
Local Emergency Planning Committee (LEPC); LEPCs are mandated under SARA Title III.

Department of Environmental Quality • 53
continued on next page...
Manufacture- To produce, prepare, import or compound a toxic chemical.
North American Industrial Classification System (NAICS)- the standard used by Federal statistical agencies in classifying business establishments for the purpose of collecting, analyzing, and publishing statistical data related to the U.S. business economy. The NAICS was developed by the Office of Management and Budget and adopted in 1997 to replace the Standard Industrial Classification (SIC) system, and adopted for TRI for RY 2006. Industries in the United States are identified by a six-digit code, the first two digits indicating one of 20 different broad industrial sectors.
Off-Site Locations- Locations outside the boundaries of a facility to which wastes are transported for treatment, energy recovery, recycling or disposal.
Otherwise Use- Any use of a toxic chemical at a facility which is not covered by the definition of manufacture or process. This includes any activities in which a listed toxic chemical does not become intentionally incorporated into the final product for distribution in commerce. Examples of otherwise use include but are not limited to degreasers, solvents in paints that are applied to a product, chemicals used in water treatment and refrigerants or coolants.
Polynuclear Aromatic Hydrocarbons (PAH), also known as PNAs; a group of chemicals characterized by multiple, joined aromatic rings.
PBT- for TRI reporting, those chemicals designated by the EPA to be Persistent, Bioaccumulative and Toxic
Polychlorinated Biphenyls (PCB), individually identified by Arachlor series; the higher the Arachlor series number the greater the degree of chlorination. Once used in electrical transformer oil.
Persistence- As related to chemicals in the environment, the length of time a chemical can exist in the environment before being destroyed (i.e., transformed) by natural processes.
Publicly Owned Treatment Works (POTW)- A wastewater treatment facility that is owned by a unit of the government.
Process- Refers to the preparation of a listed toxic chemical after its manufacture for distribution in commerce. Processing is usually the intentional incorporation of a toxic chemical into a product. It includes but is not limited to making mixtures, repackaging or using a toxic chemical as a feedstock, raw material or starting material for making another chemical.
RCRA- Resource Conservation and Recovery Act
Recycle- The process of capturing a useful product from a waste stream. Solvent recovery, metals recovery and acid regeneration are examples of recycling.
Releases- Refers to on-site discharges of TRI listed chemicals to the air, water, land or disposal in underground injection wells. Includes permitted, accidental and non-permitted discharges.
Releases to Air- Sum of Fugitive (Non-Point) Air Releases plus Stack (Point Source) Air Releases.

54 • TRI Report 2006
Releases to Land- Refers to land filling, surface impoundments, land treatment/application farming or any other release of a toxic chemical to land within the boundaries of a facility.
Releases to Water- Refers to discharging of chemicals to surface waters, ie, rivers, lakes, ponds and streams.
SARA Title III- The section of the Superfund Amendments and Reauthorization Act (SARA) which mandates Emergency Planning and Community Right to Know.
Stack (Point Source) Air Releases- Emissions to the air that are conveyed through stacks, vents, ducts, pipes or other confined air streams. Examples include storage tank emissions from air pollution control equipment.
Standard Industrial Classification Code (SIC)- A four digit number code designated by the Federal Office of Management and Budget to describe the type of activity(s) at a facility. The first two numbers of the code define a major business sector, and the last two numbers define a facility’s specialty within the major sector. SIC has been replaced by NAICS for TRI and other reporting and no further revisions to SIC be planned.
Threshold Planning Quantity (TPQ)- quantity of a stored EHS requiring emergency planning also used as reporting threshold for Tier II
Tier II- the form for reporting chemical storage under Section 312 of SARA Title III and synominous with the program, also known as the Hazardous Chemical Inventory
Toxic- A substance that produces or causes a systemic damage to an organism, for example acute or chronic neurological, respiratory or reproductive disorders, also carcinogenic or teratogenic effects.
TRI- Toxics Release Inventory; Section 313 of SARA Title III
Transfers- Refers to TRI listed chemicals sent off-site for energy recovery, recycling, treatment or disposal. Reported as transfers to either Publicly Owned Treatment Works or other off-site transfers (non-POTW) such as incinerators, landfills, other treatment, recycling, energy recovery or disposal facilities not part of the reporting facility.
TSD- Treatment, Storage and Disposal facility for industrial wastes.