Oklahoma SoonerCare (Medicaid) and the Affordable Care … · Oklahoma SoonerCare (Medicaid) and...
22
Oklahoma SoonerCare (Medicaid) and the Affordable Care Act (ACA) Cindy Roberts, CPA Cindy Roberts, CPA Cindy Roberts, CPA Cindy Roberts, CPA OHCA Deputy CEO OHCA Deputy CEO OHCA Deputy CEO OHCA Deputy CEO Buffy Heater, MPH Buffy Heater, MPH Buffy Heater, MPH Buffy Heater, MPH Director of Planning & Development Director of Planning & Development Director of Planning & Development Director of Planning & Development
Transcript of Oklahoma SoonerCare (Medicaid) and the Affordable Care … · Oklahoma SoonerCare (Medicaid) and...

Oklahoma SoonerCare
(Medicaid)
and the
Affordable Care Act (ACA)
Cindy Roberts, CPA Cindy Roberts, CPA Cindy Roberts, CPA Cindy Roberts, CPA OHCA Deputy CEOOHCA Deputy CEOOHCA Deputy CEOOHCA Deputy CEO
Buffy Heater, MPH Buffy Heater, MPH Buffy Heater, MPH Buffy Heater, MPH Director of Planning & DevelopmentDirector of Planning & DevelopmentDirector of Planning & DevelopmentDirector of Planning & Development

SoonerCare
Today

SoonerCare Landscape - Today
(Members as of September 2010 Fast Facts)
Insured (2.2M) and
Uninsured (500K)
Children
491K
Parents
48K
Sooner Plan
28K
Pregnant Women
34K
Oklahoma Cares
2100
250% FPL $45,775
200% FPL $36,620
185% FPL $33,874
133% FPL $24,352
100% FPL $18,310
37% FPL
Annualincome
Family of 3
InsureOklahoma
32K
Long Term Care
16K
Aged, Blind, Disabled
127K
300% FPL $54,930
SoonerCare

Federal Poverty Level (FPL) Guidelines
2009-2010
Persons infamily/HH 100% 133% 185% 200% 250% 300%
1 $10,830 $14,404(6.93)
$20,036 $21,660 $27,075 $32,490
2 $14,570 $19,378(9.32)
$26,955 $29,140 $36,425 $43,710
3 $18,310 $24,352(11.71)
$33,874 $36,620 $45,775 $54,930
4 $22,050 $29,327(14.10)
$40,793 $44,100 $55,125 $66,150
5 $25,790 $34,301(16.49)
$47,712 $51,580 $64,475 $77,370
6 $29,530 $39,275(18.88)
$54,631 $59,060 $73,825 $88,590

Challenge: Oklahoma’s Uninsured
Children and Adults Uninsurance Rates by FPL in Oklahoma (2009)
9%8%
16%
32%
0%
5%
10%
15%
20%
25%
30%
35%
children adults
300%+ FPL
<300% FPL
Source: US Census Bureau, CPS Table Creator. http://www.census.gov/hhes/www/cpstc/cps_table_creator.html
61.9%
15.7%18.4%
Children < 300% FPL
Children 300% + FPL
Adults < 300% FPL
Adults 300% + FPL
Distribution of Oklahoma’s Uninsured Children and Adults by FPL (2009)
21.8%
13.2%
62.0%
US
OK
Oklahoma Uninsured 2009Total 18% (658,862 persons)Children (0-18) 13% (130,605 children)Adults (19+) 20% (528,257 adults)

Generation “Five”
Medicaid and the ACA

Insured and Uninsured
Health Care Coverage - 2014
(Members as of September 2010 Fast Facts)
250% FPL
200% FPL
185% FPL
133% FPL
Children
491K
50KNew
SoonerCare200K
Long Term Care
16K
Aged, Blind, Disabled
127K
300% FPL
$45,775
$36,620
$33,874
$24,352
$18,310
Annual income
Family of 3
$54,930
SoonerCare

Participation Scenarios
2014
Low 57% Medium 75% High 100%
Newly Qualified 110,000 145,000 200,000
Woodwork 30,000 35,000 50,000
Total Enrolled 140,000 180,000 250,000
State Share $23.8 M $31.2 M $41.6 M
Source: Presentation by Kaiser Family Foundation on 5/26/10 reported an estimated 57% standard participation rate for all populations affected by reform. This was calculated from the base CBO participation rates used to cost the federal reform legislation. In addition, when presenters considered outreach efforts and other methods states might employ to seek out coverage for previously uninsured individuals, the participation rate is estimated to be as high as 75%, which is referred to as an enhanced participation rate. http://www.kff.org/healthreform/8076.cfm
Oklahoma FMAP Outlook:
Newly Qualified
64.43
74.94
100 100 10095 94
9390 90
40
50
60
70
80
90
100
Percent Federal Dollars
Regular ARRA 2014 2015 2016 2017 2018 2019 2020 FutureYears…
Time Period
Source: CMS, Regular reflects FY 2010 FMAP Estimates
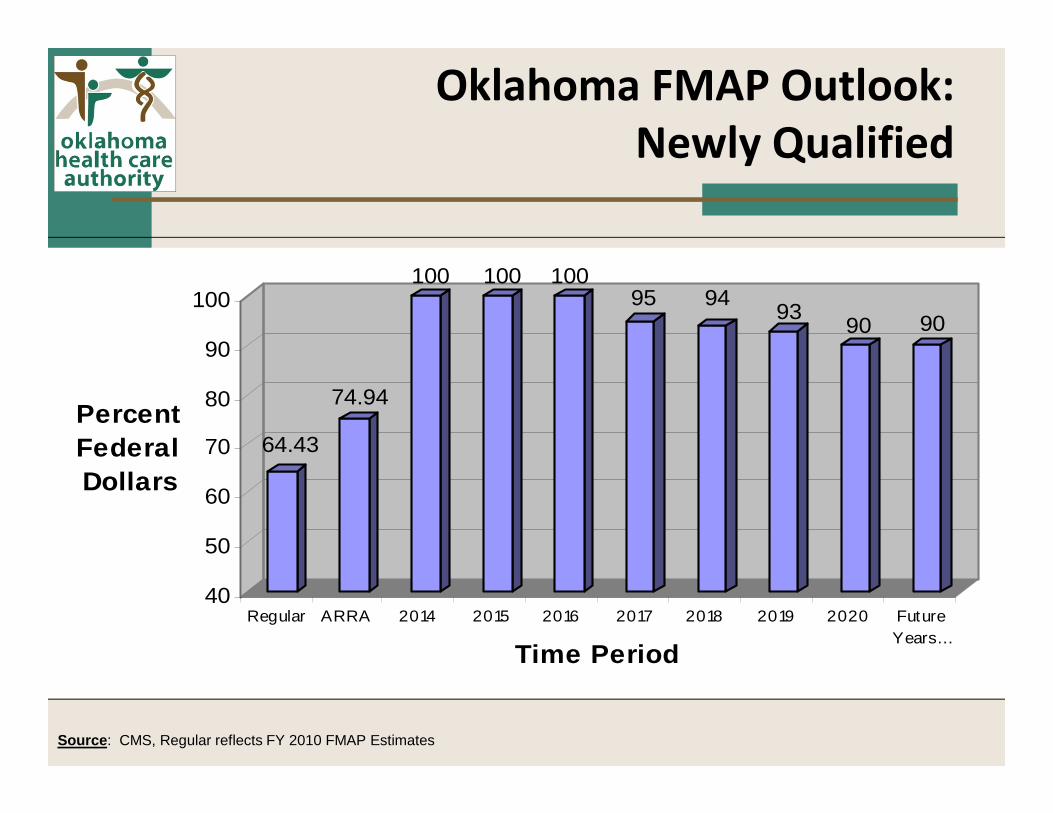
State Dollar Offsets
• Pregnant Women
• Insure Oklahoma
• Oklahoma Cares (Breast & Cervical Cancer Services)
• SoonerPlan (Family Planning Services)
• Other State Agencies

Impact Analysis for Planning
www.implan.com
Years
Avg AnnualState
Dollars
Avg Annual Federal Dollars
JobsAvg
Annual Earnings
Avg Annual OK Tax
Rev2014 - 2016 $42.3
Million$600 Million 22,500 $530 Million $71.7
Million
2017 - 2019 $73 Million
$600 Million 23,900 $570 Million $76 Million
2020 $95 Million
$607 Million 24,800 $574 Million $79 Million
New Members: 200,000 newly qualified 50,000 woodwork effect

Eligibility Rule Changes
MAGI (Modified Adjusted Gross Income)
• Intended to simplify
• Consistency between states
• New data matches

Information System
Changes

New CMS IT Guidance
• Service Oriented Architecture
• Reusable
• Interoperable
• Scalable
• Ease of Use

CMS IT Funding
• Enhanced funding available - Medicaid Eligibility Systems (thru 12-15-2015)
– 90% match - design, development and implementation
– 75% match - ongoing operations• Must meet or exceed new CMS IT guidance
• In the past only 50% match for development and operations
Federal / State Decisions
and Concluding Steps

ACA Requirements…
Decisions still needed…
• Benefit Packages

Other Authority and Approvals
• State Plan Amendments
• Waivers
• Promulgated Policy
• Tribal Consultation
• Medical Advisory Committee
• OHCA Board
• Legislature
• Oklahoma Governor

Accountable Care
Organizations

Accountable Care Organizations
(ACO)
Defined:• Medicare Shared
Savings Program or Pioneer ACO Model.
• ACO’s are networks of physicians and other providers working together.
• Improve the quality of health care services and reduce costs for a defined patient population.
Eligible Providers:• Group practices• Independent practice
associations • Networks of individual
practitioners• Partnerships of hospitals
and professionals• Hospitals that employ
professionals• Other groups

ACO Basic Features
• ACO must agree to at least a three-year contract
• Must serve an assigned Medicare patient population of at least 5,000
• Invisible Member Enrollment
• Performance Measurement
• Shared Savings
• Stronger Incentives (Future)
Source: Health Affairs, Health Policy Brief, Accountable Care Organizations, http://www.rwjf.org/files/research/66449.pdf

ACO Challenges
• Volume-based incentives for providers
• Slow growth / uptake
• Significant upfront investment
• No early incentives & financial rewards
• Long-range savings dependent upon culture change