Oklahoma School Testing Program 2012 Technical Report ...
144
Oklahoma ACE EOI 2012 Technical Report Pearson, Inc. and SDE Confidential i Oklahoma School Testing Program 2012 Technical Report Achieving Classroom Excellence End-of-Instruction Assessments Submitted to The Oklahoma State Department of Education August 2012
Transcript of Oklahoma School Testing Program 2012 Technical Report ...

Oklahoma ACE EOI 2012 Technical Report
Pearson, Inc. and SDE Confidential
i
Oklahoma School Testing Program
2012 Technical Report
Achieving Classroom Excellence
End-of-Instruction
Assessments
Submitted to The Oklahoma State Department of Education
August 2012
Oklahoma ACE EOI 2012 Technical Report
Pearson, Inc. and SDE Confidential
ii
Executive Summary
Introduction
The Oklahoma School Testing Program (OSTP) is a state-wide assessment program that includes the End-of-Instruction (EOI) assessments, where students who complete an area of instruction must also take the corresponding standardized assessment. The subjects included within this testing program are Algebra I, Algebra II, Geometry, Biology I, English II, English III, and U.S. History. Each test is a measure of a student’s knowledge relative to the Priority Academic Student Skills (PASS), Oklahoma’s content standards. These tests are part of the Achieving Classroom Excellence (ACE) legislation passed in 2005 and amended in 2006, which outlines the curriculum, the competencies, and the testing requirements for students to receive a high school diploma from the state of Oklahoma. Algebra I, English II, Biology I, and U.S. History were existing tests in the program with Algebra II, Geometry, and English III added as operational tests for the 2007-2008 testing cycle. These End-of-Instruction tests are administered in Winter, Trimester, Spring, and Summer. The OSTP was established to improve academic achievement for all Oklahoma students, and it also meets the requirements of the No Child Left Behind Act (NCLB), which was introduced by the Federal Government in 2001. In 2006, Pearson was contracted by the Oklahoma State Department of Education (SDE) to develop, administer, and maintain the OSTP-ACE EOI tests. This report provides technical details of work accomplished through the end of Spring 2012 on these tests. Purpose
The purpose of this Technical Report is to provide objective information regarding technical aspects of the OSTP-ACE EOI assessments. This volume is intended to be one source of information to Oklahoma K-12 educational stakeholders (including testing coordinators, educators, parents, and other interested citizens) about the development, implementation, scoring, and technical attributes of the OSTP-ACE EOI assessments. Other sources of information regarding the OSTP-ACE EOI tests—administered mostly online, with some paper formatted tests available—include the administration manuals, interpretation manuals, student-, teacher-, and parent guides, implementation materials, and training materials. The information provided here fulfills legal, professional, and scientific guidelines (AERA, APA, & NCME, 1999) for technical reports of large-scale educational assessments and is intended for use by qualified users within schools who use the OSTP-ACE EOI assessments and interpret the results. Specifically, information was selected for inclusion in this report based on NCLB requirements and the following Standards for Educational and Psychological Testing:
Standards 6.1 – 6.15 Supporting Documentation for Tests
Standards 10.1—10.12 Testing Individuals with Disabilities
Standards13.1—13.19 Educational Testing and Assessment This technical report provides accurate, complete, current, and clear documentation of the OSTP-ACE EOI development methods, data analysis, and results, and is appropriate for use by qualified users and technical experts. Section 1 provides an overview of the test design, test content, and content standards. Section 2 provides summary information about the test administration. Section 3 details the classical item analyses and reliability results. Section 4 details the calibration, equating, scaling analyses, and results. Section 5 provides the results of the classification accuracy and classifications studies. Finally, Section 6 provides higher-level summaries of all the tests included in the OSTP-ACE EOI testing program.

Oklahoma ACE EOI 2012 Technical Report
Pearson, Inc. and SDE Confidential
iii
Information provided in this report presents valuable information about the OSTP-ACE EOI assessments regarding:
1. Content standards, 2. Content of the tests, 3. Test form design, 4. Administration of the tests, 5. Identification of ineffective items, 6. Detection of item bias, 7. Reliability of the tests, 8. Calibration of the tests, 9. Equating of tests, 10. Scaling and scoring of the tests, and 11. Decision accuracy and classification.
Each of these facets in the OSTP-ACE EOI assessments development and use cycle is critical to validity of test scores and interpretation of results. This technical report covers all of these topics for the 2011-12 testing year.

Oklahoma ACE EOI 2012 Technical Report
Pearson, Inc. and SDE Confidential
iv
Table of Contents
Section 1 ..................................................................................................... 1
1.1 Overview of the OSTP-ACE EOI Assessments .................................................... 1 1.1.a Purpose ......................................................................................... 1 1.1.b PASS Content Standards ...................................................................... 2
1.2 Summary of Test Development and Content Validity .......................................... 3 1.2.a Aligning Test to PASS Content Standards .................................................. 3 1.2.b Item Pool Development and Selection ..................................................... 4 1.2.c Configuration of the Seven Tests ............................................................ 5 1.2.d Operational and Field Test Items by Content Area ....................................... 6
Section 2 .................................................................................................... 14
2.1 Packaging and Shipping ........................................................................... 14
2.2 Materials Return ................................................................................... 14
2.3 Materials Discrepancies Process ................................................................. 15
2.4 Processing Assessment Materials Returned by Schools ....................................... 15
Section 3 .................................................................................................... 17
3.1 Sampling Plan and Field Test Design ............................................................ 17 3.1.a Sampling Plan ................................................................................. 17 3.1.b Field Test Design ............................................................................. 17 3.1.c Data Receipt Activities ...................................................................... 17
3.2 Classical Item Analyses ............................................................................ 19 3.2.a Test-Level Summaries of Classical Item Analyses ........................................ 19
3.3 Procedures for Detecting Item Bias ............................................................. 20 3.3.a Differential Item Functioning Results ..................................................... 21
3.4 Data Review ........................................................................................ 22 3.4.a Results of Data Review ...................................................................... 23
3.5 Test Reliability ..................................................................................... 24
3.6 Test Reliability by Subgroup ..................................................................... 25
3.7 Inter-rater Reliability ............................................................................. 27
Section 4 .................................................................................................... 30
4.1 Item Response Theory Models .................................................................... 30
4.2 Pre-Equating ........................................................................................ 31
4.3 Assessment of Fit to the IRT Model.............................................................. 31 4.3.a Calibration and IRT Fit Results for Post-Equated Tests ................................. 32
4.4 Calibration and Equating ......................................................................... 33 4.4.a Common Linking Items for Spring 2012 .................................................... 33
4.5 Item Stability Evaluation Methods ............................................................... 34 4.5.a Results of the Item Parameter Item Stability Check .................................... 35
4.6 Scaling and Scoring Results ....................................................................... 35
Oklahoma ACE EOI 2012 Technical Report
Pearson, Inc. and SDE Confidential
v
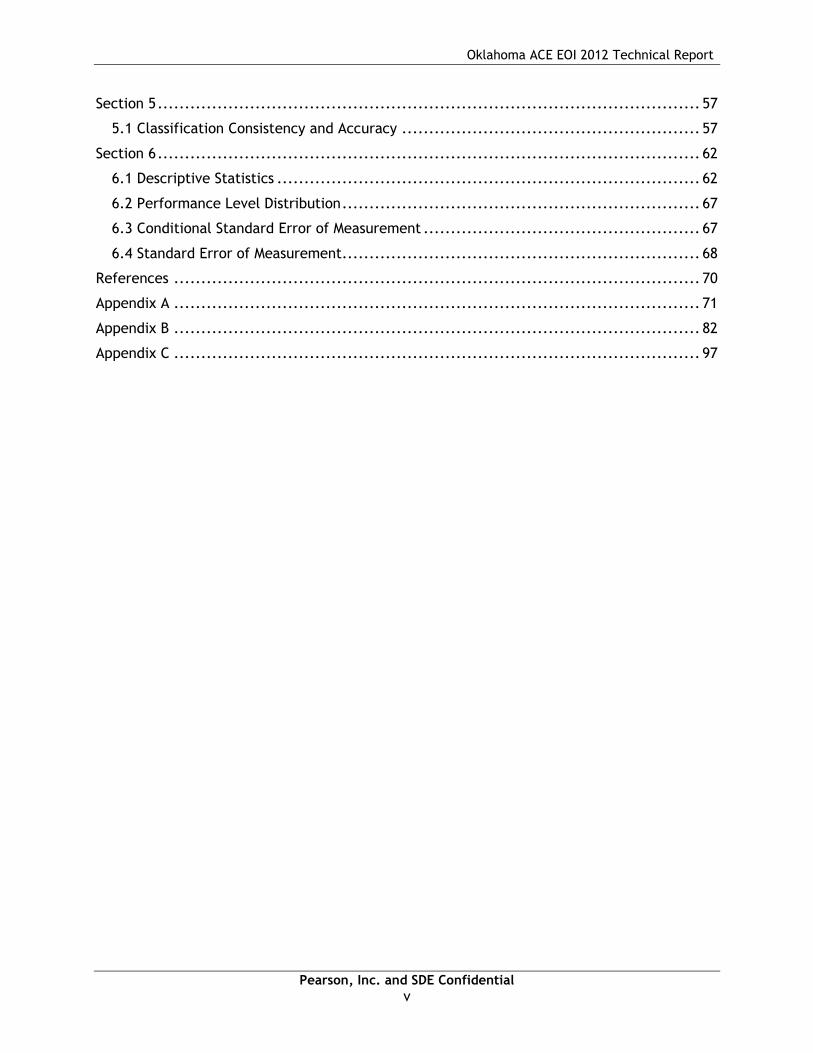
Section 5 .................................................................................................... 57
5.1 Classification Consistency and Accuracy ....................................................... 57
Section 6 .................................................................................................... 62
6.1 Descriptive Statistics .............................................................................. 62
6.2 Performance Level Distribution .................................................................. 67
6.3 Conditional Standard Error of Measurement ................................................... 67
6.4 Standard Error of Measurement.................................................................. 68
References ................................................................................................. 70
Appendix A ................................................................................................. 71
Appendix B ................................................................................................. 82
Appendix C ................................................................................................. 97

Oklahoma ACE EOI 2012 Technical Report
Pearson, Inc. and SDE Confidential
vi
List of Tables
Table 1.1. Oklahoma Content Standards by Subject .................................................. 2 Table 1.2. Criteria for Aligning the Test with PASS Standards and Objectives. ................... 4 Table 1.3. Percentage of Items by Depth of Knowledge Levels ..................................... 5 Table 1.4. Configuration of the OSTP-ACE EOI Tests for Winter/Trimester 2011-12 ............. 6 Table 1.5. Configuration of the OSTP-ACE/EOI Tests for Spring 2012 .............................. 6 Table 1.6. Number of Common Linking Items per Subject for Spring 2012 ........................ 6 Table 1.7. Number of Items and Points by Content Standard for Algebra I ........................ 7 Table 1.8. Number of Items and Points by Content Standard for Algebra II ....................... 8 Table 1.9. Number of Items and Points by Content Standard for Geometry ....................... 9 Table 1.10. Number of Items and Points by Content Standard for Biology I ...................... 10 Table 1.11. Number of Items and Points by Content Standard for English II ..................... 11 Table 1.12. Number of Items and Points by Content Standard for English III ..................... 12 Table 1.13. Number of Items and Points by Content Standard for U.S. History .................. 13 Table 3.1. Demographic Characteristics of Student Sample for Winter/Trimester 2011-12 ... 18 Table 3.2. Demographic Characteristics of Student Sample for Spring 2012 ..................... 18 Table 3.3. Test-Level Summaries of Classical Item Analyses for Winter/Trimester 2011-12 and Spring 2012 ................................................................................................. 20 Table 3.4. DIF Flag Incidence Across All OSTP-ACE EOI Field Test Items for Winter/Trimester 2011-12 and Spring 2012 ................................................................................. 22 Table 3.5. Number of Items Per Subject Flagged and Rejected During Winter/Trimester 2011–2012 and Spring 2012 Field Test Data Review ......................................................... 24 Table 3.6. Cronbach’s Alpha for Winter/Trimester 2011-12 and Spring 2012 Administrations by Subject ...................................................................................................... 25 Table 3.7. Test Reliability by Subgroup for Spring 2012 ............................................. 26 Table 3.8.Inter-rater Reliability for English II Operational Writing Prompts for Winter/Trimester 2011-12 and Spring 2012 ........................................................... 28 Table 3.9. Inter-rater Reliability for English III Operational Writing Prompts for Winter/Trimester 2011-12 and Spring 2012 ........................................................... 29 Table 4.1. Number of Common Linking Items Per Subject for Spring 2012 ....................... 33 Table 4.2. LOSS, HOSS, and Scaling Constants by Subject .......................................... 35 Table 4.3. Performance-Level Cut Scores by Subject ................................................ 36 Table 4.4. Raw Score to Scale Score Conversion Tables for Winter/Trimester 2011-12 ........ 37 Table 4.5. Raw Score to Scale Score Conversion Tables for Spring 2012 .......................... 43 Table 5.1. Estimates of Accuracy and Consistency of Performance Classification for Winter/Trimester 2011-12 ............................................................................... 58 Table 5.2. Estimates of Accuracy and Consistency of Performance Classification for Spring 2012 ......................................................................................................... 58 Table 5.3. Accuracy and Consistency Estimates by Cut Score: False Positive- and False Negative Rates for Winter/Trimester 2011-12 ........................................................ 60 Table 5.4. Accuracy and Consistency Estimates by Cut Score: False Positive- and False Negative Rates for Spring 2012 .......................................................................... 61 Table 6.1. Descriptive Statistics of the Scale Scores for Winter/Trimester 2011-12 - Overall . 62 Table 6.2. Descriptive Statistics of the Scale Scores for Winter/Trimester 2011-12 by Gender ............................................................................................................... 62 Table 6.3. Descriptive Statistics of the Scale Scores for Winter/Trimester 2011-12 by Race/Ethnicity ............................................................................................. 62 Table 6.4. Descriptive Statistics of the Scale Scores for Winter/Trimester 2011-12 by Free/Reduced Lunch Status .............................................................................. 63

Oklahoma ACE EOI 2012 Technical Report
Pearson, Inc. and SDE Confidential
vii
Table 6.5. Descriptive Statistics of the Scale Scores for Spring 2012 - Overall .................. 64 Table 6.6. Descriptive Statistics of the Scale Scores for Spring 2012 by Gender ................ 64 Table 6.7. Descriptive Statistics of the Scale Scores for Spring 2012 by Race/Ethnicity ....... 65 Table 6.8. Descriptive Statistics of the Scale Scores for Spring 2012 by Free/Reduced Lunch Status ....................................................................................................... 66 Table 6.9. Percentage of Students by Performance Level for Winter/Trimester 2011-12 and Spring 2012 ................................................................................................. 67 Table 6.10. Overall Estimates of SEM by Subject ..................................................... 69

Oklahoma ACE EOI 2012 Technical Report
Pearson, Inc. and SDE Confidential
1
Section 1
Overview of the Oklahoma School Testing Program (OSTP) Achieving Classroom Excellence (ACE) End-of-Instruction (EOI) Assessments
1.1 Overview of the OSTP-ACE EOI Assessments
The Achieving Classroom Excellence End-of-Instruction assessment is a state-mandated, secondary-level, criterion-referenced testing program used to assess student proficiency at the End-of-Instruction in Algebra I, Algebra II, Geometry, Biology I, English II, English III, and U.S. History. The Oklahoma ACE EOI tests are used to assess student proficiency relative to a specific set of academic skills established by committees of Oklahoma educators. In 2011-12, this special set of skills was referred to as the Priority Academic Student Skills (PASS), which represents skills that students are expected to master by the End-of-Instruction for each subject. All secondary-level students, who have completed instruction in Algebra I, Algebra II, Geometry, Biology I, English II, English III, and U.S. History must take the corresponding Oklahoma ACE EOI tests. The Spring 2009 administration was the first administration with graduation requirements attached to them for the incoming freshman students. For these students and future students, to graduate with a high school diploma from the State of Oklahoma, students must score proficient or above in Algebra I and English II, and two of the following five: Algebra II, Biology I, English III, Geometry, or U.S. History. Students who fail to earn a proficient score are permitted to retake these tests. All PASS standards and objectives are measured exclusively by multiple-choice items, except for English II and English III, each of which include one writing prompt. The Winter/Trimester 2011-12 and Spring 2012 OSTP-ACE EOI Algebra I, Algebra II, Geometry, Biology I, English II, English III, and U.S. History assessments were developed by Pearson in collaboration with the Oklahoma State Department of Education (SDE) and were administered by SDE. Pearson scored, equated, and scaled the assessments. There was one form administered in Winter/Trimester 2011-12 for each subject. In the Spring 2012 administration, there were two core operational forms with 12 field test forms for English III, Algebra I, Algebra II, Geometry, Biology I, and U.S. History and 9 field test forms for English II. Each test form was embedded with field test items to add to the item pool. For Winter /Trimester 2011-12, a Braille test was built for each subject using the Winter/Trimester 2010-11 test forms. The Braille test for Spring 2012 was built using the Core form A of the Spring 2012 operational test forms. For each administration, an equivalent form from one of the previous administrations was designated as a breach form. A student could receive an equivalent form for various reasons, including becoming ill during test administration or experiencing some kind of security breach. The State Department of Education Office of Accountability and Assessments determines eligibility for an equivalent form on a case-by-case basis. These students’ responses were scored and reported using the scoring tables from the form’s previous administration. 1.1.a Purpose
Pearson developed the 2011-12 OSTP-ACE EOI assessments to measure the Oklahoma PASS content standards, as listed in the following section. The objectives associated with content and/or process standards tested are provided in Appendix A.

Oklahoma ACE EOI 2012 Technical Report
Pearson, Inc. and SDE Confidential
2
1.1.b PASS Content Standards
The Oklahoma Content Standards are shown in Table 1.1. Table 1.1. Oklahoma Content Standards by Subject
Algebra I
Standard 1. Number Sense and Algebraic Operations Standard 2. Relations and Functions Standard 3. Data Analysis, Probability & Statistics
Algebra II
Standard 1. Number Sense and Algebraic Operations Standard 2. Relations and Functions Standard 3. Data Analysis, Probability, & Statistics
Geometry
Standard 1. Logical Reasoning Standard 2. Properties of 2-Dimensional Figures Standard 3. Triangles and Trigonometric Ratios Standard 4. Properties of 3-Dimensional Figures Standard 5. Coordinate Geometry
Biology I
PASS Process/Inquiry Standards and Objectives Process 1. Observe and Measure Process 2. Classify Process 3. Experiment Process 4. Interpret and Communicate Process 5. Model PASS Content Standards and Objectives Standard 1. The Cell Standard 2. The Molecular Basis of Heredity Standard 3. Biological Diversity Standard 4. The Interdependence of Organisms Standard 5. Matter/Energy/Organization in Living Systems Standard 6. The Behavior of Organisms
English II
Reading/Literature: Standard 1. Vocabulary Standard 2. Comprehension Standard 3. Literature Standard 4. Research and Information Writing/Grammar/Usage and Mechanics: Standard 1/2. Writing Standard 3. Grammar/Usage and Mechanics

Oklahoma ACE EOI 2012 Technical Report
Pearson, Inc. and SDE Confidential
3
Table 1.1. Oklahoma Content Standards by Subject (cont.)
U.S. History
Standard 1. Civil War/Reconstruction Era Standard 2. Impact of Immigration and Industrialization Standard 3. Imperialism, World War I, and Isolationism Standard 4. United States During the 1920s and 1930s Standard 5. World War II Standard 6. United States Since World War II
1.2 Summary of Test Development and Content Validity
To ensure content validity of the Oklahoma ACE EOI tests, Pearson content experts closely study the Oklahoma Priority Academic Student Skills (PASS) and work with Oklahoma content area specialists, teachers, and assessment experts to develop a pool of items that measure Oklahoma’s Assessment Frameworks (i.e., PASS) for each subject. Once the need for field test items was determined, based on the availability of items for future test construction, a pool of items that measured Oklahoma's PASS in each subject was developed. These items were developed under universal design guidelines set by the SDE and carefully reviewed and discussed by Content and Bias/Sensitivity Review Committees to evaluate not only content validity, but also plain language and the quality and appropriateness of the items. These committees were comprised of Oklahoma teachers and SDE staff. The committees’ recommendations were used to select and/or revise items from the item pool used to construct the field test portions of the Winter/Trimester 2011-12 and the Spring 2012 assessments. 1.2.a Aligning Test to PASS Content Standards
In addition to the test Blueprints provided by SDE, Table 1.2 describes four criteria for test alignment with the PASS Standards and Objectives.
English III
Reading/Literature: Standard 1. Vocabulary Standard 2. Comprehension Standard 3. Literature Standard 4. Research and Information Writing/Grammar/Usage and Mechanics: Standard 1/2. Writing Standard 3. Grammar/Usage and Mechanics

Oklahoma ACE EOI 2012 Technical Report
Pearson, Inc. and SDE Confidential
4
Table 1.2. Criteria for Aligning the Test with PASS Standards and Objectives.
1. Categorical Concurrence
The test is constructed so that there are at least six items measuring each PASS standard with the content category consistent with the related standard. The number of items, six, is based on estimating the number of items that could produce a reasonably reliable estimate of a student’s mastery of the content measured.
2. Range-of-Knowledge The test is constructed so that at least 50% of the objectives for a PASS standard have at least one corresponding assessment item.
3. Balance-of-Representation
The test is constructed according to the alignment blueprint, which reflects the degree of representation given on the test to each PASS standard and objective in terms of the percent of total test items measuring each standard and the number of test items measuring each objective.
4. Source-of-Challenge
Each test item is constructed in such a way that the major cognitive demand comes directly from the targeted PASS skill or concept being assessed, not from specialized knowledge or cultural background that the test-taker may bring to the testing situation.
1.2.b Item Pool Development and Selection
The source of the operational items included a pool of previously field-tested or operationally-administered items ranging from the Spring 2005 through the Spring 2011 administrations for Algebra I, Biology I, English II, and U.S. History and from the census Spring 2007 field test through the Spring 2011 embedded field test for Algebra II, Geometry, and English III. Note that the items were calibrated live using data from the operational administrations to estimate parameters for these items. The ACE EOI tests for the Winter/Trimester 2011-12 and Spring 2012 cycle were built by including previously field-tested and operational items. To equate the forms across years, the entire set of operational items served as anchors or links to the base scale. Equating is necessary to account for slight year-to-year differences in form difficulty and to maintain comparability across years. Details of the equating procedures applied are provided in a subsequent section in this document. Content experts also targeted the percentage of items measuring various Depth of Knowledge (DOK) levels for assembling the tests. Table 1.3 provides the DOK level percentages for the Winter/Trimester 2011-12 and Spring 2012 operational assessments. During test construction, effort was made to construct test forms that meet the target percentages as close as possible.

Oklahoma ACE EOI 2012 Technical Report
Pearson, Inc. and SDE Confidential
5
Table 1.3. Percentage of Items by Depth of Knowledge Levels
Test Session DOK Level
Target DOK %
Actual %
Algebra I Algebra II Geometry Biology I1
Winter/ Trimester 2011-12
1 10-15 12.73 9.09 16.36 11.67 2 60-70 69.09 72.73 63.64 65.00
3/4 15-25 18.18 18.18 20.00 23.33
Spring 2012 Core A
1 10-15 12.73 14.55 14.55 15.00 2 60-70 67.27 69.09 69.09 45.00
3/4 15-25 20.00 16.36 16.36 40.00
Spring 2012 Core B
1 10-15 12.73 14.55 14.55 13.33
2 60-70 67.27 69.09 69.09 48.33
3/4 15-25 20.00 16.36 16.36 38.33 Note 1: For Biology I, the target DOK percentages are 10 - 15 for DOK level 1, 55 - 65 for DOK level 2, and 25 - 35 for DOK level 3 for the school year of 2011-2012.
Table 1.3. Percentage of Items by Depth of Knowledge Levels (cont.)
Test Session DOK Level
Target DOK %
Actual %
English II English III U.S. History
Winter/ Trimester 2011-12
1 10-15 11.48 11.11 18.33 2 60-70 72.13 69.84 66.67
3/4 15-25 16.39 19.05 15.00
Spring 2012 Core A
1 10-15 6.56 12.70 10.00 2 60-70 70.49 68.25 65.00
3/4 15-25 22.95 19.05 25.00
Spring 2012 Core B
1 10-15 8.20 12.70 10.00 2 60-70 73.77 66.67 66.67
3/4 15-25 18.03 20.63 23.33
1.2.c Configuration of the Seven Tests
Table 1.4 and Table 1.5 provide overviews of the number of operational and field test items for the Winter/Trimester 2011-12 and Spring 2012 OSTP-ACE EOI assessments. The Spring 2012 test was comprised of two dual core, operationally-scored forms for each subject. While most items were unique to each form, there were at least 20 items in common across the core forms for use during calibration, scaling, and equating. The number of common linking items per subject is presented in Table 1.6. Field test items were embedded in the operational test forms for all content areas to build the item bank for future use. The forms in the Spring 2012 assessments were randomly assigned within classrooms to obtain randomly-equivalent samples of examinees for the field test items.

Oklahoma ACE EOI 2012 Technical Report
Pearson, Inc. and SDE Confidential
6
Table 1.4. Configuration of the OSTP-ACE EOI Tests for Winter/Trimester 2011-12
Subject Forms
Item Counts (Per Form)
Maximum Possible Points on Test Items (Per Form)
OP FT
OP FT Test MC OE MC OE
Algebra I 1 55 10 65 55 0 10 0 Algebra II 1 55 10 65 55 0 10 0 Biology I 1 60 10 70 60 0 10 0 English II 1 60/1* 10 70/1* 60 6 10 0 English III 1 62/1* 10 72/1* 62 10 10 0 Geometry 1 55 10 65 55 0 10 0 U.S. History 1 60 10 70 60 0 10 0
Note: OP = Operational; FT = Field Test; MC = Multiple Choice; OE = Open-ended; * = multiple choice/open-ended.
Table 1.5. Configuration of the OSTP-ACE/EOI Tests for Spring 2012
Subject Forms
Item Counts (Per Form)
Maximum Possible Points on Test Items (Per Form)
OP FT
OP** FT Test MC OE MC OE
Algebra I 12 55 10 65 55 0 10 0 Algebra II 12 55 10 65 55 0 10 0 Biology I 12 60 15 75 60 0 15 0 English II 9 60/1* 15 75/1* 60 6 15 0 English III 12 62/1* 15 77/1* 62 10 15 0 Geometry 12 55 10 65 55 0 10 0 U.S. History 12 60 10 70 60 0 10 0
Note: OP = Operational; FT = Field Test; MC = Multiple Choice; OE = Open-ended; * = multiple choice/open-ended; **=by Core Form (some items were common across forms).
Table 1.6. Number of Common Linking Items per Subject for Spring 2012
Subject No. of CL
Items Total No. of
Items*
Algebra I 20 90 Algebra II 20 90 Biology I 21 99 English II 20 102 English III 20 106 Geometry 20 90 U.S. History 20 100
Note: No. = Number; CL = common linking items; *= Number of unique operational items.
1.2.d Operational and Field Test Items by Content Area
Algebra I. The Winter/Trimester 2011-12 Algebra I administration was comprised of one form with 55 operational items and 10 field test items. There were two core forms and 12 field test sets in the Spring 2012 administration. Each of the forms contained 55 operational items and 10 field test items, totaling 65 items per form. The number of items and maximum points possible by content standard is shown in Table 1.7. Algebra I scores were reported by content standard and at the objective level. There were nine or more operational items in each

Oklahoma ACE EOI 2012 Technical Report
Pearson, Inc. and SDE Confidential
7
reported category. Each item was mapped to one content standard and one objective per content standard. Table 1.7. Number of Items and Points by Content Standard for Algebra I
Form
Content Standard
Total 1 2 3
Items Points Items Points Items Points Items Points
Winter 2011-12 Operational 15 15 31 31 9 9 55 55 FT Form 1 3 3 5 5 2 2 10 10
Spring 2012 Core A 15 15 31 31 9 9 55 55
Core B 15 15 31 31 9 9 55 55
FT Form 1 2 2 6 6 2 2 10 10 FT Form 2 2 2 6 6 2 2 10 10 FT Form 3 2 2 6 6 2 2 10 10 FT Form 4 2 2 5 5 3 3 10 10 FT Form 5 2 2 5 5 3 3 10 10 FT Form 6 3 3 5 5 2 2 10 10 FT Form 7 2 2 6 6 2 2 10 10 FT Form 8 3 3 5 5 2 2 10 10 FT Form 9 2 2 6 6 2 2 10 10 FT Form 10 2 2 6 6 2 2 10 10 FT Form 11 2 2 7 7 1 1 10 10 FT Form 12 2 2 6 6 2 2 10 10
Note: FT = Field Test.
Algebra II. The Winter/Trimester 2011-12 Algebra II administration was comprised of one form with 55 operational items and 10 field test items. There were two core forms and 12 field test sets in the Spring 2012 administration. Each of the forms contained 55 operational items and 10 field test items, totaling 65 items per form. The number of items and maximum points possible by content standard is shown in Table 1.8. Algebra II scores were reported by content standard and at the objective level. There were nine or more operational items in each reported category. Each item was mapped to one content standard and one objective per content standard.

Oklahoma ACE EOI 2012 Technical Report
Pearson, Inc. and SDE Confidential
8
Table 1.8. Number of Items and Points by Content Standard for Algebra II
Form
Content Standard
Total 1 2 3
Items Points Items Points Items Points Items Points
Winter 2011-12 Operational 15 15 31 31 9 9 55 55 FT Form 1 3 3 6 6 1 1 10 10
Spring 2012 Core A 15 15 31 31 9 9 55 55 Core B 15 15 31 31 9 9 55 55 FT Form 1 2 2 6 6 2 2 10 10 FT Form 2 3 3 6 6 1 1 10 10 FT Form 3 3 3 6 6 1 1 10 10 FT Form 4 2 2 6 6 2 2 10 10 FT Form 5 3 3 6 6 1 1 10 10 FT Form 6 2 2 6 6 2 2 10 10 FT Form 7 3 3 6 6 1 1 10 10 FT Form 8 2 2 6 6 2 2 10 10 FT Form 9 2 2 7 7 1 1 10 10 FT Form 10 2 2 6 6 2 2 10 10 FT Form 11 2 2 6 6 2 2 10 10 FT Form 12 3 3 6 6 1 1 10 10
Note: FT = Field Test.
Geometry. The Winter/Trimester 2011-12 Geometry administration was comprised of one form with 55 operational items and 10 field test items. There were two core forms and 12 field test sets in the Spring 2012 administration. Each of the forms contained 55 operational items and 10 field test items, totaling 65 items per form. The number of items and maximum points possible by content standard is shown in Table 1.9. Geometry scores were reported by content standard and at the objective level. There were six or more items in each reported category. Each item was mapped to one content standard and one objective per content standard.

Oklahoma ACE EOI 2012 Technical Report
Pearson, Inc. and SDE Confidential
9
Table 1.9. Number of Items and Points by Content Standard for Geometry
Form
Content Standard
Total 1 2 3 4 5
Its Pts Its Pts Its Pts Its Pts Its Pts Its Pts
Winter 2011-12 Operational 6 6 20 20 12 12 10 10 7 7 55 55 FT Form 1 1 1 4 4 2 2 2 2 1 1 10 10
Spring 2012 Core A 6 6 20 20 12 12 10 10 7 7 55 55 Core B 6 6 20 20 12 12 10 10 7 7 55 55 FT Form 1 1 1 3 3 2 2 3 3 1 1 10 10 FT Form 2 0 0 3 3 1 1 5 5 1 1 10 10 FT Form 3 1 1 4 4 2 2 3 3 0 0 10 10 FT Form 4 1 1 2 2 1 1 4 4 2 2 10 10 FT Form 5 1 1 2 2 2 2 3 3 2 2 10 10 FT Form 6 1 1 2 2 3 3 4 4 0 0 10 10 FT Form 7 1 1 2 2 2 2 4 4 1 1 10 10 FT Form 8 1 1 4 4 2 2 2 2 1 1 10 10 FT Form 9 2 2 1 1 2 2 4 4 1 1 10 10 FT Form 10 1 1 4 4 0 0 4 4 1 1 10 10 FT Form 11 1 1 1 1 3 3 4 4 1 1 10 10 FT Form 12 2 2 2 2 2 2 3 3 1 1 10 10
Note: Its = Number of Items; Pts = Number of Points; FT = Field Test.
Biology I. The Winter/Trimester 2011-12 Biology I administration was comprised of one form with 60 operational items and 10 field test items. There were two core forms and 12 field test sets in the Spring 2012 administration. Each of the forms contained 60 operational items and 15 field test items, totaling 75 items per form. The number of items and the maximum number points possible by content standard is shown in Table 1.10. Biology I scores were reported for content and process standards at the standard level. Each reported process standard has eight or more items and each content standard has eight or more items. Unlike other subjects, all items in Biology I were primarily mapped to process standards. All items (except safety items) were also mapped to content standards.

Oklahoma ACE EOI 2012 Technical Report
Pearson, Inc. and SDE Confidential
10
Table 1.10. Number of Items and Points by Content Standard for Biology I
Form
Content Standard
Total* 1 2 3 4 5 6
Its Pts Its Pts Its Pts Its Pts Its Pts Its Pts Its Pts
Winter 2011-12 Operational 7 7 10 10 9 9 12 12 10 10 8 8 56 56 FT Form 1 2 2 1 1 2 2 2 2 1 1 2 2 10 10
Spring 2012 Core A 8 8 8 8 8 8 13 13 10 10 9 9 56 56 Core B 8 8 9 9 8 8 13 13 10 10 8 8 56 56 FT Form 1 4 4 2 2 3 3 1 1 3 3 1 1 14 14 FT Form 2 5 5 2 2 3 3 2 2 2 2 0 0 14 14 FT Form 3 3 3 1 1 3 3 3 3 4 4 0 0 14 14 FT Form 4 3 3 1 1 1 1 2 2 4 4 2 2 13 13 FT Form 5 3 3 4 4 1 1 3 3 1 1 1 1 13 13 FT Form 6 1 1 3 3 4 4 3 3 3 3 0 0 14 14 FT Form 7 4 4 2 2 4 4 3 3 1 1 0 0 14 14 FT Form 8 3 3 2 2 3 3 1 1 4 4 1 1 14 14 FT Form 9 2 2 3 3 0 0 4 4 4 4 1 1 14 14 FT Form 10 2 2 2 2 2 2 5 5 3 3 0 0 14 14 FT Form 11 2 2 2 2 3 3 4 4 3 3 0 0 14 14 FT Form 12 2 2 3 3 4 4 3 3 3 3 0 0 15 15
Note: Its = Number of Items; Pts = Number of Points; FT = Field Test; Some totals for OP forms and FT forms are less than 60 (for OP) and 15 (for FT) due to dual item alignment – an item does not map to a content standard, but maps to a process.
English II. The Winter/Trimester 2011-12 English II administration was comprised of one form with 60 operational MC items, 1 open-ended writing prompt, and 10 field test MC items. All multiple-choice operational items were considered anchor items on this form, selected from available items in the item bank. There were two core forms and 9 field test sets in the Spring 2012 administration. Each of the forms contained 60 operational MC items, 1 operational open-ended writing prompt, and 15 field test MC items, totaling 76 items per form. Table 1.11 lists the number of items and the maximum possible number of points by content standard in the Winter/Trimester 2011-12 and Spring 2012 forms. English II scores were reported at the content standard level. Each item was mapped to one content standard and one objective. The writing prompts in English II were scored analytically on five traits with a maximum of four score points per trait. The scores in the analytic traits were reported in the Writing report. The trait scores were weighted differentially to derive a composite score that ranged from 1 to 6. The composite scores contributed to the English II total score.

Oklahoma ACE EOI 2012 Technical Report
Pearson, Inc. and SDE Confidential
11
Table 1.11. Number of Items and Points by Content Standard for English II
Form
Content Standard
Total R1 R2 R3 R4 W1/W2 W3
Its Pts Its Pts Its Pts Its Pts Its Pts Its Pts Its Pts
Winter 2011-12
Operational 6 6 19 19 18 18 5 5 1 6 12 12 61 66 FT Form 1 0 0 1 1 0 0 0 0 0 0 9 9 10 10
Spring 2012 Core A 6 6 18 18 18 18 6 6 1 6 12 12 61 66 Core B 6 6 18 18 17 17 7 7 1 6 12 12 61 66 FT Form 1 1 1 4 4 4 4 1 1 - - 5 5 15 15 FT Form 2 1 1 6 6 6 6 2 2 - - 0 0 15 15 FT Form 3 1 1 5 5 3 3 1 1 - - 5 5 15 15 FT Form 4 1 1 8 8 5 5 1 1 - - 0 0 15 15 FT Form 5 2 2 7 7 4 4 2 2 - - 0 0 15 15 FT Form 6 2 2 6 6 5 5 2 2 - - 0 0 15 15 FT Form 7 1 1 6 6 8 8 0 0 - - 0 0 15 15 FT Form 8 2 2 6 6 5 5 2 2 - - 0 0 15 15 FT Form 9 1 1 7 7 6 6 1 1 - - 0 0 15 15
Note: Its = Number of Items; Pts = Number of Points; FT = Field Test.
English III. The Winter/Trimester 2011-12 English III administration was comprised of one form with 62 operational MC items, 1 open-ended writing prompt, and 10 field test MC items. All multiple-choice operational items were considered anchor items on this form, selected from available items in the item bank. There were two core forms and 12 field test sets in the Spring 2012 administration. Each of the forms contained a set of 62 operational MC items, 1 operational open-ended writing prompt, and 15 field test MC items, totaling 78 items per form. Table 1.12 lists the number of items and the maximum possible number of points by content standard in the Winter/Trimester 2011-12 and Spring 2012 tests. English III scores were reported at the content standard level. Each item was mapped to one content standard and one objective. The writing prompts in English III were scored analytically on five traits with a maximum of four score points for each trait. The scores in the analytic traits were reported in the Writing report. The trait scores were weighted differentially to derive a composite score that ranged from 1 to 10. The composite scores contributed to the English III total score.

Oklahoma ACE EOI 2012 Technical Report
Pearson, Inc. and SDE Confidential
12
Table 1.12. Number of Items and Points by Content Standard for English III
Form
Content Standard Total
R1 R2 R3 R4 W1/W2 W3
Its Pts Its Pts Its Pts Its Pts Its Pts Its Pts Its Pts
Winter 2011-12 Operational 6 6 17 17 19 19 6 6 1 10 14 14 63 72 FT Form 1 0 0 0 0 0 0 0 0 0 0 10 10 10 10
Spring 2012 Core A 6 6 18 18 17 17 6 6 1 10 15 15 63 72 Core B 6 6 16 16 18 18 7 7 1 10 15 15 63 72 FT Form 1 1 1 5 5 3 3 1 1 - - 5 5 15 15 FT Form 2 1 1 5 5 6 6 3 3 - - 0 0 15 15 FT Form 3 2 2 4 4 2 2 2 2 - - 5 5 15 15 FT Form 4 3 3 3 3 7 7 2 2 - - 0 0 15 15 FT Form 5 1 1 5 5 3 3 1 1 - - 5 5 15 15 FT Form 6 2 2 5 5 6 6 2 2 - - 0 0 15 15 FT Form 7 1 1 7 7 5 5 2 2 - - 0 0 15 15 FT Form 8 4 4 4 4 4 4 3 3 - - 0 0 15 15 FT Form 9 2 2 5 5 5 5 3 3 - - 0 0 15 15 FT Form 10 0 0 9 9 3 3 3 3 - - 0 0 15 15 FT Form 11 3 3 6 6 6 6 0 0 - - 0 0 15 15 FT Form 12 1 1 9 9 3 3 2 2 - - 0 0 15 15
Note: Its = Number of Items; Pts = Number of Points; FT = Field Test.

Oklahoma ACE EOI 2012 Technical Report
Pearson, Inc. and SDE Confidential
13
U.S. History. The Winter/Trimester 2011-12 U.S. History administration was comprised of one form with 60 operational items and 10 field test items. There were two core forms and 12 field test sets in the Spring 2012 administration. Each of the forms contained a set of 60 operational items and 10 field test items, totaling 70 items per form. The number of items and maximum points possible by content standard in Winter/Trimester 2011-12 and Spring 2012 are shown in Table 1.13. U.S. History scores were reported only at the content standard level and each reported standard had six or more items. Table 1.13. Number of Items and Points by Content Standard for U.S. History
Form
Content Standard
Total 1 2 3 4 5 6
Its Pts Its Pts Its Pts Its Pts Its Pts Its Pts Its Pts
Winter 2011-12 Operational 6 6 9 9 9 9 12 12 9 9 15 15 60 60 FT Form 1 1 1 2 2 1 1 1 1 1 1 4 4 10 10
Spring 2012 Core A 6 6 9 9 9 9 12 12 9 9 15 15 60 60 Core B 6 6 9 9 9 9 12 12 9 9 15 15 60 60 FT Form 1 2 2 2 2 0 0 1 1 0 0 5 5 10 10 FT Form 2 1 1 1 1 2 2 2 2 1 1 3 3 10 10 FT Form 3 1 1 1 1 2 2 0 0 2 2 4 4 10 10 FT Form 4 3 3 2 2 1 1 2 2 1 1 1 1 10 10 FT Form 5 3 3 1 1 1 1 1 1 1 1 3 3 10 10 FT Form 6 1 1 1 1 2 2 2 2 0 0 4 4 10 10 FT Form 7 1 1 1 1 0 0 3 3 2 2 3 3 10 10 FT Form 8 0 0 0 0 1 1 3 3 2 2 4 4 10 10 FT Form 9 0 0 1 1 3 3 1 1 1 1 4 4 10 10 FT Form 10 2 2 0 0 1 1 2 2 0 0 5 5 10 10 FT Form 11 2 2 1 1 1 1 1 1 1 1 4 4 10 10 FT Form 12 1 1 4 4 2 2 2 2 0 0 1 1 10 10
Note: Its = Number of Items; Pts = Number of Points; FT = Field Test.

Oklahoma ACE EOI 2012 Technical Report
Pearson, Inc. and SDE Confidential
14
Section 2
Administration of the ACE EOI Assessments
Valid and reliable assessment requires that assessments are first constructed in alignment with the Oklahoma content standards and then administered and scored according to sound measurement principles. Sound assessment practices require that schools administer all assessments in a consistent manner across the state so that all students have a fair and equitable opportunity for a score that accurately reflects their achievement in each subject. The schools play a key role in administering the OSTP-ACE EOI assessments in a manner consistent with established procedures, monitoring the fair administration of the assessment, and working with the SDE office to address deviations from established assessment administration procedures. The role that district and school faculty members play is essential in the fair and equitable administration of successful ACE EOI assessments. The test forms are administered consistent with the State of Oklahoma’s law requiring that 95% of students complete the tests online. The tests are administered through the secure PearsonAccessTM website. For the remaining students, paper-and-pencil test is administered. The following sections apply to the administration of paper-and-pencil test. 2.1 Packaging and Shipping
To provide Oklahoma with secure and dependable services for the shipping of assessment materials, Pearson’s Warehousing and Transportation Department maintains the quality and security of material distribution and return by using such methods as sealed trailers and hiring reputable carriers with the ability to immediately trace shipments. Pearson uses all available tracking capabilities to provide status information and early opportunities for corrective action when necessary. Materials are packaged by school and delivered to the district coordinators. Each shipment to a district contains a shipping document set that includes a packing list for each school’s materials and a pallet map that shows the identity and pallet assignment of each carton. Materials are packaged using information provided by the Assessment Coordinators through the PearsonAccess™ website, and optionally with data received directly from Oklahoma. Oklahoma educators also use the PearsonAccess™ site to provide Pearson with the pre-identification information needed to print the student identification section on answer documents. Bar-coding of all secure materials during the pre-packaging effort allows for accurate tracking of these materials through the entire packing, delivery, and return process. It also permits Pearson to inventory all materials throughout the packaging and delivery process along with the ability to provide the customer with status updates at any time. Use of handheld radio-frequency scanners in the packaging process help to eliminate the possibility of packing the wrong materials. The proprietary “pick-and-pack” process prompts packaging personnel as to what materials are to go in which shipping box. If the packer tries to pack the wrong item (or number of items into a shipping carton), the system signals an alert. 2.2 Materials Return
Oklahoma ACE EOI 2012 Technical Report
Pearson, Inc. and SDE Confidential
15
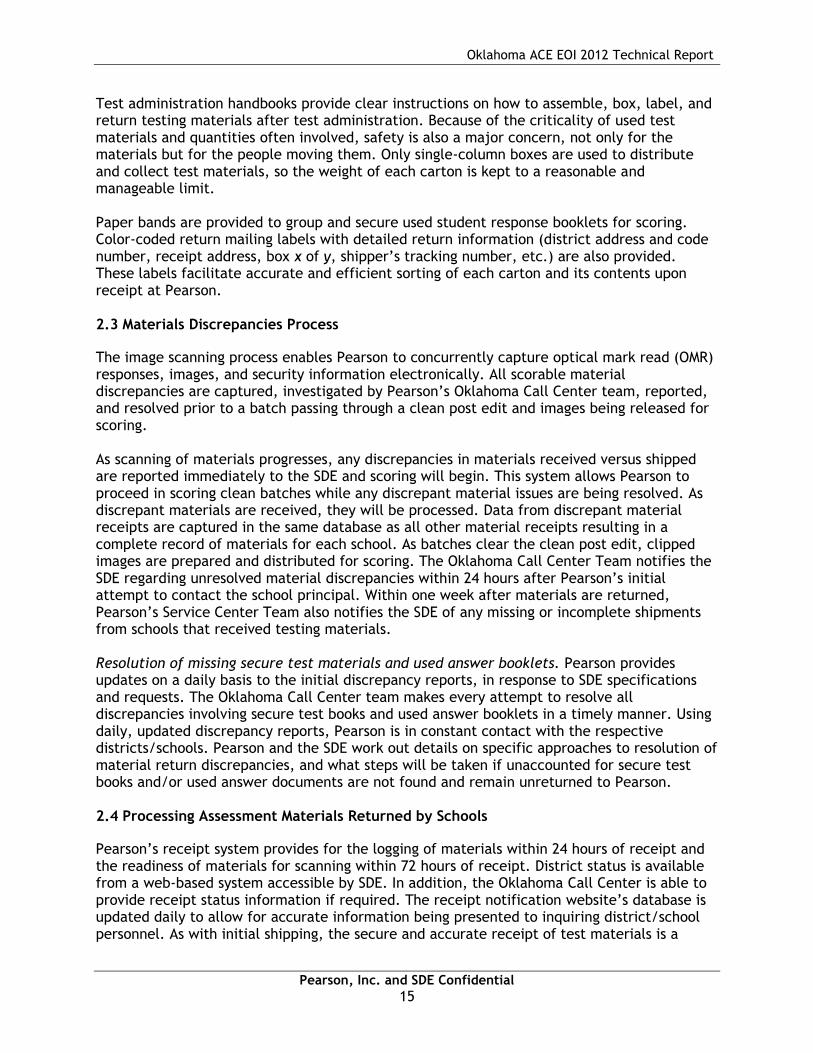
Test administration handbooks provide clear instructions on how to assemble, box, label, and return testing materials after test administration. Because of the criticality of used test materials and quantities often involved, safety is also a major concern, not only for the materials but for the people moving them. Only single-column boxes are used to distribute and collect test materials, so the weight of each carton is kept to a reasonable and manageable limit. Paper bands are provided to group and secure used student response booklets for scoring. Color-coded return mailing labels with detailed return information (district address and code number, receipt address, box x of y, shipper’s tracking number, etc.) are also provided. These labels facilitate accurate and efficient sorting of each carton and its contents upon receipt at Pearson. 2.3 Materials Discrepancies Process
The image scanning process enables Pearson to concurrently capture optical mark read (OMR) responses, images, and security information electronically. All scorable material discrepancies are captured, investigated by Pearson’s Oklahoma Call Center team, reported, and resolved prior to a batch passing through a clean post edit and images being released for scoring. As scanning of materials progresses, any discrepancies in materials received versus shipped are reported immediately to the SDE and scoring will begin. This system allows Pearson to proceed in scoring clean batches while any discrepant material issues are being resolved. As discrepant materials are received, they will be processed. Data from discrepant material receipts are captured in the same database as all other material receipts resulting in a complete record of materials for each school. As batches clear the clean post edit, clipped images are prepared and distributed for scoring. The Oklahoma Call Center Team notifies the SDE regarding unresolved material discrepancies within 24 hours after Pearson’s initial attempt to contact the school principal. Within one week after materials are returned, Pearson’s Service Center Team also notifies the SDE of any missing or incomplete shipments from schools that received testing materials. Resolution of missing secure test materials and used answer booklets. Pearson provides updates on a daily basis to the initial discrepancy reports, in response to SDE specifications and requests. The Oklahoma Call Center team makes every attempt to resolve all discrepancies involving secure test books and used answer booklets in a timely manner. Using daily, updated discrepancy reports, Pearson is in constant contact with the respective districts/schools. Pearson and the SDE work out details on specific approaches to resolution of material return discrepancies, and what steps will be taken if unaccounted for secure test books and/or used answer documents are not found and remain unreturned to Pearson. 2.4 Processing Assessment Materials Returned by Schools
Pearson’s receipt system provides for the logging of materials within 24 hours of receipt and the readiness of materials for scanning within 72 hours of receipt. District status is available from a web-based system accessible by SDE. In addition, the Oklahoma Call Center is able to provide receipt status information if required. The receipt notification website’s database is updated daily to allow for accurate information being presented to inquiring district/school personnel. As with initial shipping, the secure and accurate receipt of test materials is a

Oklahoma ACE EOI 2012 Technical Report
Pearson, Inc. and SDE Confidential
16
priority with Pearson. Quality assurance procedures provide that all materials are checked in using pre-defined procedures. Materials are handled in a highly secure manner from the time of receipt until final storage and shredding. The receipt of all secure materials is verified through the scanning of barcodes and the comparison of this data to that in security files established during the initial shipment of Oklahoma test materials to the district assessment coordinators.

Oklahoma ACE EOI 2012 Technical Report
Pearson, Inc. and SDE Confidential
17
Section 3
Classical Item Analysis and Results
3.1 Sampling Plan and Field Test Design
3.1.a Sampling Plan
Population data were used for classical analyses for all Winter/Trimester 2011-12 tests and for Algebra I, Algebra II, Biology I, Geometry, and U.S. History for Spring 2012. A sample of 15,000 students was used for English II and for English III in Spring 2012 administration. Using stratified random sampling, the samples were similar to the Spring 2011 equating sample for these two tests in terms of gender and ethnicity representation. Additionally, the proportions of students from identified key school districts were represented proportionally in the samples. 3.1.b Field Test Design
New items are field-tested to build up the item bank for future high stakes administrations. The overall field test design used by Pearson was an embedded field test design where newly-developed field test items were embedded throughout the test. The advantage of an embedded field test design is that test-takers do not know where the field test items are located and therefore will treat each item as a scored item. Ten to fifteen multiple choice field test items per form (Winter/Trimester 2011-12 and Spring 2012) were placed in common positions across forms and administrations. Field test items were prioritized for inclusion on forms based on current item bank analyses. 3.1.c Data Receipt Activities
After all tests were scored, a data file was provided for item analyses and calibration. A data clean-up process that removed invalid cases, ineligible responses, absent students, and second-time test takers was completed. A statistical key check was also performed at this time. This ‘cleaned’ sample was used for classical item analyses, calibration, and equating. Upon receipt of data, a research scientist inspected several data fields to determine if the data met expectations, including:
Student ID
Demographic fields
Form identification fields
Raw response fields
Scored response fields
Total score and subscore fields
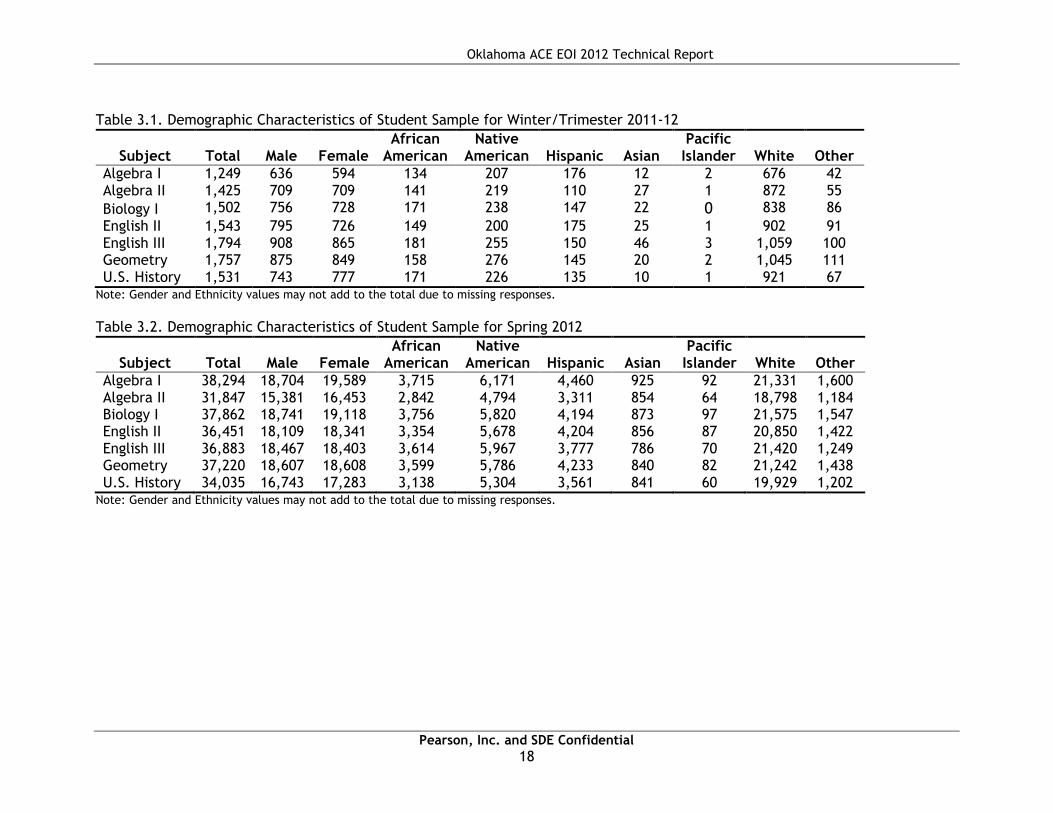
Fields used to implement exclusion from analysis rules Exclusion Rules. Following data inspection and clean-up, exclusionary rules were applied to form the final sample that was used for classical item analyses, calibration, and equating. Any student who had attempted at least five responses was included in the data analyses. The demographic breakdowns of the students in the Winter/Trimester 2011-12 and Spring 2012 item analysis and calibration sample appear in Table 3.1 and Table 3.2, respectively.
Oklahoma ACE EOI 2012 Technical Report
Pearson, Inc. and SDE Confidential
18
Table 3.1. Demographic Characteristics of Student Sample for Winter/Trimester 2011-12
Subject Total Male Female African
American Native
American Hispanic Asian Pacific Islander White Other
Algebra I 1,249 636 594 134 207 176 12 2 676 42 Algebra II 1,425 709 709 141 219 110 27 1 872 55 Biology I 1,502 756 728 171 238 147 22 0 838 86 English II 1,543 795 726 149 200 175 25 1 902 91 English III 1,794 908 865 181 255 150 46 3 1,059 100 Geometry 1,757 875 849 158 276 145 20 2 1,045 111 U.S. History 1,531 743 777 171 226 135 10 1 921 67
Note: Gender and Ethnicity values may not add to the total due to missing responses.
Table 3.2. Demographic Characteristics of Student Sample for Spring 2012
Subject Total Male Female African
American Native
American Hispanic Asian Pacific Islander White Other
Algebra I 38,294 18,704 19,589 3,715 6,171 4,460 925 92 21,331 1,600 Algebra II 31,847 15,381 16,453 2,842 4,794 3,311 854 64 18,798 1,184 Biology I 37,862 18,741 19,118 3,756 5,820 4,194 873 97 21,575 1,547 English II 36,451 18,109 18,341 3,354 5,678 4,204 856 87 20,850 1,422 English III 36,883 18,467 18,403 3,614 5,967 3,777 786 70 21,420 1,249 Geometry 37,220 18,607 18,608 3,599 5,786 4,233 840 82 21,242 1,438 U.S. History 34,035 16,743 17,283 3,138 5,304 3,561 841 60 19,929 1,202
Note: Gender and Ethnicity values may not add to the total due to missing responses.
Oklahoma ACE EOI 2012 Technical Report
Pearson, Inc. and SDE Confidential
19
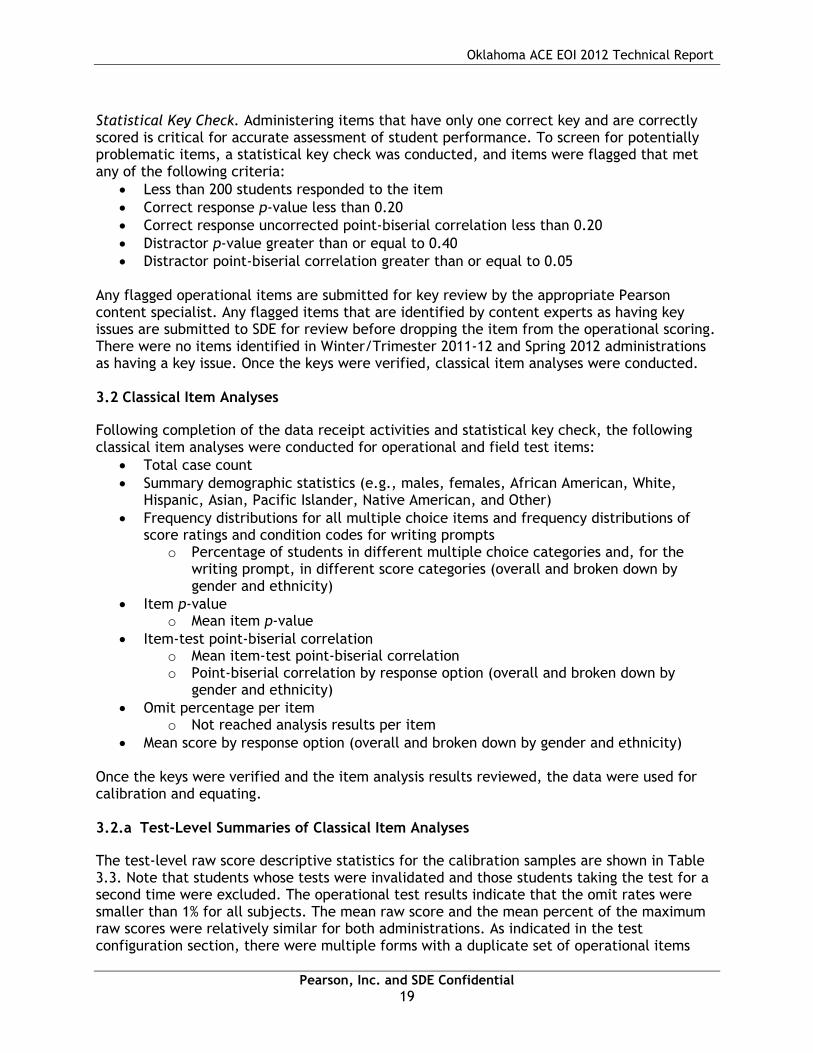
Statistical Key Check. Administering items that have only one correct key and are correctly scored is critical for accurate assessment of student performance. To screen for potentially problematic items, a statistical key check was conducted, and items were flagged that met any of the following criteria:
Less than 200 students responded to the item
Correct response p-value less than 0.20
Correct response uncorrected point-biserial correlation less than 0.20
Distractor p-value greater than or equal to 0.40
Distractor point-biserial correlation greater than or equal to 0.05 Any flagged operational items are submitted for key review by the appropriate Pearson content specialist. Any flagged items that are identified by content experts as having key issues are submitted to SDE for review before dropping the item from the operational scoring. There were no items identified in Winter/Trimester 2011-12 and Spring 2012 administrations as having a key issue. Once the keys were verified, classical item analyses were conducted. 3.2 Classical Item Analyses
Following completion of the data receipt activities and statistical key check, the following classical item analyses were conducted for operational and field test items:
Total case count
Summary demographic statistics (e.g., males, females, African American, White, Hispanic, Asian, Pacific Islander, Native American, and Other)
Frequency distributions for all multiple choice items and frequency distributions of score ratings and condition codes for writing prompts
o Percentage of students in different multiple choice categories and, for the writing prompt, in different score categories (overall and broken down by gender and ethnicity)
Item p-value o Mean item p-value
Item-test point-biserial correlation o Mean item-test point-biserial correlation o Point-biserial correlation by response option (overall and broken down by
gender and ethnicity)
Omit percentage per item o Not reached analysis results per item
Mean score by response option (overall and broken down by gender and ethnicity) Once the keys were verified and the item analysis results reviewed, the data were used for calibration and equating. 3.2.a Test-Level Summaries of Classical Item Analyses
The test-level raw score descriptive statistics for the calibration samples are shown in Table 3.3. Note that students whose tests were invalidated and those students taking the test for a second time were excluded. The operational test results indicate that the omit rates were smaller than 1% for all subjects. The mean raw score and the mean percent of the maximum raw scores were relatively similar for both administrations. As indicated in the test configuration section, there were multiple forms with a duplicate set of operational items

Oklahoma ACE EOI 2012 Technical Report
Pearson, Inc. and SDE Confidential
20
and a unique set of field test items in the Winter/Trimester 2011-12 and Spring 2012 tests. A separate item analysis by test form indicated that, in both administrations, the omit rates were below 1% for all content areas. The mean percent of the maximum possible raw score across forms indicates that the forms were relatively similar in difficulty for all content areas except Algebra I, where the Winter/Trimester 2011-12 form appeared to be more difficult than the Spring 2012 forms. Table 3.3. Test-Level Summaries of Classical Item Analyses for Winter/Trimester 2011-12 and Spring 2012
Subject and Administration
Sample Size Mean
Mean % of Max
Items / Points
Mean p
Mean rpb
Omit Min
Omit Max
Algebra I-W11 1,249 29.16 0.53 55 0.53 0.39 0.00 0.10 Algebra I-S12 CA 19,469 36.30 0.66 55 0.65 0.42 0.00 0.09 Algebra I-S12 CB 18,825 36.76 0.67 55 0.65 0.42 0.00 0.09
Algebra II-W11 1,425 31.98 0.58 55 0.57 0.46 0.00 0.48 Algebra II-S12 CA 16,250 33.60 0.61 55 0.61 0.40 0.00 0.14 Algebra II-S12 CB 15,597 33.72 0.61 55 0.61 0.40 0.00 0.14
Biology I-W11 1,502 37.88 0.63 60 0.64 0.40 0.00 0.23 Biology I-S12 CA 19,311 38.80 0.65 60 0.64 0.37 0.01 0.13 Biology I-S12 CB 18,551 38.14 0.64 60 0.64 0.37 0.01 0.13
English II-W11 1,543 47.62 0.72 61/66 0.72 0.39 0.00 0.19 English II-S12 CAA 10,427 48.36 0.73 61/66 0.74 0.34 0.00 0.08 English II-S12 CAB 10,399 48.58 0.74 61/66 0.74 0.34 0.00 0.08 English II-S12 CBA 7,661 48.02 0.73 61/66 0.73 0.32 0.00 0.08 English II-S12 CBB 7,747 48.52 0.74 61/66 0.74 0.32 0.00 0.08
English III-W11 1,794 47.00 0.65 63/72 0.64 0.42 0.00 0.16 English III-S12 CAA 9,845 46.12 0.64 63/72 0.65 0.34 0.00 0.13 English III-S12 CAB 9,715 45.94 0.64 63/72 0.65 0.34 0.00 0.13 English III-S12 CBA 8,488 46.96 0.65 63/72 0.65 0.36 0.00 0.14 English III-S12 CBB 8,616 47.16 0.66 63/72 0.65 0.36 0.00 0.14
Geometry-W11 1,757 35.50 0.65 55 0.64 0.42 0.00 0.23 Geometry-S12 CA 19,276 38.14 0.69 55 0.70 0.43 0.00 0.09 Geometry-S12 CA 17,944 38.30 0.70 55 0.70 0.43 0.00 0.09
U.S. History-W11 1,531 38.72 0.65 60 0.65 0.39 0.00 0.15 U.S. History-S12 CA 17,261 38.34 0.64 60 0.64 0.37 0.00 0.09 U.S. History-S12 CB 16,774 38.96 0.65 60 0.64 0.37 0.00 0.09
Note: W11 = Winter/Trimester 2011-12; S12 CA = Spring 2012 Core A; S12 CB = Spring 2012 Core B; S12 CAA=Spring 12 MC form A +OE form A; S12 CAB=Spring 12 MC form A +OE form B; S12 CBA=Spring 12 MC form B +OE form A; S12 CBB=Spring 12 MC form B +OE form B; rpb = point biserial correlation.
3.3 Procedures for Detecting Item Bias
One of the goals of the OSTP-ACE EOI assessments is to assemble a set of items that provides a measure of a student’s ability that is as fair and accurate as possible for all subgroups within the population. Differential item functioning (DIF) analysis refers to statistical procedures that assess whether items are differentially difficult for different groups of examinees of matched achievement levels. DIF procedures typically control for overall between-group differences on a criterion, usually total test scores. Between-group performance on each item is then compared within sets of examinees having the same total

Oklahoma ACE EOI 2012 Technical Report
Pearson, Inc. and SDE Confidential
21
test scores. If the item is differentially more difficult for an identifiable subgroup when conditioned on ability, the item may be measuring something different from the intended construct. However, it is important to recognize that DIF-flagged items might be related to actual differences in relevant knowledge or skills or statistical Type I error. As a result, DIF statistics are used only to identify potential sources of item bias. Subsequent review by content experts and bias committees are required to determine the source and meaning of performance differences. For the OSTP-ACE EOI test DIF analyses, DIF statistics were estimated for all major subgroups of students with sufficient sample size: African American, Hispanic, Asian, Native American, and Female. Field test items with statistically-significant differences in performance were flagged so that items could be carefully examined for possible biased or unfair content that was undetected in earlier fairness and bias content review meetings held prior to form construction. Pearson used the Mantel-Haenszel (MH) chi-square approach for detecting DIF in multiple choice and open-ended items. Pearson calculated the Mantel-Haenszel statistic (MH D-DIF; Holland & Thayer 1988) to measure the degree and magnitude of DIF. The student group of interest is the focal group, and the group to which performance on the item is being compared is the reference group. The reference groups for these DIF analyses were White for race and male for gender. The focal groups were females and minority race groups. Items were separated into one of three categories on the basis of DIF statistics (Holland and Thayer 1988; Dorans and Holland 1993): negligible DIF (category A), intermediate DIF (category B), and large DIF (category C). The items in category C, which exhibit significant DIF, are of primary concern. The item classifications are based on the Mantel-Haenszel chi-
square and the MH delta () value. Positive values of delta indicate that the item is easier for the focal group, and a negative value of delta indicates that the item is more difficult for the focal group. The item classifications are made as follows (Michaelides, 2008):
The item is classified as C category if the MH D-DIF is significantly different from zero (p < 0.05) and its absolute value is greater than 1.5.
The item is classified as B category if the MH D-DIF is significantly different from zero (p < 0.05) and its absolute value is between 1.0 and 1.5.
The item is classified as A category if the MH D-DIF is not significantly different from zero (p ≥ 0.05) or if its absolute value is less than 1.0.
3.3.a Differential Item Functioning Results
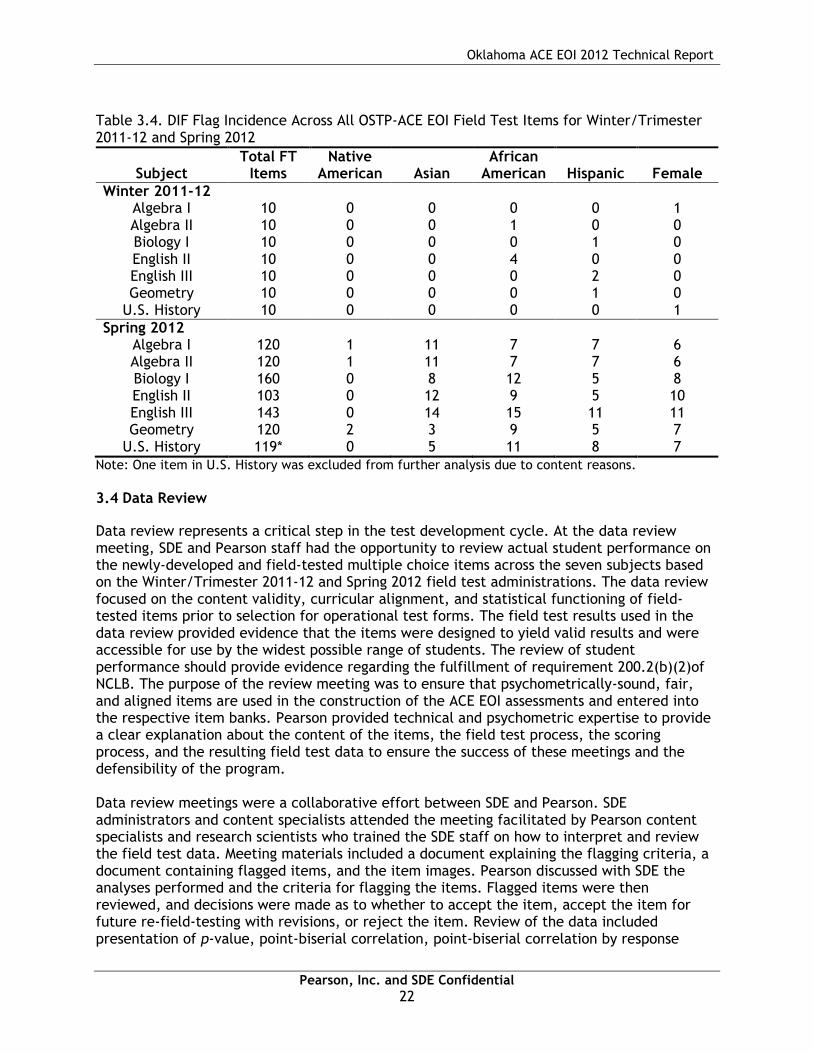
The data in Table 3.4 summarize the number of items in DIF categories for the seven subjects for the Winter/Trimester 2011-12 and Spring 2012 administrations. The results presented in this table are for field test items only. Items flagged for DIF were placed before expert content specialists during the Spring 2012 field test data review as described in the Section 3.4. Field test items that exhibit bias as a result of the content of the item were flagged in the item bank, excluding them from future use.
Oklahoma ACE EOI 2012 Technical Report
Pearson, Inc. and SDE Confidential
22
Table 3.4. DIF Flag Incidence Across All OSTP-ACE EOI Field Test Items for Winter/Trimester 2011-12 and Spring 2012
Subject Total FT
Items Native
American Asian African
American Hispanic Female
Winter 2011-12 Algebra I 10 0 0 0 0 1 Algebra II 10 0 0 1 0 0 Biology I 10 0 0 0 1 0 English II 10 0 0 4 0 0 English III 10 0 0 0 2 0 Geometry 10 0 0 0 1 0
U.S. History 10 0 0 0 0 1
Spring 2012 Algebra I 120 1 11 7 7 6 Algebra II 120 1 11 7 7 6 Biology I 160 0 8 12 5 8 English II 103 0 12 9 5 10 English III 143 0 14 15 11 11 Geometry 120 2 3 9 5 7
U.S. History 119* 0 5 11 8 7
Note: One item in U.S. History was excluded from further analysis due to content reasons.
3.4 Data Review
Data review represents a critical step in the test development cycle. At the data review meeting, SDE and Pearson staff had the opportunity to review actual student performance on the newly-developed and field-tested multiple choice items across the seven subjects based on the Winter/Trimester 2011-12 and Spring 2012 field test administrations. The data review focused on the content validity, curricular alignment, and statistical functioning of field-tested items prior to selection for operational test forms. The field test results used in the data review provided evidence that the items were designed to yield valid results and were accessible for use by the widest possible range of students. The review of student performance should provide evidence regarding the fulfillment of requirement 200.2(b)(2)of NCLB. The purpose of the review meeting was to ensure that psychometrically-sound, fair, and aligned items are used in the construction of the ACE EOI assessments and entered into the respective item banks. Pearson provided technical and psychometric expertise to provide a clear explanation about the content of the items, the field test process, the scoring process, and the resulting field test data to ensure the success of these meetings and the defensibility of the program. Data review meetings were a collaborative effort between SDE and Pearson. SDE administrators and content specialists attended the meeting facilitated by Pearson content specialists and research scientists who trained the SDE staff on how to interpret and review the field test data. Meeting materials included a document explaining the flagging criteria, a document containing flagged items, and the item images. Pearson discussed with SDE the analyses performed and the criteria for flagging the items. Flagged items were then reviewed, and decisions were made as to whether to accept the item, accept the item for future re-field-testing with revisions, or reject the item. Review of the data included presentation of p-value, point-biserial correlation, point-biserial correlation by response
Oklahoma ACE EOI 2012 Technical Report
Pearson, Inc. and SDE Confidential
23
option, response distributions, mean overall score by response option, and indications of item DIF and IRT misfit. Items failing to meet the requirements of sound technical data were carefully considered for rejection by the review panel, thereby enhancing the reliability and improving the validity of the items left in the bank for future use. While the panel used the data as a tool to inform their judgments, the panel (and not the data alone) made the final determination as to the appropriateness or fairness of the assessment items. The flagging criteria for the ACE EOI assessments are as follows:
p-value < .25 or > .90
point-biserial correlation < .15
distractor point-biserial correlation > .05
differential item functioning (DIF): test item biases for subgroups
IRT misfit as flagged by the Q1 index (see section 4.3) Bias Review. One aspect of the data review meetings was to assess potential bias based on DIF results and item content. Although bias in the items had been avoided through writer training and review processes, there is always the potential for bias to be detected through statistical analysis. It is important to include this step in the development cycle because SDE and Pearson wish to avoid inclusion of an item that is biased in some way against a group, because the item may lead to inequitable test results. As described earlier, all field test items were analyzed statistically for DIF using the field test data. A Pearson research scientist explained the meaning, in terms of level, and the direction of the DIF flags. The data review panel reviewed the item content, the percentage of students selecting each response option, and the point-biserial correlation for each response option by gender and ethnicity for all items flagged for DIF. The data review panel was then asked if there was context (for example, cultural barriers) or language in an item that might result in bias (i.e., an explanation for the existence of the statistical DIF flag). 3.4.a Results of Data Review
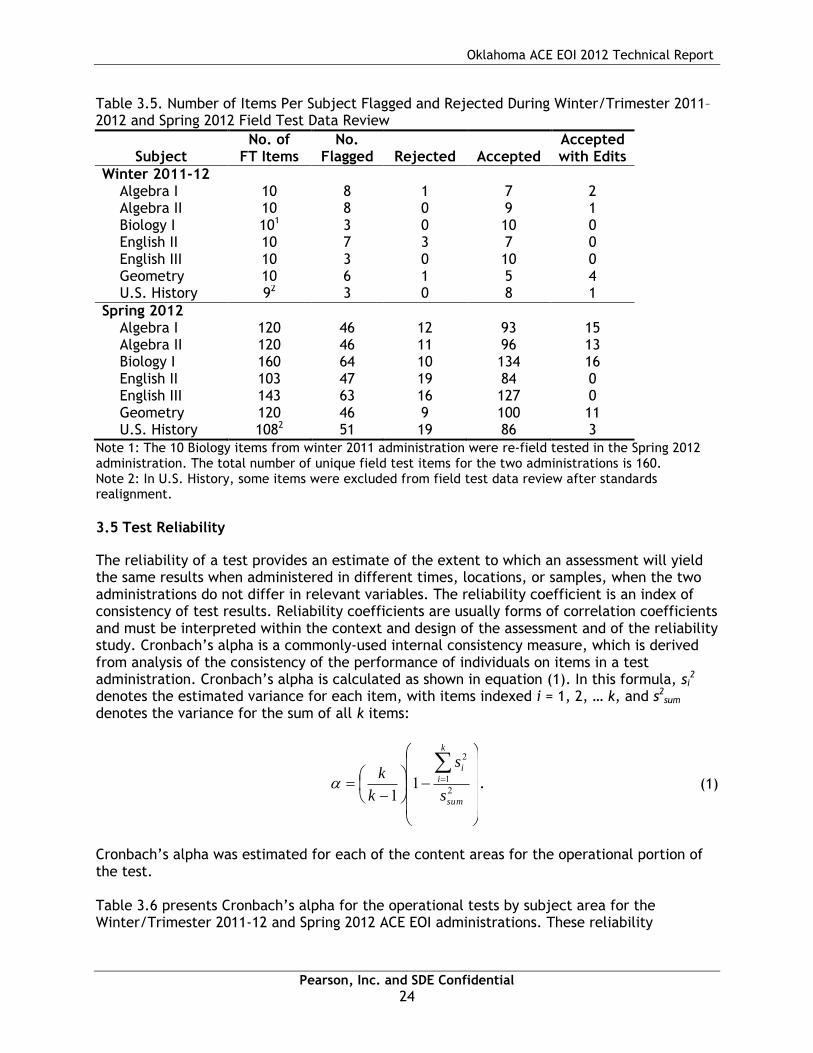
The number of items inspected during data review that met the statistical flagging criteria for the classical item analyses, DIF, and IRT procedures is presented in Table 3.5.
Oklahoma ACE EOI 2012 Technical Report
Pearson, Inc. and SDE Confidential
24
Table 3.5. Number of Items Per Subject Flagged and Rejected During Winter/Trimester 2011–2012 and Spring 2012 Field Test Data Review
Subject No. of
FT Items No.
Flagged Rejected Accepted Accepted with Edits
Winter 2011-12 Algebra I 10 8 1 7 2 Algebra II 10 8 0 9 1 Biology I 101 3 0 10 0 English II 10 7 3 7 0 English III 10 3 0 10 0 Geometry 10 6 1 5 4 U.S. History 92 3 0 8 1
Spring 2012 Algebra I 120 46 12 93 15 Algebra II 120 46 11 96 13 Biology I 160 64 10 134 16 English II 103 47 19 84 0 English III 143 63 16 127 0 Geometry 120 46 9 100 11 U.S. History 1082 51 19 86 3
Note 1: The 10 Biology items from winter 2011 administration were re-field tested in the Spring 2012 administration. The total number of unique field test items for the two administrations is 160. Note 2: In U.S. History, some items were excluded from field test data review after standards realignment. 3.5 Test Reliability
The reliability of a test provides an estimate of the extent to which an assessment will yield the same results when administered in different times, locations, or samples, when the two administrations do not differ in relevant variables. The reliability coefficient is an index of consistency of test results. Reliability coefficients are usually forms of correlation coefficients and must be interpreted within the context and design of the assessment and of the reliability study. Cronbach’s alpha is a commonly-used internal consistency measure, which is derived from analysis of the consistency of the performance of individuals on items in a test administration. Cronbach’s alpha is calculated as shown in equation (1). In this formula, si
2 denotes the estimated variance for each item, with items indexed i = 1, 2, … k, and s2
sum denotes the variance for the sum of all k items:
21
2
11 sum
k
i
i
s
s
k
k . (1)
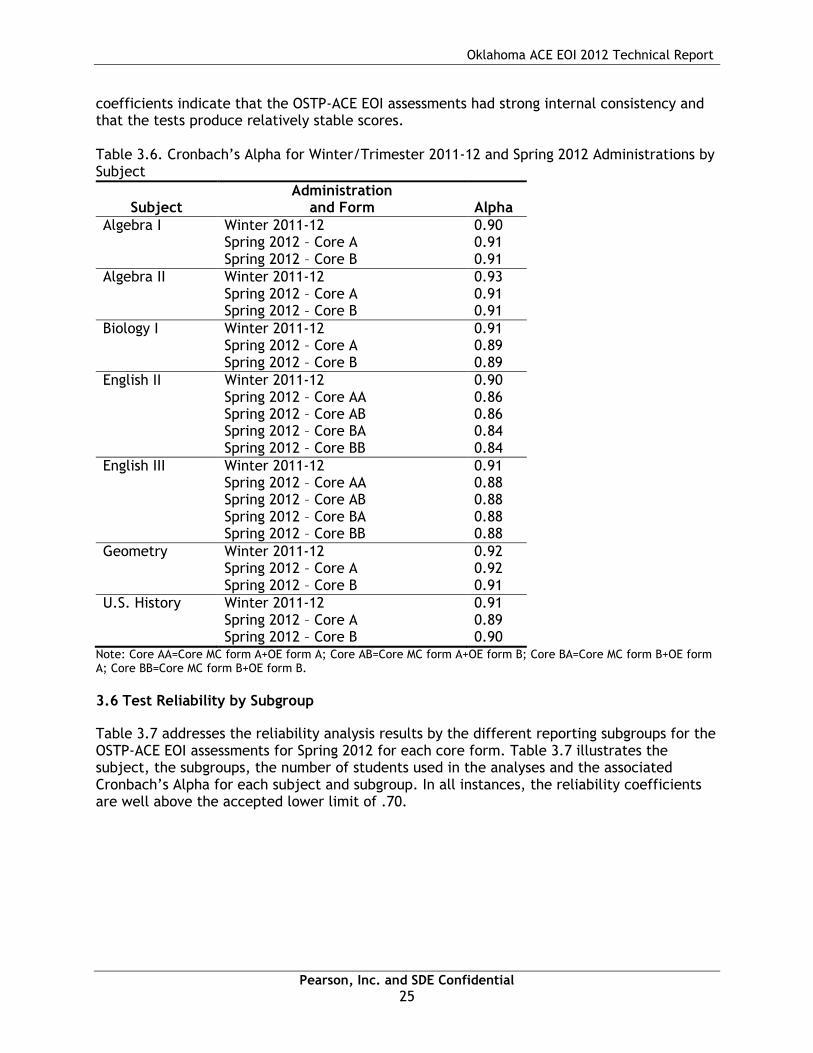
Cronbach’s alpha was estimated for each of the content areas for the operational portion of the test. Table 3.6 presents Cronbach’s alpha for the operational tests by subject area for the Winter/Trimester 2011-12 and Spring 2012 ACE EOI administrations. These reliability
Oklahoma ACE EOI 2012 Technical Report
Pearson, Inc. and SDE Confidential
25
coefficients indicate that the OSTP-ACE EOI assessments had strong internal consistency and that the tests produce relatively stable scores. Table 3.6. Cronbach’s Alpha for Winter/Trimester 2011-12 and Spring 2012 Administrations by Subject
Subject Administration
and Form Alpha
Algebra I Winter 2011-12 0.90 Spring 2012 – Core A 0.91 Spring 2012 – Core B 0.91
Algebra II Winter 2011-12 0.93 Spring 2012 – Core A 0.91 Spring 2012 – Core B 0.91
Biology I Winter 2011-12 0.91 Spring 2012 – Core A 0.89 Spring 2012 – Core B 0.89
English II Winter 2011-12 0.90 Spring 2012 – Core AA 0.86 Spring 2012 – Core AB 0.86 Spring 2012 – Core BA 0.84 Spring 2012 – Core BB 0.84
English III Winter 2011-12 0.91 Spring 2012 – Core AA 0.88 Spring 2012 – Core AB 0.88 Spring 2012 – Core BA 0.88 Spring 2012 – Core BB 0.88
Geometry Winter 2011-12 0.92 Spring 2012 – Core A 0.92 Spring 2012 – Core B 0.91
U.S. History Winter 2011-12 0.91 Spring 2012 – Core A 0.89 Spring 2012 – Core B 0.90
Note: Core AA=Core MC form A+OE form A; Core AB=Core MC form A+OE form B; Core BA=Core MC form B+OE form A; Core BB=Core MC form B+OE form B. 3.6 Test Reliability by Subgroup
Table 3.7 addresses the reliability analysis results by the different reporting subgroups for the OSTP-ACE EOI assessments for Spring 2012 for each core form. Table 3.7 illustrates the subject, the subgroups, the number of students used in the analyses and the associated Cronbach’s Alpha for each subject and subgroup. In all instances, the reliability coefficients are well above the accepted lower limit of .70.

Oklahoma ACE EOI 2012 Technical Report
Pearson, Inc. and SDE Confidential
26
Table 3.7. Test Reliability by Subgroup for Spring 2012
Subject Core Male Female African-
American Native
American Hispanic Asian White
Algebra I A 0.91 0.91 0.90 0.90 0.90 0.92 0.91 B 0.91 0.91 0.90 0.90 0.91 0.91 0.91
Algebra II A 0.91 0.90 0.88 0.89 0.90 0.92 0.90 B 0.91 0.90 0.89 0.90 0.90 0.92 0.90
Biology I A 0.89 0.88 0.86 0.87 0.88 0.90 0.88 B 0.89 0.89 0.87 0.87 0.87 0.92 0.88
English II AA 0.87 0.86 0.86 0.84 0.88 0.89 0.85 AB 0.86 0.86 0.85 0.84 0.87 0.91 0.85 BA 0.84 0.84 0.84 0.82 0.87 0.89 0.81 BB 0.84 0.84 0.85 0.83 0.86 0.88 0.81
English III AA 0.88 0.87 0.86 0.87 0.86 0.89 0.88 AB 0.89 0.88 0.87 0.87 0.87 0.90 0.88 BA 0.88 0.88 0.87 0.87 0.86 0.89 0.87 BB 0.88 0.88 0.85 0.87 0.86 0.90 0.88
Geometry A 0.93 0.92 0.92 0.91 0.91 0.92 0.92 B 0.91 0.91 0.91 0.90 0.90 0.93 0.90
U.S. History
A 0.90 0.88 0.88 0.88 0.88 0.89 0.89
B 0.90 0.89 0.88 0.89 0.89 0.91 0.89 Note: Core AA=Core MC form A+OE form A; Core AB=Core MC form A+OE form B; Core BA=Core MC form B+OE form A; Core BB=Core MC form B+OE form B. Table 3.7. Test Reliability by Subgroup for Spring 201 (cont.)
Subject Core
English Language Learner
Individual Education
Plan Economically Disadvantaged
Algebra I A 0.90 0.90 0.90 B 0.90 0.89 0.90
Algebra II A 0.89 0.87 0.89 B 0.90 0.88 0.90
Biology I A 0.83 0.88 0.87 B 0.85 0.88 0.88
English II AA 0.85 0.86 0.86 AB 0.83 0.86 0.85 BA 0.84 0.86 0.84 BB 0.82 0.79 0.85
English III AA 0.82 0.83 0.87 AB 0.81 0.84 0.87 BA 0.82 0.86 0.87 BB 0.80 0.83 0.86
Geometry A 0.92 0.90 0.92 B 0.91 0.90 0.90
U.S. History A 0.86 0.89 0.88 B 0.86 0.90 0.89
Note: Core AA=Core MC form A+OE form A; Core AB=Core MC form A+OE form B; Core BA=Core MC form B+OE form A; Core BB=Core MC form B+OE form B.

Oklahoma ACE EOI 2012 Technical Report
Pearson, Inc. and SDE Confidential
27
3.7 Inter-rater Reliability
Inter-rater reliability is referred to as the degree of agreement among scorers that allows for the scores to be interpreted as reasonably intended by the test developer (AERA, APA and NCME, 1999). The Winter/Trimester 2011-12 English II and English III tests contained one operational writing prompt each and the Spring 2012 tests contained one writing prompt per core form. Raters were trained to implement the scoring rubrics, anchor papers, check sets, and resolution reading. The items were analytically scored by two raters on five traits in both administrations. The final writing score for a student on a given trait is the average of the two scores. The inter-rater reliability coefficients for the operational prompt are presented in Table 3.8 for English II and Table 3.9 for English III. The results show that exact and adjacent rater agreement on trait scores for both the Winter/Trimester 2011-12 and Spring 2012 operational writing prompts were reasonably high. The weighted Kappa statistic (Kraemer, 1982) is an indication of inter-rater reliability after correcting for chance. The Kappa values for the OSTP-ACE EOI Winter/Trimester 2011-12 and Spring 2012 operational writing prompts are within the fair range for English II and close to or within the moderate range for English III.

Oklahoma ACE EOI 2012 Technical Report
Pearson, Inc. and SDE Confidential
28
Table 3.8.Inter-rater Reliability for English II Operational Writing Prompts for Winter/Trimester 2011-12 and Spring 2012
Trait Max
Points Valid
N
Point Discrepancy Percentages Agreement Percentages
Kappa -3 -2 -1 0 1 2 3 Exact Adjacent +/- 2 or more
Winter/Trimester 2011-12 1 4 1,448 0.01 0.49 18.00 62.90 17.97 0.62 0.01 62.90 35.97 1.13 0.39 2 4 1,448 0.00 0.57 18.41 62.31 18.00 0.71 0.00 62.31 36.41 1.28 0.39 3 4 1,448 0.00 0.46 17.68 64.18 17.20 0.48 0.01 64.18 34.88 0.94 0.37 4 4 1,448 0.00 0.75 18.85 61.36 18.29 0.73 0.01 61.36 37.15 1.50 0.38 5 4 1,448 0.00 0.73 19.46 59.44 19.57 0.79 0.01 59.44 39.03 1.53 0.37
Spring 2012 Core Form A 1 4 17,937 0.00 0.69 18.18 62.29 18.19 0.65 0.00 62.29 36.37 1.34 0.31 2 4 17,937 0.00 0.73 18.88 61.28 18.45 0.66 0.00 61.28 37.33 1.39 0.31 3 4 17,937 0.00 0.70 18.65 61.11 18.95 0.58 0.01 61.11 37.60 1.29 0.31 4 4 17,937 0.01 0.63 19.25 60.63 18.84 0.64 0.01 60.63 38.09 1.28 0.33 5 4 17,937 0.01 0.68 19.59 59.60 19.53 0.58 0.02 59.60 39.11 1.28 0.32
Spring 2012 Core Form B 1 4 17,990 0.01 0.49 18.00 62.90 17.97 0.62 0.01 62.90 35.97 1.13 0.33 2 4 17,990 0.00 0.57 18.41 62.31 18.00 0.71 0.00 62.31 36.41 1.28 0.33 3 4 17,990 0.00 0.46 17.68 64.18 17.20 0.48 0.01 64.18 34.88 0.94 0.33 4 4 17,990 0.00 0.75 18.85 61.36 18.29 0.73 0.01 61.36 37.15 1.50 0.35 5 4 17,990 0.00 0.73 19.46 59.44 19.57 0.79 0.01 59.44 39.03 1.53 0.32

Oklahoma ACE EOI 2012 Technical Report
Pearson, Inc. and SDE Confidential
29
Table 3.9. Inter-rater Reliability for English III Operational Writing Prompts for Winter/Trimester 2011-12 and Spring 2012
Trait Max
Points Valid
N
Point Discrepancy Percentages Agreement Percentages
Kappa -3 -2 -1 0 1 2 3 Exact Adjacent +/- 2 or more
Winter/Trimester 2011-12 1 4 1,721 0.00 0.99 19.64 61.07 17.49 0.81 0.00 61.07 37.13 1.80 0.45 2 4 1,721 0.00 1.39 19.17 61.53 16.97 0.93 0.00 61.53 36.14 2.32 0.45 3 4 1,721 0.00 0.76 18.54 62.46 17.72 0.52 0.00 62.46 36.26 1.28 0.47 4 4 1,721 0.00 0.81 19.52 62.46 16.27 0.87 0.06 62.46 35.79 1.74 0.48 5 4 1,721 0.00 1.28 19.12 60.20 18.71 0.70 0.00 60.20 37.83 1.98 0.47
Spring 2012 Core Form A 1 4 18,059 0.02 0.86 17.80 62.30 18.42 0.58 0.02 62.30 36.22 1.48 0.41 2 4 18,059 0.01 0.79 17.76 62.37 18.35 0.71 0.01 62.37 36.11 1.52 0.41 3 4 18,059 0.01 0.61 17.75 63.21 17.92 0.49 0.01 63.21 35.67 1.12 0.41 4 4 18,059 0.01 0.61 18.23 62.00 18.65 0.48 0.02 62.00 36.88 1.12 0.41 5 4 18,059 0.01 0.56 19.00 60.97 18.96 0.48 0.01 60.97 37.96 1.06 0.41
Spring 2012 Core Form B 1 4 18,121 0.01 0.44 15.66 67.72 15.78 0.39 0.01 67.72 31.44 0.84 0.39 2 4 18,121 0.01 0.39 15.59 67.89 15.77 0.36 0.00 67.89 31.36 0.76 0.39 3 4 18,121 0.02 0.40 15.44 67.83 15.97 0.34 0.00 67.83 31.41 0.76 0.39 4 4 18,121 0.01 0.51 15.92 66.77 16.30 0.49 0.00 66.77 32.22 1.00 0.39 5 4 18,121 0.01 0.48 16.73 65.66 16.61 0.51 0.00 65.66 33.34 1.00 0.38

Oklahoma ACE EOI 2012 Technical Report
Pearson, Inc. and SDE Confidential
30
Section 4
Calibration, Equating, and Scaling
This section introduces the item response theory (IRT) models, methods, and processes that were used to calibrate, equate, and scale the OCCT EOI tests. The three-parameter logistic (3-PL) IRT model (Lord & Novick, 1968) was used for dichotomously-scored test items and the Generalized Partial Credit (GPC; Muraki, 1997) model was used for polytomously-scored test items. For Winter/Trimester 2011-12 and Spring 2012, pre-equating procedures were applied to the subjects of Algebra I, Algebra II, Biology I, Geometry, and U.S. History, and post-equating procedures for the subjects of English II and English III. 4.1 Item Response Theory Models
Dichotomous Item Response Theory Model. The 3-PL IRT model was used for calibrating the dichotomously-scored multiple choice items. In the 3-PL model (Lord, 1980), the probability that a student with an achievement level of θ responds correctly to item i is
)(11)1()(
ii bDaiiie
ccP
, (2)
where ai is the item discrimination parameter, bi is the item difficulty parameter, ci is the lower asymptote parameter, and D is a scaling constant, which is equal to 1.7. With multiple-choice items it is assumed that, due to guessing, examinees with very low ability levels have a probability greater than zero of responding correctly to an item. This probability is represented in the 3-PL model by the ci parameter. Polytomous Item Response Theory Model. For calibrating the polytomously-scored open-ended (OE) writing prompt items, the Generalized Partial Credit model was used. In the GPC model, the probability that a student with ability level θ will have a score in the kth category of the ith item is
im
c
c
v
ivi
k
v
ivi
ik
bDa
bDa
P
1 1
1
)(exp
)(exp)(
, (3)
where mi is the total score levels for item i for k = v category responses, ia is the slope
parameter, D is a scaling constant with the value of 1.7, and ivb is the category intersection
parameters (or (bi – div) where bi is location/difficulty and div is the threshold parameters representing category boundaries relative to the item location parameter). The IRT models were calibrated using MULTILOG 7.03 (Thissen, Chen, & Bock, 2003). MULTILOG estimates parameters simultaneously for dichotomous and polytomous items via marginal maximum likelihood procedures and implements the GPC model with the appropriate parameter coding. All item and student ability calibrations were independently conducted and verified by at least two Pearson research scientists.

Oklahoma ACE EOI 2012 Technical Report
Pearson, Inc. and SDE Confidential
31
4.2 Pre-Equating
Pre-equating procedures were applied to OCCT ACE EOI tests consisting entirely of dichotomously-scored multiple-choice items. These subjects included Algebra I, Algebra II, Biology I, Geometry, and U.S. History. ACE EOI tests English II and English III remained post-equated. All pre-equated forms were constructed using only previously-administered operational items and a set of unscored field-test items. Pearson Psychometric & Research Services staff created raw score to scale score (RSSS) tables using the freely-available program, POLYEQUATE (Kolen, 2004). Banked item parameter estimates for the forms’ operational items were imported into POLYEQUATE as both the “new” and “old” forms to create a table of raw score to true score equivalents. Scaling constants provided in Table 4.2 (M1 and M2) were used to rescale true score equivalents to the reported scale score metric. The lowest obtainable scale score (LOSS) and highest obtainable scale score (HOSS) for each subject also appear in Table 4.2. Performance level cut scores appear in Table 4.3. Because the scale cut score may not always be present in the RSSS table, the scale scores that were closest to, but below the scale scores (thetas) set in standard setting were used as the “effective” cut scores. In addition, a conditional standard error of measurement (CSEM; please see Section 6.3 for computation of CSEM) was computed for each of the raw score points. The resulting raw score to scale score conversions, CSEMs, as well as the performance levels for the pre-equated tests, are shown in Table 4.4 and Table 4.5, respectively, for the Winter/Trimester 2011-12 and Spring 2012 administrations. The following section outlines post-equating work completed for the ACE EOI English II and English III tests. 4.3 Assessment of Fit to the IRT Model
For post-equated tests, item fit was assessed using the Yen’s (1981, 1984) Q1 item fit index,
which approximately follows a 2 distribution:
10
1
2
1 )1()(
r irir
irirri
EE
EONQ , (4)
where Q1i is the fit of the ith item, Nr is the number of examinees per cell, Oir is the observed proportion of examinees in cell r that correctly answered item i, and Eir is the expected portion of examinees in cell r that correctly answered item i. The expected proportions are computed using ability- and item parameter estimates in Equations (2) and (3) and summing over examinees in cell r:
irN
rk
ki
ir
ir PN
E
)ˆ(1. (5)
Because chi-square statistics are affected by sample size and associated degrees of freedom, the following standardization of the Q1 statistic was used:

Oklahoma ACE EOI 2012 Technical Report
Pearson, Inc. and SDE Confidential
32
)2(1
df
dfQZ i
j
. (6)
The Z-statistic is an index of the degree to which observed proportions of item scores are similar to the proportions that would be expected, given the estimated ability- and item parameters. Large differences between expected and observed item performance may indicate poor item fit. To assess item fit, a critical Z-value is determined. Items with Z-values that are larger than this critical Z-value have poor item fit. The item characteristic curves, classical item statistics, and item content were reviewed for items flagged by Q1. An internally-developed software program, Q1Static, was used to compute the Q1 item fit index. Operational items flagged by Q1 that were not flagged by the classical item statistics and had reasonable IRT parameter estimates were not reviewed further. If any operational items were also flagged by classical item statistics and/or had poor IRT parameter estimates (e.g., low a parameter), the items were reviewed by Pearson content specialists. Any item that was potentially mis-keyed was presented to SDE to make a decision regarding whether to keep or remove the item. No such incidences occurred for operational items administered in Winter/Trimester 2011-12 or Spring 2012. 4.3.a Calibration and IRT Fit Results for Post-Equated Tests
4.3.a.i Winter/Trimester 2011-12
English II. For the Winter/Trimester 2011-12 English II assessment, based on the calibration sample, the Z-statistics for most operational items were smaller than the critical Z-statistic. Four English II items were flagged for further review based on their fit statistics. English III. For the Winter/Trimester 2011-12 English III assessment, based on the calibration sample, the Z-statistics for most operational items were smaller than the critical Z-statistic. Two English III items were flagged for further review based on their fit statistics. For each item that was flagged based on its model fit index, a careful review of both CTT and IRT item statistics was conducted to determine whether the item should be dropped from calibration, equating, or scoring. No items were dropped from any of the Winter/Trimester 2011-12 ACE EOI assessments for calibration, equating, or scoring as a result of their Q1 statistics. 4.3.a.ii Spring 2012
English II. For the Spring 2012 English II assessment, based on the calibration sample, the Z-statistics for most operational items were smaller than the critical Z-statistic. One English II item was flagged for further review based on its fit statistics. English III. For the Spring 2012 English III assessment, based on the calibration sample, the Z-statistics for most operational items were smaller than the critical Z-statistic. Two English III items were flagged for further review based on their fit statistics. For each item that was flagged based on its model fit indices, a careful review of both CTT and IRT item statistics was conducted to determine whether the item should be dropped from

Oklahoma ACE EOI 2012 Technical Report
Pearson, Inc. and SDE Confidential
33
calibration, equating, or scoring. No items were dropped from any of the Spring 2012 ACE EOI assessments for calibration, equating, or scoring as a result of their Q1 statistics. Field Test Items. The field test items across all subjects were evaluated using the Q1 statistic to evaluate the extent to which the obtained proportions of item scores are close to the proportions that would be expected based on the estimated thetas and item parameters. Any field test items flagged by Q1 were included in the data review for review by content specialists from Pearson and SDE (for more on data review, please see Section 3.4). 4.4 Calibration and Equating
The 3-PL model was used exclusively for calibration and equating of all items for the purposes of rescaling field test items to the bank metric for Algebra I, Algebra II, Geometry, Biology I, and U.S. History, all of which consist entirely of multiple choice items. Because English II and English III have multiple choice and open-ended items, a simultaneous calibration with the 3-PL and GPC models was implemented for the calibration and equating of the operational test forms and field test items for those assessments. A common item, non-equivalent groups (CINEG) design was used for ACE EOI English II and English III tests to link the current test forms (i.e., Winter/Trimester 2011-12 and Spring 2012) to the base scale. For the CINEG design, common anchor items are selected to be representative of the test content in terms of difficulty and the test blueprint. For the ACE EOI English II and English III Winter/Trimester 2011-12 and Spring 2012 tests, all operational items were used as common or anchor items to link to the base scale. The Stocking and Lord (1983) procedure, which estimates the equating transformation constants by minimizing the distance between the test characteristic curves of the common items, was used to equate the tests to the base year. Equating was conducted using freely-available software, STUIRT (Kim & Kolen, 2004). Prior to conducting the equating, anchor stability checks were performed to eliminate the impact of item drift on equating. 4.4.a Common Linking Items for Spring 2012
Table 4.1 presents the number and percentage of common linking items for all post-equated subject for the Spring 2012 administration. The common linking items were necessary as a result of two core operational forms being in use during the Spring 2012 administration. The common linking items were used for simultaneous calibration during the IRT item parameter estimation to keep the items on the same scale. For each test, the common linking set was comprised of approximately 20 items, or greater than 30% of all operational items, and counts may vary by subject. In addition, the common linking set was proportionally representative of the total test in terms of content assessed and mimicked the difficulty of the overall test as well. Table 4.1. Number of Common Linking Items Per Subject for Spring 2012
Subject Number of
Items on Test Number of
Linking Items Percent of
Test
English II 61 20 33% English III 63 20 32%

Oklahoma ACE EOI 2012 Technical Report
Pearson, Inc. and SDE Confidential
34
4.5 Item Stability Evaluation Methods
Despite the careful selection and placement of the operational items, it is possible for these items to perform differentially across administrations. Dramatic changes in item parameter values can result in systematic errors in equating results (Kolen & Brennan, 2004). As a result, prior to finalizing the equating constants, Pearson evaluated changes in the item parameters from the item bank to the Winter/Trimester 2011-12 and Spring 2012 administrations. The process used in this evaluation is called an item parameter stability check1. The item parameter stability check that Pearson performed is an iterative approach, which uses a method that is similar to the one used to check for differential item functioning. This method is called the d2 procedure. The steps taken were as follows:
1) Use a theoretically-weighted posterior θ distribution, g( k), with 40 quadrature points.
2) Place the current linking item parameters on the baseline scale by computing Stocking & Lord (SL) constants using STUIRT and all (k) linking items.
3) Apply the SL linking constants to the current item parameters and compute the current raw score to scale score table. The results based on all k linking items will comprise the original table.
4) For each linking item, calculate the weighted sum of the squared deviation (d2) between the item characteristic curves.
a) Apply the SL constants to the estimated ability levels (̂ ) associated with the standard normal θ distribution used to generate the SL constants.
b) For each anchor item, calculate a weighted sum of the squared deviations between the ICCs (d2) based on the old (x) and new (y) parameter estimates at each point in the θ distribution multiplied by the theoretically-weighted distribution.
)(22kkiyk
k
ixi gPPd (7)
c) Review and sort the items in descending (largest to smallest) order according to
the d2 estimate. d) Step 4c) results in the item with the largest area at the top.
i) Drop the item with the largest d2 from the linking set. ii) Repeat steps 2) through 4c) until 10 items are dropped computing 11 raw score
to scale score tables for comparative purposes. e) Review the raw score to scale score tables and keep the raw score to scale score table
where the raw to scale tables across iterations do not differ at all of the cut score points. The raw score to scale score table before the last iteration becomes the final table.
Before removing any item from the item parameter stability check, the following additional characteristics were examined: 1) prior and current year p-values and point-biserial correlations, 2) prior and current year IRT parameter estimates, 3) prior and current year item sequence, 4) standard and objective/skill of the item, 5) impact on blueprint representation, 6) passage ID/title for items linked to a stimulus, and 7) content review of the actual item. Decisions about whether to keep or remove an item were evaluated on a per
1 Note that the item stability check was applied only to post-equated tests.

Oklahoma ACE EOI 2012 Technical Report
Pearson, Inc. and SDE Confidential
35
item basis. If an item (note, only one item can be removed at a time) was removed from the, the process (beginning at the equating step) was be repeated until there were no further items to be removed (the raw score to scale score table has stabilized or the item is judged that it should be included in the equating set; for example, a portion of the blueprint is not represented if the item is removed). 4.5.a Results of the Item Parameter Item Stability Check
Once the anchor set was finalized, the equating constants obtained from the final Stocking and Lord (1983) run were applied to the non-anchor operational items for computation of raw score to scale score tables. For both Winter/Trimester 2011-12 and Spring 2012 administrations, no anchor items were dropped for English II or English III. 4.6 Scaling and Scoring Results
The Lowest Obtainable Scale Score (LOSS), Highest Obtainable Scale Score (HOSS), and final scaling constants for each of the subjects are shown in Table 4.2. The scaling constants, M1 (multiplicative) and M2 (additive), place the true scores associated with each raw score point onto the reporting or operational scale using a straightforward linear transformation: Scale Score = 21ˆ MM (8)
where ̂ = estimated true score. The true score-equivalent values were generated from equated parameter estimates using a freely-available software program, POLYEQUATE (Kolen, 2004). Each scale score on the assessment is associated with a performance level that describes the types of behavior, knowledge, and skill a student in this score level is likely to be able to do. For the ACE EOI assessments, there are three cut scores that divide scores into four performance levels: Unsatisfactory, Limited Knowledge, Proficient, and Advanced. The cut scores for each of the tests appear in Table 4.3. In addition, a conditional standard error of measurement (CSEM; please see Section 6.3 for computation of CSEM) was computed for each of the raw score points. The resulting raw score to scale score conversions, CSEMs, as well as the performance levels for English II and English III are shown in Table 4.4 and Table 4.5 for Winter/Trimester 2011-12 and Spring 2012, respectively. Table 4.2. LOSS, HOSS, and Scaling Constants by Subject
Subject LOSS HOSS M1 M2
Algebra I 490 999 58.0000 723.8000 Algebra II 440 999 77.1164 692.2381 Biology I 440 999 76.49429 716.76173 English II 440 999 84.80517 734.90335 English III 440 999 74.32896 736.1256 Geometry 440 999 75.51595 721.9844 US History 440 999 77.92698 722.20515
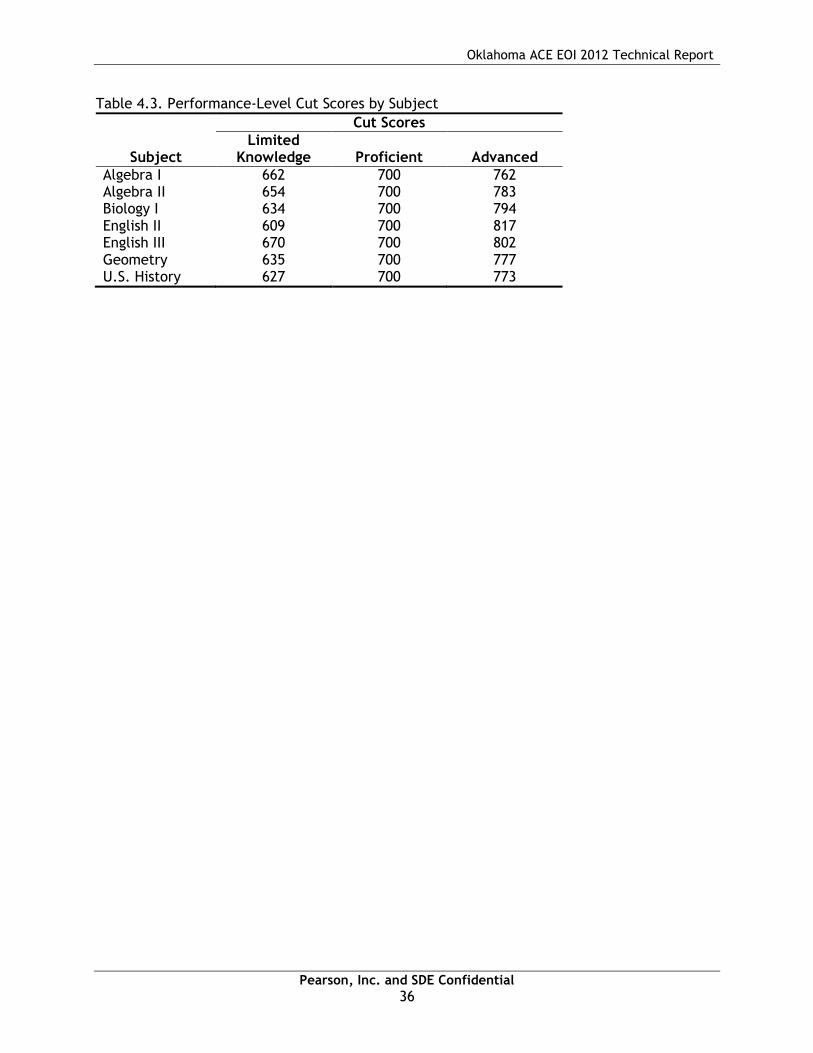
Oklahoma ACE EOI 2012 Technical Report
Pearson, Inc. and SDE Confidential
36
Table 4.3. Performance-Level Cut Scores by Subject
Subject
Cut Scores
Limited Knowledge Proficient Advanced
Algebra I 662 700 762 Algebra II 654 700 783 Biology I 634 700 794 English II 609 700 817 English III 670 700 802 Geometry 635 700 777 U.S. History 627 700 773

Oklahoma ACE EOI 2012 Technical Report
Pearson, Inc. and SDE Confidential
37
Table 4.4. Raw Score to Scale Score Conversion Tables for Winter/Trimester 2011-12
Raw Score
Algebra I Algebra II Biology I English II
Scale Score CSEM
Perf. Level
Scale Score CSEM
Perf. Level
Scale Score CSEM
Perf. Level
Scale Score CSEM
Perf. Level
0 490 52 1 440 67 1 440 46 1 440 39 1
1 490 52 1 440 67 1 440 46 1 440 39 1
2 490 52 1 440 67 1 440 46 1 440 39 1
3 490 52 1 440 67 1 440 46 1 440 39 1
4 490 52 1 440 67 1 440 46 1 440 39 1
5 490 52 1 440 67 1 440 46 1 440 39 1
6 490 52 1 440 67 1 440 46 1 440 39 1
7 490 52 1 440 67 1 440 46 1 440 39 1
8 490 52 1 440 67 1 440 46 1 440 39 1
9 490 52 1 440 67 1 440 46 1 440 39 1
10 490 52 1 440 67 1 440 46 1 440 39 1
11 490 52 1 440 67 1 440 46 1 440 39 1
12 528 55 1 515 72 1 440 46 1 440 39 1
13 569 58 1 554 74 1 440 46 1 440 39 1
14 593 58 1 580 73 1 472 51 1 440 39 1
15 610 55 1 599 68 1 503 54 1 440 39 1
16 624 51 1 614 61 1 526 56 1 454 41 1
17 635 46 1 627 54 1 545 55 1 482 45 1
18 645 40 1 638 47 1 560 53 1 503 48 1
19 654 35 1 654 41 2 574 50 1 521 48 1
20 662 31 2 657 36 2 586 46 1 536 48 1
21 669 27 2 666 32 2 597 43 1 548 46 1
22 675 24 2 673 29 2 606 39 1 559 43 1
23 681 22 2 680 27 2 616 36 1 569 40 1
24 687 20 2 687 25 2 624 33 1 578 37 1
25 692 19 2 694 23 2 634 31 2 587 35 1
26 700 18 3 700 22 3 640 29 2 595 32 1
27 702 17 3 706 21 3 647 28 2 602 30 1
28 706 16 3 711 20 3 654 26 2 609 29 2 Note: CSEM = Conditional Standard Error of Measure; Perf. Level = Performance Level; 1 = Unsatisfactory, 2 = Limited Knowledge, 3 = Proficient, 4 = Advanced

Oklahoma ACE EOI 2012 Technical Report
Pearson, Inc. and SDE Confidential
38
Table 4.4. Raw Score to Scale Score Conversion Tables for Winter/Trimester 2011-12 (cont.)
Raw Score
Algebra I Algebra II Biology I English II
Scale Score CSEM
Perf. Level
Scale Score CSEM
Perf. Level
Scale Score CSEM
Perf. Level
Scale Score CSEM
Perf. Level
29 711 15 3 717 20 3 661 25 2 616 27 2
30 715 15 3 722 19 3 667 24 2 623 26 2
31 719 14 3 727 18 3 674 24 2 629 25 2
32 723 14 3 733 18 3 680 23 2 636 25 2
33 727 14 3 738 18 3 686 22 2 642 24 2
34 731 13 3 743 18 3 692 22 2 648 24 2
35 735 13 3 748 17 3 700 22 3 654 23 2
36 739 13 3 753 17 3 704 21 3 660 23 2
37 743 13 3 758 17 3 710 21 3 666 23 2
38 746 13 3 764 17 3 716 21 3 672 23 2
39 750 13 3 769 17 3 721 21 3 679 23 2
40 755 13 3 774 17 3 727 21 3 685 22 2
41 762 13 4 783 18 4 733 21 3 691 22 2
42 763 13 4 786 18 4 739 21 3 700 22 3
43 767 14 4 792 18 4 746 21 3 703 22 3
44 772 14 4 798 18 4 752 21 3 710 22 3
45 777 14 4 805 19 4 758 21 3 716 22 3
46 782 15 4 812 20 4 765 22 3 723 23 3
47 788 16 4 819 21 4 772 22 3 729 23 3
48 794 18 4 827 22 4 779 23 3 736 23 3
49 801 20 4 836 25 4 794 24 4 743 24 3
50 809 24 4 847 28 4 795 25 4 751 24 3
51 819 30 4 859 33 4 804 27 4 758 25 3
52 831 40 4 875 38 4 814 29 4 766 26 3
53 848 54 4 898 44 4 825 31 4 775 26 3
54 877 67 4 938 43 4 837 35 4 784 27 3
55 999 35 4 999 33 4 852 39 4 794 29 3
56 - - - - - - 870 44 4 804 30 3 Note: CSEM = Conditional Standard Error of Measure; Perf. Level = Performance Level; 1 = Unsatisfactory, 2 = Limited Knowledge, 3 = Proficient, 4 = Advanced

Oklahoma ACE EOI 2012 Technical Report
Pearson, Inc. and SDE Confidential
39
Table 4.4. Raw Score to Scale Score Conversion Tables for Winter/Trimester 2011-12 (cont.)
Raw Score
Algebra I Algebra II Biology I English II
Scale Score CSEM
Perf. Level
Scale Score CSEM
Perf. Level
Scale Score CSEM
Perf. Level
Scale Score CSEM
Perf. Level
57 - - - - - - 893 48 4 817 33 4
58 - - - - - - 926 48 4 828 35 4
59 - - - - - - 987 36 4 842 38 4
60 - - - - - - 999 33 4 859 42 4
61 - - - - - - - - - 878 46 4
62 - - - - - - - - - 903 48 4
63 - - - - - - - - - 934 46 4
64 - - - - - - - - - 979 37 4
65 - - - - - - - - - 999 32 4
66 - - - - - - - - - 999 32 4 Note: CSEM = Conditional Standard Error of Measure; Perf. Level = Performance Level; 1 = Unsatisfactory, 2 = Limited Knowledge, 3 = Proficient, 4 = Advanced

Oklahoma ACE EOI 2012 Technical Report
Pearson, Inc. and SDE Confidential
40
Table 4.4. Raw Score to Scale Score Conversion Tables for Winter/Trimester 2011-12 (cont.)
Raw Score
English III Geometry U.S. History
Scale Score CSEM
Perf. Level
Scale Score CSEM
Perf. Level
Scale Score CSEM
Perf. Level
0 440 53 1 440 59 1 440 47 1
1 440 53 1 440 59 1 440 47 1
2 440 53 1 440 59 1 440 47 1
3 440 53 1 440 59 1 440 47 1
4 440 53 1 440 59 1 440 47 1
5 440 53 1 440 59 1 440 47 1
6 440 53 1 440 59 1 440 47 1
7 440 53 1 440 59 1 440 47 1
8 440 53 1 440 59 1 440 47 1
9 440 53 1 440 59 1 440 47 1
10 440 53 1 440 59 1 440 47 1
11 440 53 1 440 59 1 440 47 1
12 440 53 1 443 59 1 440 47 1
13 440 53 1 501 65 1 440 47 1
14 476 56 1 537 68 1 440 47 1
15 514 60 1 562 68 1 477 52 1
16 538 62 1 582 65 1 506 56 1
17 556 61 1 598 60 1 528 57 1
18 572 58 1 612 54 1 546 56 1
19 585 54 1 624 48 1 562 54 1
20 596 50 1 635 43 2 575 51 1
21 607 45 1 645 38 2 588 47 1
22 616 41 1 654 34 2 599 43 1
23 624 37 1 662 31 2 609 40 1
24 632 34 1 670 28 2 627 37 2
25 640 31 1 677 26 2 628 34 2
26 646 29 1 684 24 2 636 32 2
27 653 27 1 690 23 2 644 30 2
28 659 25 1 700 22 3 652 28 2 Note: CSEM = Conditional Standard Error of Measure; Perf. Level = Performance Level; 1 = Unsatisfactory, 2 = Limited Knowledge, 3 = Proficient, 4 = Advanced
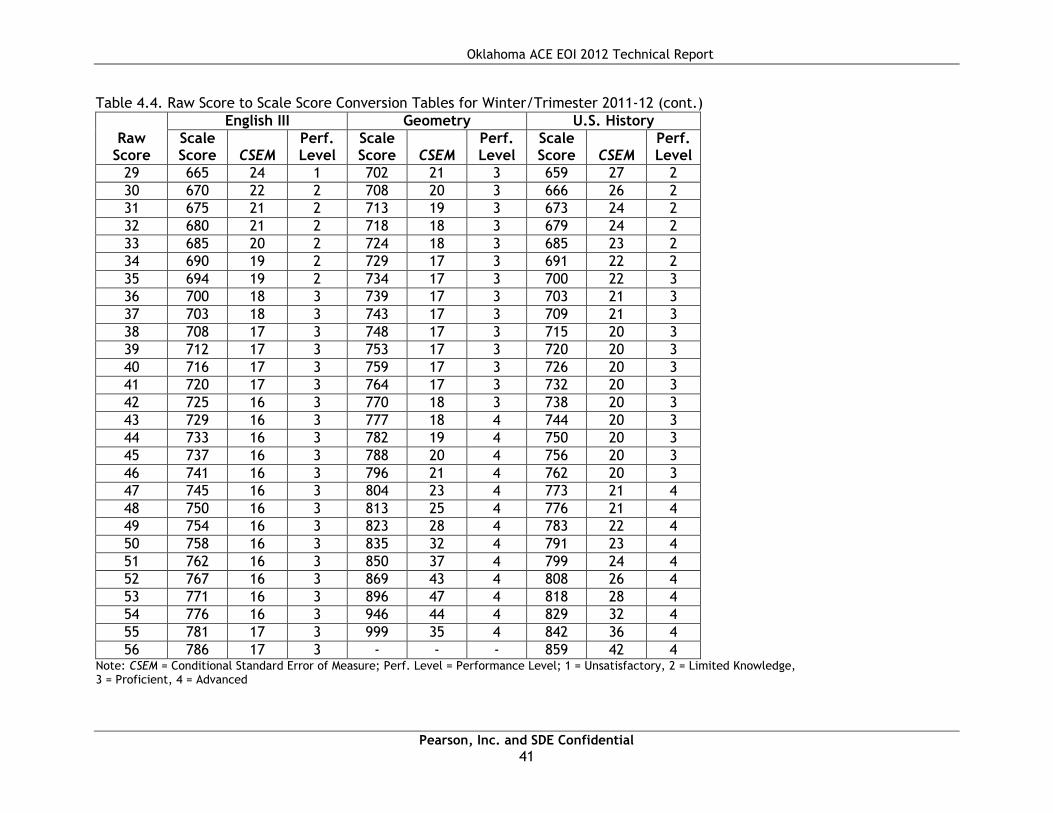
Oklahoma ACE EOI 2012 Technical Report
Pearson, Inc. and SDE Confidential
41
Table 4.4. Raw Score to Scale Score Conversion Tables for Winter/Trimester 2011-12 (cont.)
Raw Score
English III Geometry U.S. History
Scale Score CSEM
Perf. Level
Scale Score CSEM
Perf. Level
Scale Score CSEM
Perf. Level
29 665 24 1 702 21 3 659 27 2
30 670 22 2 708 20 3 666 26 2
31 675 21 2 713 19 3 673 24 2
32 680 21 2 718 18 3 679 24 2
33 685 20 2 724 18 3 685 23 2
34 690 19 2 729 17 3 691 22 2
35 694 19 2 734 17 3 700 22 3
36 700 18 3 739 17 3 703 21 3
37 703 18 3 743 17 3 709 21 3
38 708 17 3 748 17 3 715 20 3
39 712 17 3 753 17 3 720 20 3
40 716 17 3 759 17 3 726 20 3
41 720 17 3 764 17 3 732 20 3
42 725 16 3 770 18 3 738 20 3
43 729 16 3 777 18 4 744 20 3
44 733 16 3 782 19 4 750 20 3
45 737 16 3 788 20 4 756 20 3
46 741 16 3 796 21 4 762 20 3
47 745 16 3 804 23 4 773 21 4
48 750 16 3 813 25 4 776 21 4
49 754 16 3 823 28 4 783 22 4
50 758 16 3 835 32 4 791 23 4
51 762 16 3 850 37 4 799 24 4
52 767 16 3 869 43 4 808 26 4
53 771 16 3 896 47 4 818 28 4
54 776 16 3 946 44 4 829 32 4
55 781 17 3 999 35 4 842 36 4
56 786 17 3 - - - 859 42 4 Note: CSEM = Conditional Standard Error of Measure; Perf. Level = Performance Level; 1 = Unsatisfactory, 2 = Limited Knowledge, 3 = Proficient, 4 = Advanced

Oklahoma ACE EOI 2012 Technical Report
Pearson, Inc. and SDE Confidential
42
Table 4.4. Raw Score to Scale Score Conversion Tables for Winter/Trimester 2011-12 (cont.)
Raw Score
English III Geometry U.S. History
Scale Score CSEM
Perf. Level
Scale Score CSEM
Perf. Level
Scale Score CSEM
Perf. Level
57 791 18 3 - - - 880 47 4
58 796 18 3 - - - 911 48 4
59 802 19 4 - - - 968 39 4
60 808 20 4 - - - 999 33 4
61 814 21 4 - - - - - -
62 821 22 4 - - - - - -
63 829 24 4 - - - - - -
64 837 26 4 - - - - - -
65 846 28 4 - - - - - -
66 857 32 4 - - - - - -
67 870 36 4 - - - - - -
68 885 40 4 - - - - - -
69 905 44 4 - - - - - -
70 934 43 4 - - - - - -
71 986 32 4 - - - - - -
72 999 29 4 - - - - - - Note: CSEM = Conditional Standard Error of Measure; Perf. Level = Performance Level; 1 = Unsatisfactory, 2 = Limited Knowledge, 3 = Proficient, 4 = Advanced
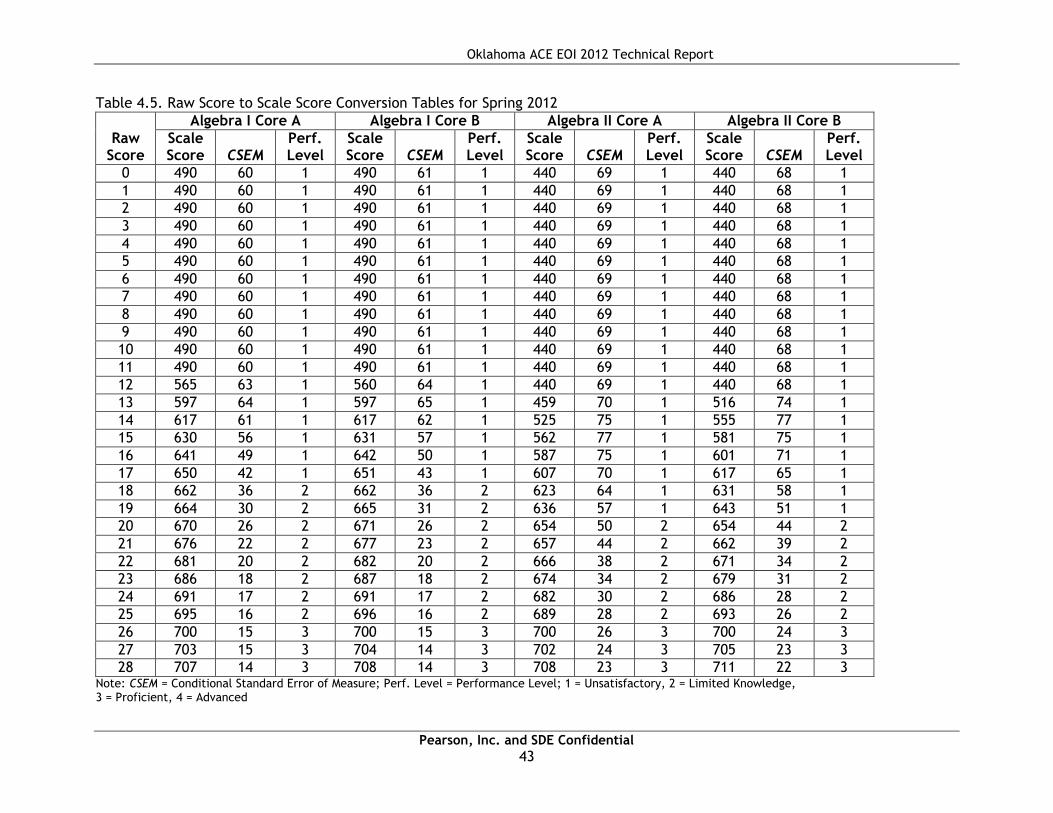
Oklahoma ACE EOI 2012 Technical Report
Pearson, Inc. and SDE Confidential
43
Table 4.5. Raw Score to Scale Score Conversion Tables for Spring 2012
Raw Score
Algebra I Core A Algebra I Core B Algebra II Core A Algebra II Core B
Scale Score CSEM
Perf. Level
Scale Score CSEM
Perf. Level
Scale Score CSEM
Perf. Level
Scale Score CSEM
Perf. Level
0 490 60 1 490 61 1 440 69 1 440 68 1
1 490 60 1 490 61 1 440 69 1 440 68 1
2 490 60 1 490 61 1 440 69 1 440 68 1
3 490 60 1 490 61 1 440 69 1 440 68 1
4 490 60 1 490 61 1 440 69 1 440 68 1
5 490 60 1 490 61 1 440 69 1 440 68 1
6 490 60 1 490 61 1 440 69 1 440 68 1
7 490 60 1 490 61 1 440 69 1 440 68 1
8 490 60 1 490 61 1 440 69 1 440 68 1
9 490 60 1 490 61 1 440 69 1 440 68 1
10 490 60 1 490 61 1 440 69 1 440 68 1
11 490 60 1 490 61 1 440 69 1 440 68 1
12 565 63 1 560 64 1 440 69 1 440 68 1
13 597 64 1 597 65 1 459 70 1 516 74 1
14 617 61 1 617 62 1 525 75 1 555 77 1
15 630 56 1 631 57 1 562 77 1 581 75 1
16 641 49 1 642 50 1 587 75 1 601 71 1
17 650 42 1 651 43 1 607 70 1 617 65 1
18 662 36 2 662 36 2 623 64 1 631 58 1
19 664 30 2 665 31 2 636 57 1 643 51 1
20 670 26 2 671 26 2 654 50 2 654 44 2
21 676 22 2 677 23 2 657 44 2 662 39 2
22 681 20 2 682 20 2 666 38 2 671 34 2
23 686 18 2 687 18 2 674 34 2 679 31 2
24 691 17 2 691 17 2 682 30 2 686 28 2
25 695 16 2 696 16 2 689 28 2 693 26 2
26 700 15 3 700 15 3 700 26 3 700 24 3
27 703 15 3 704 14 3 702 24 3 705 23 3
28 707 14 3 708 14 3 708 23 3 711 22 3 Note: CSEM = Conditional Standard Error of Measure; Perf. Level = Performance Level; 1 = Unsatisfactory, 2 = Limited Knowledge, 3 = Proficient, 4 = Advanced

Oklahoma ACE EOI 2012 Technical Report
Pearson, Inc. and SDE Confidential
44
Table 4.5. Raw Score to Scale Score Conversion Tables for Spring 2012 (cont.)
Raw Score
Algebra I Core A Algebra I Core B Algebra II Core A Algebra II Core B
Scale Score CSEM
Perf. Level
Scale Score CSEM
Perf. Level
Scale Score CSEM
Perf. Level
Scale Score CSEM
Perf. Level
29 711 14 3 711 13 3 714 22 3 717 21 3
30 715 13 3 715 13 3 720 21 3 722 20 3
31 719 13 3 719 13 3 726 20 3 728 19 3
32 723 13 3 722 13 3 731 20 3 733 19 3
33 726 13 3 726 12 3 737 20 3 738 18 3
34 730 12 3 729 12 3 742 19 3 743 18 3
35 734 12 3 733 12 3 747 19 3 748 18 3
36 737 12 3 737 12 3 753 19 3 753 18 3
37 741 12 3 740 12 3 758 19 3 758 18 3
38 745 12 3 744 12 3 764 19 3 763 18 3
39 748 12 3 747 12 3 769 19 3 769 18 3
40 752 12 3 751 12 3 775 19 3 774 18 3
41 756 12 3 755 12 3 783 19 4 783 18 4
42 762 12 4 762 12 4 787 20 4 785 18 4
43 764 12 4 763 13 4 793 20 4 791 19 4
44 768 13 4 767 13 4 800 21 4 798 20 4
45 772 13 4 771 13 4 807 22 4 804 20 4
46 777 14 4 776 14 4 814 23 4 812 21 4
47 782 15 4 781 15 4 823 24 4 819 23 4
48 788 16 4 787 17 4 832 27 4 828 25 4
49 794 19 4 793 19 4 842 30 4 838 27 4
50 801 23 4 801 24 4 855 33 4 849 31 4
51 810 30 4 810 30 4 870 38 4 863 35 4
52 821 41 4 821 42 4 889 42 4 880 40 4
53 837 57 4 838 57 4 917 44 4 904 44 4
54 865 72 4 868 71 4 967 37 4 948 41 4
55 999 35 4 999 35 4 999 30 4 999 32 4 Note: CSEM = Conditional Standard Error of Measure; Perf. Level = Performance Level; 1 = Unsatisfactory, 2 = Limited Knowledge, 3 = Proficient, 4 = Advanced

Oklahoma ACE EOI 2012 Technical Report
Pearson, Inc. and SDE Confidential
45
Table 4.5. Raw Score to Scale Score Conversion Tables for Spring 2012 (cont.)
Raw Score
Biology I Core A Biology I Core B
Scale Score CSEM
Perf. Level
Scale Score CSEM
Perf. Level
0 440 52 1 440 54 1
1 440 52 1 440 54 1
2 440 52 1 440 54 1
3 440 52 1 440 54 1
4 440 52 1 440 54 1
5 440 52 1 440 54 1
6 440 52 1 440 54 1
7 440 52 1 440 54 1
8 440 52 1 440 54 1
9 440 52 1 440 54 1
10 440 52 1 440 54 1
11 440 52 1 440 54 1
12 440 52 1 440 54 1
13 440 52 1 440 54 1
14 440 52 1 472 58 1
15 481 57 1 510 63 1
16 513 61 1 538 65 1
17 537 63 1 560 64 1
18 557 62 1 578 61 1
19 574 59 1 593 57 1
20 589 56 1 607 53 1
21 602 51 1 619 48 1
22 614 47 1 634 44 2
23 634 43 2 640 40 2
24 635 40 2 650 36 2
25 644 37 2 658 34 2
26 653 34 2 667 31 2
27 662 32 2 675 30 2
28 670 31 2 682 28 2 Note: CSEM = Conditional Standard Error of Measure; Perf. Level = Performance Level; 1 = Unsatisfactory, 2 = Limited Knowledge, 3 = Proficient, 4 = Advanced

Oklahoma ACE EOI 2012 Technical Report
Pearson, Inc. and SDE Confidential
46
Table 4.5. Raw Score to Scale Score Conversion Tables for Spring 2012 (cont.)
Raw Score
Biology I Core A Biology I Core B
Scale Score CSEM
Perf. Level
Scale Score CSEM
Perf. Level
29 678 29 2 690 27 2
30 685 28 2 700 26 3
31 693 27 2 704 25 3
32 700 26 3 710 24 3
33 707 25 3 717 23 3
34 714 25 3 724 23 3
35 720 24 3 730 22 3
36 727 23 3 736 22 3
37 734 23 3 742 21 3
38 740 23 3 748 21 3
39 747 22 3 754 21 3
40 753 22 3 760 20 3
41 760 22 3 766 20 3
42 767 22 3 773 20 3
43 773 21 3 779 20 3
44 780 21 3 785 20 3
45 787 21 3 794 20 4
46 794 21 4 797 20 4
47 800 22 4 804 20 4
48 807 22 4 810 21 4
49 815 23 4 817 21 4
50 823 23 4 825 22 4
51 831 25 4 833 23 4
52 840 26 4 841 25 4
53 849 29 4 850 27 4
54 861 33 4 861 31 4
55 874 37 4 873 35 4
56 891 41 4 889 40 4 Note: CSEM = Conditional Standard Error of Measure; Perf. Level = Performance Level; 1 = Unsatisfactory, 2 = Limited Knowledge, 3 = Proficient, 4 = Advanced
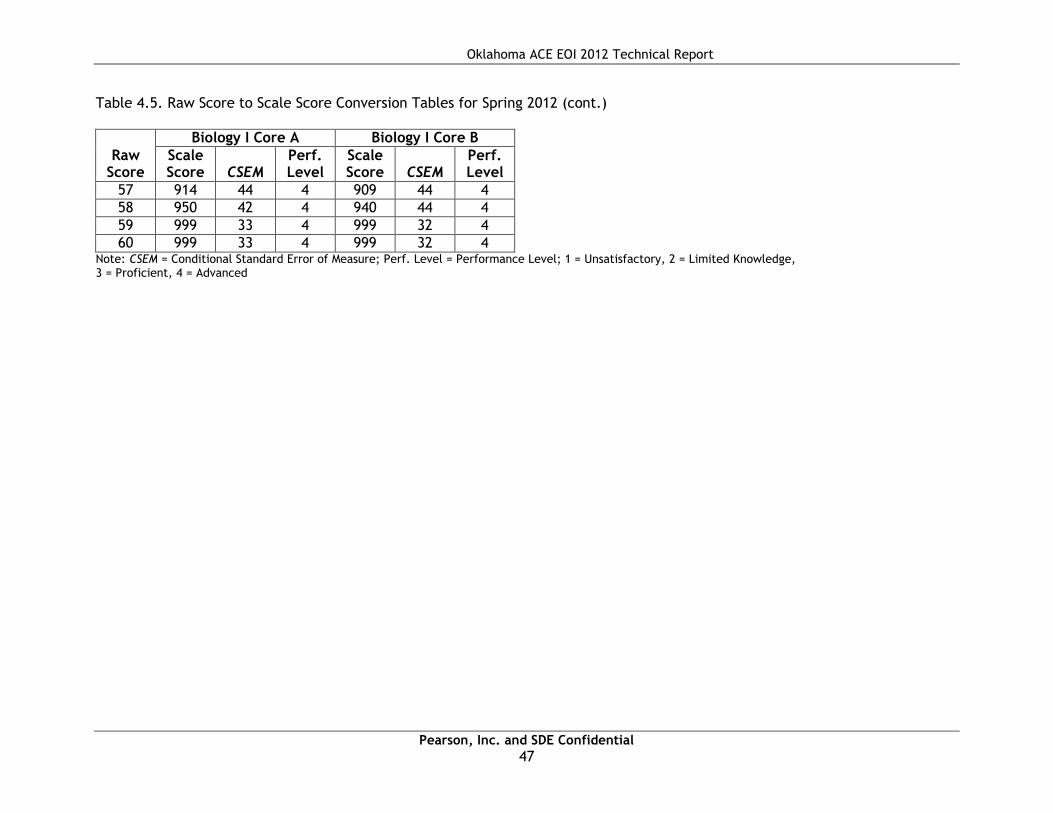
Oklahoma ACE EOI 2012 Technical Report
Pearson, Inc. and SDE Confidential
47
Table 4.5. Raw Score to Scale Score Conversion Tables for Spring 2012 (cont.)
Raw Score
Biology I Core A Biology I Core B
Scale Score CSEM
Perf. Level
Scale Score CSEM
Perf. Level
57 914 44 4 909 44 4
58 950 42 4 940 44 4
59 999 33 4 999 32 4
60 999 33 4 999 32 4 Note: CSEM = Conditional Standard Error of Measure; Perf. Level = Performance Level; 1 = Unsatisfactory, 2 = Limited Knowledge, 3 = Proficient, 4 = Advanced

Oklahoma ACE EOI 2012 Technical Report
Pearson, Inc. and SDE Confidential
48
Table 4.5. Raw Score to Scale Score Conversion Tables for Spring 2012 (cont.)
Raw Score
English II Core A Prompt A
English II Core A Prompt B
English II Core B Prompt A
English II Core B Prompt B
Scale Score CSEM
Perf. Level
Scale Score CSEM
Perf. Level
Scale Score CSEM
Perf. Level
Scale Score CSEM
Perf. Level
0 440 42 1 440 40 1 440 40 1 440 38 1
1 440 42 1 440 40 1 440 40 1 440 38 1
2 440 42 1 440 40 1 440 40 1 440 38 1
3 440 42 1 440 40 1 440 40 1 440 38 1
4 440 42 1 440 40 1 440 40 1 440 38 1
5 440 42 1 440 40 1 440 40 1 440 38 1
6 440 42 1 440 40 1 440 40 1 440 38 1
7 440 42 1 440 40 1 440 40 1 440 38 1
8 440 42 1 440 40 1 440 40 1 440 38 1
9 440 42 1 440 40 1 440 40 1 440 38 1
10 440 42 1 440 40 1 440 40 1 440 38 1
11 440 42 1 440 40 1 440 40 1 440 38 1
12 440 42 1 440 40 1 440 40 1 440 38 1
13 440 42 1 440 40 1 440 40 1 440 38 1
14 440 42 1 440 40 1 440 40 1 440 38 1
15 440 42 1 440 40 1 440 40 1 440 38 1
16 444 43 1 451 42 1 442 40 1 449 40 1
17 477 48 1 480 47 1 472 45 1 476 45 1
18 502 51 1 503 50 1 496 49 1 498 48 1
19 522 52 1 522 51 1 515 50 1 516 49 1
20 538 52 1 538 51 1 532 50 1 532 49 1
21 553 50 1 552 49 1 547 49 1 546 48 1
22 566 47 1 565 46 1 560 47 1 559 46 1
23 577 44 1 576 44 1 571 44 1 570 43 1
24 588 41 1 586 41 1 582 41 1 581 41 1
25 597 38 1 596 38 1 592 39 1 591 38 1 Note: CSEM = Conditional Standard Error of Measure; Perf. Level = Performance Level; 1 = Unsatisfactory, 2 = Limited Knowledge, 3 = Proficient, 4 = Advanced

Oklahoma ACE EOI 2012 Technical Report
Pearson, Inc. and SDE Confidential
49
Table 4.5. Raw Score to Scale Score Conversion Tables for Spring 2012 (cont.)
Raw Score
English II Core A Prompt A
English II Core A Prompt B
English II Core B Prompt A
English II Core B Prompt B
Scale Score CSEM
Perf. Level
Scale Score CSEM
Perf. Level
Scale Score CSEM
Perf. Level
Scale Score CSEM
Perf. Level
26 609 36 2 609 35 2 609 36 2 600 36 1
27 615 34 2 614 33 2 610 34 2 609 34 2
28 623 32 2 622 32 2 618 32 2 617 32 2
29 631 30 2 629 30 2 626 31 2 625 31 2
30 638 29 2 637 29 2 634 30 2 633 30 2
31 646 28 2 644 28 2 642 29 2 640 29 2
32 653 27 2 651 27 2 649 28 2 647 28 2
33 659 26 2 658 26 2 656 27 2 655 27 2
34 666 25 2 665 26 2 663 26 2 662 26 2
35 673 25 2 672 25 2 670 26 2 669 26 2
36 679 24 2 678 24 2 677 26 2 675 26 2
37 686 24 2 685 24 2 684 25 2 682 25 2
38 692 24 2 691 24 2 690 25 2 689 25 2
39 700 23 3 700 23 3 700 25 3 700 25 3
40 705 23 3 704 23 3 704 24 3 703 25 3
41 711 23 3 710 23 3 711 24 3 709 24 3
42 717 23 3 716 23 3 717 24 3 716 24 3
43 724 22 3 723 22 3 724 24 3 723 24 3
44 730 22 3 729 22 3 731 24 3 730 24 3
45 736 22 3 735 22 3 738 24 3 737 24 3
46 743 22 3 742 22 3 745 24 3 744 24 3
47 749 22 3 748 22 3 752 24 3 751 24 3
48 756 22 3 755 22 3 759 25 3 758 25 3
49 763 23 3 762 23 3 767 25 3 766 25 3
50 770 23 3 768 23 3 775 25 3 773 25 3
51 777 23 3 776 23 3 782 26 3 781 26 3
52 784 24 3 783 24 3 791 26 3 789 26 3
53 792 24 3 791 24 3 799 27 3 798 27 3 Note: CSEM = Conditional Standard Error of Measure; Perf. Level = Performance Level; 1 = Unsatisfactory, 2 = Limited Knowledge, 3 = Proficient, 4 = Advanced

Oklahoma ACE EOI 2012 Technical Report
Pearson, Inc. and SDE Confidential
50
Table 4.5. Raw Score to Scale Score Conversion Tables for Spring 2012 (cont.)
Raw Score
English II Core A Prompt A
English II Core A Prompt B
English II Core B Prompt A
English II Core B Prompt B
Scale Score CSEM
Perf. Level
Scale Score CSEM
Perf. Level
Scale Score CSEM
Perf. Level
Scale Score CSEM
Perf. Level
54 800 25 3 799 25 3 817 28 4 807 28 3
55 817 26 4 808 26 3 818 29 4 817 29 4
56 818 27 4 817 27 4 828 31 4 826 31 4
57 828 29 4 827 29 4 839 33 4 837 33 4
58 839 31 4 838 31 4 851 35 4 850 36 4
59 851 33 4 850 33 4 865 38 4 863 39 4
60 865 36 4 864 36 4 880 42 4 879 42 4
61 881 39 4 879 39 4 899 45 4 898 45 4
62 899 42 4 898 42 4 922 46 4 921 46 4
63 923 43 4 923 43 4 954 42 4 953 43 4
64 958 39 4 958 39 4 999 32 4 999 33 4
65 999 30 4 999 30 4 999 32 4 999 33 4
66 999 30 4 999 30 4 999 32 4 999 33 4 Note: CSEM = Conditional Standard Error of Measure; Perf. Level = Performance Level; 1 = Unsatisfactory, 2 = Limited Knowledge, 3 = Proficient, 4 = Advanced

Oklahoma ACE EOI 2012 Technical Report
Pearson, Inc. and SDE Confidential
51
Table 4.5. Raw Score to Scale Score Conversion Tables for Spring 2012 (cont.)
Raw Score
English III Core A Prompt A
English III Core A Prompt B
English III Core B Prompt A
English III Core B Prompt B
Scale Score CSEM
Perf. Level
Scale Score CSEM
Perf. Level
Scale Score CSEM
Perf. Level
Scale Score CSEM
Perf. Level
0 440 54 1 440 52 1 440 59 1 440 57 1
1 440 54 1 440 52 1 440 59 1 440 57 1
2 440 54 1 440 52 1 440 59 1 440 57 1
3 440 54 1 440 52 1 440 59 1 440 57 1
4 440 54 1 440 52 1 440 59 1 440 57 1
5 440 54 1 440 52 1 440 59 1 440 57 1
6 440 54 1 440 52 1 440 59 1 440 57 1
7 440 54 1 440 52 1 440 59 1 440 57 1
8 440 54 1 440 52 1 440 59 1 440 57 1
9 440 54 1 440 52 1 440 59 1 440 57 1
10 440 54 1 440 52 1 440 59 1 440 57 1
11 440 54 1 440 52 1 440 59 1 440 57 1
12 440 54 1 440 52 1 440 59 1 440 57 1
13 440 54 1 440 52 1 442 59 1 442 57 1
14 496 59 1 494 58 1 511 64 1 508 62 1
15 528 62 1 525 60 1 542 66 1 538 65 1
16 551 62 1 546 61 1 563 66 1 558 64 1
17 568 60 1 563 59 1 578 63 1 573 61 1
18 581 57 1 576 56 1 591 58 1 586 57 1
19 593 52 1 588 52 1 602 53 1 597 52 1
20 603 47 1 599 47 1 611 47 1 607 47 1
21 612 43 1 608 43 1 620 42 1 616 42 1
22 621 38 1 617 38 1 628 37 1 624 37 1
23 628 35 1 625 35 1 635 33 1 632 34 1
24 635 32 1 633 32 1 642 30 1 639 31 1
25 642 29 1 640 30 1 648 28 1 646 28 1 Note: CSEM = Conditional Standard Error of Measure; Perf. Level = Performance Level; 1 = Unsatisfactory, 2 = Limited Knowledge, 3 = Proficient, 4 = Advanced

Oklahoma ACE EOI 2012 Technical Report
Pearson, Inc. and SDE Confidential
52
Table 4.5. Raw Score to Scale Score Conversion Tables for Spring 201 (cont.)
Raw Score
English III Core A Prompt A
English III Core A Prompt B
English III Core B Prompt A
English III Core B Prompt B
Scale Score CSEM
Perf. Level
Scale Score CSEM
Perf. Level
Scale Score CSEM
Perf. Level
Scale Score CSEM
Perf. Level
26 649 27 1 646 28 1 654 26 1 652 27 1
27 655 26 1 653 26 1 660 25 1 658 25 1
28 661 24 1 659 25 1 670 23 2 664 24 1
29 670 23 2 664 24 1 671 23 2 670 23 2
30 672 22 2 670 23 2 677 22 2 675 22 2
31 677 22 2 676 22 2 682 21 2 680 21 2
32 682 21 2 681 21 2 687 20 2 686 21 2
33 687 21 2 686 21 2 692 20 2 691 20 2
34 692 20 2 691 20 2 700 19 3 696 20 2
35 700 20 3 700 20 3 702 19 3 700 19 3
36 702 20 3 701 20 3 706 19 3 705 19 3
37 707 20 3 706 20 3 711 18 3 710 19 3
38 712 19 3 711 19 3 716 18 3 715 18 3
39 717 19 3 716 19 3 720 18 3 720 18 3
40 722 19 3 721 19 3 725 18 3 724 18 3
41 727 19 3 726 19 3 730 17 3 729 18 3
42 732 19 3 731 19 3 734 17 3 734 17 3
43 737 19 3 736 19 3 739 17 3 738 17 3
44 741 19 3 741 19 3 743 17 3 743 17 3
45 746 18 3 746 19 3 748 17 3 748 17 3
46 752 18 3 752 19 3 752 17 3 752 17 3
47 757 18 3 757 19 3 757 17 3 757 17 3
48 762 18 3 762 19 3 762 17 3 762 17 3
49 767 18 3 767 19 3 766 17 3 767 17 3
50 772 19 3 773 19 3 771 17 3 772 17 3
51 778 19 3 778 19 3 776 17 3 776 17 3
52 783 19 3 784 19 3 781 17 3 781 17 3
53 789 19 3 790 19 3 786 17 3 787 17 3 Note: CSEM = Conditional Standard Error of Measure; Perf. Level = Performance Level; 1 = Unsatisfactory, 2 = Limited Knowledge, 3 = Proficient, 4 = Advanced

Oklahoma ACE EOI 2012 Technical Report
Pearson, Inc. and SDE Confidential
53
Table 4.5. Raw Score to Scale Score Conversion Tables for Spring 201 (cont.)
Raw Score
English III Core A Prompt A
English III Core A Prompt B
English III Core B Prompt A
English III Core B Prompt B
Scale Score CSEM
Perf. Level
Scale Score CSEM
Perf. Level
Scale Score CSEM
Perf. Level
Scale Score CSEM
Perf. Level
54 794 19 3 796 19 3 791 17 3 792 17 3
55 802 19 4 802 19 4 796 17 3 802 17 4
56 806 20 4 808 20 4 802 17 4 803 18 4
57 812 20 4 814 20 4 807 18 4 808 18 4
58 819 20 4 821 21 4 812 18 4 814 18 4
59 825 21 4 828 21 4 818 19 4 821 19 4
60 832 22 4 835 22 4 825 19 4 827 19 4
61 839 23 4 843 23 4 831 20 4 834 20 4
62 847 24 4 851 24 4 838 21 4 841 21 4
63 855 25 4 859 26 4 845 22 4 849 22 4
64 864 27 4 868 28 4 853 24 4 857 24 4
65 874 30 4 879 30 4 861 26 4 866 27 4
66 885 33 4 890 33 4 871 29 4 876 29 4
67 898 36 4 904 36 4 882 33 4 888 33 4
68 915 38 4 920 38 4 896 36 4 901 37 4
69 937 38 4 941 37 4 913 39 4 919 39 4
70 971 33 4 974 31 4 938 39 4 943 38 4
71 999 27 4 999 26 4 984 30 4 987 28 4
72 999 27 4 999 26 4 999 26 4 999 25 4 Note: CSEM = Conditional Standard Error of Measure; Perf. Level = Performance Level; 1 = Unsatisfactory, 2 = Limited Knowledge, 3 = Proficient, 4 = Advanced

Oklahoma ACE EOI 2012 Technical Report
Pearson, Inc. and SDE Confidential
54
Table 4.5. Raw Score to Scale Score Conversion Tables for Spring 201 (cont.)
Raw Score
Geometry Core A Geometry Core B U.S. History Core A U.S. History Core B
Scale Score CSEM
Perf. Level
Scale Score CSEM
Perf. Level
Scale Score CSEM
Perf. Level
Scale Score CSEM
Perf. Level
0 440 57 1 440 56 1 440 58 1 440 59 1
1 440 57 1 440 56 1 440 58 1 440 59 1
2 440 57 1 440 56 1 440 58 1 440 59 1
3 440 57 1 440 56 1 440 58 1 440 59 1
4 440 57 1 440 56 1 440 58 1 440 59 1
5 440 57 1 440 56 1 440 58 1 440 59 1
6 440 57 1 440 56 1 440 58 1 440 59 1
7 440 57 1 440 56 1 440 58 1 440 59 1
8 440 57 1 440 56 1 440 58 1 440 59 1
9 440 57 1 440 56 1 440 58 1 440 59 1
10 440 57 1 440 56 1 440 58 1 440 59 1
11 487 61 1 475 59 1 440 58 1 440 59 1
12 528 64 1 521 64 1 440 58 1 440 59 1
13 555 64 1 550 64 1 440 58 1 440 59 1
14 574 61 1 571 62 1 475 61 1 473 61 1
15 590 56 1 587 58 1 518 65 1 519 66 1
16 603 51 1 601 53 1 547 66 1 548 67 1
17 615 45 1 613 47 1 568 64 1 569 65 1
18 625 40 1 624 42 1 584 61 1 586 62 1
19 635 35 2 635 37 2 598 56 1 600 57 1
20 642 32 2 642 33 2 610 51 1 612 51 1
21 650 29 2 650 30 2 627 46 2 627 46 2
22 658 27 2 658 28 2 630 41 2 632 41 2
23 664 25 2 665 26 2 639 37 2 641 36 2
24 671 24 2 672 24 2 647 33 2 649 33 2
25 677 22 2 678 23 2 654 31 2 656 30 2
26 684 21 2 684 22 2 661 29 2 663 28 2
27 689 21 2 690 21 2 668 27 2 670 26 2
28 700 20 3 700 20 3 675 25 2 676 25 2 Note: CSEM = Conditional Standard Error of Measure; Perf. Level = Performance Level; 1 = Unsatisfactory, 2 = Limited Knowledge, 3 = Proficient, 4 = Advanced

Oklahoma ACE EOI 2012 Technical Report
Pearson, Inc. and SDE Confidential
55
Table 4.5. Raw Score to Scale Score Conversion Tables for Spring 2012 (cont.)
Raw Score
Geometry Core A Geometry Core B U.S. History Core A U.S. History Core B
Scale Score CSEM
Perf. Level
Scale Score CSEM
Perf. Level
Scale Score CSEM
Perf. Level
Scale Score CSEM
Perf. Level
29 701 19 3 701 19 3 681 24 2 682 23 2
30 706 18 3 707 19 3 687 24 2 688 23 2
31 711 18 3 712 18 3 693 23 2 694 22 2
32 716 18 3 717 18 3 700 22 3 700 21 3
33 721 17 3 722 18 3 705 22 3 705 21 3
34 726 17 3 727 17 3 711 21 3 711 20 3
35 731 17 3 732 17 3 716 21 3 716 20 3
36 736 17 3 737 17 3 722 21 3 722 20 3
37 741 17 3 743 17 3 728 21 3 727 20 3
38 746 17 3 748 17 3 733 21 3 733 20 3
39 751 16 3 753 17 3 739 20 3 738 20 3
40 757 16 3 758 17 3 745 20 3 744 20 3
41 762 17 3 763 17 3 751 20 3 750 20 3
42 767 17 3 769 17 3 757 20 3 755 20 3
43 777 17 4 777 18 4 763 21 3 761 20 3
44 778 17 4 781 18 4 773 21 4 773 20 4
45 784 18 4 787 19 4 775 21 4 774 20 4
46 791 19 4 794 20 4 782 21 4 780 20 4
47 798 20 4 801 21 4 789 22 4 787 21 4
48 805 22 4 809 23 4 796 22 4 794 21 4
49 814 25 4 818 26 4 804 23 4 801 22 4
50 824 29 4 829 30 4 812 24 4 808 23 4
51 836 34 4 842 36 4 820 26 4 816 24 4
52 852 42 4 859 43 4 830 27 4 825 26 4
53 875 50 4 884 49 4 840 30 4 835 29 4
54 918 53 4 931 49 4 852 33 4 846 33 4
55 999 41 4 999 39 4 866 38 4 859 38 4
56 - - - - - - 883 43 4 876 44 4 Note: CSEM = Conditional Standard Error of Measure; Perf. Level = Performance Level; 1 = Unsatisfactory, 2 = Limited Knowledge, 3 = Proficient, 4 = Advanced
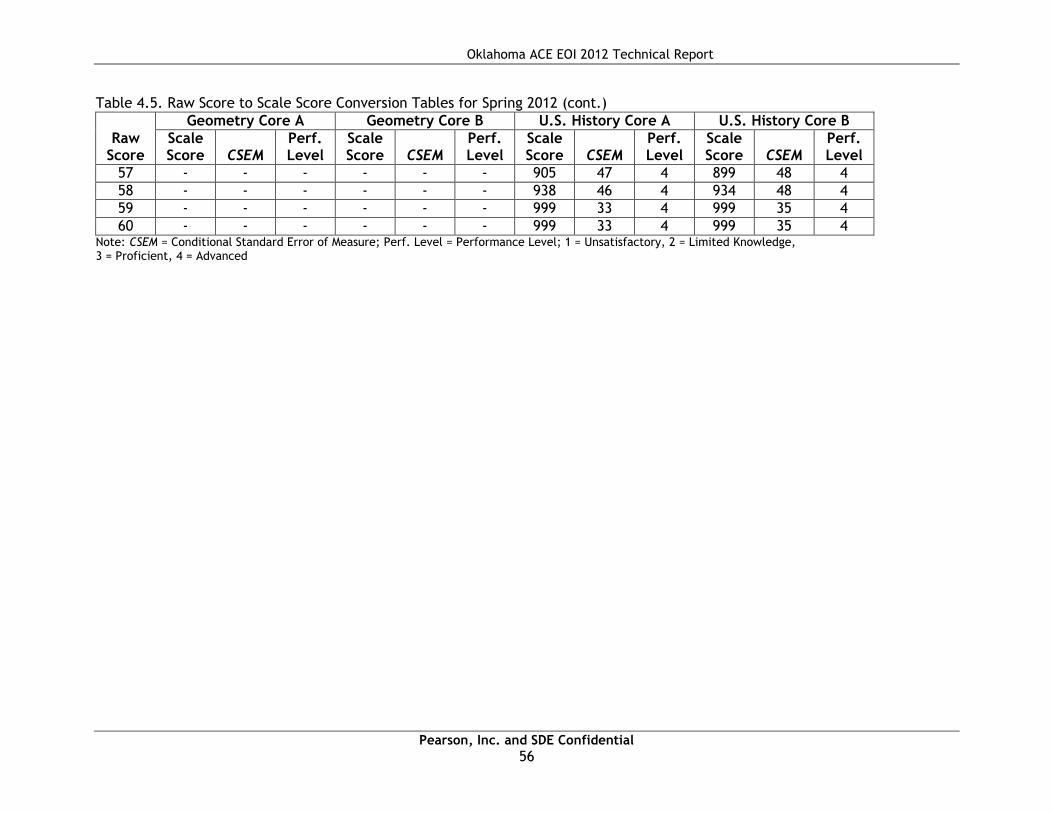
Oklahoma ACE EOI 2012 Technical Report
Pearson, Inc. and SDE Confidential
56
Table 4.5. Raw Score to Scale Score Conversion Tables for Spring 2012 (cont.)
Raw Score
Geometry Core A Geometry Core B U.S. History Core A U.S. History Core B
Scale Score CSEM
Perf. Level
Scale Score CSEM
Perf. Level
Scale Score CSEM
Perf. Level
Scale Score CSEM
Perf. Level
57 - - - - - - 905 47 4 899 48 4
58 - - - - - - 938 46 4 934 48 4
59 - - - - - - 999 33 4 999 35 4
60 - - - - - - 999 33 4 999 35 4 Note: CSEM = Conditional Standard Error of Measure; Perf. Level = Performance Level; 1 = Unsatisfactory, 2 = Limited Knowledge, 3 = Proficient, 4 = Advanced

Oklahoma ACE EOI 2012 Technical Report
Pearson, Inc. and SDE Confidential
57
Section 5
Classification Consistency and Accuracy Studies
5.1 Classification Consistency and Accuracy
Every test administration will result in some error in classifying examinees. The concept of the standard error of measurement (SEM) has implications for the interpretation of cut scores used to classify students into different performance levels. For example, a given student may have a true performance level greater than a cut score; however, due to random variations (measurement error), the student’s observed test score may be below the cut score. As a result, the student may be classified as having a lower performance level. As discussed in Section 6.4, a student’s observed score is most likely to fall within a standard error band around his or her true score. Thus, the classification of students into different performance levels can be imperfect; especially for the borderline students whose true scores lie close to the performance level cut scores. According to Livingston and Lewis (1995, p. 180), the accuracy of a classification is “the extent to which the actual classifications of the test takers… agree with those that would be made on the basis of their true score” and are calculated from cross-tabulations between “classifications based on an observable variable and classifications based on an unobservable variable.” Since the unobservable variable—the true score—is not available, Livingston and Lewis provide a method to estimate the true score distribution of a test and create the cross-tabulation of the true score and observed variable (raw score) classifications. Consistency is “the agreement between classifications based on two non-overlapping, equally-difficult forms of the test” (p. 180). Consistency is estimated using actual response data from a test and the test’s reliability to statistically model two parallel forms of the test and compare the classifications on those alternate forms. There are three types of accuracy and consistency indices that can be generated using Livingston and Lewis’ approach: overall, conditional on level, and by cut score. The overall accuracy of performance level classifications is computed as a sum of the proportions on the diagonal of the joint distribution of true score- and observed score levels. Essentially, overall accuracy is the proportion of correct classifications across all levels. The overall consistency index is computed as the sum of the diagonal cells in a consistency table. Another way to express overall consistency is to use the Kappa coefficient, as used in the inter-rater reliability studies in Section 3.7. Like the inter-rater reliability studies, Kappa provides an estimate of agreement or the proportion of consistent classifications between two different tests after taking into account chance. Consistency conditional on performance level is computed as the ratio between the proportion of correct classifications at the selected performance level (for example, proficient students who were classified as proficient) and the proportion of all the students classified into that level (total proportion of students who were considered proficient). Accuracy conditional on performance level is computed in a similar manner except that in the consistency table where both row and column marginal sums are the same, the accuracy table uses the sum based on estimated status as the total for computing accuracy conditional on performance level.
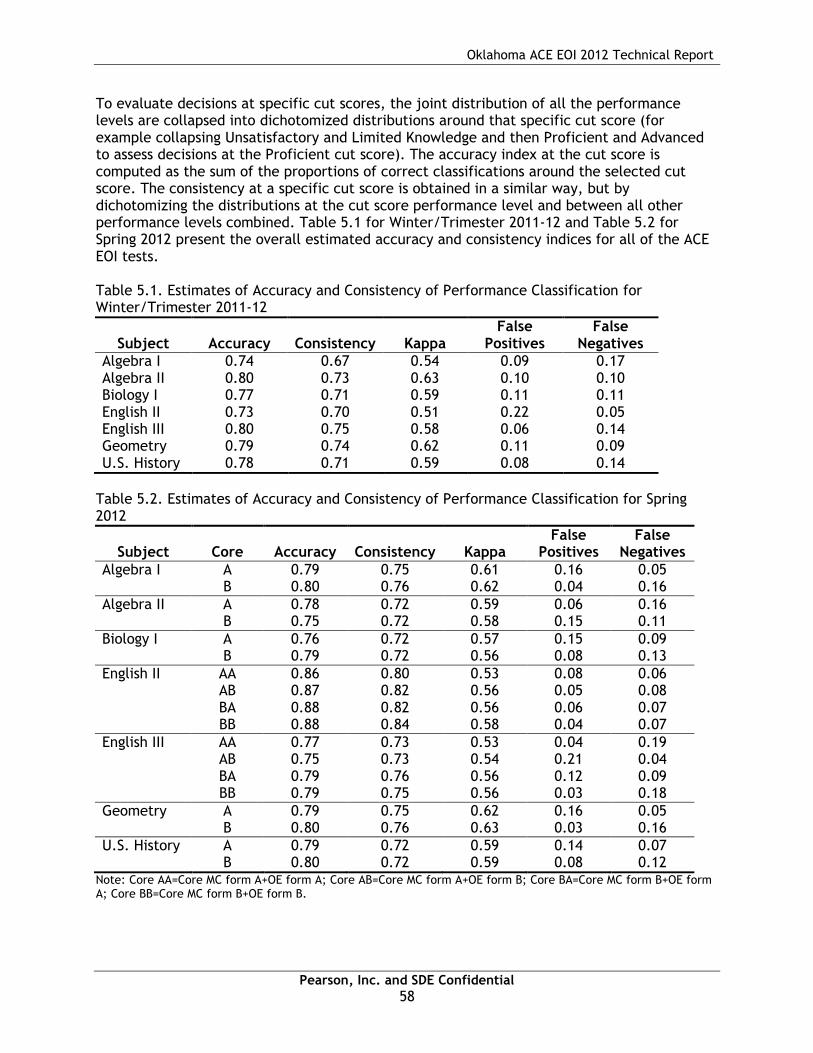
Oklahoma ACE EOI 2012 Technical Report
Pearson, Inc. and SDE Confidential
58
To evaluate decisions at specific cut scores, the joint distribution of all the performance levels are collapsed into dichotomized distributions around that specific cut score (for example collapsing Unsatisfactory and Limited Knowledge and then Proficient and Advanced to assess decisions at the Proficient cut score). The accuracy index at the cut score is computed as the sum of the proportions of correct classifications around the selected cut score. The consistency at a specific cut score is obtained in a similar way, but by dichotomizing the distributions at the cut score performance level and between all other performance levels combined. Table 5.1 for Winter/Trimester 2011-12 and Table 5.2 for Spring 2012 present the overall estimated accuracy and consistency indices for all of the ACE EOI tests. Table 5.1. Estimates of Accuracy and Consistency of Performance Classification for Winter/Trimester 2011-12
Subject Accuracy Consistency Kappa False
Positives False
Negatives
Algebra I 0.74 0.67 0.54 0.09 0.17 Algebra II 0.80 0.73 0.63 0.10 0.10 Biology I 0.77 0.71 0.59 0.11 0.11 English II 0.73 0.70 0.51 0.22 0.05 English III 0.80 0.75 0.58 0.06 0.14 Geometry 0.79 0.74 0.62 0.11 0.09 U.S. History 0.78 0.71 0.59 0.08 0.14
Table 5.2. Estimates of Accuracy and Consistency of Performance Classification for Spring 2012
Subject Core Accuracy Consistency Kappa False
Positives False
Negatives
Algebra I A 0.79 0.75 0.61 0.16 0.05 B 0.80 0.76 0.62 0.04 0.16
Algebra II A 0.78 0.72 0.59 0.06 0.16 B 0.75 0.72 0.58 0.15 0.11
Biology I A 0.76 0.72 0.57 0.15 0.09 B 0.79 0.72 0.56 0.08 0.13
English II AA 0.86 0.80 0.53 0.08 0.06 AB 0.87 0.82 0.56 0.05 0.08 BA 0.88 0.82 0.56 0.06 0.07 BB 0.88 0.84 0.58 0.04 0.07
English III AA 0.77 0.73 0.53 0.04 0.19 AB 0.75 0.73 0.54 0.21 0.04 BA 0.79 0.76 0.56 0.12 0.09 BB 0.79 0.75 0.56 0.03 0.18
Geometry A 0.79 0.75 0.62 0.16 0.05 B 0.80 0.76 0.63 0.03 0.16
U.S. History A 0.79 0.72 0.59 0.14 0.07 B 0.80 0.72 0.59 0.08 0.12
Note: Core AA=Core MC form A+OE form A; Core AB=Core MC form A+OE form B; Core BA=Core MC form B+OE form A; Core BB=Core MC form B+OE form B.

Oklahoma ACE EOI 2012 Technical Report
Pearson, Inc. and SDE Confidential
59
As shown in Table 5.1 and Table 5.2, the overall accuracy indices range between 73 and 80 percent for Winter/Trimester 2011-12 and 75 and 88 percent for Spring 2012, and overall consistency ranged between 67 and 75 percent for Winter/Trimester 2011-12 and 72 and 84 percent for Spring 2012. Kappa coefficients range from 0.51 and 0.63 for Winter/Trimester 2011-12 and 0.53 and 0.63 for Spring 2012. The rate of estimated false positives range from 6 to 22 percent for Winter/Trimester 2011-12 and 3 to 21 percent for Spring 2012. The estimated false negative rates range from 5 to 17 percent for Winter/Trimester 2011-12 and 4 to 19 percent for Spring 2012. Table 5.3 and Table 5.4 provide the accuracy-, consistency-, false positive-, and false negative rates by cut score for Winter/Trimester 2011-12 and Spring 2012, respectively. The data in these tables reveal that the level of agreement for both accuracy and consistency is above 80 percent in all cases, with most above 90 percent. In general, the high rates of accuracy and consistency support the cut decisions made using these assessments. Similar to Table 5.1 and Table 5.2, the false positive and false negative rates were comparable for the Winter/Trimester 2011-12 and Spring 2012 administrations and are quite low. The importance of the dichotomous categorization is particularly notable when they map onto pass/fail decisions for the assessments. For the EOI tests, the U+L/P+A is the important dichotomization, because it directly translates to the pass/fail decision point. Similar to other dichotomization distinctions, there are three main scenarios at this cut point: 1) observed performance is accurately reflective of the true ability level (i.e., the examinee passed and should have passed); 2) the true ability level is below the standard, but the observed test score is above the standard (i.e., a false positive); and 3) the true ability level is above the standard, but the observed test score is below the standard (i.e., a false negative). For example, as shown in Table 5.3, 90 percent of Winter/Trimester 2011-12 Algebra I students are estimated to have been correctly classified as pass or fail based on their performance (scenario 1), an estimated 3 percent passed but their true performance is below the standard (scenario 2), and an estimated 7 percent failed although their true performance is above the standard (scenario 3). Overall, the estimated accuracy rates are above 80% for the Winter/Trimester and Spring administrations for all subjects.

Oklahoma ACE EOI 2012 Technical Report
Pearson, Inc. and SDE Confidential
60
Table 5.3. Accuracy and Consistency Estimates by Cut Score: False Positive- and False Negative Rates for Winter/Trimester 2011-12
Subject
Accuracy Consistency False Positives False Negatives
U /
L+P+A
U+L /
P+A
U+L+P / A
U /
L+P+A
U+L /
P+A
U+L+P / A
U /
L+P+A
U+L /
P+A
U+L+P / A
U /
L+P+A
U+L /
P+A
U+L+P / A
Algebra I 0.89 0.90 0.94 0.85 0.86 0.93 0.04 0.03 0.02 0.06 0.07 0.04 Algebra II 0.94 0.93 0.93 0.92 0.90 0.90 0.05 0.03 0.03 0.02 0.04 0.04 Biology I 0.94 0.91 0.92 0.92 0.88 0.91 0.03 0.06 0.02 0.03 0.03 0.06 English II 0.98 0.93 0.82 0.97 0.90 0.83 0.01 0.04 0.17 0.02 0.03 0.00 English III 0.95 0.93 0.92 0.94 0.91 0.88 0.01 0.01 0.04 0.04 0.06 0.04 Geometry 0.95 0.93 0.91 0.94 0.90 0.89 0.01 0.04 0.07 0.05 0.03 0.02 U.S. History 0.95 0.92 0.90 0.94 0.89 0.88 0.03 0.04 0.02 0.02 0.04 0.08
Note: U =Unsatisfactory; L = Limited Knowledge; P = Proficient; and A = Advanced. Note: U / L+P+A = Unsatisfactory divided by Limited Knowledge plus Proficient plus Advanced; U+L / P+A = Unsatisfactory plus Limited Knowledge divided by Proficient plus Advanced; U+L+P / A = Unsatisfactory plus Limited Knowledge plus Proficient divided by Advanced.
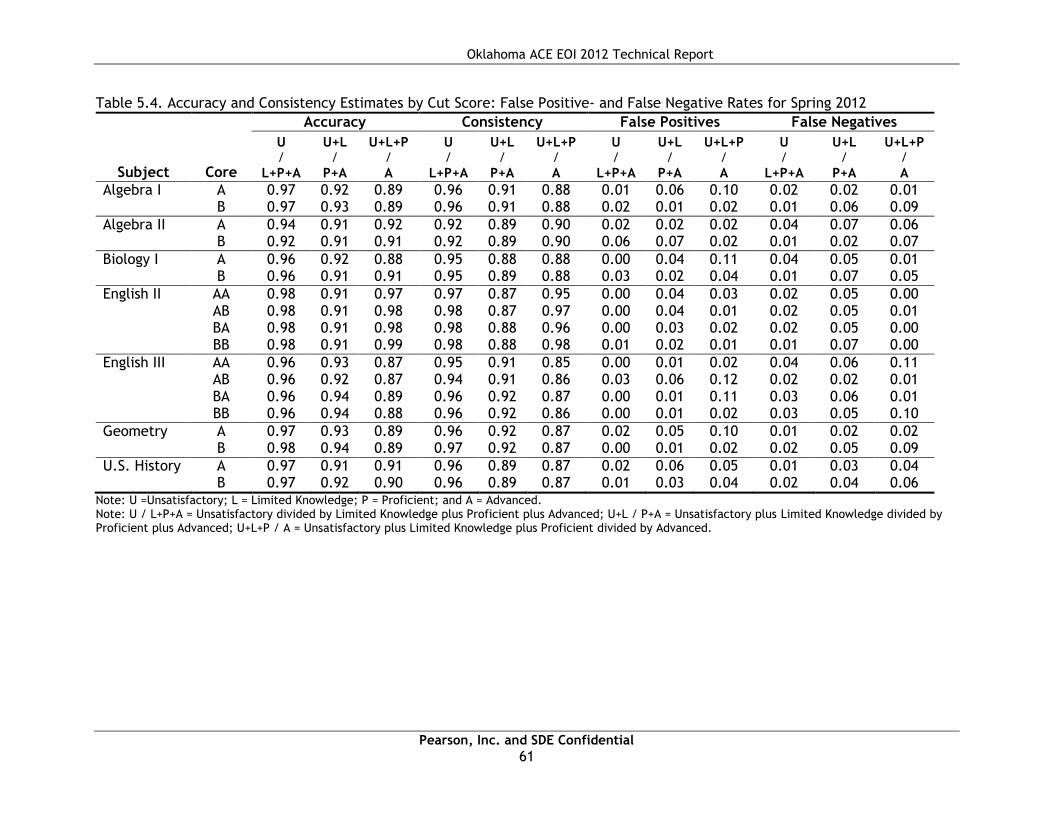
Oklahoma ACE EOI 2012 Technical Report
Pearson, Inc. and SDE Confidential
61
Table 5.4. Accuracy and Consistency Estimates by Cut Score: False Positive- and False Negative Rates for Spring 2012
Subject Core
Accuracy Consistency False Positives False Negatives
U /
L+P+A
U+L /
P+A
U+L+P / A
U /
L+P+A
U+L /
P+A
U+L+P / A
U /
L+P+A
U+L /
P+A
U+L+P / A
U /
L+P+A
U+L /
P+A
U+L+P / A
Algebra I A 0.97 0.92 0.89 0.96 0.91 0.88 0.01 0.06 0.10 0.02 0.02 0.01 B 0.97 0.93 0.89 0.96 0.91 0.88 0.02 0.01 0.02 0.01 0.06 0.09
Algebra II A 0.94 0.91 0.92 0.92 0.89 0.90 0.02 0.02 0.02 0.04 0.07 0.06 B 0.92 0.91 0.91 0.92 0.89 0.90 0.06 0.07 0.02 0.01 0.02 0.07
Biology I A 0.96 0.92 0.88 0.95 0.88 0.88 0.00 0.04 0.11 0.04 0.05 0.01 B 0.96 0.91 0.91 0.95 0.89 0.88 0.03 0.02 0.04 0.01 0.07 0.05
English II AA 0.98 0.91 0.97 0.97 0.87 0.95 0.00 0.04 0.03 0.02 0.05 0.00 AB 0.98 0.91 0.98 0.98 0.87 0.97 0.00 0.04 0.01 0.02 0.05 0.01 BA 0.98 0.91 0.98 0.98 0.88 0.96 0.00 0.03 0.02 0.02 0.05 0.00 BB 0.98 0.91 0.99 0.98 0.88 0.98 0.01 0.02 0.01 0.01 0.07 0.00
English III AA 0.96 0.93 0.87 0.95 0.91 0.85 0.00 0.01 0.02 0.04 0.06 0.11 AB 0.96 0.92 0.87 0.94 0.91 0.86 0.03 0.06 0.12 0.02 0.02 0.01 BA 0.96 0.94 0.89 0.96 0.92 0.87 0.00 0.01 0.11 0.03 0.06 0.01 BB 0.96 0.94 0.88 0.96 0.92 0.86 0.00 0.01 0.02 0.03 0.05 0.10
Geometry A 0.97 0.93 0.89 0.96 0.92 0.87 0.02 0.05 0.10 0.01 0.02 0.02 B 0.98 0.94 0.89 0.97 0.92 0.87 0.00 0.01 0.02 0.02 0.05 0.09
U.S. History A 0.97 0.91 0.91 0.96 0.89 0.87 0.02 0.06 0.05 0.01 0.03 0.04 B 0.97 0.92 0.90 0.96 0.89 0.87 0.01 0.03 0.04 0.02 0.04 0.06
Note: U =Unsatisfactory; L = Limited Knowledge; P = Proficient; and A = Advanced. Note: U / L+P+A = Unsatisfactory divided by Limited Knowledge plus Proficient plus Advanced; U+L / P+A = Unsatisfactory plus Limited Knowledge divided by Proficient plus Advanced; U+L+P / A = Unsatisfactory plus Limited Knowledge plus Proficient divided by Advanced.

Oklahoma ACE EOI 2012 Technical Report
Pearson, Inc. and SDE Confidential
62
Section 6
Summary Statistics
6.1 Descriptive Statistics
The summary descriptive statistics of the scale scores for Winter/Trimester 2011-12 and Spring 2012 appear in Table 6.1 through Table 6.8. The scales scores presented exclude invalid student cases and second-time testers. Table 6.1. Descriptive Statistics of the Scale Scores for Winter/Trimester 2011-12 - Overall
Subject
Total
N Mean SD Med.
Algebra I 1,249 702.3 60.8 702 Algebra II 1,425 722.0 97.9 738 Biology I 1,502 715.0 84.2 721 English II 1,543 744.2 83.1 751 English III 1,794 746.7 72.6 754 Geometry 1,757 734.3 81.0 743 U.S. History 1,531 718.0 80.8 726
Note: N = Sample size; SD = Standard Deviation; Med. = Median.
Table 6.2. Descriptive Statistics of the Scale Scores for Winter/Trimester 2011-12 by Gender
Subject
Female Male
N Mean SD Med. N Mean SD Med.
Algebra I 594 704.3 56.4 702 636 703.1 62.9 706 Algebra II 709 722.7 93.6 733 709 722.8 100.9 743 Biology I 728 709.6 76.5 710 756 723.6 88.2 733 English II 726 755.1 75.3 758 795 739.4 83.7 743 English III 865 759.0 65.2 762 908 737.6 75.7 745 Geometry 849 738.7 73.1 739 875 735.8 83.1 743 U.S. History 777 709.7 73.7 715 743 728.8 84.7 738
Note: N = Sample size; SD = Standard Deviation; Med. = Median.
Table 6.3. Descriptive Statistics of the Scale Scores for Winter/Trimester 2011-12 by Race/Ethnicity
Subject
African-American Native American
N Mean SD Med. N Mean SD Med.
Algebra I 134 666.7 59.2 675 207 699.9 55.4 702 Algebra II 141 645.9 98.9 657 219 721.2 90.6 738 Biology I 171 656.1 84.9 661 238 708.3 74.9 716 English II 149 709.7 78.4 703 200 735.1 76.5 736 English III 181 705.6 77.8 708 255 737.5 78.1 745 Geometry 158 672.5 83.1 687 276 741.0 77.4 743 U.S. History 171 657.6 83.1 659 226 719.6 76.6 732
Note: N = Sample size; SD = Standard Deviation; Med. = Median.
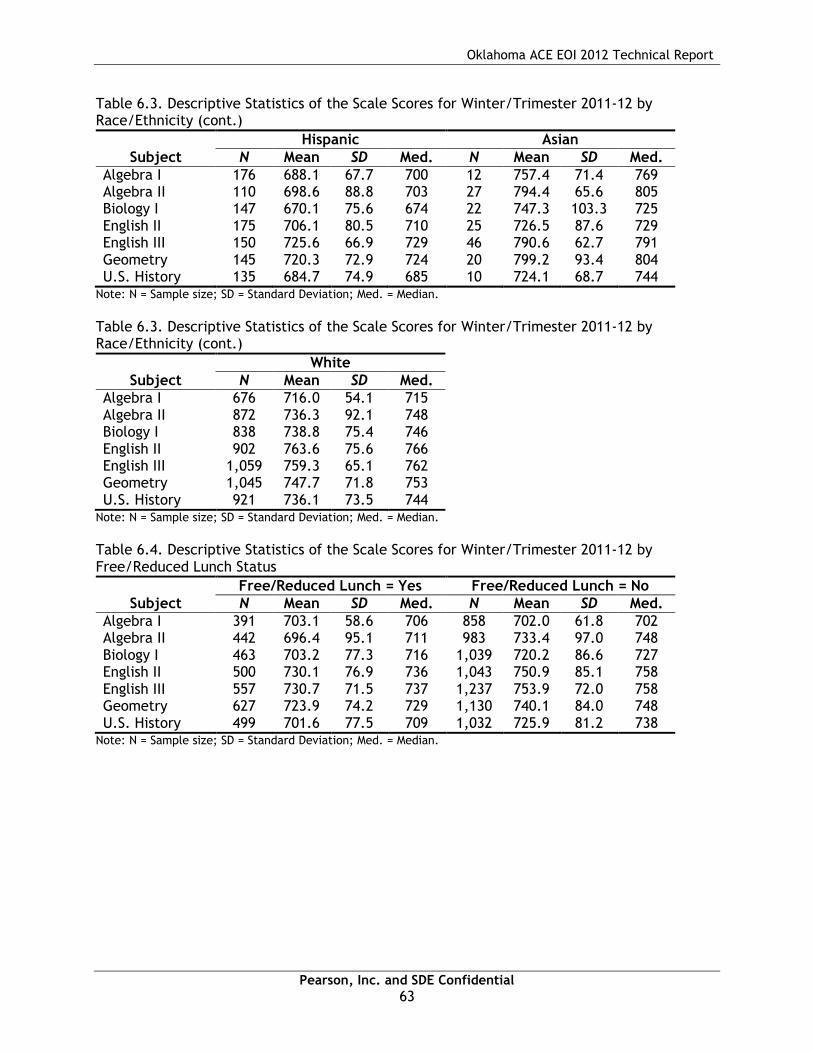
Oklahoma ACE EOI 2012 Technical Report
Pearson, Inc. and SDE Confidential
63
Table 6.3. Descriptive Statistics of the Scale Scores for Winter/Trimester 2011-12 by Race/Ethnicity (cont.)
Subject
Hispanic Asian
N Mean SD Med. N Mean SD Med.
Algebra I 176 688.1 67.7 700 12 757.4 71.4 769 Algebra II 110 698.6 88.8 703 27 794.4 65.6 805 Biology I 147 670.1 75.6 674 22 747.3 103.3 725 English II 175 706.1 80.5 710 25 726.5 87.6 729 English III 150 725.6 66.9 729 46 790.6 62.7 791 Geometry 145 720.3 72.9 724 20 799.2 93.4 804 U.S. History 135 684.7 74.9 685 10 724.1 68.7 744
Note: N = Sample size; SD = Standard Deviation; Med. = Median.
Table 6.3. Descriptive Statistics of the Scale Scores for Winter/Trimester 2011-12 by Race/Ethnicity (cont.)
Subject
White
N Mean SD Med.
Algebra I 676 716.0 54.1 715 Algebra II 872 736.3 92.1 748 Biology I 838 738.8 75.4 746 English II 902 763.6 75.6 766 English III 1,059 759.3 65.1 762 Geometry 1,045 747.7 71.8 753 U.S. History 921 736.1 73.5 744
Note: N = Sample size; SD = Standard Deviation; Med. = Median.
Table 6.4. Descriptive Statistics of the Scale Scores for Winter/Trimester 2011-12 by Free/Reduced Lunch Status
Subject
Free/Reduced Lunch = Yes Free/Reduced Lunch = No
N Mean SD Med. N Mean SD Med.
Algebra I 391 703.1 58.6 706 858 702.0 61.8 702 Algebra II 442 696.4 95.1 711 983 733.4 97.0 748 Biology I 463 703.2 77.3 716 1,039 720.2 86.6 727 English II 500 730.1 76.9 736 1,043 750.9 85.1 758 English III 557 730.7 71.5 737 1,237 753.9 72.0 758 Geometry 627 723.9 74.2 729 1,130 740.1 84.0 748 U.S. History 499 701.6 77.5 709 1,032 725.9 81.2 738
Note: N = Sample size; SD = Standard Deviation; Med. = Median.

Oklahoma ACE EOI 2012 Technical Report
Pearson, Inc. and SDE Confidential
64
Table 6.5. Descriptive Statistics of the Scale Scores for Spring 2012 - Overall
Note: N = Sample size; SD = Standard Deviation; Med. = Median.
Table 6.6. Descriptive Statistics of the Scale Scores for Spring 2012 by Gender
Subject
Female Male
N Mean SD Med. N Mean SD Med.
Core A Algebra I 9,919 741.5 52.5 741 9,550 739.2 56.1 741 Algebra II 8,305 737.9 80.5 742 7,938 733.3 89.1 742 Biology I 9,746 738.1 75.3 740 9,564 750.7 79.3 760 English II – OE A 5,166 770.8 70.1 770 5,261 761.1 73.3 763 English II – OE B 5,273 769.0 70.8 768 5,125 763.6 71.2 768 English III – OE A 4,871 761.9 59.6 767 4,970 746.9 66.3 752 English III – OE B 4,873 762.5 61.0 767 4,838 744.2 67.8 752 Geometry 9,528 752.5 73.2 757 9,745 749.8 75.8 757 U.S. History 8,780 724.8 69.7 728 8,477 748.8 74.7 751 Core B Algebra I 9,670 743.7 52.4 744 9,154 741.4 56.1 744 Algebra II 8,148 739.4 77.4 743 7,443 736.9 83.9 743 Biology I 9,372 743.3 72.8 748 9,177 752.3 75.3 754 English II – OE A 3,862 773.7 71.6 775 3,799 759.6 69.8 759 English II – OE B 3,937 775.8 71.1 781 3,810 762.6 70.7 766 English III – OE A 4,235 764.4 57.4 766 4,250 753.6 61.3 757 English III – OE B 4,317 766.6 56.5 767 4,297 753.9 60.2 757 Geometry 9,080 753.8 67.2 758 8,862 754.4 70.7 758 U.S. History 8,503 728.2 70.4 733 8,266 751.9 75.2 755
Note: N = Sample size; SD = Standard Deviation; Med. = Median.
Subject
Total
N Mean SD Med.
Core A Algebra I 19,469 740.3 54.3 741 Algebra II 16,250 735.6 85.0 742 Biology I 19,311 744.3 77.6 747 English II – OE A 10,427 765.9 71.9 770 English II – OE B 10,399 766.3 71.1 768 English III – OE A 9,845 754.3 63.5 757 English III – OE B 9,715 753.4 65.1 757 Geometry 19,276 751.1 74.6 757 U.S. History 17,261 736.6 73.2 739 Core B Algebra I 18,825 742.5 54.2 744 Algebra II 15,597 738.2 80.6 743 Biology I 18,551 747.7 74.2 748 English II – OE A 7,661 766.7 71.1 767 English II – OE B 7,747 769.3 71.2 773 English III – OE A 8,488 758.9 59.7 762 English III – OE B 8,616 760.2 58.8 762 Geometry 17,944 754.0 69.0 758 U.S. History 16,774 739.8 73.8 744

Oklahoma ACE EOI 2012 Technical Report
Pearson, Inc. and SDE Confidential
65
Table 6.7. Descriptive Statistics of the Scale Scores for Spring 2012 by Race/Ethnicity
Subject
African-American Native American
N Mean SD Med. N Mean SD Med.
Core A Algebra I 1,864 715.7 55.2 723 3,122 733.2 51.4 734 Algebra II 1,476 692.3 87.8 702 2,449 720.6 81.3 726 Biology I 1,901 696.2 80.7 700 2,944 737.4 71.8 740 English II – OE A 968 729.1 69.7 730 1,617 757.5 65.1 756 English II – OE B 981 731.8 66.4 735 1,632 760.0 64.7 762 English III – OE A 956 726.1 62.7 732 1,616 746.9 61.0 752 English III – OE B 1,021 725.6 65.5 731 1,568 745.5 61.4 752 Geometry 1,887 708.9 77.5 716 3,006 741.2 69.6 746 U.S. History 1,639 702.7 74.9 711 2,708 729.7 69.7 733 Core B Algebra I 1,851 719.0 51.1 719 3,049 735.9 49.4 737 Algebra II 1,366 697.8 84.6 711 2,345 723.8 79.4 728 Biology I 1,855 705.1 75.4 710 2,876 739.9 69.1 742 English II – OE A 690 732.1 67.1 735 1,184 760.6 65.4 767 English II – OE B 684 733.6 72.0 737 1,225 759.8 67.5 766 English III – OE A 833 728.4 59.9 730 1,342 750.2 56.8 752 English III – OE B 772 729.9 56.7 734 1,395 753.6 56.2 757 Geometry 1,712 715.3 72.4 722 2,780 745.2 65.4 748 U.S. History 1,499 694.3 79.5 700 2,596 732.0 71.8 733
Note: N = Sample size; SD = Standard Deviation; Med. = Median.
Table 6.7. Descriptive Statistics of the Scale Scores for Spring 2012 by Race/Ethnicity
Subject
Hispanic Asian
N Mean SD Med. N Mean SD Med.
Core A Algebra I 2,342 727.5 53.6 730 475 777.2 63.0 772 Algebra II 1,702 712.0 85.9 720 456 803.9 82.4 800 Biology I 2,152 711.5 80.9 720 455 774.6 79.7 780 English II – OE A 1,150 732.6 76.3 736 250 788.2 82.9 792 English II – OE B 1,215 736.2 74.3 742 250 779.8 95.9 780 English III – OE A 996 732.9 61.0 737 234 776.6 67.9 783 English III – OE B 1,013 734.9 62.3 741 186 766.0 67.6 776 Geometry 2,121 730.0 70.9 736 448 802.4 76.3 805 U.S. History 1,822 711.7 74.1 716 472 755.2 72.5 757 Core B Algebra I 2,118 727.7 55.1 729 450 781.0 67.0 771 Algebra II 1,609 716.1 81.5 722 398 801.2 82.9 798 Biology I 2,042 718.6 74.2 724 418 774.3 87.6 785 English II – OE A 902 732.5 76.9 738 180 791.4 93.2 791 English II – OE B 904 733.9 75.9 737 173 777.4 84.3 773 English III – OE A 874 740.4 57.8 743 176 762.5 64.6 766 English III – OE B 872 739.7 55.9 743 188 764.0 65.3 767 Geometry 2,112 734.5 66.8 737 392 801.6 79.7 809 U.S. History 1,739 715.9 77.6 722 369 748.5 81.0 755
Note: N = Sample size; SD = Standard Deviation; Med. = Median.

Oklahoma ACE EOI 2012 Technical Report
Pearson, Inc. and SDE Confidential
66
Table 6.7. Descriptive Statistics of the Scale Scores for Spring 2012 by Race/Ethnicity (cont.)
Subject
White
N Mean SD Med.
Core A Algebra I 10,822 747.9 52.1 748 Algebra II 9,518 747.0 81.0 753 Biology I 11,039 759.1 71.9 760 English II – OE A 6,014 778.8 68.5 777 English II – OE B 5,897 779.3 67.8 776 English III – OE A 5,710 764.0 61.8 767 English III – OE B 5,581 763.6 63.6 767 Geometry 10,980 763.0 71.5 767 U.S. History 9,947 747.7 70.7 751 Core B Algebra I 10,509 750.0 53.2 751 Algebra II 9,280 748.4 76.0 753 Biology I 10,536 761.8 69.7 760 English II – OE A 4,379 780.0 65.7 782 English II – OE B 4,435 784.1 65.8 781 English III – OE A 4,945 770.0 57.3 771 English III – OE B 5,078 770.2 57.0 772 Geometry 10,262 765.1 65.3 769 U.S. History 9,982 752.4 68.6 755
Note: N = Sample size; SD = Standard Deviation; Med. = Median.
Table 6.8. Descriptive Statistics of the Scale Scores for Spring 2012 by Free/Reduced Lunch Status
Subject
Free/Reduced Lunch = Yes Free/Reduced Lunch = No
N Mean SD Med. N Mean SD Med.
Core A Algebra I 8,655 727.7 51.1 730 10,814 750.4 54.7 752 Algebra II 6,318 712.4 86.1 720 9,932 750.3 80.8 753 Biology I 8,356 722.7 76.5 727 10,955 760.8 74.2 767 English II – OE A 4,435 745.7 70.1 749 5,992 780.9 69.5 777 English II – OE B 4,488 745.7 69.2 748 5,911 782.0 68.4 783 English III – OE A 4,123 736.4 62.0 741 5,722 767.1 61.5 772 English III – OE B 4,104 734.9 64.4 741 5,611 766.9 62.2 773 Geometry 8,356 730.3 73.5 736 10,920 767.1 71.4 777 U.S. History 6,936 717.7 71.4 722 10,325 749.2 71.7 751 Core B Algebra I 8,515 730.5 51.8 733 10,310 752.4 54.2 751 Algebra II 6,138 715.1 81.7 722 9,459 753.2 76.2 758 Biology I 8,104 726.5 72.6 730 10,447 764.2 71.2 766 English II – OE A 3,322 745.0 70.4 752 4,339 783.4 66.9 782 English II – OE B 3,332 746.6 71.1 751 4,415 786.5 66.3 789 English III – OE A 3,513 740.1 58.5 743 4,975 772.3 56.8 771 English III – OE B 3,505 740.4 56.2 743 5,111 773.8 56.6 776 Geometry 7,824 734.8 66.8 737 10,120 768.9 66.9 769 U.S. History 6,676 719.5 74.1 722 10,098 753.3 70.5 755
Note: N = Sample size; SD = Standard Deviation; Med. = Median.

Oklahoma ACE EOI 2012 Technical Report
Pearson, Inc. and SDE Confidential
67
6.2 Performance Level Distribution
The distributions of students in the four performance levels based on student performance in the Winter/Trimester 2011-12 and Spring 2012 administration are presented in Table 6.9 (please see Appendix B and Appendix C for distributions by scale score for Winter/Trimester 2011-12 and Spring 2012, respectively). As above, these percentages exclude invalid student data and second-time test-takers. The percentage distributions for each of the content areas are comparable to previous administrations (e.g., Winter/Trimester 2010-11 and Spring 2011). Table 6.9. Percentage of Students by Performance Level for Winter/Trimester 2011-12 and Spring 2012
Subject N Unsatisfactory Limited
Knowledge Proficient Advanced
Winter 2011-12 Algebra I 1,249 15.3% 23.4% 43.8% 17.5% Algebra II 1,425 23.6% 12.1% 34.0% 30.3% Biology I 1,502 14.2% 23.4% 42.0% 20.4% English II 1,543 5.2% 16.7% 48.6% 29.6% English III 1,794 14.3% 8.1% 47.4% 30.2% Geometry 1,757 7.6% 18.6% 38.0% 35.8% U.S. History 1,531 10.2% 24.3% 37.8% 27.7%
Spring 2012 Core A Algebra I 19,469 4.2% 13.4% 47.3% 35.2% Algebra II 16,250 11.0% 14.3% 45.2% 29.5% Biology I 19,311 5.8% 18.2% 48.0% 28.0% English II – OE A 10,427 1.9% 12.4% 57.6% 28.2% English II – OE B 10,399 1.5% 12.3% 62.0% 24.2% English III – OE A 9,845 8.0% 7.3% 60.5% 24.2% English III – OE B 9,715 9.4% 6.4% 60.3% 23.9% Geometry 19,276 6.0% 12.5% 40.0% 41.5% U.S. History 17,261 5.1% 20.2% 40.8% 33.9%
Spring 2012 Core B Algebra I 18,825 3.9% 12.2% 47.1% 36.8% Algebra II 15,597 10.8% 14.4% 44.5% 30.3% Biology I 18,551 5.0% 16.2% 49.6% 29.2% English II – OE A 7,661 1.7% 12.1% 56.9% 29.3% English II – OE B 7,747 1.7% 10.8% 60.3% 27.2% English III – OE A 8,488 5.5% 6.9% 64.2% 23.4% English III – OE B 8,616 5.8% 7.0% 60.1% 27.1% Geometry 17,944 4.2% 11.9% 43.8% 40.0% U.S. History 16,774 4.9% 19.9% 37.5% 37.6%
6.3 Conditional Standard Error of Measurement
The conditional standard error of measurement (CSEM) was computed for each reported scale score. CSEM was computed using an IRT-based approach based on the following formula:
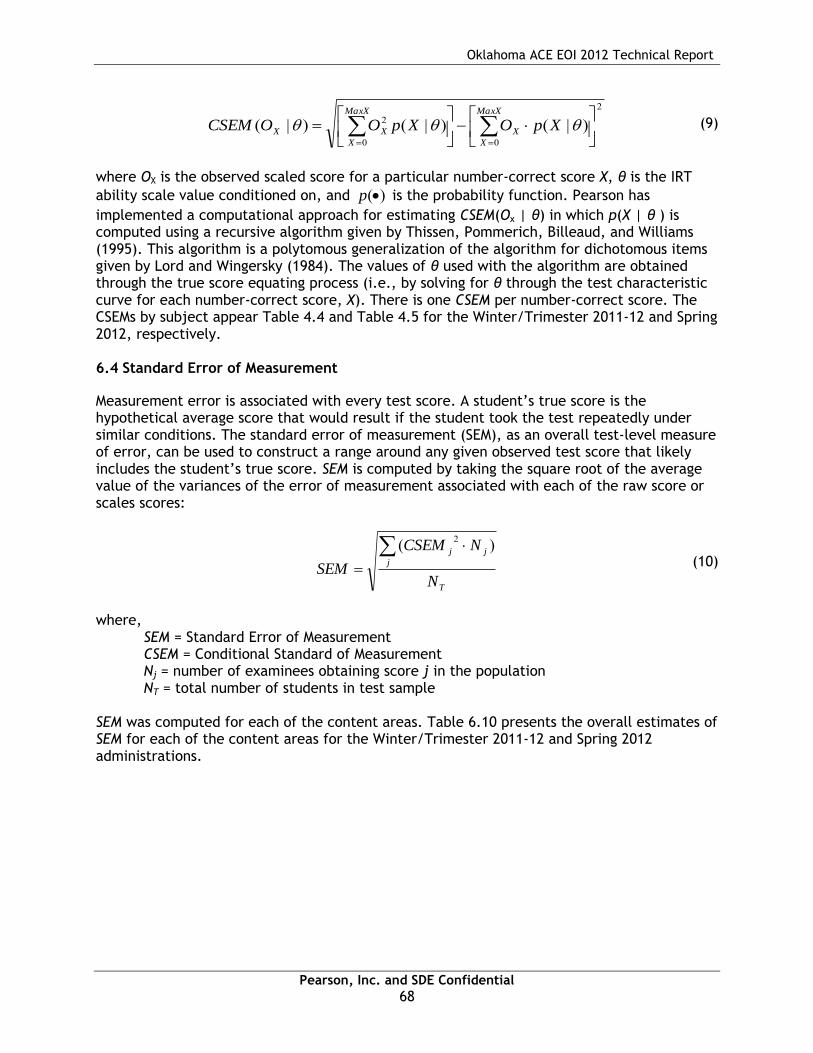
Oklahoma ACE EOI 2012 Technical Report
Pearson, Inc. and SDE Confidential
68
2
00
2 )|()|()|(
MaxX
X
X
MaxX
X
XX XpOXpOOCSEM (9)
where OX is the observed scaled score for a particular number-correct score X, θ is the IRT
ability scale value conditioned on, and )(p is the probability function. Pearson has
implemented a computational approach for estimating CSEM(Ox | θ) in which p(X | θ ) is computed using a recursive algorithm given by Thissen, Pommerich, Billeaud, and Williams (1995). This algorithm is a polytomous generalization of the algorithm for dichotomous items given by Lord and Wingersky (1984). The values of θ used with the algorithm are obtained through the true score equating process (i.e., by solving for θ through the test characteristic curve for each number-correct score, X). There is one CSEM per number-correct score. The CSEMs by subject appear Table 4.4 and Table 4.5 for the Winter/Trimester 2011-12 and Spring 2012, respectively. 6.4 Standard Error of Measurement
Measurement error is associated with every test score. A student’s true score is the hypothetical average score that would result if the student took the test repeatedly under similar conditions. The standard error of measurement (SEM), as an overall test-level measure of error, can be used to construct a range around any given observed test score that likely includes the student’s true score. SEM is computed by taking the square root of the average value of the variances of the error of measurement associated with each of the raw score or scales scores:
T
j
jj
N
NCSEM
SEM
)( 2
(10)
where, SEM = Standard Error of Measurement CSEM = Conditional Standard of Measurement Nj = number of examinees obtaining score j in the population NT = total number of students in test sample SEM was computed for each of the content areas. Table 6.10 presents the overall estimates of SEM for each of the content areas for the Winter/Trimester 2011-12 and Spring 2012 administrations.

Oklahoma ACE EOI 2012 Technical Report
Pearson, Inc. and SDE Confidential
69
Table 6.10. Overall Estimates of SEM by Subject
Subject SEM*
Winter 2011-12 Algebra I 26.97 Algebra II 35.41 Biology I 29.22 English II 29.26 English III 23.50 Geometry 29.44 U.S. History 28.50
Spring 2012 Algebra I – A 22.71 Algebra I – B 22.80 Algebra II – A 33.52 Algebra II – B 31.71 Biology I – A 28.76 Biology I – B 27.68 English II – AA 26.86 English II – AB 26.85 English II – BA 28.68 English II – BB 29.09 English III – AA 22.28 English III – AB 22.40 English III – BA 20.70 English III – BB 20.25 Geometry – A 26.79 Geometry – B 25.67 U.S. History - A 27.85 U.S. History - B 27.50
Note: *SEM = Standard Error of Measurement; SEM values are on the reportable scale metric; AA=Core MC form A+OE form A; AB=Core MC form A+OE form B; BA=Core MC form B+OE form A; BB=Core MC form B+OE form B.

Oklahoma ACE EOI 2012 Technical Report
Pearson, Inc. and SDE Confidential
70
References
American Educational Research Association (AERA), American Psychological Association (APA), & the National Council on Measurement in Education (NCME) (1999). Standards for educational and psychological testing. Washington, DC: AERA.
Dorans, N. J., & Holland, P. W. (1993). DIF detection and description: Mantel-Haenszel and standardization. In P. W. Holland & H. Wainer (Eds.), Differential item functioning (pp. 35-66). Hillsdale, NJ: Lawrence Erlbaum.
Holland, P. W., & Thayer, D.T. (1988). Differential Item Performance and the Mantel-Haenszel Procedure. (ETS RR-86-31). Princeton, NJ: Educational Testing Service.
Lord, F. M. (1980). Applications of item response theory to practical testing problems. Hillsdale, NJ: Lawrence Erlbaum.
Lord, F. M., & Novick, M. R. (1968). Statistical theories of mental test scores. Reading Massachusetts: Addison-Wesley Publishing Company.
Lord, F. M., & Wingersky, M. S. (1984). Comparison of IRT true-score and equipercentile observed-score “equatings.” Applied Psychological Measurement, 8, 453-461.
Kim, S. & Kolen, M. J. (2004). STUIRT: A computer program. Iowa City, IA: The University of Iowa. (Available from the web address: http://www.uiowa.edu/~casma).
Kolen, M.J. (2004). POLYEQUATE: A computer program. Iowa City, IA: The University of Iowa. (Available from the web address: http://www.uiowa.edu/~casma).
Kolen, M. J., & Brennan, R. L. (2004). Test equating, scaling, and linking: methods and practices (2nd ed.). New York: Springer.
Kraemer, H. C. (1982). Kappa coefficient. Encyclopedia of Statistical Sciences. Wiley. Livingston, S. A., & Lewis, C. (1995). Estimating the consistency and accuracy of
classifications based on test scores. Journal of Educational Measurement, 32, 179–197. Michaelides, M. P. (2008). An Illustration of a Mantel-Haenszel Procedure to Flag Misbehaving
Common Items in Test Equating. Practical Assessment Research & Evaluation, 13(7). Available online: http://pareonline.net/pdf/v13n7.pdf
Muraki, E. (1997). The generalized partial credit model. In W.J. van der Linden & R.K. Hambleton (Eds.), Handbook of Modern Item Response Theory (pp. 153-164). New York: Springer Verlag.
Stocking, M.L., & Lord, F.M. (1983). Developing a common metric in item response theory. Applied Psychological Measurement, 7, 201-210.
Thissen, D., Chen, W-H., & Bock, R. D. (2003). MUTILOG for Windows, Version 7 [Computer Software]. Lincolnwood, IL: Scientific Software International.
Thissen, D., Pommerich, M., Billeaud, K., & Williams, V.S.L. (1995). Item response theory for scores on tests including polytomous items with ordered responses. Applied Psychological Measurement, 19, 39-49.
Yen, W. M. (1981). Using simulation results to choose a latent trait model. Applied Psychological Measurement, 5, 245–262.
Yen, W. M. ( 1984). Effects of local item dependence on the fit and equating performance of the three-parameter logistic model. Applied Psychological Measurement, 8, 125-145.
Oklahoma ACE EOI 2012 Technical Report
Pearson, Inc. and SDE Confidential
71
Appendix A
Standards, Objectives/Skills, and Processes Assessed by Subject

Oklahoma ACE EOI 2012 Technical Report
Pearson, Inc. and SDE Confidential
72
Algebra I
Standard 1: Number Sense and Algebraic Operations
Standard 1.1 Equations and Formulas
1.1a Translate
1.1b Literal Equations
1.1c Problem Solving with Formulas
1.1d Problem Solving
Standard 1.2 Expressions
1.2a Simplify expressions…
1.2b Compute with polynomials…
1.2c Factor polynomials
Standard 2: Relations and Functions
Standard 2.1 Relations/Functions
2.1a Distinguish linear and nonlinear
2.1b Distinguish between relations…
2.1c Dependent, Independ, Domain, Range
2.1d Evaluate a function…
Standard 2.2 Linear Equations and Graphs
2.2a Solve linear equations
2.2b Graph Transformations
2.2c Slope
2.2d Equation of a Line
2.2e Match to a graph, table, etc.
Standard 2.3 Linear Inequalities and Graphs
2.3a Solve linear inequalities
2.3b Match to a table, graph, etc.
Standard 2.4 Systems of Equations
Standard 3: Data Analysis, Probability & Statistics
Standard 3.1 Data Analysis
3.1a Data Representations
3.1b Data Predictions
3.1c Problem Solving
Standard 3.2 Line of Best Fit

Oklahoma ACE EOI 2012 Technical Report
Pearson, Inc. and SDE Confidential
73
Algebra II
Standard 1: Number Sense and Algebraic Operations
Standard 1.1 Rational Exponents
1.1a Convert expressions from radical notations to rational exponents and vice versa.
1.1b Add, subtract, multiply, divide, and simplify radical expressions and expressions containing rational exponents.
Standard 1.2 Polynomial and Rational Expressions
1.2a Divide polynomial expressions by lower degree polynomials.
1.2b Add, subtract, multiply, divide, and simplify rational expressions, including complex fractions.
Standard 1.3 Complex Numbers
1.3b Add, subtract, multiply, divide, and simplify expressions involving complex numbers.
Standard 2: Relations and Functions
Standard 2.1 Functions and Function Notation
2.1a Recognize the parent graphs of polynomial, exponential, and logarithmic functions and predict the effects of transformations on the parent graphs, using various methods and tools which may include graphing calculators.
2.1b Use function notation to add, subtract, multiply, and divide functions.
2.1c Combine functions by composition.
2.1d Use algebraic, interval, and set notations to specify the domain and range of functions of various types.
2.1e Find and graph the inverse of a function, if it exists.
Standard 2.2 Systems of Equations
2.2a Model a situation that can be described by a system of equations and inequalities and use the model to answer questions about the situation.
2.2b Solve systems of linear equations and inequalities using various methods and tools which may include substitution, elimination, matrices, graphing, and graphing calculators.
2.2c Use either one quadratic equation and one linear equation or two quadratic equations to solve problems.
Standard 2.3 Quadratic Equations and Functions
2.3a Solve quadratic equations by graphing, factoring, completing the square and quadratic formula.
2.3b Graph a quadratic function and identify the x- and y-intercepts and maximum or minimum value, using various methods and tools which may include a graphing calculator.
2.3c Model a situation that can be described by a quadratic function and use the model to answer questions about the situation.

Oklahoma ACE EOI 2012 Technical Report
Pearson, Inc. and SDE Confidential
74
Algebra II continued
Standard 2.4 Identify, graph, and write the equations of the conic sections (circle, ellipse, parabola, and hyperbola).
Standard 2.5 Exponential and Logarithmic Functions
2.5a Graph exponential and logarithmic functions.
2.5b Apply the inverse relationship between exponential and logarithmic functions to convert from one form to another.
2.5c Model a situation that can be described by an exponential or logarithmic function and use the model to answer questions about the situation.
Standard 2.6 Polynomial Equations and Functions
2.6a Solve polynomial equations using various methods and tools which may include factoring and synthetic division.
2.6b Sketch the graph of a polynomial function.
2.6c Given the graph of a polynomial function, identify the x- and y-intercepts, relative maximums and relative minimums, using various methods and tools which may include a graphing calculator.
2.6d Model a situation that can be described by a polynomial function and use the model to answer questions about the situation.
Standard 2.7 Rational Equations and Functions
2.7a Solve rational equations.
2.7b Sketch the graph of a rational function.
2.7c Given the graph of a rational function, identify the x- and y-intercepts, asymptotes, using various methods and tools which may include a graphing calculator.
2.7d Model a situation that can be described by a rational function and use the model to answer questions about the situation.
Standard 3: Data Analysis, Probability, & Statistics
Standard 3.1 Analysis of Collected Data …
3.1a Display data on a scatter plot.
3.1b Interpret results using a linear, exponential or quadratic model/equation.
3.1c Identify whether the model/equation is a curve of best fit for the data, using various methods and tools which may include a graphing calculator.
Standard 3.3 Identify and use arithmetic and geometric sequences

Oklahoma ACE EOI 2012 Technical Report
Pearson, Inc. and SDE Confidential
75
Geometry
Standard 1: Logical Reasoning
Standard 1.1 Identify and use logical reasoning skills (inductive and deductive) to make and test conjectures, formulate counter examples, and follow logical arguments.
Standard 1.2 State, use, and examine the validity of the converse, inverse, and contrapositive of “if-then” statements.
Standard 2: Properties of 2-Dimensional Figures
Standard 2.2 Line and Angle Relationships
2.2a Use the angle relationships formed by parallel lines cut by a transversal to solve problems.
2.2b Use the angle relationships formed by two lines cut by a transversal to determine if the two lines are parallel and verify, using algebraic and deductive proofs.
2.2c Use relationships between pairs of angles (for example, adjacent, complementary, vertical) to solve problems.
Standard 2.3 Polygons and Other Plane Figures
2.3a Identify, describe, and analyze polygons (for example, convex, concave, regular, pentagonal, hexagonal, n-gonal).
2.3b Apply the interior and exterior angle sum of convex polygons to solve problems, and verify using algebraic and deductive proofs.
2.3c Develop and apply the properties of quadrilaterals to solve problems (for example, rectangles, parallelograms, rhombi, trapezoids, kites).
2.3d Use properties of 2-dimensional figures and side length, perimeter or circumference, and area to determine unknown values and correctly identify the appropriate unit of measure of each.
Standard 2.4 Similarity
2.4a Determine and verify the relationships of similarity of triangles, using algebraic and deductive proofs.
2.4b Use ratios of similar 2-dimensional figures to determine unknown values, such as angles, side lengths, perimeter or circumference, and area.
Standard 2.5 Congruence
2.5a Determine and verify the relationships of congruency of triangles, using algebraic and deductive proofs.
2.5b Use the relationships of congruency of 2-dimensional figures to determine unknown values, such as angles, side lengths, perimeter or circumference, and area.
Standard 2.6 Circles
2.6a Find angle measures and arc measures related to circles.
2.6b Find angle measures and segment lengths using the relationships among radii, chords, secants, and tangents of a circle.

Oklahoma ACE EOI 2012 Technical Report
Pearson, Inc. and SDE Confidential
76
Geometry continued
Standard 3: Triangles and Trigonometric Ratios
Standard 3.1 Use the Pythagorean Theorem and its converse to find missing side lengths and to determine acute, right, and obtuse triangles, and verify using algebraic and deductive proofs.
Standard 3.2 Apply the 45-45-90 and 30-60-90 right triangle relationships to solve problems, and verify using algebraic and deductive proofs.
Standard 3.3 Express the trigonometric functions as ratios and use sine, cosine, and tangent ratios to solve real-world problems.
Standard 4: Properties of 3-Dimensional Figures
Standard 4.1 Polyhedra and Other Solids
4.1a Identify, describe, and analyze polyhedra (for example, regular, decahedral).
4.1b Use properties of 3-dimensional figures; side lengths, perimeter or circumference, and area of a face; and volume, lateral area, and surface area to determine unknown values and correctly identify the appropriate unit of measure of each.
Standard 4.2 Similarity and Congruence
4.2a Use ratios of similar 3-dimensional figures to determine unknown values, such as angles, side lengths, perimeter or circumference of a face, area of a face, and volume.
4.2b Use the relationships of congruency of 3-dimensional figures to determine unknown values, such as angles, side lengths, perimeter or circumference of a face, area of a face, and volume.
4.3 Create a model of a 3-dimensional figure from a 2-dimensional drawing and make a 2-dimensional representation of a 3-dimensional object (for example, nets, blueprints, perspective drawings).
Standard 5: Coordinate Geometry
Standard 5.1 Use coordinate geometry to find the distance between two points; the midpoint of a segment; and to calculate the slopes of a parallel, perpendicular, horizontal, and vertical lines.
Standard 5.2 Properties of Figures
5.2a Given a set of points determine the type of figure formed based on its properties.
5.2b Use transformations (reflection, rotation, translation)on geometric figures to solve problems within coordinate geometry.

Oklahoma ACE EOI 2012 Technical Report
Pearson, Inc. and SDE Confidential
77
Biology I
PASS Process/Inquiry Standards and Objectives
Process 1 Observe and Measure
P1.1 Qualitative/quantitative observations and changes
P1.2 P1.3
Use appropriate System International (SI) units and tools
Process 2 Classify
P2.1 Use observable properties to classify
P2.2 Identify properties of a classification system
Process 3 Experiment
P3.1 Evaluate the design of investigations
P3.2 P3.4
Identify a testable hypothesis, variables, and control in an experiment
P3.3 Use mathematics to show relationships
P3.5 Identify potential hazards and practice safety procedures in all science activities
Process 4 Interpret and Communicate
P4.1 Select predictions based on observed patterns of evidence
P4.3 Interpret line, bar, trend, and circle graphs
P4.4 Accept or reject a hypothesis
P4.5 Make logical conclusions based on experimental data
P4.8 Identify an appropriate graph or chart
Process 5 Model
P5.1 Interpret a model which explains a given set of observations
P5.2 Select predictions based on models
PASS Content Standards
Standard 1 The Cell
1.1 Cell structures and functions
1.2 Differentiation of cells
Standard 2 The Molecular Basis of Heredity
2.1 DNA structure and function in heredity
2.2 Sorting and recombination of genes
Standard 3 Biological Diversity
3.1 Variation among organisms
3.2 Natural selection and biological adaptations
Standard 4 The Interdependence of Organisms
4.1 Earth cycles including abiotic and biotic factors
4.2 Organisms both cooperate and compete
4.3 Population dynamics
Standard 5 Matter/Energy/Organization in Living Systems
5.1 Complexity and organization used for survival
5.2 Matter and energy flow in living and nonliving systems
Oklahoma ACE EOI 2012 Technical Report
Pearson, Inc. and SDE Confidential
78
Biology I continued
Standard 6 The Behavior of Organisms
6.1 Specialized cells
6.2 Behavior patterns can be used to ensure reproductive success

Oklahoma ACE EOI 2012 Technical Report
Pearson, Inc. and SDE Confidential
79
English II
Reading/Literature
Standard 1 Vocabulary
Standard 2 Comprehension
2.1 Literal Understanding
2.2 Inferences and Interpretation
2.3 Summary and Generalization
2.4 Analysis and Evaluation
Standard 3 Literature
3.1 Literary Genres
3.2 Literary Elements
3.3 Figurative Language
3.4 Literary Works
Standard 4 Research and Information
Writing/Grammar/Usage and Mechanics
Standard 1/2 Writing
Writing Prompt
Standard 3 Grammar/Usage and Mechanics
3.1 Standard Usage
3.2 Mechanics and Spelling
3.3 Sentence Structure

Oklahoma ACE EOI 2012 Technical Report
Pearson, Inc. and SDE Confidential
80
English III
Reading/Literature
Standard 1 Vocabulary
Standard 2 Comprehension
2.1 Literal Understanding
2.2 Inference and Interpretation
2.3 Summary and Generalization
2.4 Analysis and Evaluation
Standard 3 Literature
3.1 Literary Genres
3.2 Literary Elements
3.3 Figurative Language
3.4 Literary Works
Standard 4 Research and Information
Writing/Grammar/Usage and Mechanics
Standard 1/2 Writing
Writing Prompt
Standard 3 Grammar/Usage and Mechanics
3.1 Standard English Usage
3.2 Mechanics and Spelling
3.3 Sentence Structure
3.4 Manuscript Conventions

Oklahoma ACE EOI 2012 Technical Report
Pearson, Inc. and SDE Confidential
81
U.S. History
Standard 1 Civil War/Reconstruction Era
Standard 2 Impact of Immigration and Industrialization
2.1 Immigration and Impact on Native Americans
2.2 Industrialization
Standard 3 Imperialism, World War I, and Isolationism
3.1 American Imperialism
3.2 World War I and Isolationism
Standard 4 United States During the 1920s and 1930s
4.1 Cultural Life Between the Wars
4.2 Economic Destabilization
4.3 The Great Depression, the Dust Bowl, and the New Deal
Standard 5 World War II
5.1 Preparing for War
5.2 World War II
Standard 6 United States Since World War II
6.1 Post War Foreign Policies and Events
6.2 Events Changing Domestic and Foreign Policies and Events
6.3 Post War Domestic Policies and Events
Oklahoma ACE EOI 2012 Technical Report
Pearson, Inc. and SDE Confidential
82
Appendix B
Scale Score Distributions for Winter/Trimester 2011-12
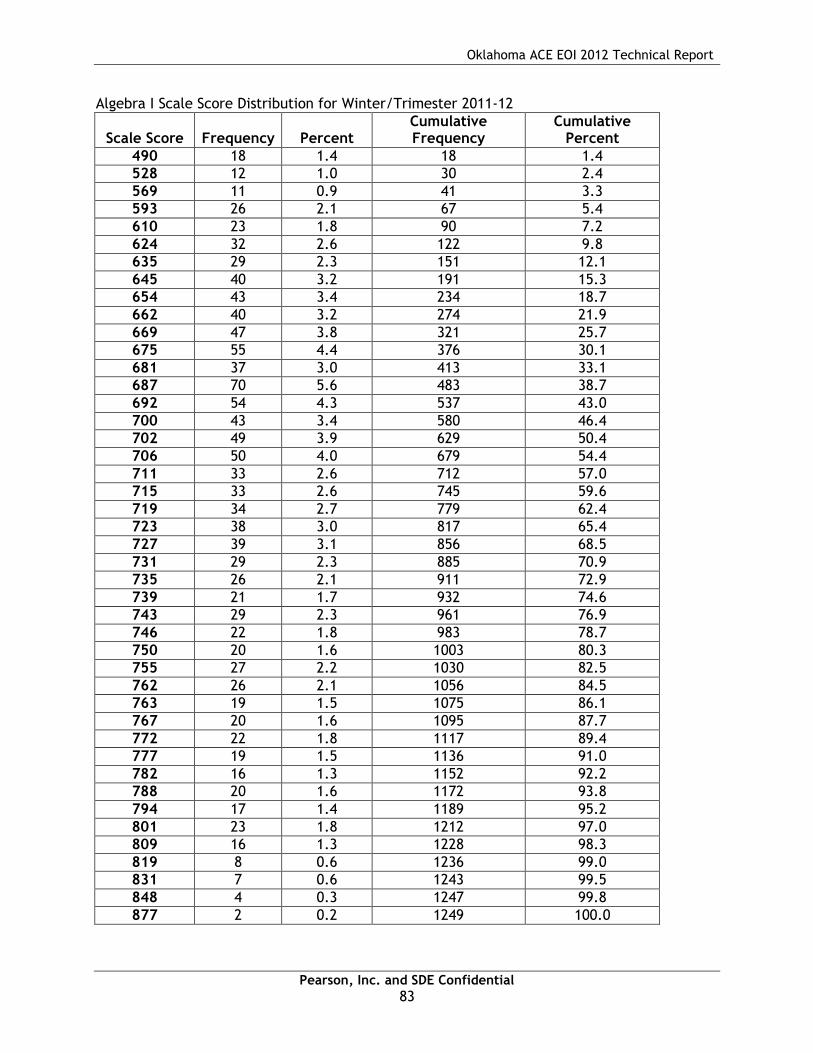
Oklahoma ACE EOI 2012 Technical Report
Pearson, Inc. and SDE Confidential
83
Algebra I Scale Score Distribution for Winter/Trimester 2011-12
Scale Score Frequency Percent Cumulative Frequency
Cumulative Percent
490 18 1.4 18 1.4
528 12 1.0 30 2.4
569 11 0.9 41 3.3
593 26 2.1 67 5.4
610 23 1.8 90 7.2
624 32 2.6 122 9.8
635 29 2.3 151 12.1
645 40 3.2 191 15.3
654 43 3.4 234 18.7
662 40 3.2 274 21.9
669 47 3.8 321 25.7
675 55 4.4 376 30.1
681 37 3.0 413 33.1
687 70 5.6 483 38.7
692 54 4.3 537 43.0
700 43 3.4 580 46.4
702 49 3.9 629 50.4
706 50 4.0 679 54.4
711 33 2.6 712 57.0
715 33 2.6 745 59.6
719 34 2.7 779 62.4
723 38 3.0 817 65.4
727 39 3.1 856 68.5
731 29 2.3 885 70.9
735 26 2.1 911 72.9
739 21 1.7 932 74.6
743 29 2.3 961 76.9
746 22 1.8 983 78.7
750 20 1.6 1003 80.3
755 27 2.2 1030 82.5
762 26 2.1 1056 84.5
763 19 1.5 1075 86.1
767 20 1.6 1095 87.7
772 22 1.8 1117 89.4
777 19 1.5 1136 91.0
782 16 1.3 1152 92.2
788 20 1.6 1172 93.8
794 17 1.4 1189 95.2
801 23 1.8 1212 97.0
809 16 1.3 1228 98.3
819 8 0.6 1236 99.0
831 7 0.6 1243 99.5
848 4 0.3 1247 99.8
877 2 0.2 1249 100.0

Oklahoma ACE EOI 2012 Technical Report
Pearson, Inc. and SDE Confidential
84

Oklahoma ACE EOI 2012 Technical Report
Pearson, Inc. and SDE Confidential
85
Algebra II Scale Score Distribution for Winter/Trimester 2011-12
Scale Score Frequency Percent Cumulative Frequency
Cumulative Percent
440 46 3.2 46 3.2 515 20 1.4 66 4.6 554 34 2.4 100 7.0 580 33 2.3 133 9.3 599 35 2.5 168 11.8 614 40 2.8 208 14.6 627 43 3.0 251 17.6 638 23 1.6 274 19.2 654 33 2.3 307 21.5 657 29 2.0 336 23.6 666 22 1.5 358 25.1 673 27 1.9 385 27.0 680 30 2.1 415 29.1 687 31 2.2 446 31.3 694 30 2.1 476 33.4 700 32 2.2 508 35.6 706 29 2.0 537 37.7 711 28 2.0 565 39.6 717 39 2.7 604 42.4 722 38 2.7 642 45.1 727 27 1.9 669 46.9 733 38 2.7 707 49.6 738 30 2.1 737 51.7 743 38 2.7 775 54.4 748 31 2.2 806 56.6 753 40 2.8 846 59.4 758 31 2.2 877 61.5 764 37 2.6 914 64.1 769 39 2.7 953 66.9 774 40 2.8 993 69.7 783 42 2.9 1035 72.6 786 39 2.7 1074 75.4 792 42 2.9 1116 78.3 798 43 3.0 1159 81.3 805 43 3.0 1202 84.4 812 31 2.2 1233 86.5 819 33 2.3 1266 88.8 827 35 2.5 1301 91.3 836 26 1.8 1327 93.1 847 24 1.7 1351 94.8 859 24 1.7 1375 96.5 875 18 1.3 1393 97.8

Oklahoma ACE EOI 2012 Technical Report
Pearson, Inc. and SDE Confidential
86
Algebra II Scale Score Distribution for Winter/Trimester 2011-12 (cont.)
Scale Score Frequency Percent Cumulative Frequency
Cumulative Percent
898 14 1.0 1407 98.7
938 13 0.9 1420 99.6
999 5 0.4 1425 100.0

Oklahoma ACE EOI 2012 Technical Report
Pearson, Inc. and SDE Confidential
87
Biology I Scale Score Distribution for Winter/Trimester 2011-12
Scale Score Frequency Percent Cumulative Frequency
Cumulative Percent
440 10 0.7 10 0.7
472 8 0.5 18 1.2
503 12 0.8 30 2.0
526 12 0.8 42 2.8
545 16 1.1 58 3.9
560 17 1.1 75 5.0
574 30 2.0 105 7.0
586 12 0.8 117 7.8
597 18 1.2 135 9.0
606 26 1.7 161 10.7
616 24 1.6 185 12.3
624 28 1.9 213 14.2
634 32 2.1 245 16.3
640 33 2.2 278 18.5
647 27 1.8 305 20.3
654 39 2.6 344 22.9
661 34 2.3 378 25.2
667 39 2.6 417 27.8
674 35 2.3 452 30.1
680 33 2.2 485 32.3
686 37 2.5 522 34.8
692 43 2.9 565 37.6
700 45 3.0 610 40.6
704 46 3.1 656 43.7
710 35 2.3 691 46.0
716 42 2.8 733 48.8
721 49 3.3 782 52.1
727 43 2.9 825 54.9
733 40 2.7 865 57.6
739 54 3.6 919 61.2
746 47 3.1 966 64.3
752 43 2.9 1009 67.2
758 41 2.7 1050 69.9
765 53 3.5 1103 73.4
772 48 3.2 1151 76.6
779 45 3.0 1196 79.6
794 55 3.7 1251 83.3
795 36 2.4 1287 85.7
804 38 2.5 1325 88.2
814 42 2.8 1367 91.0
825 39 2.6 1406 93.6
837 23 1.5 1429 95.1
852 26 1.7 1455 96.9

Oklahoma ACE EOI 2012 Technical Report
Pearson, Inc. and SDE Confidential
88
Biology I Scale Score Distribution for Winter/Trimester 2011-12 (cont.)
Scale Score Frequency Percent Cumulative Frequency
Cumulative Percent
870 23 1.5 1478 98.4
893 15 1.0 1493 99.4
926 9 0.6 1502 100.0

Oklahoma ACE EOI 2012 Technical Report
Pearson, Inc. and SDE Confidential
89
English II Scale Score Distribution for Winter/Trimester 2011-12
Scale Score Frequency Percent Cumulative Frequency
Cumulative Percent
440 5 0.3 5 0.3
454 5 0.3 10 0.6
482 4 0.3 14 0.9
503 5 0.3 19 1.2
521 1 0.1 20 1.3
536 7 0.5 27 1.7
548 2 0.1 29 1.9
559 8 0.5 37 2.4
569 9 0.6 46 3.0
578 11 0.7 57 3.7
587 7 0.5 64 4.1
595 16 1.0 80 5.2
602 11 0.7 91 5.9
609 13 0.8 104 6.7
616 11 0.7 115 7.5
623 8 0.5 123 8.0
629 20 1.3 143 9.3
636 14 0.9 157 10.2
642 11 0.7 168 10.9
648 10 0.6 178 11.5
654 19 1.2 197 12.8
660 23 1.5 220 14.3
666 24 1.6 244 15.8
672 32 2.1 276 17.9
679 30 1.9 306 19.8
685 31 2.0 337 21.8
691 39 2.5 376 24.4
700 33 2.1 409 26.5
703 47 3.0 456 29.6
710 31 2.0 487 31.6
716 48 3.1 535 34.7
723 49 3.2 584 37.8
729 57 3.7 641 41.5
736 65 4.2 706 45.8
743 44 2.9 750 48.6
751 68 4.4 818 53.0
758 67 4.3 885 57.4
766 79 5.1 964 62.5
775 58 3.8 1022 66.2
784 65 4.2 1087 70.4
794 75 4.9 1162 75.3
804 73 4.7 1235 80.0
817 55 3.6 1290 83.6
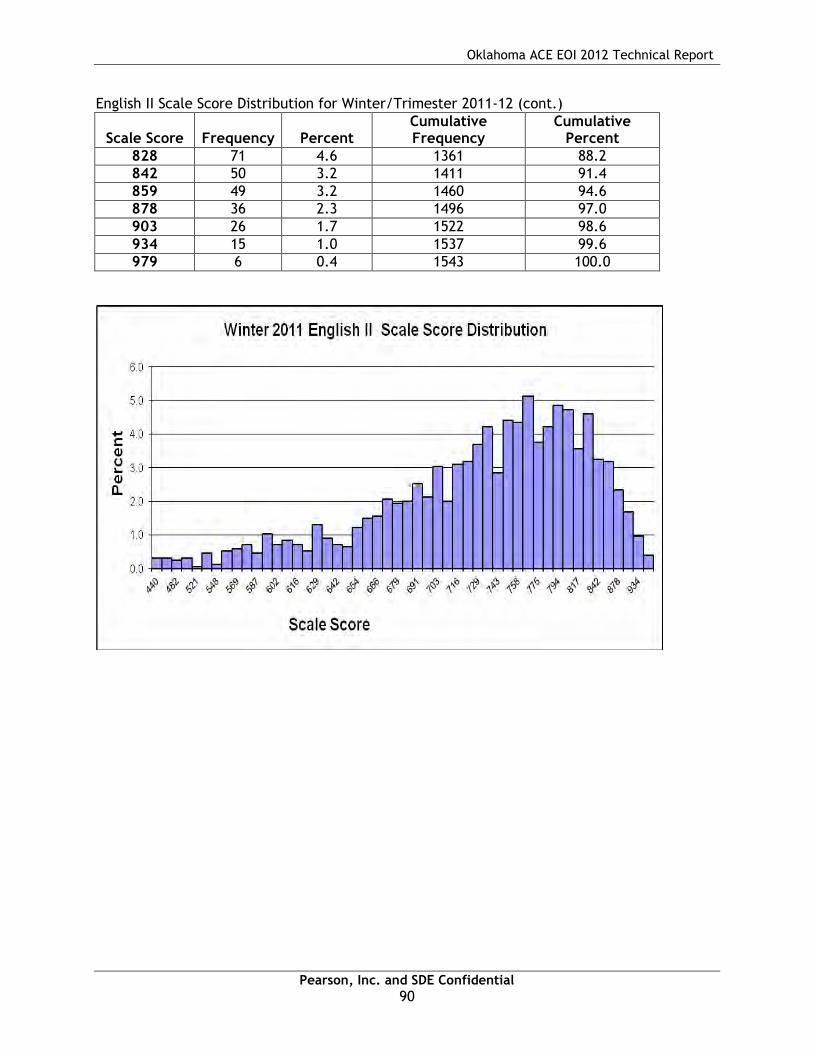
Oklahoma ACE EOI 2012 Technical Report
Pearson, Inc. and SDE Confidential
90
English II Scale Score Distribution for Winter/Trimester 2011-12 (cont.)
Scale Score Frequency Percent Cumulative Frequency
Cumulative Percent
828 71 4.6 1361 88.2
842 50 3.2 1411 91.4
859 49 3.2 1460 94.6
878 36 2.3 1496 97.0
903 26 1.7 1522 98.6
934 15 1.0 1537 99.6
979 6 0.4 1543 100.0

Oklahoma ACE EOI 2012 Technical Report
Pearson, Inc. and SDE Confidential
91
English III Scale Score Distribution for Winter/Trimester 2011-12
Scale Score Frequency Percent Cumulative Frequency
Cumulative Percent
440 10 0.6 10 0.6
476 1 0.1 11 0.6
514 1 0.1 12 0.7
538 11 0.6 23 1.3
556 8 0.4 31 1.7
572 8 0.4 39 2.2
585 10 0.6 49 2.7
596 10 0.6 59 3.3
607 17 0.9 76 4.2
616 21 1.2 97 5.4
624 16 0.9 113 6.3
632 14 0.8 127 7.1
640 18 1.0 145 8.1
646 17 0.9 162 9.0
653 19 1.1 181 10.1
659 27 1.5 208 11.6
665 13 0.7 221 12.3
670 36 2.0 257 14.3
675 25 1.4 282 15.7
680 15 0.8 297 16.6
685 27 1.5 324 18.1
690 34 1.9 358 20.0
694 19 1.1 377 21.0
700 26 1.4 403 22.5
703 24 1.3 427 23.8
708 32 1.8 459 25.6
712 32 1.8 491 27.4
716 25 1.4 516 28.8
720 41 2.3 557 31.0
725 45 2.5 602 33.6
729 46 2.6 648 36.1
733 47 2.6 695 38.7
737 50 2.8 745 41.5
741 45 2.5 790 44.0
745 34 1.9 824 45.9
750 53 3.0 877 48.9
754 50 2.8 927 51.7
758 49 2.7 976 54.4
762 68 3.8 1044 58.2
767 49 2.7 1093 60.9
771 51 2.8 1144 63.8
776 55 3.1 1199 66.8
781 54 3.0 1253 69.8

Oklahoma ACE EOI 2012 Technical Report
Pearson, Inc. and SDE Confidential
92
English III Scale Score Distribution for Winter/Trimester 2011-12 (cont.)
Scale Score Frequency Percent Cumulative Frequency
Cumulative Percent
786 47 2.6 1300 72.5
791 48 2.7 1348 75.1
796 52 2.9 1400 78.0
802 35 2.0 1435 80.0
808 47 2.6 1482 82.6
814 53 3.0 1535 85.6
821 45 2.5 1580 88.1
829 40 2.2 1620 90.3
837 53 3.0 1673 93.3
846 36 2.0 1709 95.3
857 29 1.6 1738 96.9
870 18 1.0 1756 97.9
885 16 0.9 1772 98.8
905 13 0.7 1785 99.5
934 5 0.3 1790 99.8
986 4 0.2 1794 100.0

Oklahoma ACE EOI 2012 Technical Report
Pearson, Inc. and SDE Confidential
93
Geometry Scale Score Distribution for Winter/Trimester 2011-12
Scale Score Frequency Percent Cumulative Frequency
Cumulative Percent
440 11 0.6 11 0.6
443 10 0.6 21 1.2
501 12 0.7 33 1.9
537 16 0.9 49 2.8
562 19 1.1 68 3.9
582 21 1.2 89 5.1
598 23 1.3 112 6.4
612 21 1.2 133 7.6
624 24 1.4 157 8.9
635 18 1.0 175 10.0
645 28 1.6 203 11.6
654 36 2.0 239 13.6
662 38 2.2 277 15.8
670 45 2.6 322 18.3
677 56 3.2 378 21.5
684 30 1.7 408 23.2
690 52 3.0 460 26.2
700 51 2.9 511 29.1
702 40 2.3 551 31.4
708 52 3.0 603 34.3
713 44 2.5 647 36.8
718 44 2.5 691 39.3
724 44 2.5 735 41.8
729 42 2.4 777 44.2
734 43 2.4 820 46.7
739 58 3.3 878 50.0
743 56 3.2 934 53.2
748 48 2.7 982 55.9
753 51 2.9 1033 58.8
759 53 3.0 1086 61.8
764 42 2.4 1128 64.2
770 64 3.6 1192 67.8
777 59 3.4 1251 71.2
782 58 3.3 1309 74.5
788 51 2.9 1360 77.4
796 65 3.7 1425 81.1
804 54 3.1 1479 84.2
813 63 3.6 1542 87.8
823 51 2.9 1593 90.7
835 58 3.3 1651 94.0
850 41 2.3 1692 96.3
869 33 1.9 1725 98.2

Oklahoma ACE EOI 2012 Technical Report
Pearson, Inc. and SDE Confidential
94
Geometry Scale Score Distribution for Winter/Trimester 2011-12 (cont.)
Scale Score Frequency Percent Cumulative Frequency
Cumulative Percent
896 18 1.0 1743 99.2
946 10 0.6 1753 99.8
999 4 0.2 1757 100.0

Oklahoma ACE EOI 2012 Technical Report
Pearson, Inc. and SDE Confidential
95
U.S. History Scale Score Distribution for Winter/Trimester 2011-12
Scale Score Frequency Percent Cumulative Frequency
Cumulative Percent
440 7 0.5 7 0.5
477 9 0.6 16 1.0
506 12 0.8 28 1.8
528 9 0.6 37 2.4
546 15 1.0 52 3.4
562 19 1.2 71 4.6
575 18 1.2 89 5.8
588 21 1.4 110 7.2
599 22 1.4 132 8.6
609 24 1.6 156 10.2
627 34 2.2 190 12.4
628 30 2.0 220 14.4
636 28 1.8 248 16.2
644 28 1.8 276 18.0
652 34 2.2 310 20.2
659 36 2.4 346 22.6
666 38 2.5 384 25.1
673 39 2.5 423 27.6
679 30 2.0 453 29.6
685 38 2.5 491 32.1
691 37 2.4 528 34.5
700 48 3.1 576 37.6
703 38 2.5 614 40.1
709 30 2.0 644 42.1
715 45 2.9 689 45.0
720 54 3.5 743 48.5
726 52 3.4 795 51.9
732 50 3.3 845 55.2
738 46 3.0 891 58.2
744 48 3.1 939 61.3
750 49 3.2 988 64.5
756 63 4.1 1051 68.6
762 56 3.7 1107 72.3
773 58 3.8 1165 76.1
776 47 3.1 1212 79.2
783 53 3.5 1265 82.6
791 46 3.0 1311 85.6
799 36 2.4 1347 88.0
808 40 2.6 1387 90.6
818 39 2.5 1426 93.1
829 29 1.9 1455 95.0
842 26 1.7 1481 96.7
859 25 1.6 1506 98.4
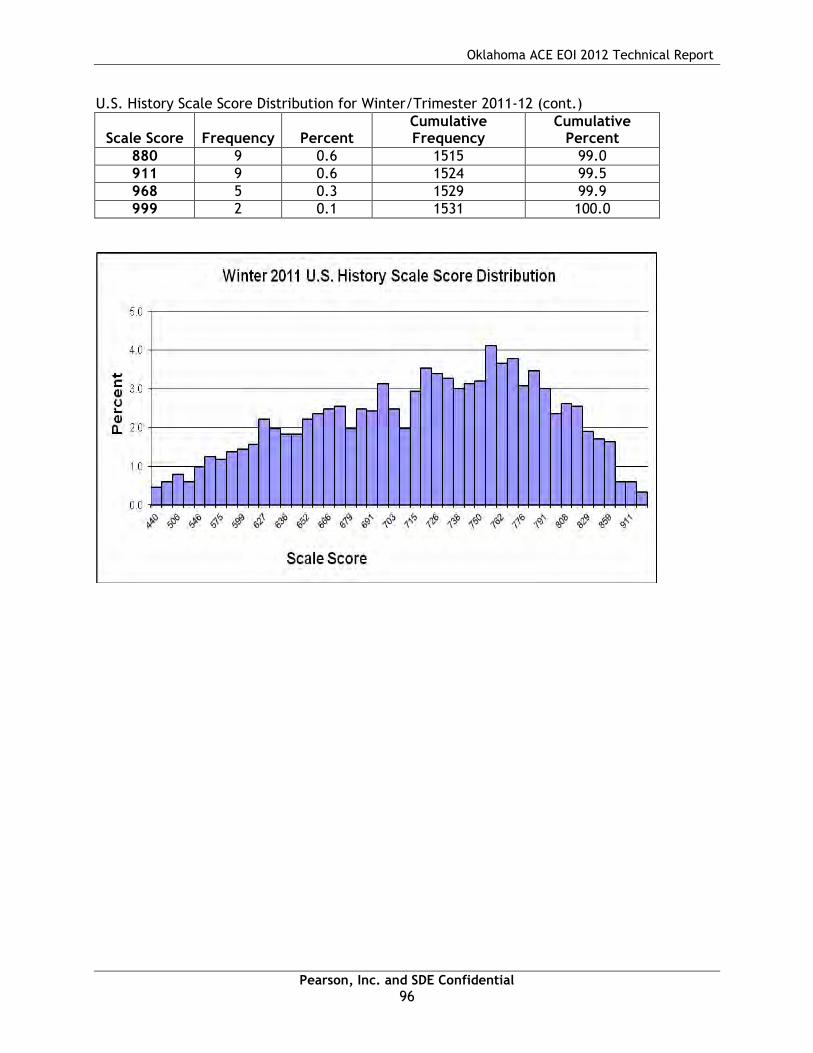
Oklahoma ACE EOI 2012 Technical Report
Pearson, Inc. and SDE Confidential
96
U.S. History Scale Score Distribution for Winter/Trimester 2011-12 (cont.)
Scale Score Frequency Percent Cumulative Frequency
Cumulative Percent
880 9 0.6 1515 99.0
911 9 0.6 1524 99.5
968 5 0.3 1529 99.9
999 2 0.1 1531 100.0

Oklahoma ACE EOI 2012 Technical Report
Pearson, Inc. and SDE Confidential
97
Appendix C
Scale Score Distributions for Spring 2012

Oklahoma ACE EOI 2012 Technical Report
Pearson, Inc. and SDE Confidential
98
Algebra I Core A Score Distribution for Spring 2012
Scale Score Frequency Percent Cumulative Frequency
Cumulative Percent
490 98 0.5 98 0.5
565 51 0.3 149 0.8
597 83 0.4 232 1.2
617 94 0.5 326 1.7
630 135 0.7 461 2.4
641 181 0.9 642 3.3
650 168 0.9 810 4.2
662 232 1.2 1042 5.4
664 287 1.5 1329 6.8
670 290 1.5 1619 8.3
676 320 1.6 1939 10.0
681 347 1.8 2286 11.7
686 338 1.7 2624 13.5
691 375 1.9 2999 15.4
695 415 2.1 3414 17.5
700 409 2.1 3823 19.6
703 453 2.3 4276 22.0
707 471 2.4 4747 24.4
711 516 2.7 5263 27.0
715 501 2.6 5764 29.6
719 523 2.7 6287 32.3
723 570 2.9 6857 35.2
726 578 3.0 7435 38.2
730 629 3.2 8064 41.4
734 623 3.2 8687 44.6
737 622 3.2 9309 47.8
741 606 3.1 9915 50.9
745 676 3.5 10591 54.4
748 654 3.4 11245 57.8
752 692 3.6 11937 61.3
756 677 3.5 12614 64.8
762 695 3.6 13309 68.4
764 660 3.4 13969 71.7
768 646 3.3 14615 75.1
772 635 3.3 15250 78.3
777 596 3.1 15846 81.4
782 570 2.9 16416 84.3
788 534 2.7 16950 87.1
794 531 2.7 17481 89.8
801 466 2.4 17947 92.2
810 433 2.2 18380 94.4
821 392 2.0 18772 96.4
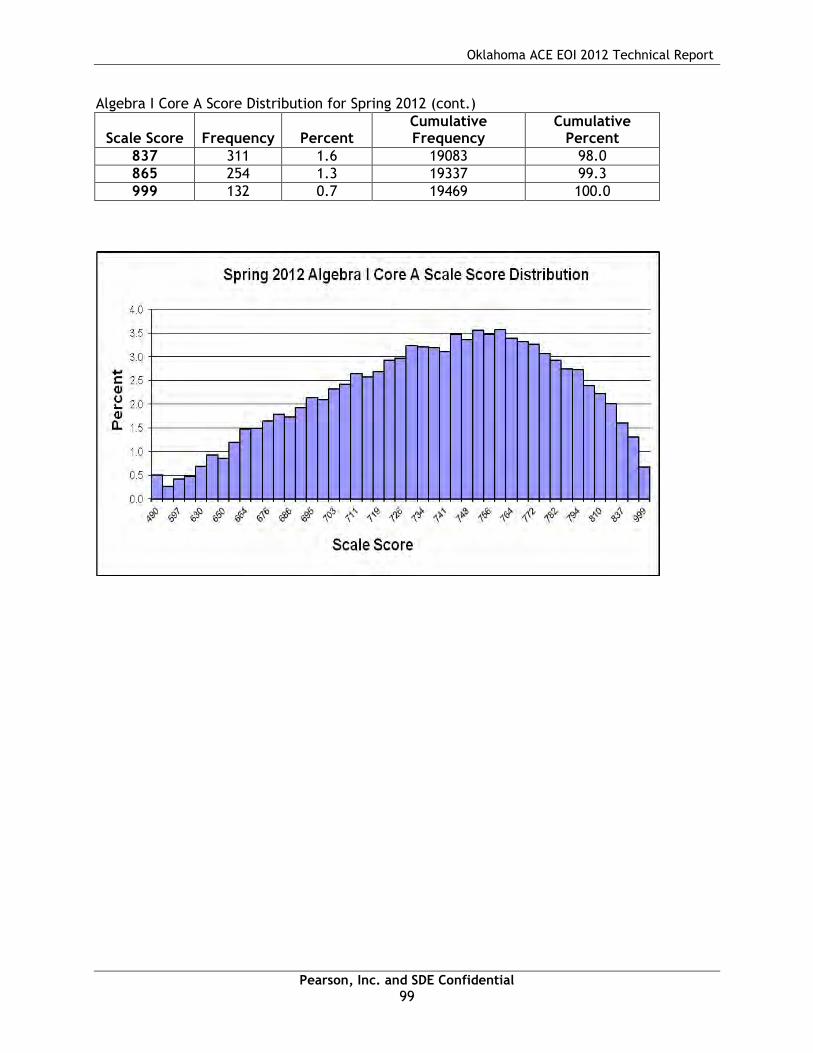
Oklahoma ACE EOI 2012 Technical Report
Pearson, Inc. and SDE Confidential
99
Algebra I Core A Score Distribution for Spring 2012 (cont.)
Scale Score Frequency Percent Cumulative Frequency
Cumulative Percent
837 311 1.6 19083 98.0
865 254 1.3 19337 99.3
999 132 0.7 19469 100.0

Oklahoma ACE EOI 2012 Technical Report
Pearson, Inc. and SDE Confidential
100
Algebra I Core B Score Distribution for Spring 2012
Scale Score Frequency Percent Cumulative Frequency
Cumulative Percent
490 82 0.4 82 0.4
560 44 0.2 126 0.7
597 70 0.4 196 1.0
617 79 0.4 275 1.5
631 124 0.7 399 2.1
642 143 0.8 542 2.9
651 195 1.0 737 3.9
662 189 1.0 926 4.9
665 224 1.2 1150 6.1
671 241 1.3 1391 7.4
677 268 1.4 1659 8.8
682 314 1.7 1973 10.5
687 321 1.7 2294 12.2
691 368 2.0 2662 14.1
696 373 2.0 3035 16.1
700 413 2.2 3448 18.3
704 424 2.3 3872 20.6
708 448 2.4 4320 22.9
711 496 2.6 4816 25.6
715 492 2.6 5308 28.2
719 533 2.8 5841 31.0
722 545 2.9 6386 33.9
726 559 3.0 6945 36.9
729 563 3.0 7508 39.9
733 614 3.3 8122 43.1
737 612 3.3 8734 46.4
740 610 3.2 9344 49.6
744 636 3.4 9980 53.0
747 598 3.2 10578 56.2
751 642 3.4 11220 59.6
755 677 3.6 11897 63.2
762 645 3.4 12542 66.6
763 615 3.3 13157 69.9
767 636 3.4 13793 73.3
771 641 3.4 14434 76.7
776 637 3.4 15071 80.1
781 573 3.0 15644 83.1
787 555 2.9 16199 86.1
793 505 2.7 16704 88.7
801 505 2.7 17209 91.4
810 447 2.4 17656 93.8
821 436 2.3 18092 96.1
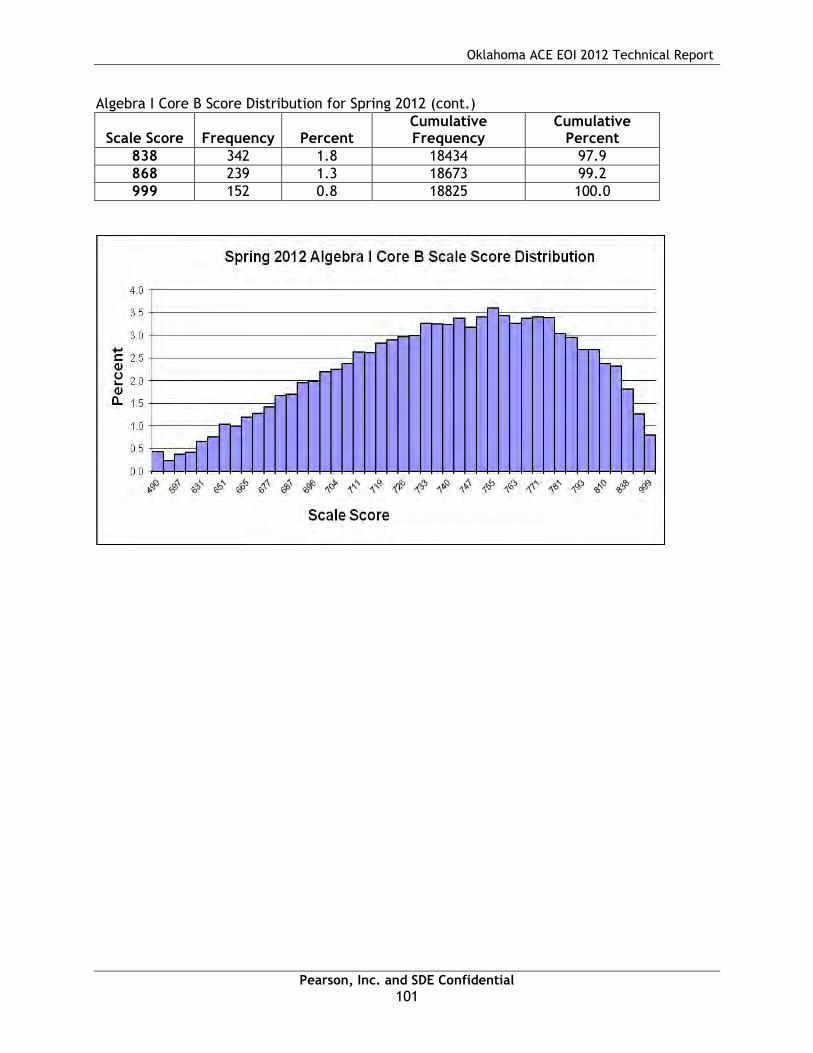
Oklahoma ACE EOI 2012 Technical Report
Pearson, Inc. and SDE Confidential
101
Algebra I Core B Score Distribution for Spring 2012 (cont.)
Scale Score Frequency Percent Cumulative Frequency
Cumulative Percent
838 342 1.8 18434 97.9
868 239 1.3 18673 99.2
999 152 0.8 18825 100.0

Oklahoma ACE EOI 2012 Technical Report
Pearson, Inc. and SDE Confidential
102
Algebra II Core A Score Distribution for Spring 2012
Scale Score Frequency Percent Cumulative Frequency
Cumulative Percent
440 199 1.2 199 1.2
459 123 0.8 322 2.0
525 144 0.9 466 2.9
562 197 1.2 663 4.1
587 219 1.3 882 5.4
607 278 1.7 1160 7.1
623 271 1.7 1431 8.8
636 354 2.2 1785 11.0
654 350 2.2 2135 13.1
657 364 2.2 2499 15.4
666 401 2.5 2900 17.8
674 392 2.4 3292 20.3
682 406 2.5 3698 22.8
689 417 2.6 4115 25.3
700 456 2.8 4571 28.1
702 449 2.8 5020 30.9
708 482 3.0 5502 33.9
714 467 2.9 5969 36.7
720 479 2.9 6448 39.7
726 488 3.0 6936 42.7
731 485 3.0 7421 45.7
737 485 3.0 7906 48.7
742 484 3.0 8390 51.6
747 517 3.2 8907 54.8
753 519 3.2 9426 58.0
758 518 3.2 9944 61.2
764 536 3.3 10480 64.5
769 468 2.9 10948 67.4
775 507 3.1 11455 70.5
783 462 2.8 11917 73.3
787 515 3.2 12432 76.5
793 447 2.8 12879 79.3
800 434 2.7 13313 81.9
807 400 2.5 13713 84.4
814 435 2.7 14148 87.1
823 400 2.5 14548 89.5
832 358 2.2 14906 91.7
842 305 1.9 15211 93.6
855 269 1.7 15480 95.3
870 241 1.5 15721 96.7
889 225 1.4 15946 98.1
917 155 1.0 16101 99.1

Oklahoma ACE EOI 2012 Technical Report
Pearson, Inc. and SDE Confidential
103
Algebra II Core A Score Distribution for Spring 2012 (cont.)
Scale Score Frequency Percent Cumulative Frequency
Cumulative Percent
967 98 0.6 16199 99.7
999 51 0.3 16250 100.0
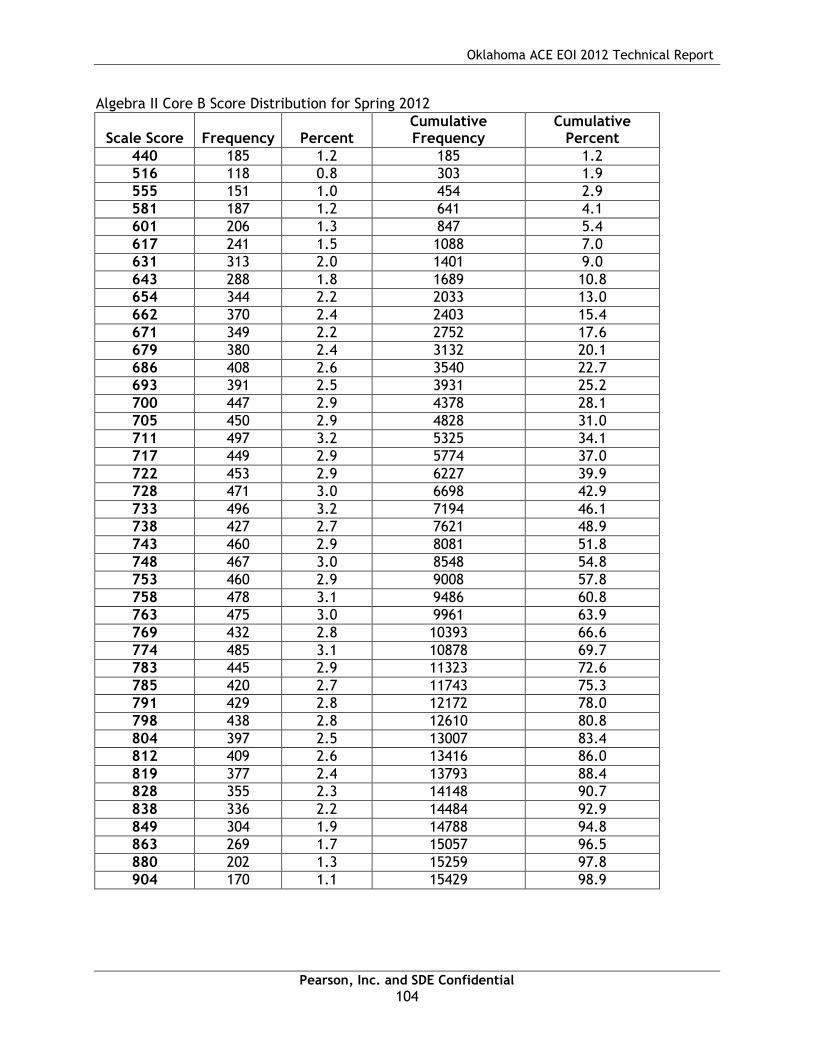
Oklahoma ACE EOI 2012 Technical Report
Pearson, Inc. and SDE Confidential
104
Algebra II Core B Score Distribution for Spring 2012
Scale Score Frequency Percent Cumulative Frequency
Cumulative Percent
440 185 1.2 185 1.2
516 118 0.8 303 1.9
555 151 1.0 454 2.9
581 187 1.2 641 4.1
601 206 1.3 847 5.4
617 241 1.5 1088 7.0
631 313 2.0 1401 9.0
643 288 1.8 1689 10.8
654 344 2.2 2033 13.0
662 370 2.4 2403 15.4
671 349 2.2 2752 17.6
679 380 2.4 3132 20.1
686 408 2.6 3540 22.7
693 391 2.5 3931 25.2
700 447 2.9 4378 28.1
705 450 2.9 4828 31.0
711 497 3.2 5325 34.1
717 449 2.9 5774 37.0
722 453 2.9 6227 39.9
728 471 3.0 6698 42.9
733 496 3.2 7194 46.1
738 427 2.7 7621 48.9
743 460 2.9 8081 51.8
748 467 3.0 8548 54.8
753 460 2.9 9008 57.8
758 478 3.1 9486 60.8
763 475 3.0 9961 63.9
769 432 2.8 10393 66.6
774 485 3.1 10878 69.7
783 445 2.9 11323 72.6
785 420 2.7 11743 75.3
791 429 2.8 12172 78.0
798 438 2.8 12610 80.8
804 397 2.5 13007 83.4
812 409 2.6 13416 86.0
819 377 2.4 13793 88.4
828 355 2.3 14148 90.7
838 336 2.2 14484 92.9
849 304 1.9 14788 94.8
863 269 1.7 15057 96.5
880 202 1.3 15259 97.8
904 170 1.1 15429 98.9

Oklahoma ACE EOI 2012 Technical Report
Pearson, Inc. and SDE Confidential
105
Algebra II Core B Score Distribution for Spring 2012 (cont.)
Scale Score Frequency Percent Cumulative Frequency
Cumulative Percent
948 106 0.7 15535 99.6
999 62 0.4 15597 100.0
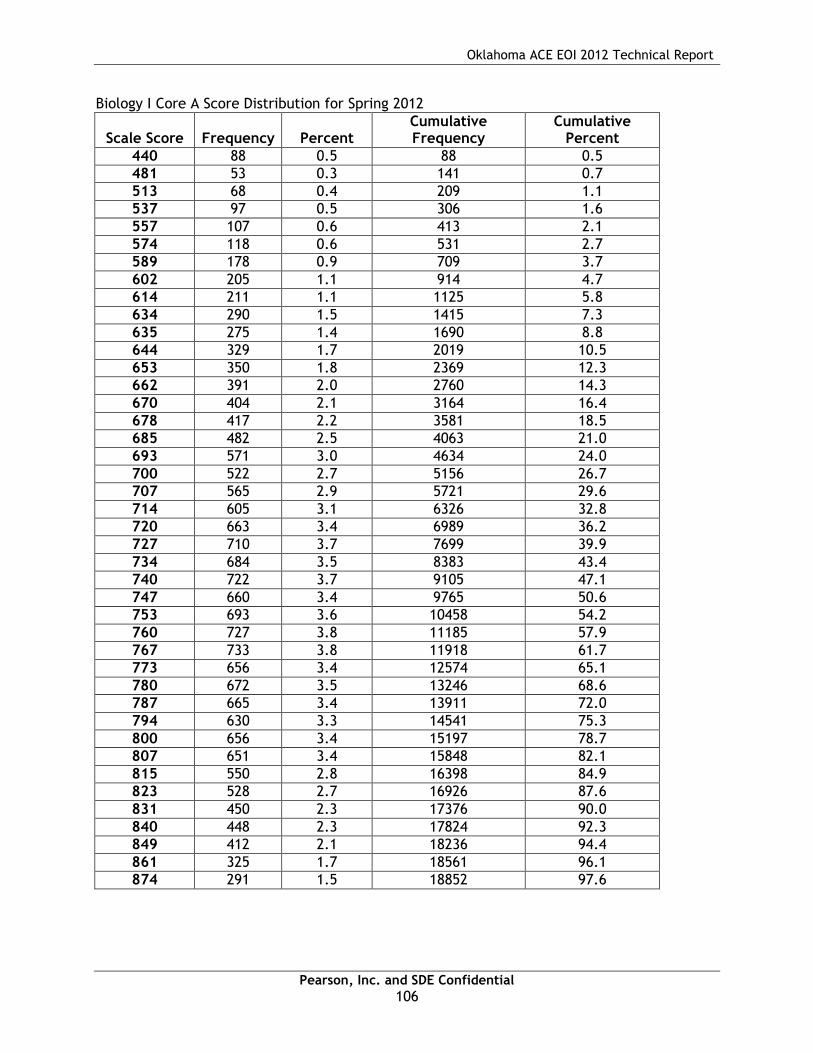
Oklahoma ACE EOI 2012 Technical Report
Pearson, Inc. and SDE Confidential
106
Biology I Core A Score Distribution for Spring 2012
Scale Score Frequency Percent Cumulative Frequency
Cumulative Percent
440 88 0.5 88 0.5
481 53 0.3 141 0.7
513 68 0.4 209 1.1
537 97 0.5 306 1.6
557 107 0.6 413 2.1
574 118 0.6 531 2.7
589 178 0.9 709 3.7
602 205 1.1 914 4.7
614 211 1.1 1125 5.8
634 290 1.5 1415 7.3
635 275 1.4 1690 8.8
644 329 1.7 2019 10.5
653 350 1.8 2369 12.3
662 391 2.0 2760 14.3
670 404 2.1 3164 16.4
678 417 2.2 3581 18.5
685 482 2.5 4063 21.0
693 571 3.0 4634 24.0
700 522 2.7 5156 26.7
707 565 2.9 5721 29.6
714 605 3.1 6326 32.8
720 663 3.4 6989 36.2
727 710 3.7 7699 39.9
734 684 3.5 8383 43.4
740 722 3.7 9105 47.1
747 660 3.4 9765 50.6
753 693 3.6 10458 54.2
760 727 3.8 11185 57.9
767 733 3.8 11918 61.7
773 656 3.4 12574 65.1
780 672 3.5 13246 68.6
787 665 3.4 13911 72.0
794 630 3.3 14541 75.3
800 656 3.4 15197 78.7
807 651 3.4 15848 82.1
815 550 2.8 16398 84.9
823 528 2.7 16926 87.6
831 450 2.3 17376 90.0
840 448 2.3 17824 92.3
849 412 2.1 18236 94.4
861 325 1.7 18561 96.1
874 291 1.5 18852 97.6
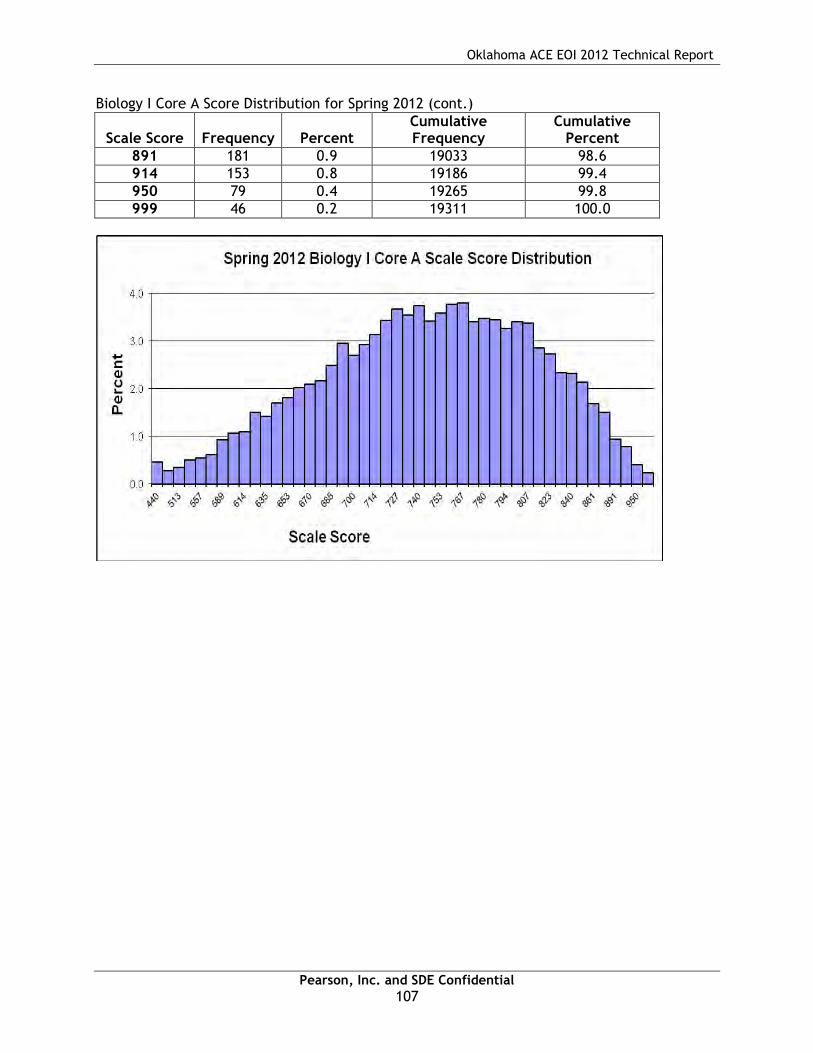
Oklahoma ACE EOI 2012 Technical Report
Pearson, Inc. and SDE Confidential
107
Biology I Core A Score Distribution for Spring 2012 (cont.)
Scale Score Frequency Percent Cumulative Frequency
Cumulative Percent
891 181 0.9 19033 98.6
914 153 0.8 19186 99.4
950 79 0.4 19265 99.8
999 46 0.2 19311 100.0

Oklahoma ACE EOI 2012 Technical Report
Pearson, Inc. and SDE Confidential
108
Biology I Core B Score Distribution for Spring 2012
Scale Score Frequency Percent Cumulative Frequency
Cumulative Percent
440 52 0.3 52 0.3
472 25 0.1 77 0.4
510 45 0.2 122 0.7
538 61 0.3 183 1.0
560 83 0.4 266 1.4
578 133 0.7 399 2.2
593 145 0.8 544 2.9
607 175 0.9 719 3.9
619 214 1.2 933 5.0
634 239 1.3 1172 6.3
640 277 1.5 1449 7.8
650 330 1.8 1779 9.6
658 385 2.1 2164 11.7
667 402 2.2 2566 13.8
675 439 2.4 3005 16.2
682 438 2.4 3443 18.6
690 486 2.6 3929 21.2
700 533 2.9 4462 24.1
704 582 3.1 5044 27.2
710 564 3.0 5608 30.2
717 612 3.3 6220 33.5
724 618 3.3 6838 36.9
730 651 3.5 7489 40.4
736 619 3.3 8108 43.7
742 640 3.4 8748 47.2
748 651 3.5 9399 50.7
754 664 3.6 10063 54.2
760 648 3.5 10711 57.7
766 640 3.4 11351 61.2
773 604 3.3 11955 64.4
779 608 3.3 12563 67.7
785 568 3.1 13131 70.8
794 577 3.1 13708 73.9
797 554 3.0 14262 76.9
804 530 2.9 14792 79.7
810 543 2.9 15335 82.7
817 480 2.6 15815 85.3
825 446 2.4 16261 87.7
833 408 2.2 16669 89.9
841 409 2.2 17078 92.1
850 370 2.0 17448 94.1
861 333 1.8 17781 95.8
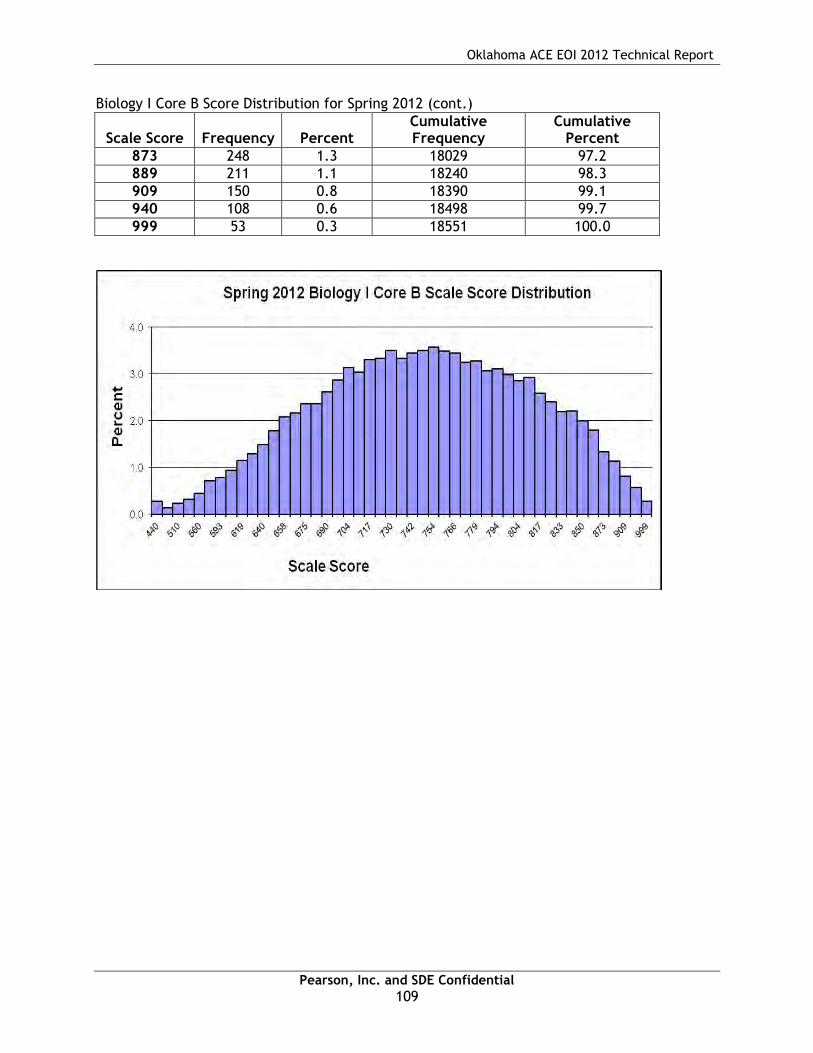
Oklahoma ACE EOI 2012 Technical Report
Pearson, Inc. and SDE Confidential
109
Biology I Core B Score Distribution for Spring 2012 (cont.)
Scale Score Frequency Percent Cumulative Frequency
Cumulative Percent
873 248 1.3 18029 97.2
889 211 1.1 18240 98.3
909 150 0.8 18390 99.1
940 108 0.6 18498 99.7
999 53 0.3 18551 100.0

Oklahoma ACE EOI 2012 Technical Report
Pearson, Inc. and SDE Confidential
110
English II Core AA Score Distribution for Spring 2012
Scale Score Frequency Percent Cumulative Frequency
Cumulative Percent
440 15 0.1 15 0.1
444 4 0.0 19 0.2
477 9 0.1 28 0.3
502 10 0.1 38 0.4
522 9 0.1 47 0.5
538 12 0.1 59 0.6
553 19 0.2 78 0.7
566 16 0.2 94 0.9
577 27 0.3 121 1.2
588 29 0.3 150 1.4
597 46 0.4 196 1.9
609 36 0.3 232 2.2
615 45 0.4 277 2.7
623 42 0.4 319 3.1
631 49 0.5 368 3.5
638 69 0.7 437 4.2
646 72 0.7 509 4.9
653 82 0.8 591 5.7
659 120 1.2 711 6.8
666 114 1.1 825 7.9
673 139 1.3 964 9.2
679 164 1.6 1128 10.8
686 171 1.6 1299 12.5
692 186 1.8 1485 14.2
700 220 2.1 1705 16.4
705 264 2.5 1969 18.9
711 238 2.3 2207 21.2
717 297 2.8 2504 24.0
724 281 2.7 2785 26.7
730 357 3.4 3142 30.1
736 385 3.7 3527 33.8
743 369 3.5 3896 37.4
749 372 3.6 4268 40.9
756 455 4.4 4723 45.3
763 490 4.7 5213 50.0
770 473 4.5 5686 54.5
777 443 4.2 6129 58.8
784 439 4.2 6568 63.0
792 482 4.6 7050 67.6
800 437 4.2 7487 71.8
817 490 4.7 7977 76.5
818 423 4.1 8400 80.6
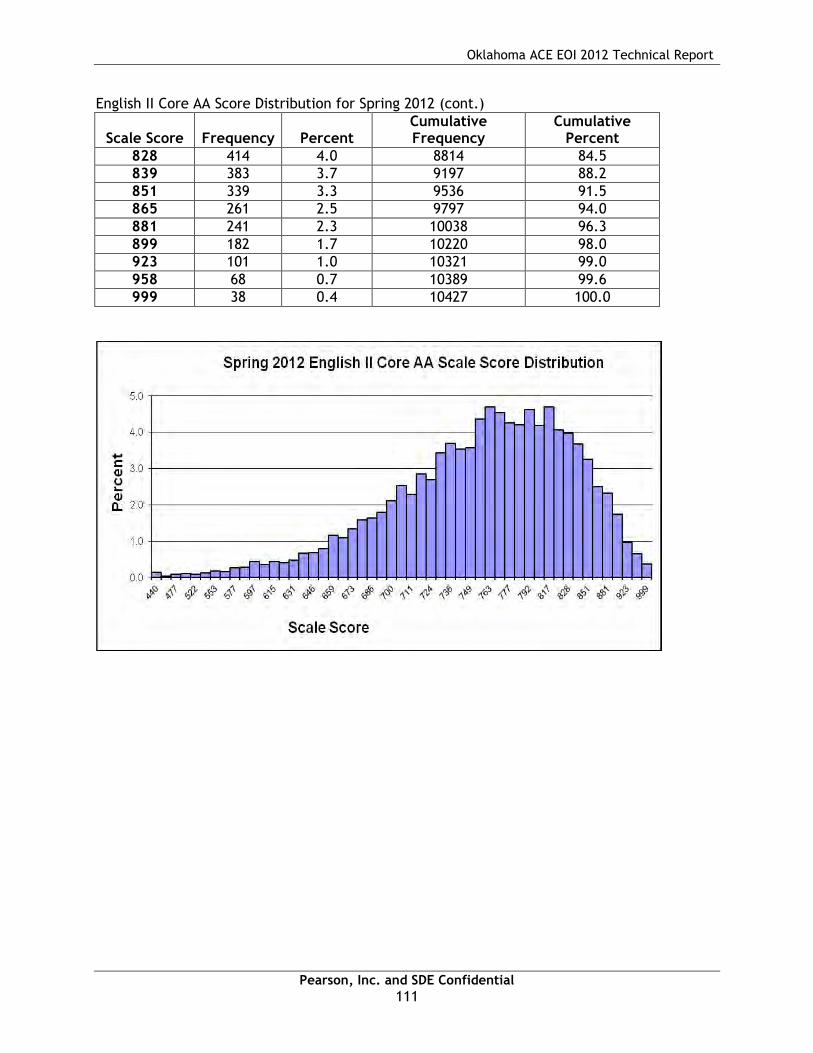
Oklahoma ACE EOI 2012 Technical Report
Pearson, Inc. and SDE Confidential
111
English II Core AA Score Distribution for Spring 2012 (cont.)
Scale Score Frequency Percent Cumulative Frequency
Cumulative Percent
828 414 4.0 8814 84.5
839 383 3.7 9197 88.2
851 339 3.3 9536 91.5
865 261 2.5 9797 94.0
881 241 2.3 10038 96.3
899 182 1.7 10220 98.0
923 101 1.0 10321 99.0
958 68 0.7 10389 99.6
999 38 0.4 10427 100.0

Oklahoma ACE EOI 2012 Technical Report
Pearson, Inc. and SDE Confidential
112
English II Core AB Score Distribution for Spring 2012
Scale Score Frequency Percent Cumulative Frequency
Cumulative Percent
440 12 0.1 12 0.1
451 6 0.1 18 0.2
480 6 0.1 24 0.2
503 8 0.1 32 0.3
522 2 0.0 34 0.3
538 18 0.2 52 0.5
552 18 0.2 70 0.7
565 18 0.2 88 0.8
576 21 0.2 109 1.0
586 14 0.1 123 1.2
596 37 0.4 160 1.5
609 40 0.4 200 1.9
614 48 0.5 248 2.4
622 36 0.3 284 2.7
629 62 0.6 346 3.3
637 57 0.5 403 3.9
644 84 0.8 487 4.7
651 90 0.9 577 5.5
658 79 0.8 656 6.3
665 130 1.3 786 7.6
672 109 1.0 895 8.6
678 159 1.5 1054 10.1
685 161 1.5 1215 11.7
691 219 2.1 1434 13.8
700 214 2.1 1648 15.8
704 229 2.2 1877 18.0
710 240 2.3 2117 20.4
716 257 2.5 2374 22.8
723 332 3.2 2706 26.0
729 336 3.2 3042 29.3
735 366 3.5 3408 32.8
742 382 3.7 3790 36.4
748 402 3.9 4192 40.3
755 455 4.4 4647 44.7
762 418 4.0 5065 48.7
768 464 4.5 5529 53.2
776 470 4.5 5999 57.7
783 478 4.6 6477 62.3
791 492 4.7 6969 67.0
799 500 4.8 7469 71.8
808 417 4.0 7886 75.8
817 454 4.4 8340 80.2

Oklahoma ACE EOI 2012 Technical Report
Pearson, Inc. and SDE Confidential
113
English II Core AB Score Distribution for Spring 2012 (cont.)
Scale Score Frequency Percent Cumulative Frequency
Cumulative Percent
827 419 4.0 8759 84.2
838 351 3.4 9110 87.6
850 344 3.3 9454 90.9
864 296 2.8 9750 93.8
879 240 2.3 9990 96.1
898 182 1.8 10172 97.8
923 116 1.1 10288 98.9
958 69 0.7 10357 99.6
999 42 0.4 10399 100.0

Oklahoma ACE EOI 2012 Technical Report
Pearson, Inc. and SDE Confidential
114
English II Core BA Score Distribution for Spring 2012
Scale Score Frequency Percent Cumulative Frequency
Cumulative Percent
440 8 0.1 8 0.1
442 1 0.0 9 0.1
472 6 0.1 15 0.2
496 3 0.0 18 0.2
515 7 0.1 25 0.3
532 12 0.2 37 0.5
547 13 0.2 50 0.7
560 15 0.2 65 0.8
571 18 0.2 83 1.1
582 24 0.3 107 1.4
592 25 0.3 132 1.7
609 27 0.4 159 2.1
610 35 0.5 194 2.5
618 31 0.4 225 2.9
626 55 0.7 280 3.7
634 51 0.7 331 4.3
642 56 0.7 387 5.1
649 66 0.9 453 5.9
656 72 0.9 525 6.9
663 72 0.9 597 7.8
670 89 1.2 686 9.0
677 91 1.2 777 10.1
684 124 1.6 901 11.8
690 157 2.0 1058 13.8
700 156 2.0 1214 15.8
704 189 2.5 1403 18.3
711 195 2.5 1598 20.9
717 207 2.7 1805 23.6
724 214 2.8 2019 26.4
731 252 3.3 2271 29.6
738 274 3.6 2545 33.2
745 307 4.0 2852 37.2
752 336 4.4 3188 41.6
759 347 4.5 3535 46.1
767 345 4.5 3880 50.6
775 344 4.5 4224 55.1
782 400 5.2 4624 60.4
791 383 5.0 5007 65.4
799 412 5.4 5419 70.7
817 384 5.0 5803 75.7
818 343 4.5 6146 80.2
828 334 4.4 6480 84.6

Oklahoma ACE EOI 2012 Technical Report
Pearson, Inc. and SDE Confidential
115
English II Core BA Score Distribution for Spring 2012 (cont.)
Scale Score Frequency Percent Cumulative Frequency
Cumulative Percent
839 295 3.9 6775 88.4
851 260 3.4 7035 91.8
865 216 2.8 7251 94.6
880 160 2.1 7411 96.7
899 120 1.6 7531 98.3
922 69 0.9 7600 99.2
954 46 0.6 7646 99.8
999 15 0.2 7661 100.0

Oklahoma ACE EOI 2012 Technical Report
Pearson, Inc. and SDE Confidential
116
English II Core BB Score Distribution for Spring 2012
Scale Score Frequency Percent Cumulative Frequency
Cumulative Percent
440 11 0.1 11 0.1
449 2 0.0 13 0.2
476 4 0.1 17 0.2
498 1 0.0 18 0.2
516 10 0.1 28 0.4
532 6 0.1 34 0.4
546 14 0.2 48 0.6
559 14 0.2 62 0.8
570 14 0.2 76 1.0
581 17 0.2 93 1.2
591 21 0.3 114 1.5
600 20 0.3 134 1.7
609 30 0.4 164 2.1
617 42 0.5 206 2.7
625 39 0.5 245 3.2
633 47 0.6 292 3.8
640 52 0.7 344 4.4
647 57 0.7 401 5.2
655 60 0.8 461 6.0
662 77 1.0 538 6.9
669 87 1.1 625 8.1
675 105 1.4 730 9.4
682 110 1.4 840 10.8
689 132 1.7 972 12.5
700 150 1.9 1122 14.5
703 163 2.1 1285 16.6
709 192 2.5 1477 19.1
716 216 2.8 1693 21.9
723 272 3.5 1965 25.4
730 272 3.5 2237 28.9
737 258 3.3 2495 32.2
744 276 3.6 2771 35.8
751 303 3.9 3074 39.7
758 305 3.9 3379 43.6
766 364 4.7 3743 48.3
773 385 5.0 4128 53.3
781 369 4.8 4497 58.0
789 380 4.9 4877 63.0
798 407 5.3 5284 68.2
807 359 4.6 5643 72.8
817 382 4.9 6025 77.8
826 357 4.6 6382 82.4

Oklahoma ACE EOI 2012 Technical Report
Pearson, Inc. and SDE Confidential
117
English II Core BB Score Distribution for Spring 2012 (cont.)
Scale Score Frequency Percent Cumulative Frequency
Cumulative Percent
837 327 4.2 6709 86.6
850 288 3.7 6997 90.3
863 231 3.0 7228 93.3
879 217 2.8 7445 96.1
898 140 1.8 7585 97.9
921 108 1.4 7693 99.3
953 33 0.4 7726 99.7
999 21 0.3 7747 100.0

Oklahoma ACE EOI 2012 Technical Report
Pearson, Inc. and SDE Confidential
118
English III Core AA Score Distribution for Spring 2012
Scale Score Frequency Percent Cumulative Frequency
Cumulative Percent
440 18 0.2 18 0.2
496 14 0.1 32 0.3
528 12 0.1 44 0.4
551 23 0.2 67 0.7
568 29 0.3 96 1.0
581 29 0.3 125 1.3
593 39 0.4 164 1.7
603 50 0.5 214 2.2
612 50 0.5 264 2.7
621 69 0.7 333 3.4
628 65 0.7 398 4.0
635 68 0.7 466 4.7
642 80 0.8 546 5.5
649 71 0.7 617 6.3
655 84 0.9 701 7.1
661 90 0.9 791 8.0
670 90 0.9 881 8.9
672 93 0.9 974 9.9
677 125 1.3 1099 11.2
682 123 1.2 1222 12.4
687 154 1.6 1376 14.0
692 135 1.4 1511 15.3
700 170 1.7 1681 17.1
702 189 1.9 1870 19.0
707 217 2.2 2087 21.2
712 190 1.9 2277 23.1
717 236 2.4 2513 25.5
722 244 2.5 2757 28.0
727 267 2.7 3024 30.7
732 291 3.0 3315 33.7
737 276 2.8 3591 36.5
741 310 3.1 3901 39.6
746 348 3.5 4249 43.2
752 353 3.6 4602 46.7
757 354 3.6 4956 50.3
762 349 3.5 5305 53.9
767 348 3.5 5653 57.4
772 364 3.7 6017 61.1
778 383 3.9 6400 65.0
783 353 3.6 6753 68.6
789 364 3.7 7117 72.3

Oklahoma ACE EOI 2012 Technical Report
Pearson, Inc. and SDE Confidential
119
English III Core AA Score Distribution for Spring 2012 (cont.)
Scale Score Frequency Percent Cumulative Frequency
Cumulative Percent
794 349 3.5 7466 75.8
802 318 3.2 7784 79.1
806 306 3.1 8090 82.2
812 293 3.0 8383 85.1
819 271 2.8 8654 87.9
825 221 2.2 8875 90.1
832 207 2.1 9082 92.2
839 162 1.6 9244 93.9
847 138 1.4 9382 95.3
855 132 1.3 9514 96.6
864 118 1.2 9632 97.8
874 78 0.8 9710 98.6
885 58 0.6 9768 99.2
898 39 0.4 9807 99.6
915 20 0.2 9827 99.8
937 11 0.1 9838 99.9
971 5 0.1 9843 100.0
999 2 0.0 9845 100.0
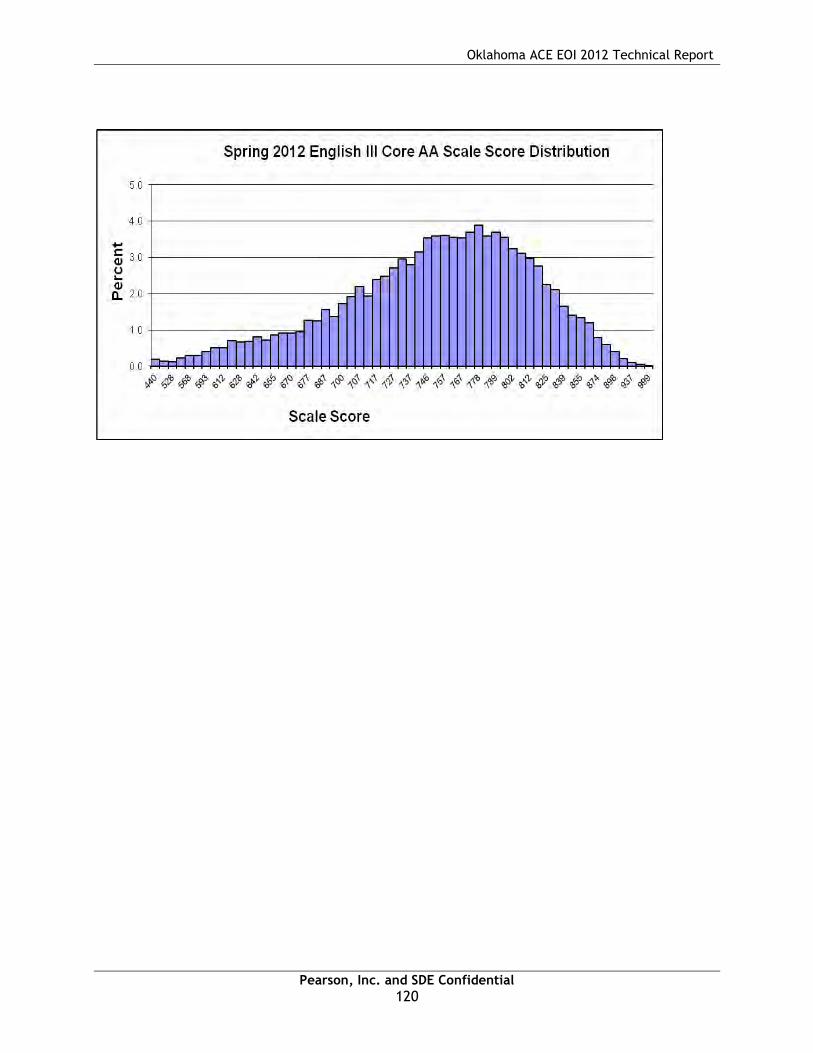
Oklahoma ACE EOI 2012 Technical Report
Pearson, Inc. and SDE Confidential
120

Oklahoma ACE EOI 2012 Technical Report
Pearson, Inc. and SDE Confidential
121
English III Core AB Score Distribution for Spring 2012
Scale Score Frequency Percent Cumulative Frequency
Cumulative Percent
440 21 0.2 21 0.2
494 11 0.1 32 0.3
525 21 0.2 53 0.5
546 16 0.2 69 0.7
563 22 0.2 91 0.9
576 28 0.3 119 1.2
588 39 0.4 158 1.6
599 36 0.4 194 2.0
608 58 0.6 252 2.6
617 64 0.7 316 3.3
625 80 0.8 396 4.1
633 66 0.7 462 4.8
640 80 0.8 542 5.6
646 86 0.9 628 6.5
653 101 1.0 729 7.5
659 101 1.0 830 8.5
664 85 0.9 915 9.4
670 112 1.2 1027 10.6
676 115 1.2 1142 11.8
681 133 1.4 1275 13.1
686 127 1.3 1402 14.4
691 132 1.4 1534 15.8
700 183 1.9 1717 17.7
701 168 1.7 1885 19.4
706 197 2.0 2082 21.4
711 208 2.1 2290 23.6
716 237 2.4 2527 26.0
721 222 2.3 2749 28.3
726 248 2.6 2997 30.8
731 278 2.9 3275 33.7
736 307 3.2 3582 36.9
741 364 3.7 3946 40.6
746 328 3.4 4274 44.0
752 318 3.3 4592 47.3
757 356 3.7 4948 50.9
762 338 3.5 5286 54.4
767 363 3.7 5649 58.1
773 373 3.8 6022 62.0
778 354 3.6 6376 65.6
784 350 3.6 6726 69.2
790 343 3.5 7069 72.8

Oklahoma ACE EOI 2012 Technical Report
Pearson, Inc. and SDE Confidential
122
English III Core AB Score Distribution for Spring 2012 (cont.)
Scale Score Frequency Percent Cumulative Frequency
Cumulative Percent
796 326 3.4 7395 76.1
802 294 3.0 7689 79.1
808 311 3.2 8000 82.3
814 298 3.1 8298 85.4
821 269 2.8 8567 88.2
828 224 2.3 8791 90.5
835 205 2.1 8996 92.6
843 178 1.8 9174 94.4
851 156 1.6 9330 96.0
859 125 1.3 9455 97.3
868 88 0.9 9543 98.2
879 65 0.7 9608 98.9
890 52 0.5 9660 99.4
904 21 0.2 9681 99.7
920 16 0.2 9697 99.8
941 10 0.1 9707 99.9
974 5 0.1 9712 100.0
999 3 0.0 9715 100.0
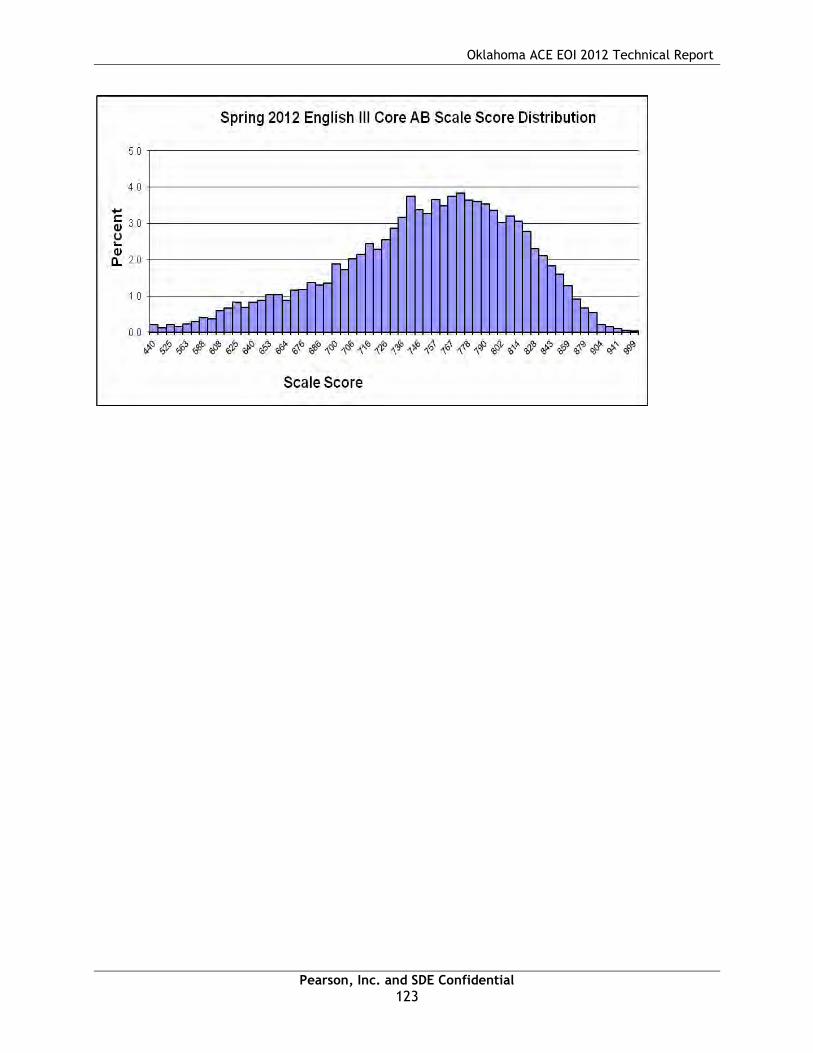
Oklahoma ACE EOI 2012 Technical Report
Pearson, Inc. and SDE Confidential
123

Oklahoma ACE EOI 2012 Technical Report
Pearson, Inc. and SDE Confidential
124
English III Core BA Score Distribution for Spring 2012
Scale Score Frequency Percent Cumulative Frequency
Cumulative Percent
440 9 0.1 9 0.1
442 1 0.0 10 0.1
511 15 0.2 25 0.3
542 9 0.1 34 0.4
563 10 0.1 44 0.5
578 20 0.2 64 0.8
591 19 0.2 83 1.0
602 28 0.3 111 1.3
611 23 0.3 134 1.6
620 25 0.3 159 1.9
628 47 0.6 206 2.4
635 41 0.5 247 2.9
642 46 0.5 293 3.5
648 52 0.6 345 4.1
654 54 0.6 399 4.7
660 64 0.8 463 5.5
670 66 0.8 529 6.2
671 86 1.0 615 7.2
677 89 1.0 704 8.3
682 106 1.2 810 9.5
687 118 1.4 928 10.9
692 122 1.4 1050 12.4
700 127 1.5 1177 13.9
702 131 1.5 1308 15.4
706 151 1.8 1459 17.2
711 153 1.8 1612 19.0
716 190 2.2 1802 21.2
720 217 2.6 2019 23.8
725 232 2.7 2251 26.5
730 225 2.7 2476 29.2
734 252 3.0 2728 32.1
739 263 3.1 2991 35.2
743 295 3.5 3286 38.7
748 308 3.6 3594 42.3
752 281 3.3 3875 45.7
757 301 3.5 4176 49.2
762 294 3.5 4470 52.7
766 301 3.5 4771 56.2
771 336 4.0 5107 60.2
776 295 3.5 5402 63.6
781 292 3.4 5694 67.1

Oklahoma ACE EOI 2012 Technical Report
Pearson, Inc. and SDE Confidential
125
English III Core BA Score Distribution for Spring 2012 (cont.)
Scale Score Frequency Percent Cumulative Frequency
Cumulative Percent
786 284 3.3 5978 70.4
791 270 3.2 6248 73.6
796 253 3.0 6501 76.6
802 231 2.7 6732 79.3
807 222 2.6 6954 81.9
812 218 2.6 7172 84.5
818 214 2.5 7386 87.0
825 157 1.8 7543 88.9
831 178 2.1 7721 91.0
838 148 1.7 7869 92.7
845 134 1.6 8003 94.3
853 117 1.4 8120 95.7
861 110 1.3 8230 97.0
871 89 1.0 8319 98.0
882 62 0.7 8381 98.7
896 49 0.6 8430 99.3
913 29 0.3 8459 99.7
938 19 0.2 8478 99.9
984 7 0.1 8485 100.0
999 3 0.0 8488 100.0
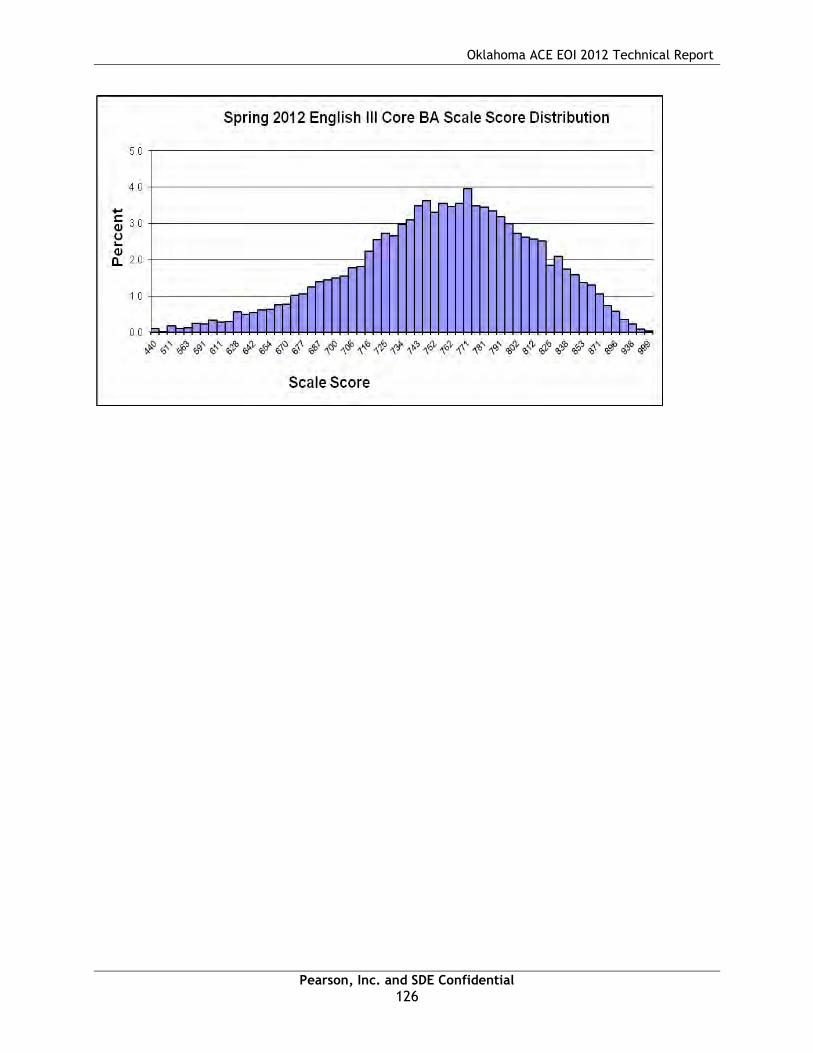
Oklahoma ACE EOI 2012 Technical Report
Pearson, Inc. and SDE Confidential
126
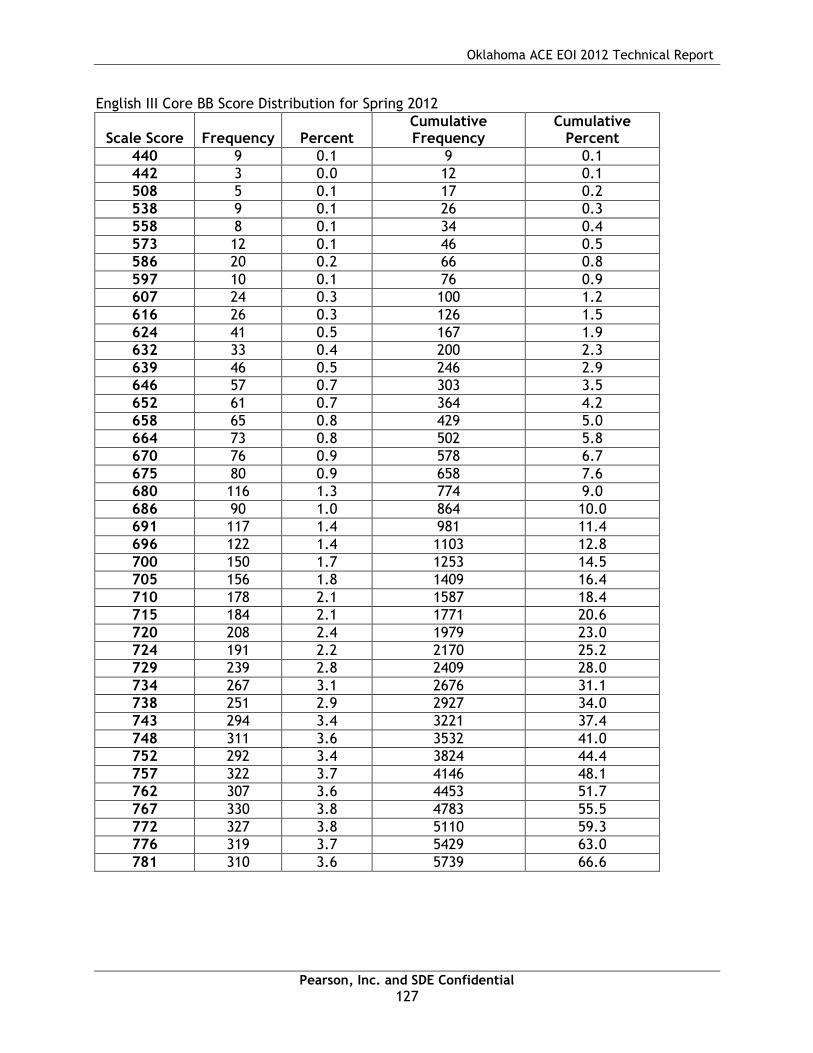
Oklahoma ACE EOI 2012 Technical Report
Pearson, Inc. and SDE Confidential
127
English III Core BB Score Distribution for Spring 2012
Scale Score Frequency Percent Cumulative Frequency
Cumulative Percent
440 9 0.1 9 0.1
442 3 0.0 12 0.1
508 5 0.1 17 0.2
538 9 0.1 26 0.3
558 8 0.1 34 0.4
573 12 0.1 46 0.5
586 20 0.2 66 0.8
597 10 0.1 76 0.9
607 24 0.3 100 1.2
616 26 0.3 126 1.5
624 41 0.5 167 1.9
632 33 0.4 200 2.3
639 46 0.5 246 2.9
646 57 0.7 303 3.5
652 61 0.7 364 4.2
658 65 0.8 429 5.0
664 73 0.8 502 5.8
670 76 0.9 578 6.7
675 80 0.9 658 7.6
680 116 1.3 774 9.0
686 90 1.0 864 10.0
691 117 1.4 981 11.4
696 122 1.4 1103 12.8
700 150 1.7 1253 14.5
705 156 1.8 1409 16.4
710 178 2.1 1587 18.4
715 184 2.1 1771 20.6
720 208 2.4 1979 23.0
724 191 2.2 2170 25.2
729 239 2.8 2409 28.0
734 267 3.1 2676 31.1
738 251 2.9 2927 34.0
743 294 3.4 3221 37.4
748 311 3.6 3532 41.0
752 292 3.4 3824 44.4
757 322 3.7 4146 48.1
762 307 3.6 4453 51.7
767 330 3.8 4783 55.5
772 327 3.8 5110 59.3
776 319 3.7 5429 63.0
781 310 3.6 5739 66.6
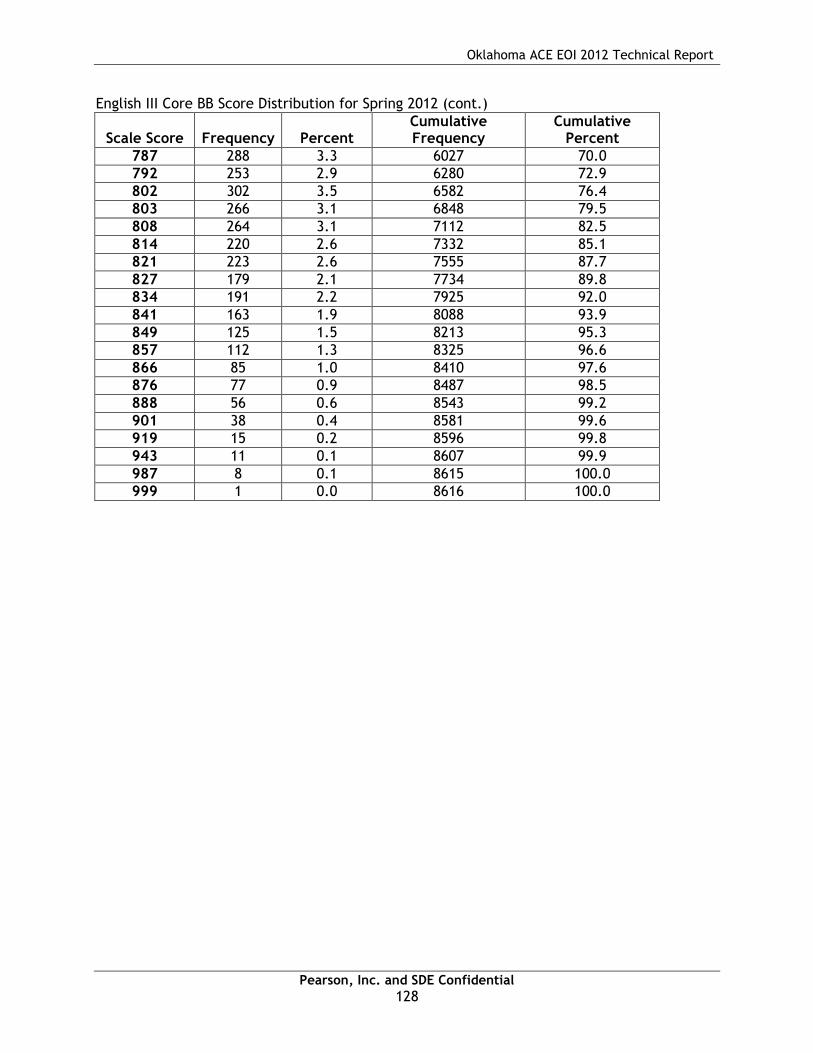
Oklahoma ACE EOI 2012 Technical Report
Pearson, Inc. and SDE Confidential
128
English III Core BB Score Distribution for Spring 2012 (cont.)
Scale Score Frequency Percent Cumulative Frequency
Cumulative Percent
787 288 3.3 6027 70.0
792 253 2.9 6280 72.9
802 302 3.5 6582 76.4
803 266 3.1 6848 79.5
808 264 3.1 7112 82.5
814 220 2.6 7332 85.1
821 223 2.6 7555 87.7
827 179 2.1 7734 89.8
834 191 2.2 7925 92.0
841 163 1.9 8088 93.9
849 125 1.5 8213 95.3
857 112 1.3 8325 96.6
866 85 1.0 8410 97.6
876 77 0.9 8487 98.5
888 56 0.6 8543 99.2
901 38 0.4 8581 99.6
919 15 0.2 8596 99.8
943 11 0.1 8607 99.9
987 8 0.1 8615 100.0
999 1 0.0 8616 100.0

Oklahoma ACE EOI 2012 Technical Report
Pearson, Inc. and SDE Confidential
129

Oklahoma ACE EOI 2012 Technical Report
Pearson, Inc. and SDE Confidential
130
Geometry Core A Score Distribution for Spring 2012
Scale Score Frequency Percent Cumulative Frequency
Cumulative Percent
440 65 0.3 65 0.3
487 55 0.3 120 0.6
528 80 0.4 200 1.0
555 91 0.5 291 1.5
574 128 0.7 419 2.2
590 173 0.9 592 3.1
603 146 0.8 738 3.8
615 184 1.0 922 4.8
625 226 1.2 1148 6.0
635 199 1.0 1347 7.0
642 199 1.0 1546 8.0
650 242 1.3 1788 9.3
658 298 1.5 2086 10.8
664 266 1.4 2352 12.2
671 247 1.3 2599 13.5
677 325 1.7 2924 15.2
684 292 1.5 3216 16.7
689 342 1.8 3558 18.5
700 382 2.0 3940 20.4
701 364 1.9 4304 22.3
706 382 2.0 4686 24.3
711 362 1.9 5048 26.2
716 478 2.5 5526 28.7
721 472 2.4 5998 31.1
726 489 2.5 6487 33.7
731 481 2.5 6968 36.1
736 592 3.1 7560 39.2
741 551 2.9 8111 42.1
746 623 3.2 8734 45.3
751 590 3.1 9324 48.4
757 662 3.4 9986 51.8
762 631 3.3 10617 55.1
767 654 3.4 11271 58.5
777 690 3.6 11961 62.1
778 698 3.6 12659 65.7
784 763 4.0 13422 69.6
791 742 3.8 14164 73.5
798 792 4.1 14956 77.6
805 759 3.9 15715 81.5
814 689 3.6 16404 85.1
824 696 3.6 17100 88.7
836 714 3.7 17814 92.4

Oklahoma ACE EOI 2012 Technical Report
Pearson, Inc. and SDE Confidential
131
Geometry Core A Score Distribution for Spring 2012 (cont.)
Scale Score Frequency Percent Cumulative Frequency
Cumulative Percent
852 567 2.9 18381 95.4
875 475 2.5 18856 97.8
918 295 1.5 19151 99.4
999 125 0.6 19276 100.0

Oklahoma ACE EOI 2012 Technical Report
Pearson, Inc. and SDE Confidential
132
Geometry Core B Score Distribution for Spring 2012
Scale Score Frequency Percent Cumulative Frequency
Cumulative Percent
440 28 0.2 28 0.2
475 25 0.1 53 0.3
521 37 0.2 90 0.5
550 71 0.4 161 0.9
571 74 0.4 235 1.3
587 90 0.5 325 1.8
601 116 0.6 441 2.5
613 144 0.8 585 3.3
624 171 1.0 756 4.2
635 169 0.9 925 5.2
642 181 1.0 1106 6.2
650 205 1.1 1311 7.3
658 220 1.2 1531 8.5
665 233 1.3 1764 9.8
672 242 1.3 2006 11.2
678 280 1.6 2286 12.7
684 313 1.7 2599 14.5
690 292 1.6 2891 16.1
700 346 1.9 3237 18.0
701 386 2.2 3623 20.2
707 414 2.3 4037 22.5
712 430 2.4 4467 24.9
717 458 2.6 4925 27.4
722 515 2.9 5440 30.3
727 497 2.8 5937 33.1
732 514 2.9 6451 36.0
737 580 3.2 7031 39.2
743 581 3.2 7612 42.4
748 573 3.2 8185 45.6
753 607 3.4 8792 49.0
758 602 3.4 9394 52.4
763 653 3.6 10047 56.0
769 712 4.0 10759 60.0
777 671 3.7 11430 63.7
781 680 3.8 12110 67.5
787 695 3.9 12805 71.4
794 708 3.9 13513 75.3
801 776 4.3 14289 79.6
809 703 3.9 14992 83.5
818 656 3.7 15648 87.2
829 625 3.5 16273 90.7
842 567 3.2 16840 93.8

Oklahoma ACE EOI 2012 Technical Report
Pearson, Inc. and SDE Confidential
133
Geometry Core B Score Distribution for Spring 2012 (cont.)
Scale Score Frequency Percent Cumulative Frequency
Cumulative Percent
859 469 2.6 17309 96.5
884 348 1.9 17657 98.4
931 205 1.1 17862 99.5
999 82 0.5 17944 100.0

Oklahoma ACE EOI 2012 Technical Report
Pearson, Inc. and SDE Confidential
134
U.S. History Core A Score Distribution for Spring 2012
Scale Score Frequency Percent Cumulative Frequency
Cumulative Percent
440 80 0.5 80 0.5
475 55 0.3 135 0.8
518 64 0.4 199 1.2
547 106 0.6 305 1.8
568 99 0.6 404 2.3
584 139 0.8 543 3.1
598 191 1.1 734 4.3
610 145 0.8 879 5.1
627 188 1.1 1067 6.2
630 255 1.5 1322 7.7
639 239 1.4 1561 9.0
647 269 1.6 1830 10.6
654 283 1.6 2113 12.2
661 326 1.9 2439 14.1
668 349 2.0 2788 16.2
675 385 2.2 3173 18.4
681 366 2.1 3539 20.5
687 429 2.5 3968 23.0
693 404 2.3 4372 25.3
700 501 2.9 4873 28.2
705 509 2.9 5382 31.2
711 557 3.2 5939 34.4
716 523 3.0 6462 37.4
722 543 3.1 7005 40.6
728 598 3.5 7603 44.0
733 622 3.6 8225 47.7
739 649 3.8 8874 51.4
745 647 3.7 9521 55.2
751 641 3.7 10162 58.9
757 592 3.4 10754 62.3
763 653 3.8 11407 66.1
773 620 3.6 12027 69.7
775 584 3.4 12611 73.1
782 567 3.3 13178 76.3
789 579 3.4 13757 79.7
796 540 3.1 14297 82.8
804 499 2.9 14796 85.7
812 386 2.2 15182 88.0
820 444 2.6 15626 90.5
830 397 2.3 16023 92.8
840 346 2.0 16369 94.8
852 290 1.7 16659 96.5

Oklahoma ACE EOI 2012 Technical Report
Pearson, Inc. and SDE Confidential
135
U.S. History Core A Score Distribution for Spring 2012 (cont.)
Scale Score Frequency Percent Cumulative Frequency
Cumulative Percent
866 224 1.3 16883 97.8
883 161 0.9 17044 98.7
905 109 0.6 17153 99.4
938 74 0.4 17227 99.8
999 34 0.2 17261 100.0

Oklahoma ACE EOI 2012 Technical Report
Pearson, Inc. and SDE Confidential
136
U.S. History Core B Score Distribution for Spring 2012
Scale Score Frequency Percent Cumulative Frequency
Cumulative Percent
440 98 0.6 98 0.6
473 55 0.3 153 0.9
519 61 0.4 214 1.3
548 81 0.5 295 1.8
569 103 0.6 398 2.4
586 114 0.7 512 3.1
600 146 0.9 658 3.9
612 160 1.0 818 4.9
627 192 1.1 1010 6.0
632 206 1.2 1216 7.2
641 220 1.3 1436 8.6
649 253 1.5 1689 10.1
656 265 1.6 1954 11.6
663 312 1.9 2266 13.5
670 327 1.9 2593 15.5
676 370 2.2 2963 17.7
682 371 2.2 3334 19.9
688 416 2.5 3750 22.4
694 414 2.5 4164 24.8
700 453 2.7 4617 27.5
705 479 2.9 5096 30.4
711 476 2.8 5572 33.2
716 477 2.8 6049 36.1
722 484 2.9 6533 38.9
727 496 3.0 7029 41.9
733 538 3.2 7567 45.1
738 565 3.4 8132 48.5
744 573 3.4 8705 51.9
750 569 3.4 9274 55.3
755 616 3.7 9890 59.0
761 570 3.4 10460 62.4
773 570 3.4 11030 65.8
774 596 3.6 11626 69.3
780 593 3.5 12219 72.8
787 586 3.5 12805 76.3
794 558 3.3 13363 79.7
801 515 3.1 13878 82.7
808 559 3.3 14437 86.1
816 459 2.7 14896 88.8
825 407 2.4 15303 91.2
835 370 2.2 15673 93.4
846 379 2.3 16052 95.7

Oklahoma ACE EOI 2012 Technical Report
Pearson, Inc. and SDE Confidential
137
U.S. History Core B Score Distribution for Spring 2012 (cont.)
Scale Score Frequency Percent Cumulative Frequency
Cumulative Percent
859 261 1.6 16313 97.3
876 219 1.3 16532 98.6
899 117 0.7 16649 99.3
934 82 0.5 16731 99.7
999 43 0.3 16774 100.0