![The Courage to Change[2] · 2020. 5. 20. · 14 APRIL THE COURAGE TO CHANGE: WISDOM FROM ASSISI Live-Streamed Talk 7pm Turning to Assisi for wisdom in challenging times, Gillian Ahlgren,](https://static.fdocuments.in/doc/165x107/5fe812790fe5176ae369c024/the-courage-to-change2-2020-5-20-14-april-the-courage-to-change-wisdom-from.jpg)
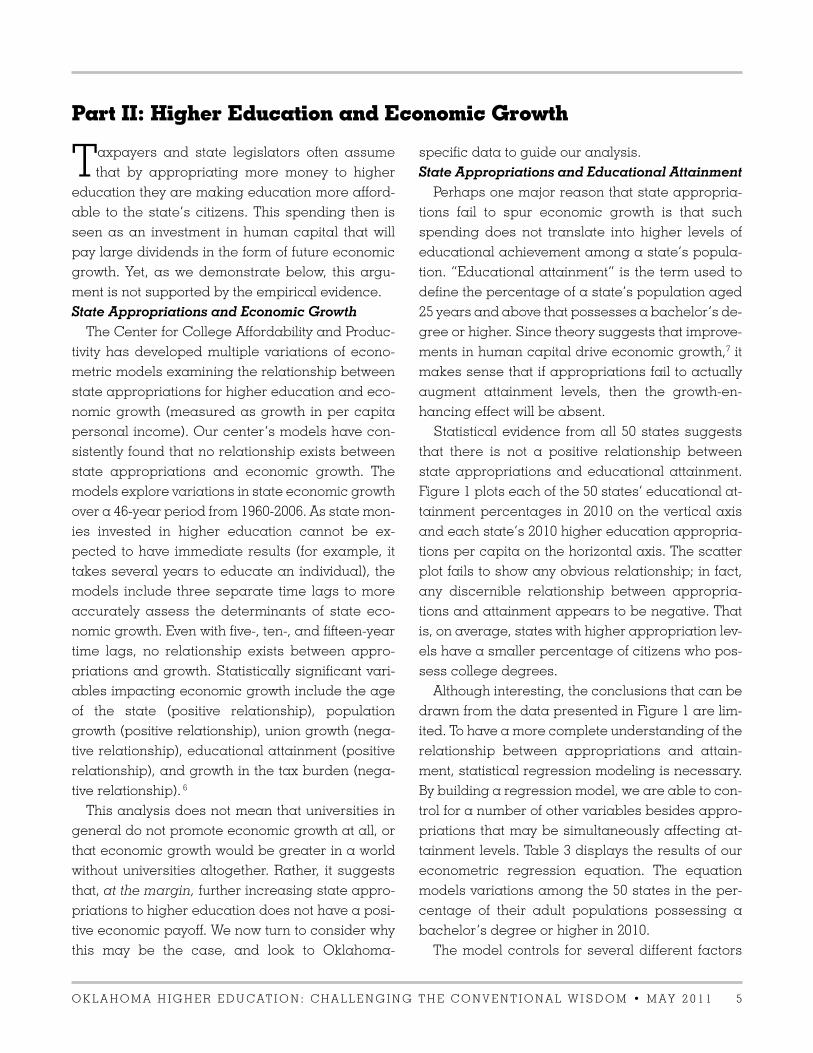
Oklahoma Higher Education: Challenging the Conventional Wisdom
16
June 2011 Oklahoma Council of Public Affairs
description
Â
Transcript of Oklahoma Higher Education: Challenging the Conventional Wisdom
June 2011
Oklahoma Councilof Public Affairs
About OCPA
The Oklahoma Council of Public Affairs (OCPA) is an independent,
nonprofit public policy organization—a think tank—that formulates
and promotes public policy research and analysis consistent with the
principles of free enterprise and limited government.
About CCAP
The Center for College Affordability and Productivity (CCAP) is an
independent, nonprofit research center based in Washington, D.C.,
that is dedicated to researching public policy and economic issues
relating to postsecondary education. CCAP aims to facilitate a broader
dialogue that challenges conventional thinking about costs, efficiency,
and innovation in postsecondary education in the United States.
OCPA’s speakers don’t disappoint.OCPA’s speakers don’t disappoint.
O K L A H O M A H I G H E R E D U C A T I O N : C H A L L E N G I N G T H E C O N V E N T I O N A L W I S D O M • M A Y 2 0 1 1 1
Foreword
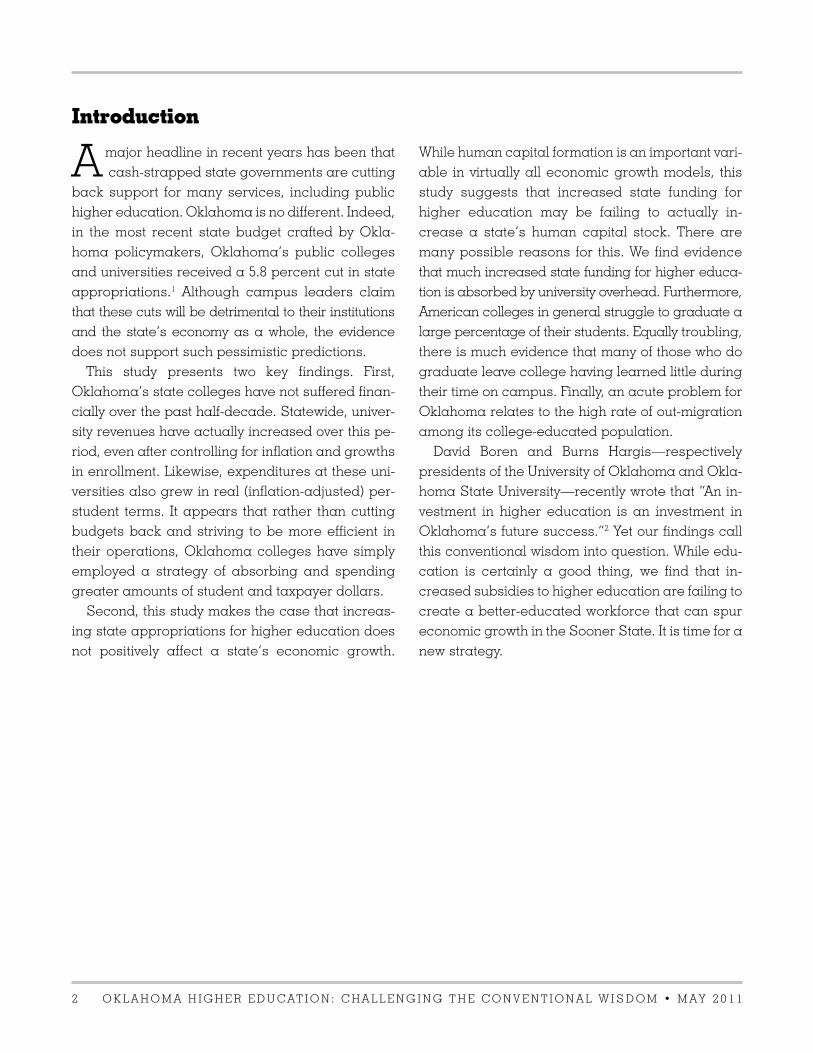
system of higher education. Rather, this study ex-
plores the connection between increased state ap-
propriations for higher education and economic
growth. Challenging the conventional wisdom, this
study finds no connection between the two. This does
not necessarily mean that universities do not promote
economic growth at all, or that growth would be
greater in a world totally absent of higher education.
But the evidence does show that, at the margin, ap-
propriating additional dollars to higher education
does not deliver increased economic prosperity.
It is our hope that this study will serve as a useful
guide to Oklahoma policymakers and citizens alike.
It is important that public policy debates rely on
empirical evidence rather than on just common as-
sumptions. I think you will find this report informa-
tive, and I look forward to hearing your feedback.
—Richard Vedder
Like most states, Oklahoma is facing tough times
funding public services. In such an environ-
ment, it is necessary to ask: Are we doing the right
things? Are we doing them in the best, most efficient
ways?
An important area of public service provision is
higher education. In evaluating current public
policy relating to Oklahoma’s system of higher edu-
cation, it is appropriate to review how the system
has evolved over time. What has happened to costs
over time? Has the system achieved stated objec-
tives, for example, increasing the rate of economic
growth? Are there unique or unusual aspects of
Oklahoma’s system that might be worth scrutiniz-
ing as the state seeks to more efficiently use tax-
payer dollars?
This study addresses most of these questions.
However, it is not simply a review of Oklahoma’s
2 O K L A H O M A H I G H E R E D U C A T I O N : C H A L L E N G I N G T H E C O N V E N T I O N A L W I S D O M • M A Y 2 0 1 1
Introduction
A major headline in recent years has been that
cash-strapped state governments are cutting
back support for many services, including public
higher education. Oklahoma is no different. Indeed,
in the most recent state budget crafted by Okla-
homa policymakers, Oklahoma’s public colleges
and universities received a 5.8 percent cut in state
appropriations.1 Although campus leaders claim
that these cuts will be detrimental to their institutions
and the state’s economy as a whole, the evidence
does not support such pessimistic predictions.
This study presents two key findings. First,
Oklahoma’s state colleges have not suffered finan-
cially over the past half-decade. Statewide, univer-
sity revenues have actually increased over this pe-
riod, even after controlling for inflation and growths
in enrollment. Likewise, expenditures at these uni-
versities also grew in real (inflation-adjusted) per-
student terms. It appears that rather than cutting
budgets back and striving to be more efficient in
their operations, Oklahoma colleges have simply
employed a strategy of absorbing and spending
greater amounts of student and taxpayer dollars.
Second, this study makes the case that increas-
ing state appropriations for higher education does
not positively affect a state’s economic growth.
While human capital formation is an important vari-
able in virtually all economic growth models, this
study suggests that increased state funding for
higher education may be failing to actually in-
crease a state’s human capital stock. There are
many possible reasons for this. We find evidence
that much increased state funding for higher educa-
tion is absorbed by university overhead. Furthermore,
American colleges in general struggle to graduate a
large percentage of their students. Equally troubling,
there is much evidence that many of those who do
graduate leave college having learned little during
their time on campus. Finally, an acute problem for
Oklahoma relates to the high rate of out-migration
among its college-educated population.
David Boren and Burns Hargis—respectively
presidents of the University of Oklahoma and Okla-
homa State University—recently wrote that “An in-
vestment in higher education is an investment in
Oklahoma’s future success.”2 Yet our findings call
this conventional wisdom into question. While edu-
cation is certainly a good thing, we find that in-
creased subsidies to higher education are failing to
create a better-educated workforce that can spur
economic growth in the Sooner State. It is time for a
new strategy.
O K L A H O M A H I G H E R E D U C A T I O N : C H A L L E N G I N G T H E C O N V E N T I O N A L W I S D O M • M A Y 2 0 1 1 3
Part I: Revenues and Expenditures at Oklahoma’s Public Universities
In 1980, Howard Bowen defined the “revenue
theory of cost” to explain the spending pattern of
universities. The theory explains that universities
tend to spend all of the financial resources avail-
able to them. Rather than budgeting based on a
strategy of cutting costs, universities instead focus
on augmenting revenues to the highest degree pos-
sible, and then spending all those resources. Thus,
further increasing universities’ revenues will simply
lead to higher costs and will fuel a cycle that ab-
sorbs more and more resources.3, 4
Revenue and expense data for Oklahoma’s pub-
lic universities during the past half-decade suggest
that the “Bowen Rule” is at work in the Sooner
State. All postsecondary institutions in the United
States that receive federal support are required to
report financial data to the U.S. Department of Edu-
cation. Included below are data on total revenues
and expenses, and examining these data illuminates
the financial trends of colleges and universities.
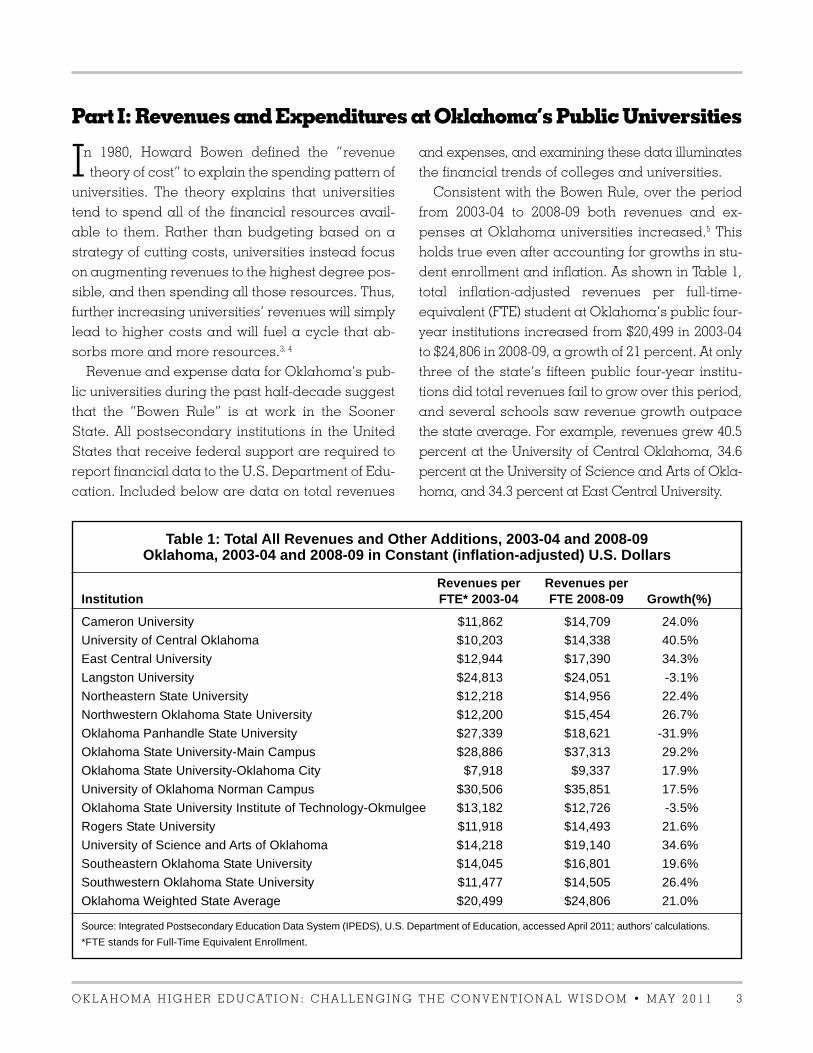
Consistent with the Bowen Rule, over the period
from 2003-04 to 2008-09 both revenues and ex-
penses at Oklahoma universities increased.5 This
holds true even after accounting for growths in stu-
dent enrollment and inflation. As shown in Table 1,
total inflation-adjusted revenues per full-time-
equivalent (FTE) student at Oklahoma’s public four-
year institutions increased from $20,499 in 2003-04
to $24,806 in 2008-09, a growth of 21 percent. At only
three of the state’s fifteen public four-year institu-
tions did total revenues fail to grow over this period,
and several schools saw revenue growth outpace
the state average. For example, revenues grew 40.5
percent at the University of Central Oklahoma, 34.6
percent at the University of Science and Arts of Okla-
homa, and 34.3 percent at East Central University.
Table 1: Total All Revenues and Other Additions, 2003-04 and 2008-09Oklahoma, 2003-04 and 2008-09 in Constant (inflation-adjusted) U.S. Dollars
Revenues per Revenues perInstitution FTE* 2003-04 FTE 2008-09 Growth(%)
Cameron University $11,862 $14,709 24.0%
University of Central Oklahoma $10,203 $14,338 40.5%
East Central University $12,944 $17,390 34.3%
Langston University $24,813 $24,051 -3.1%
Northeastern State University $12,218 $14,956 22.4%
Northwestern Oklahoma State University $12,200 $15,454 26.7%
Oklahoma Panhandle State University $27,339 $18,621 -31.9%
Oklahoma State University-Main Campus $28,886 $37,313 29.2%
Oklahoma State University-Oklahoma City $7,918 $9,337 17.9%
University of Oklahoma Norman Campus $30,506 $35,851 17.5%
Oklahoma State University Institute of Technology-Okmulgee $13,182 $12,726 -3.5%
Rogers State University $11,918 $14,493 21.6%
University of Science and Arts of Oklahoma $14,218 $19,140 34.6%
Southeastern Oklahoma State University $14,045 $16,801 19.6%
Southwestern Oklahoma State University $11,477 $14,505 26.4%
Oklahoma Weighted State Average $20,499 $24,806 21.0%
Source: Integrated Postsecondary Education Data System (IPEDS), U.S. Department of Education, accessed April 2011; authors’ calculations.
*FTE stands for Full-Time Equivalent Enrollment.
4 O K L A H O M A H I G H E R E D U C A T I O N : C H A L L E N G I N G T H E C O N V E N T I O N A L W I S D O M • M A Y 2 0 1 1
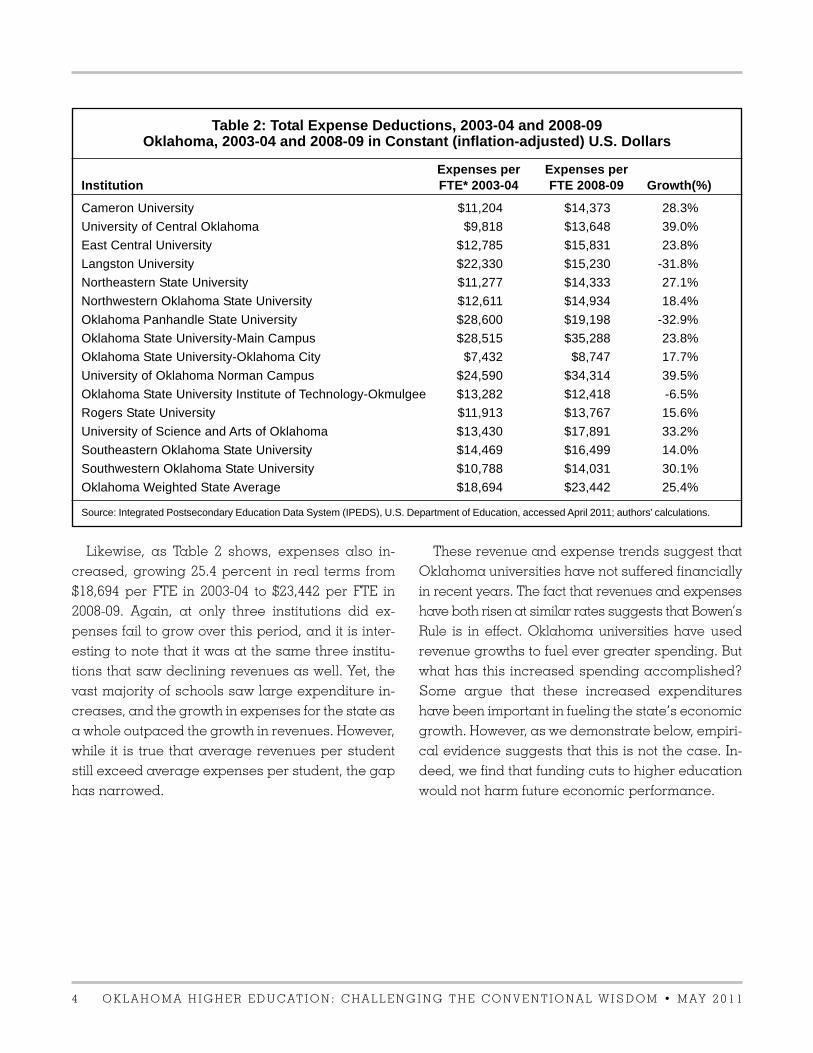
Likewise, as Table 2 shows, expenses also in-
creased, growing 25.4 percent in real terms from
$18,694 per FTE in 2003-04 to $23,442 per FTE in
2008-09. Again, at only three institutions did ex-
penses fail to grow over this period, and it is inter-
esting to note that it was at the same three institu-
tions that saw declining revenues as well. Yet, the
vast majority of schools saw large expenditure in-
creases, and the growth in expenses for the state as
a whole outpaced the growth in revenues. However,
while it is true that average revenues per student
still exceed average expenses per student, the gap
has narrowed.
These revenue and expense trends suggest that
Oklahoma universities have not suffered financially
in recent years. The fact that revenues and expenses
have both risen at similar rates suggests that Bowen’s
Rule is in effect. Oklahoma universities have used
revenue growths to fuel ever greater spending. But
what has this increased spending accomplished?
Some argue that these increased expenditures
have been important in fueling the state’s economic
growth. However, as we demonstrate below, empiri-
cal evidence suggests that this is not the case. In-
deed, we find that funding cuts to higher education
would not harm future economic performance.
Table 2: Total Expense Deductions, 2003-04 and 2008-09Oklahoma, 2003-04 and 2008-09 in Constant (inflation-adjusted) U.S. Dollars
Expenses per Expenses perInstitution FTE* 2003-04 FTE 2008-09 Growth(%)
Cameron University $11,204 $14,373 28.3%
University of Central Oklahoma $9,818 $13,648 39.0%
East Central University $12,785 $15,831 23.8%
Langston University $22,330 $15,230 -31.8%
Northeastern State University $11,277 $14,333 27.1%
Northwestern Oklahoma State University $12,611 $14,934 18.4%
Oklahoma Panhandle State University $28,600 $19,198 -32.9%
Oklahoma State University-Main Campus $28,515 $35,288 23.8%
Oklahoma State University-Oklahoma City $7,432 $8,747 17.7%
University of Oklahoma Norman Campus $24,590 $34,314 39.5%
Oklahoma State University Institute of Technology-Okmulgee $13,282 $12,418 -6.5%
Rogers State University $11,913 $13,767 15.6%
University of Science and Arts of Oklahoma $13,430 $17,891 33.2%
Southeastern Oklahoma State University $14,469 $16,499 14.0%
Southwestern Oklahoma State University $10,788 $14,031 30.1%
Oklahoma Weighted State Average $18,694 $23,442 25.4%
Source: Integrated Postsecondary Education Data System (IPEDS), U.S. Department of Education, accessed April 2011; authors’ calculations.
O K L A H O M A H I G H E R E D U C A T I O N : C H A L L E N G I N G T H E C O N V E N T I O N A L W I S D O M • M A Y 2 0 1 1 5
Part II: Higher Education and Economic Growth
Taxpayers and state legislators often assume
that by appropriating more money to higher
education they are making education more afford-
able to the state’s citizens. This spending then is
seen as an investment in human capital that will
pay large dividends in the form of future economic
growth. Yet, as we demonstrate below, this argu-
ment is not supported by the empirical evidence.
State Appropriations and Economic Growth
The Center for College Affordability and Produc-
tivity has developed multiple variations of econo-
metric models examining the relationship between
state appropriations for higher education and eco-
nomic growth (measured as growth in per capita
personal income). Our center’s models have con-
sistently found that no relationship exists between
state appropriations and economic growth. The
models explore variations in state economic growth
over a 46-year period from 1960-2006. As state mon-
ies invested in higher education cannot be ex-
pected to have immediate results (for example, it
takes several years to educate an individual), the
models include three separate time lags to more
accurately assess the determinants of state eco-
nomic growth. Even with five-, ten-, and fifteen-year
time lags, no relationship exists between appro-
priations and growth. Statistically significant vari-
ables impacting economic growth include the age
of the state (positive relationship), population
growth (positive relationship), union growth (nega-
tive relationship), educational attainment (positive
relationship), and growth in the tax burden (nega-
tive relationship). 6
This analysis does not mean that universities in
general do not promote economic growth at all, or
that economic growth would be greater in a world
without universities altogether. Rather, it suggests
that, at the margin, further increasing state appro-
priations to higher education does not have a posi-
tive economic payoff. We now turn to consider why
this may be the case, and look to Oklahoma-
specific data to guide our analysis.
State Appropriations and Educational Attainment
Perhaps one major reason that state appropria-
tions fail to spur economic growth is that such
spending does not translate into higher levels of
educational achievement among a state’s popula-
tion. “Educational attainment” is the term used to
define the percentage of a state’s population aged
25 years and above that possesses a bachelor’s de-
gree or higher. Since theory suggests that improve-
ments in human capital drive economic growth,7 it
makes sense that if appropriations fail to actually
augment attainment levels, then the growth-en-
hancing effect will be absent.
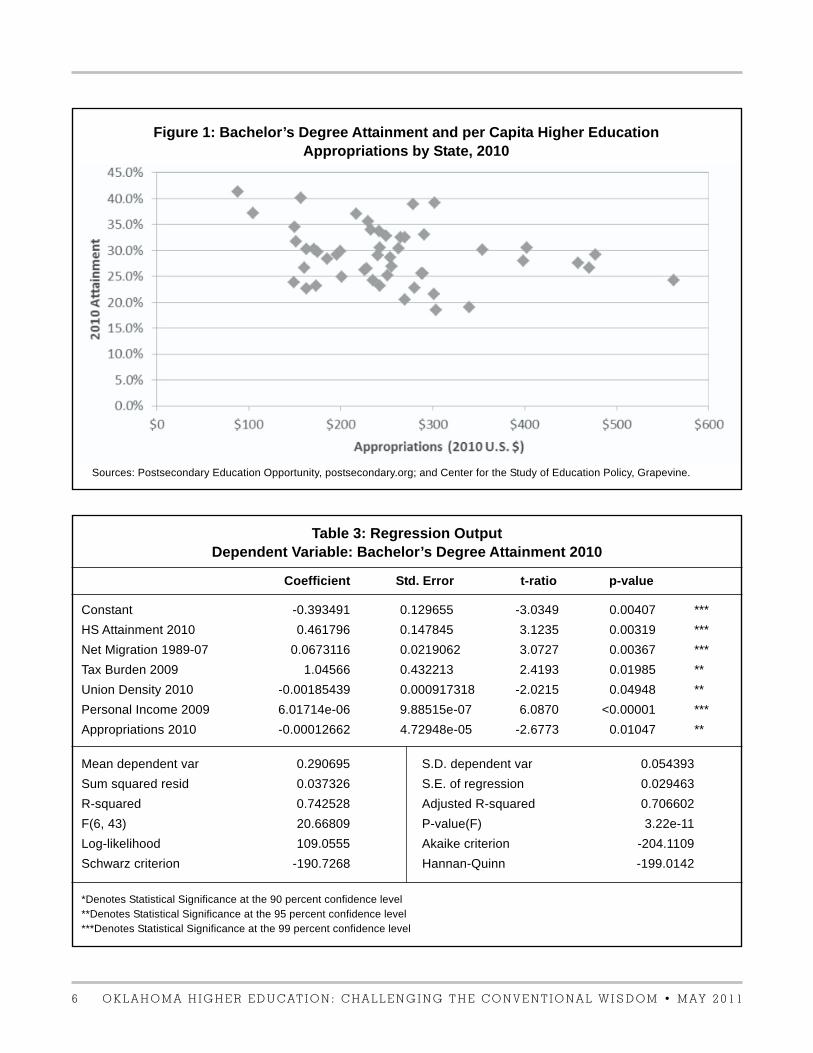
Statistical evidence from all 50 states suggests
that there is not a positive relationship between
state appropriations and educational attainment.
Figure 1 plots each of the 50 states’ educational at-
tainment percentages in 2010 on the vertical axis
and each state’s 2010 higher education appropria-
tions per capita on the horizontal axis. The scatter
plot fails to show any obvious relationship; in fact,
any discernible relationship between appropria-
tions and attainment appears to be negative. That
is, on average, states with higher appropriation lev-
els have a smaller percentage of citizens who pos-
sess college degrees.
Although interesting, the conclusions that can be
drawn from the data presented in Figure 1 are lim-
ited. To have a more complete understanding of the
relationship between appropriations and attain-
ment, statistical regression modeling is necessary.
By building a regression model, we are able to con-
trol for a number of other variables besides appro-
priations that may be simultaneously affecting at-
tainment levels. Table 3 displays the results of our
econometric regression equation. The equation
models variations among the 50 states in the per-
centage of their adult populations possessing a
bachelor’s degree or higher in 2010.
The model controls for several different factors
6 O K L A H O M A H I G H E R E D U C A T I O N : C H A L L E N G I N G T H E C O N V E N T I O N A L W I S D O M • M A Y 2 0 1 1
Table 3: Regression OutputDependent Variable: Bachelor’s Degree Attainment 2010
Coefficient Std. Error t-ratio p-value
Constant -0.393491 0.129655 -3.0349 0.00407 ***
HS Attainment 2010 0.461796 0.147845 3.1235 0.00319 ***
Net Migration 1989-07 0.0673116 0.0219062 3.0727 0.00367 ***
Tax Burden 2009 1.04566 0.432213 2.4193 0.01985 **
Union Density 2010 -0.00185439 0.000917318 -2.0215 0.04948 **
Personal Income 2009 6.01714e-06 9.88515e-07 6.0870 <0.00001 ***
Appropriations 2010 -0.00012662 4.72948e-05 -2.6773 0.01047 **
Mean dependent var 0.290695 S.D. dependent var 0.054393
Sum squared resid 0.037326 S.E. of regression 0.029463
R-squared 0.742528 Adjusted R-squared 0.706602
F(6, 43) 20.66809 P-value(F) 3.22e-11
Log-likelihood 109.0555 Akaike criterion -204.1109
Schwarz criterion -190.7268 Hannan-Quinn -199.0142
*Denotes Statistical Significance at the 90 percent confidence level**Denotes Statistical Significance at the 95 percent confidence level***Denotes Statistical Significance at the 99 percent confidence level
Figure 1: Bachelor’s Degree Attainment and per Capita Higher EducationAppropriations by State, 2010
Sources: Postsecondary Education Opportunity, postsecondary.org; and Center for the Study of Education Policy, Grapevine.
O K L A H O M A H I G H E R E D U C A T I O N : C H A L L E N G I N G T H E C O N V E N T I O N A L W I S D O M • M A Y 2 0 1 1 7
that could possibly affect attainment, including
state appropriations, high-school degree attain-
ment, net migration of college graduates, union
density, per capita personal income levels, and av-
erage state and local tax burdens. Our results show
that high-school degree attainment, net migration,
tax burden, and personal income are all statisti-
cally significant factors related to attainment. The
model also shows that union density has a statisti-
cally significant negative relationship. Of greatest
interest to this analysis however is the state higher
education appropriations variable. According to
our results, appropriations increases have a statisti-
cally significant negative effect on attainment levels.
These regression results identify an interesting
disconnect between economic theory and reality.
While theoretically growth should follow additional
investments in human capital, this is not the case
with state higher education appropriations. In actu-
ality, spending more on education does not guaran-
tee that the investment is paying off. Impediments to
the investment-growth process often arise; we dis-
cuss several of these below.
Problems of Inefficient Spending
Across the nation, universities encompass much
more than instructors and classrooms. Institutions
perform a variety of activities, such as research,
and provide a host of services ranging from hous-
ing and dining to entertainment. While many of
these services and ventures are enjoyed by students,
they do not necessarily contribute directly to human
capital formation. These extraneous ventures com-
pete with instructional activities for university re-
sources. University budgets reveal that instruc-
tional expenses often make up a shockingly small
portion of overall expenses. Nationwide, total dol-
lars spent on instruction at any given university are
often well under 50 percent of the total expenses.
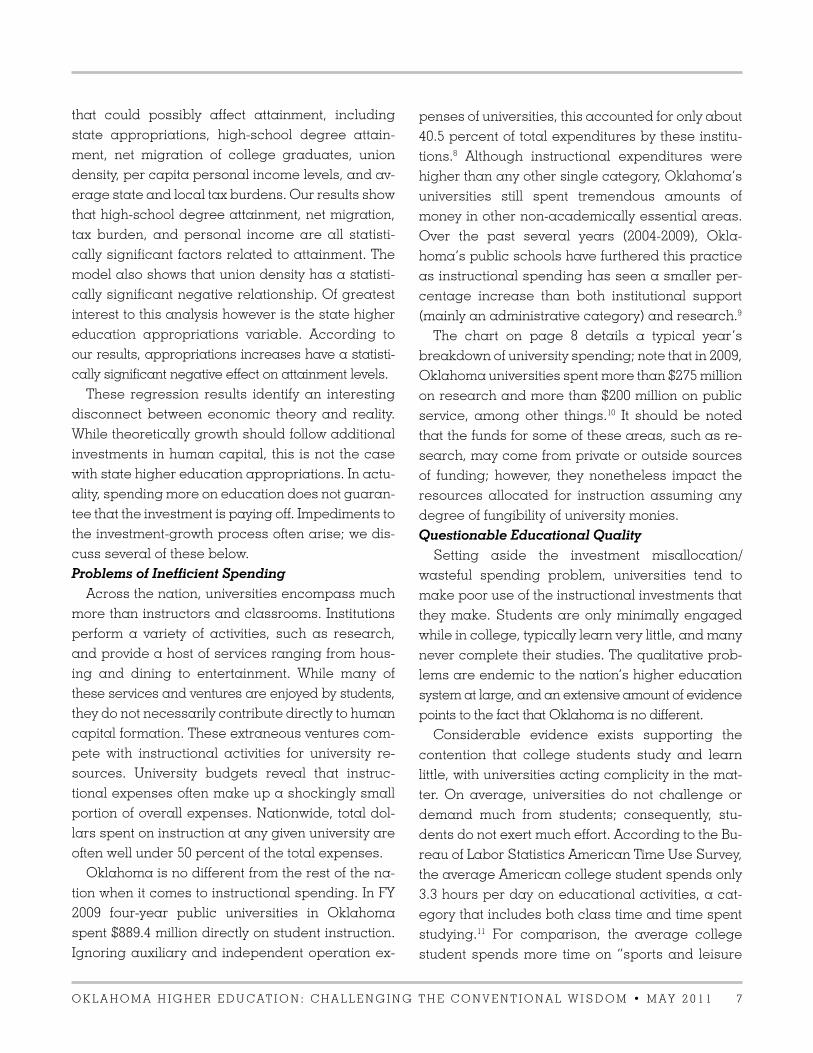
Oklahoma is no different from the rest of the na-
tion when it comes to instructional spending. In FY
2009 four-year public universities in Oklahoma
spent $889.4 million directly on student instruction.
Ignoring auxiliary and independent operation ex-
penses of universities, this accounted for only about
40.5 percent of total expenditures by these institu-
tions.8 Although instructional expenditures were
higher than any other single category, Oklahoma’s
universities still spent tremendous amounts of
money in other non-academically essential areas.
Over the past several years (2004-2009), Okla-
homa’s public schools have furthered this practice
as instructional spending has seen a smaller per-
centage increase than both institutional support
(mainly an administrative category) and research.9
The chart on page 8 details a typical year’s
breakdown of university spending; note that in 2009,
Oklahoma universities spent more than $275 million
on research and more than $200 million on public
service, among other things.10 It should be noted
that the funds for some of these areas, such as re-
search, may come from private or outside sources
of funding; however, they nonetheless impact the
resources allocated for instruction assuming any
degree of fungibility of university monies.
Questionable Educational Quality
Setting aside the investment misallocation/
wasteful spending problem, universities tend to
make poor use of the instructional investments that
they make. Students are only minimally engaged
while in college, typically learn very little, and many
never complete their studies. The qualitative prob-
lems are endemic to the nation’s higher education
system at large, and an extensive amount of evidence
points to the fact that Oklahoma is no different.
Considerable evidence exists supporting the
contention that college students study and learn
little, with universities acting complicity in the mat-
ter. On average, universities do not challenge or
demand much from students; consequently, stu-
dents do not exert much effort. According to the Bu-
reau of Labor Statistics American Time Use Survey,
the average American college student spends only
3.3 hours per day on educational activities, a cat-
egory that includes both class time and time spent
studying.11 For comparison, the average college
student spends more time on “sports and leisure
8 O K L A H O M A H I G H E R E D U C A T I O N : C H A L L E N G I N G T H E C O N V E N T I O N A L W I S D O M • M A Y 2 0 1 1
Source: IPEDS, U.S. Dept. of Education
activities” (3.6 hours per day) than he/she does on
academics.12 The Time Use Survey is not alone in
highlighting the lack of academic engagement and
rigor on college campuses today. The National Sur-
vey of Student Engagement (NSSE), a survey con-
ducted across hundreds of universities looking at
freshman and seniors, has similar findings.13 For
example:
• 30 percent of seniors never discussed their
coursework/assignments outside of class with
a faculty member;
• 50 percent of seniors surveyed never wrote a pa-
per at least 20 pages in length;
• 76 percent of seniors nationwide spent under 20
hours a week preparing for class/studying;
• 74 percent of seniors spent less than 5 hours
per week on school-sponsored extracurricular
activities.
Dozens of similar trends in student engagement
and activity in a variety of areas were evaluated,
with many of the findings pointing to a general lack
of rigor and engagement. Interestingly, despite the
noted lack of these attributes, students who stay in
school ostensibly do well. Grade inflation, a tactic
employed by faculty members for a variety of rea-
sons, rewards students for even mediocre work. A
full 86 percent of senior NSSE respondents re-
ceived at least a B average in their overall
coursework.14 Oklahoma’s schools have some cor-
roborating grade information available. In terms of
the high grades received, the University of Okla-
homa and Oklahoma State University are no differ-
ent; public records grade data show that average
grades there are 2.98 and 3.00 respectively, right in
the B range.15 While no public universities in Okla-
homa participated in the NSSE survey, given the
large size of the NSSE sample (572 schools) and the
consistency of the results, there is little reason to
believe that Oklahoma’s mid-quality universities
are immune to these problems.16
Universities are failing in their most basic mission
as American college students are learning little.
Academically Adrift, a recent book resulting from a
research project organized by the Social Science
Research Council, explored in great detail this
dearth of learning. Examining thousands of stu-
Aggregate Expenditures at Four-year Public Institutions in OklahomaFY 2009
Note: See Appendix for Definitions ofExpense Categories

O K L A H O M A H I G H E R E D U C A T I O N : C H A L L E N G I N G T H E C O N V E N T I O N A L W I S D O M • M A Y 2 0 1 1 9
dents at many universities over their college ca-
reers, in the study the authors produced consider-
able evidence concluding that most college stu-
dents gain little cognitively while attending college.
Overall, average students experienced only very
minor and disappointing gains from learning (as
measured by the Collegiate Learning Assessment17)
between their freshman and senior years.18 Addition-
ally and perhaps more troubling, the authors found
that 36 percent of students had no significant measur-
able cognitive gains at all during this time.19 Also in-
cluded in the study’s findings were indications that
low academic rigor and student engagement are
partially to blame for these startling results.
Further evidence of universities’ failures to ad-
equately educate and engage their students can be
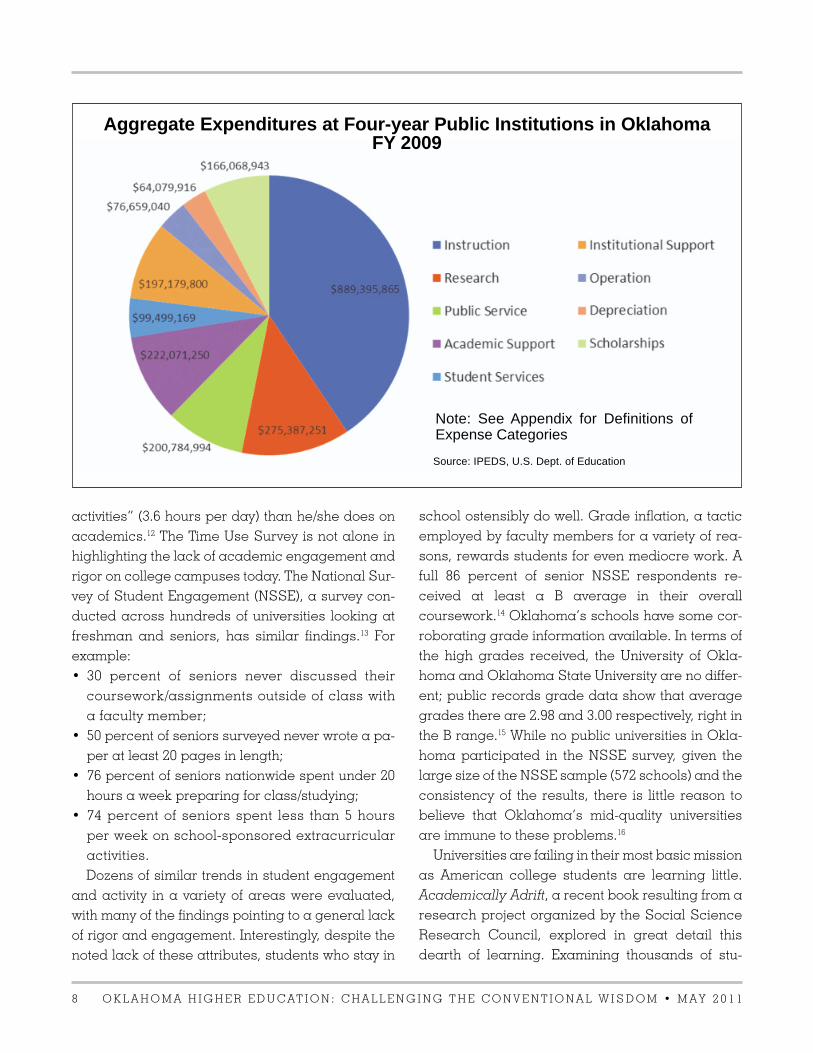
seen in other areas. Collegiate studies are tradi-
tionally supposed to take four years, but only 19.97
percent of Oklahoma’s public university students
graduate within this time. Moreover, 55.2 percent—
a majority—of Oklahoma’s students fail to graduate
within even six years, and many students never
graduate.20 Even Oklahoma’s biggest and most
prestigious universities, the University of Oklahoma
and Oklahoma State University, graduate only 29
and 31 percent respectively in four years and only
63 and 60 percent respectively in six years. Al-
though these six-year rates are above the national
average of 55.9,21 this is not a fact warranting cel-
ebration since the average itself is quite poor. 22
Outward Migration of College Graduates
While much of the above information highlights
reasons for the break between economic theory
and reality common to all states, Oklahoma does
Graduation Rates at Oklahoma’s Four-year Public Universities, 2009
Source: IPEDS, U.S. Dept. of Education. Graduation rates measure the percentage of entering students beginning their studiesfull-time and seeking a bachelor’s degree, who earn a bachelor’s degree within a specified amount of time.
Rogers State University
Cameron University
Langston University
Southeastern Oklahoma State University
University of Science and Arts of Oklahoma
Northeastern State University
Southwestern Oklahoma State University
Northwestern Oklahoma State University
East Central University
University of Central Oklahoma
Oklahoma Panhandle State University
Oklahoma State University
University of Oklahoma
Six-year
Graduation
Rate
Four-year
Graduation
Rate
1 0 O K L A H O M A H I G H E R E D U C A T I O N : C H A L L E N G I N G T H E C O N V E N T I O N A L W I S D O M • M A Y 2 0 1 1
face a unique problem of its own. Oklahoma’s col-
lege graduates leave the state at an alarming rate,
indicating an internal overproduction of college
graduates. Between the years of 1994 and 2008 (the
last years of available data), Oklahoma experi-
enced a net loss of 145,113 college graduates.23 On
average, there was a net loss of nearly 10,000 col-
lege graduates per year. This average net loss fig-
ure accounted for 58 percent of the annual average
production of college graduates in Oklahoma.24
While Oklahoma’s college graduates may leave
the state for a variety of reasons, economic factors
likely play a large role. One simple economic rea-
son is simply that they make more money else-
where. In 2005 (the last year of available data),
Oklahoma’s residents with just a bachelor’s degree
made only 82 percent of the national median for
that classification, ranking 46th out of 50.25 While
there are data availability issues for more current
information on college graduate salaries by state,
Oklahoma’s overall median salary/wage levels to-
day are rather low.26 Furthermore, as salary/wages
are generally sticky or resistant to change, it is
quite unlikely that the above situation has changed
materially over the past few years.
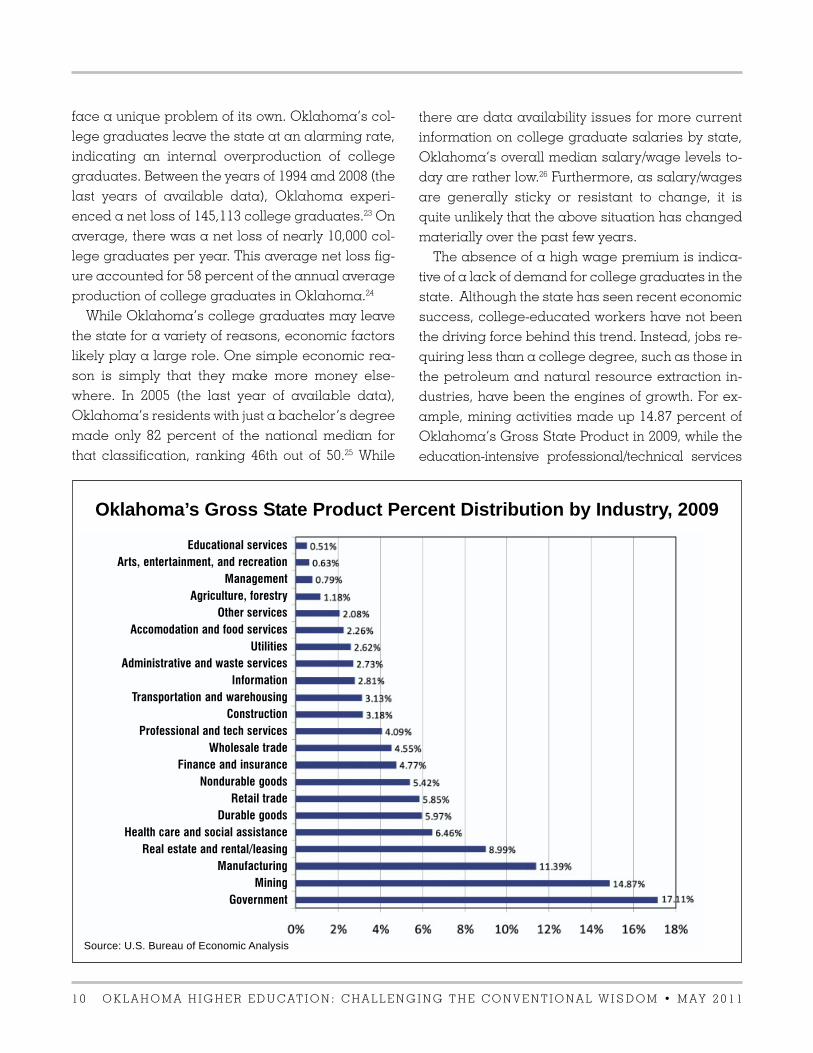
The absence of a high wage premium is indica-
tive of a lack of demand for college graduates in the
state. Although the state has seen recent economic
success, college-educated workers have not been
the driving force behind this trend. Instead, jobs re-
quiring less than a college degree, such as those in
the petroleum and natural resource extraction in-
dustries, have been the engines of growth. For ex-
ample, mining activities made up 14.87 percent of
Oklahoma’s Gross State Product in 2009, while the
education-intensive professional/technical services
Oklahoma’s Gross State Product Percent Distribution by Industry, 2009
Source: U.S. Bureau of Economic Analysis
Educational services
Arts, entertainment, and recreation
Management
Agriculture, forestry
Other services
Accomodation and food services
Utilities
Administrative and waste services
Information
Transportation and warehousing
Construction
Professional and tech services
Wholesale trade
Finance and insurance
Nondurable goods
Retail trade
Durable goods
Health care and social assistance
Real estate and rental/leasing
Manufacturing
Mining
Government
O K L A H O M A H I G H E R E D U C A T I O N : C H A L L E N G I N G T H E C O N V E N T I O N A L W I S D O M • M A Y 2 0 1 1 1 1
and management comprised less than 5 percent.27
The low demand for college graduates is not ex-
pected to change anytime soon. The state’s own la-
bor market projections, forecasting out until 2018,
foresee anemic total growth in fields that require at
least a bachelor’s degree. Of the projected top 20
fastest-growing (by percentage change) fields, only
two require a bachelor’s degree.28 On an annual
basis until 2018, it is forecasted that for every one
job open for college graduates, there will be 4.55
jobs available for non-college graduates.29 Overall,
labor market opportunities for college graduates
are lacking in Oklahoma.
Matthew Denhart serves as administrative director at the Center for College Affordability and Pro-
ductivity. He may be reached by email at [email protected].
Christopher Matgouranis serves as chief research assistant at the Center for College Affordability
and Productivity. He may be reached by email at [email protected].
Richard Vedder directs the Center for College Affordability and Productivity. He is Distinguished Pro-
fessor of Economics at Ohio University and is an adjunct scholar at the American Enterprise Institute.
He may be reached by email at [email protected].
nomic growth. Related to the Bowen Rule, these
findings are due in part to rampant inefficiencies
and little in the way of results from how universities
spend their money. Students are only modestly en-
gaged, learn little, and frequently do not graduate.
Economic benefits are difficult to realize when uni-
versities are not succeeding in widely enhancing
human capital. Even when students succeed in
graduating, many of Oklahoma’s graduates end up
moving out of the state due to a general lack of la-
bor market opportunities.
Our findings indicate that public fears and outcries
over cuts in state appropriations for higher education
are unfounded. State investment in higher education
is not an engine for economic growth as conventional
wisdom holds. Rather than continuing to blindly
pass money from taxpayers to university bureau-
cracies, Oklahoma would be well-suited to rethink
its long-term economic growth strategy. �
Conclusion
This paper has shed light on several areas con-
cerning Oklahoma’s higher education system.
Oklahoma’s state universities are not, as some
have proclaimed, in a dire financial position. Dur-
ing the past half-decade, these institutions have
seen real increases in revenue per student. Cost-
savings measures have not been the strong suit of
this university system, as along with the real rev-
enue increases, increases in real expenditures per
student have been seen as well. What has been oc-
curring is a confirmation of the Bowen Rule—uni-
versities bring in as much money as possible and
accordingly spend as much as possible. This prac-
tice often comes at the expense of students and
state taxpayers, and fails to deliver a significant re-
turn on investment.
Using econometric models, we have strong sta-
tistical evidence that additional state investment in
higher education does not yield additional eco-
1 2 O K L A H O M A H I G H E R E D U C A T I O N : C H A L L E N G I N G T H E C O N V E N T I O N A L W I S D O M • M A Y 2 0 1 1
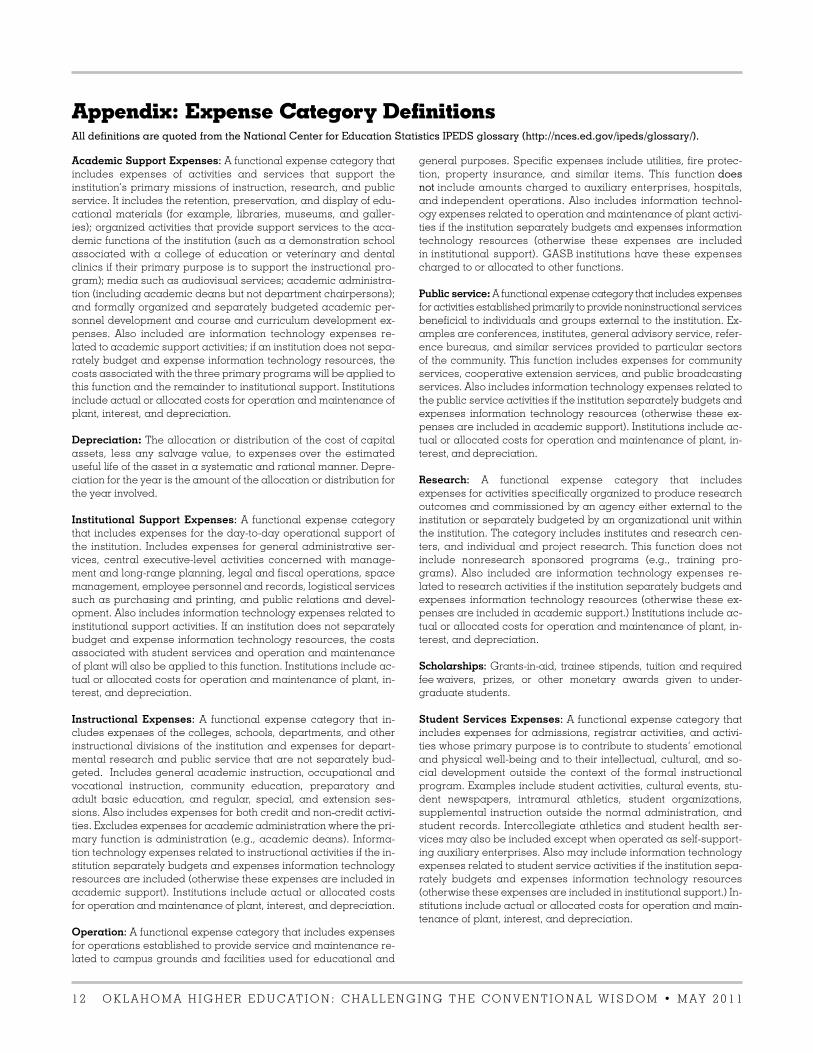
Academic Support Expenses: A functional expense category that
includes expenses of activities and services that support the
institution’s primary missions of instruction, research, and public
service. It includes the retention, preservation, and display of edu-
cational materials (for example, libraries, museums, and galler-
ies); organized activities that provide support services to the aca-
demic functions of the institution (such as a demonstration school
associated with a college of education or veterinary and dental
clinics if their primary purpose is to support the instructional pro-
gram); media such as audiovisual services; academic administra-
tion (including academic deans but not department chairpersons);
and formally organized and separately budgeted academic per-
sonnel development and course and curriculum development ex-
penses. Also included are information technology expenses re-
lated to academic support activities; if an institution does not sepa-
rately budget and expense information technology resources, the
costs associated with the three primary programs will be applied to
this function and the remainder to institutional support. Institutions
include actual or allocated costs for operation and maintenance of
plant, interest, and depreciation.
Depreciation: The allocation or distribution of the cost of capital
assets, less any salvage value, to expenses over the estimated
useful life of the asset in a systematic and rational manner. Depre-
ciation for the year is the amount of the allocation or distribution for
the year involved.
Institutional Support Expenses: A functional expense category
that includes expenses for the day-to-day operational support of
the institution. Includes expenses for general administrative ser-
vices, central executive-level activities concerned with manage-
ment and long-range planning, legal and fiscal operations, space
management, employee personnel and records, logistical services
such as purchasing and printing, and public relations and devel-
opment. Also includes information technology expenses related to
institutional support activities. If an institution does not separately
budget and expense information technology resources, the costs
associated with student services and operation and maintenance
of plant will also be applied to this function. Institutions include ac-
tual or allocated costs for operation and maintenance of plant, in-
terest, and depreciation.
Instructional Expenses: A functional expense category that in-
cludes expenses of the colleges, schools, departments, and other
instructional divisions of the institution and expenses for depart-
mental research and public service that are not separately bud-
geted. Includes general academic instruction, occupational and
vocational instruction, community education, preparatory and
adult basic education, and regular, special, and extension ses-
sions. Also includes expenses for both credit and non-credit activi-
ties. Excludes expenses for academic administration where the pri-
mary function is administration (e.g., academic deans). Informa-
tion technology expenses related to instructional activities if the in-
stitution separately budgets and expenses information technology
resources are included (otherwise these expenses are included in
academic support). Institutions include actual or allocated costs
for operation and maintenance of plant, interest, and depreciation.
Operation: A functional expense category that includes expenses
for operations established to provide service and maintenance re-
lated to campus grounds and facilities used for educational and
general purposes. Specific expenses include utilities, fire protec-
tion, property insurance, and similar items. This function does
not include amounts charged to auxiliary enterprises, hospitals,
and independent operations. Also includes information technol-
ogy expenses related to operation and maintenance of plant activi-
ties if the institution separately budgets and expenses information
technology resources (otherwise these expenses are included
in institutional support). GASB institutions have these expenses
charged to or allocated to other functions.
Public service: A functional expense category that includes expenses
for activities established primarily to provide noninstructional services
beneficial to individuals and groups external to the institution. Ex-
amples are conferences, institutes, general advisory service, refer-
ence bureaus, and similar services provided to particular sectors
of the community. This function includes expenses for community
services, cooperative extension services, and public broadcasting
services. Also includes information technology expenses related to
the public service activities if the institution separately budgets and
expenses information technology resources (otherwise these ex-
penses are included in academic support). Institutions include ac-
tual or allocated costs for operation and maintenance of plant, in-
terest, and depreciation.
Research: A functional expense category that includes
expenses for activities specifically organized to produce research
outcomes and commissioned by an agency either external to the
institution or separately budgeted by an organizational unit within
the institution. The category includes institutes and research cen-
ters, and individual and project research. This function does not
include nonresearch sponsored programs (e.g., training pro-
grams). Also included are information technology expenses re-
lated to research activities if the institution separately budgets and
expenses information technology resources (otherwise these ex-
penses are included in academic support.) Institutions include ac-
tual or allocated costs for operation and maintenance of plant, in-
terest, and depreciation.
Scholarships: Grants-in-aid, trainee stipends, tuition and required
fee waivers, prizes, or other monetary awards given to under-
graduate students.
Student Services Expenses: A functional expense category that
includes expenses for admissions, registrar activities, and activi-
ties whose primary purpose is to contribute to students’ emotional
and physical well-being and to their intellectual, cultural, and so-
cial development outside the context of the formal instructional
program. Examples include student activities, cultural events, stu-
dent newspapers, intramural athletics, student organizations,
supplemental instruction outside the normal administration, and
student records. Intercollegiate athletics and student health ser-
vices may also be included except when operated as self-support-
ing auxiliary enterprises. Also may include information technology
expenses related to student service activities if the institution sepa-
rately budgets and expenses information technology resources
(otherwise these expenses are included in institutional support.) In-
stitutions include actual or allocated costs for operation and main-
tenance of plant, interest, and depreciation.
Appendix: Expense Category DefinitionsAll definitions are quoted from the National Center for Education Statistics IPEDS glossary (http://nces.ed.gov/ipeds/glossary/).
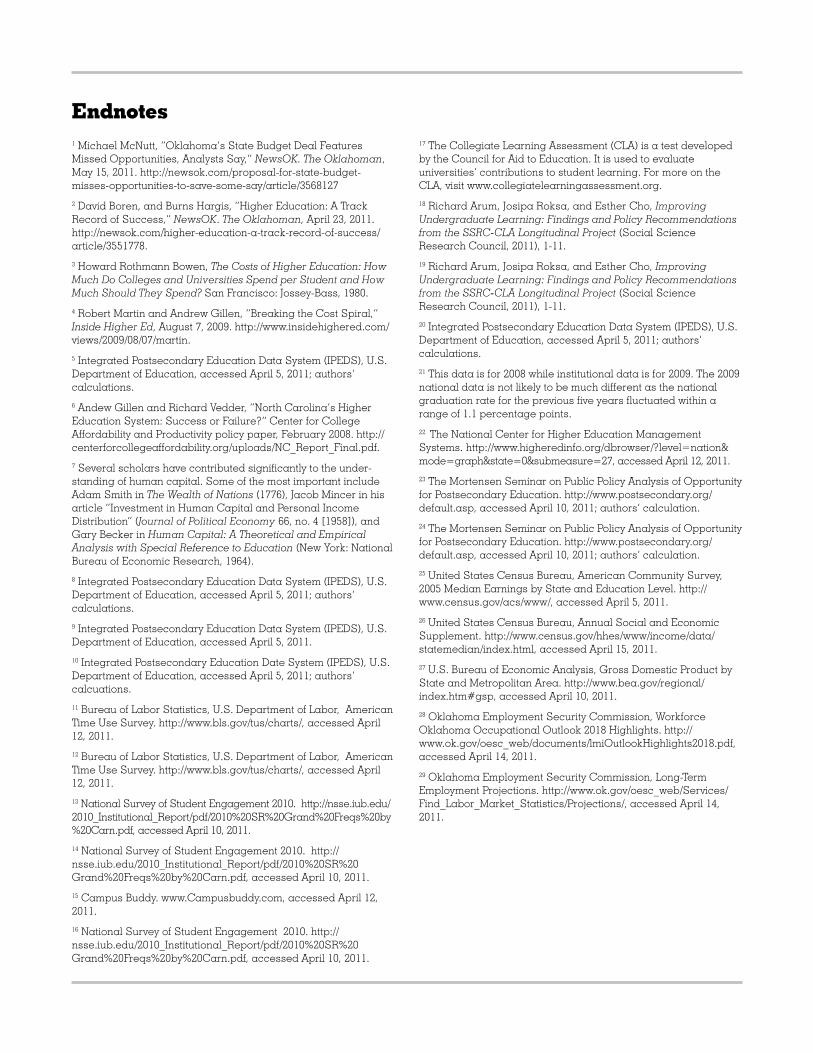
Endnotes
1 Michael McNutt, “Oklahoma’s State Budget Deal Features
Missed Opportunities, Analysts Say,” NewsOK. The Oklahoman,
May 15, 2011. http://newsok.com/proposal-for-state-budget-
misses-opportunities-to-save-some-say/article/3568127
2 David Boren, and Burns Hargis, “Higher Education: A Track
Record of Success,” NewsOK. The Oklahoman, April 23, 2011.
http://newsok.com/higher-education-a-track-record-of-success/
article/3551778.
3 Howard Rothmann Bowen, The Costs of Higher Education: How
Much Do Colleges and Universities Spend per Student and How
Much Should They Spend? San Francisco: Jossey-Bass, 1980.
4 Robert Martin and Andrew Gillen, “Breaking the Cost Spiral,”
Inside Higher Ed, August 7, 2009. http://www.insidehighered.com/
views/2009/08/07/martin.
5 Integrated Postsecondary Education Data System (IPEDS), U.S.
Department of Education, accessed April 5, 2011; authors’
calculations.
6 Andew Gillen and Richard Vedder, “North Carolina’s Higher
Education System: Success or Failure?” Center for College
Affordability and Productivity policy paper, February 2008. http://
centerforcollegeaffordability.org/uploads/NC_Report_Final.pdf.
7 Several scholars have contributed significantly to the under-
standing of human capital. Some of the most important include
Adam Smith in The Wealth of Nations (1776), Jacob Mincer in his
article “Investment in Human Capital and Personal Income
Distribution” (Journal of Political Economy 66, no. 4 [1958]), and
Gary Becker in Human Capital: A Theoretical and Empirical
Analysis with Special Reference to Education (New York: National
Bureau of Economic Research, 1964).
8 Integrated Postsecondary Education Data System (IPEDS), U.S.
Department of Education, accessed April 5, 2011; authors’
calculations.
9 Integrated Postsecondary Education Data System (IPEDS), U.S.
Department of Education, accessed April 5, 2011.
10 Integrated Postsecondary Education Date System (IPEDS), U.S.
Department of Education, accessed April 5, 2011; authors’
calcuations.
11 Bureau of Labor Statistics, U.S. Department of Labor, American
Time Use Survey. http://www.bls.gov/tus/charts/, accessed April
12, 2011.
12 Bureau of Labor Statistics, U.S. Department of Labor, American
Time Use Survey. http://www.bls.gov/tus/charts/, accessed April
12, 2011.
13 National Survey of Student Engagement 2010. http://nsse.iub.edu/
2010_Institutional_Report/pdf/2010%20SR%20Grand%20Freqs%20by
%20Carn.pdf, accessed April 10, 2011.
14 National Survey of Student Engagement 2010. http://
nsse.iub.edu/2010_Institutional_Report/pdf/2010%20SR%20
Grand%20Freqs%20by%20Carn.pdf, accessed April 10, 2011.
15 Campus Buddy. www.Campusbuddy.com, accessed April 12,
2011.
16 National Survey of Student Engagement 2010. http://
nsse.iub.edu/2010_Institutional_Report/pdf/2010%20SR%20
Grand%20Freqs%20by%20Carn.pdf, accessed April 10, 2011.
17 The Collegiate Learning Assessment (CLA) is a test developed
by the Council for Aid to Education. It is used to evaluate
universities’ contributions to student learning. For more on the
CLA, visit www.collegiatelearningassessment.org.
18 Richard Arum, Josipa Roksa, and Esther Cho, Improving
Undergraduate Learning: Findings and Policy Recommendations
from the SSRC-CLA Longitudinal Project (Social Science
Research Council, 2011), 1-11.
19 Richard Arum, Josipa Roksa, and Esther Cho, Improving
Undergraduate Learning: Findings and Policy Recommendations
from the SSRC-CLA Longitudinal Project (Social Science
Research Council, 2011), 1-11.
20 Integrated Postsecondary Education Data System (IPEDS), U.S.
Department of Education, accessed April 5, 2011; authors’
calculations.
21 This data is for 2008 while institutional data is for 2009. The 2009
national data is not likely to be much different as the national
graduation rate for the previous five years fluctuated within a
range of 1.1 percentage points.
22 The National Center for Higher Education Management
Systems. http://www.higheredinfo.org/dbrowser/?level=nation&
mode=graph&state=0&submeasure=27, accessed April 12, 2011.
23 The Mortensen Seminar on Public Policy Analysis of Opportunity
for Postsecondary Education. http://www.postsecondary.org/
default.asp, accessed April 10, 2011; authors’ calculation.
24 The Mortensen Seminar on Public Policy Analysis of Opportunity
for Postsecondary Education. http://www.postsecondary.org/
default.asp, accessed April 10, 2011; authors’ calculation.
25 United States Census Bureau, American Community Survey,
2005 Median Earnings by State and Education Level. http://
www.census.gov/acs/www/, accessed April 5, 2011.
26 United States Census Bureau, Annual Social and Economic
Supplement. http://www.census.gov/hhes/www/income/data/
statemedian/index.html, accessed April 15, 2011.
27 U.S. Bureau of Economic Analysis, Gross Domestic Product by
State and Metropolitan Area. http://www.bea.gov/regional/
index.htm#gsp, accessed April 10, 2011.
28 Oklahoma Employment Security Commission, Workforce
Oklahoma Occupational Outlook 2018 Highlights. http://
www.ok.gov/oesc_web/documents/lmiOutlookHighlights2018.pdf,
accessed April 14, 2011.
29 Oklahoma Employment Security Commission, Long-Term
Employment Projections. http://www.ok.gov/oesc_web/Services/
Find_Labor_Market_Statistics/Projections/, accessed April 14,
2011.

Oklahoma Council of Public Affairs
1401 N. Lincoln Blvd.
Oklahoma City, OK 73104
Tel: 405.602.1667
Fax: 405.602.1238
ocpathink.org