Online Enrollment (Easy as 1-2-3) Oklahoma Health Care Authority.

Oklahoma Health Care Authority
Oklahoma Health Care Authority
February, 2005February, 2005
MANAGEMENT INTELLIGENCE FOR HEALTH CAREMANAGEMENT INTELLIGENCE FOR HEALTH CARE

My InnerView TodayMy InnerView Today
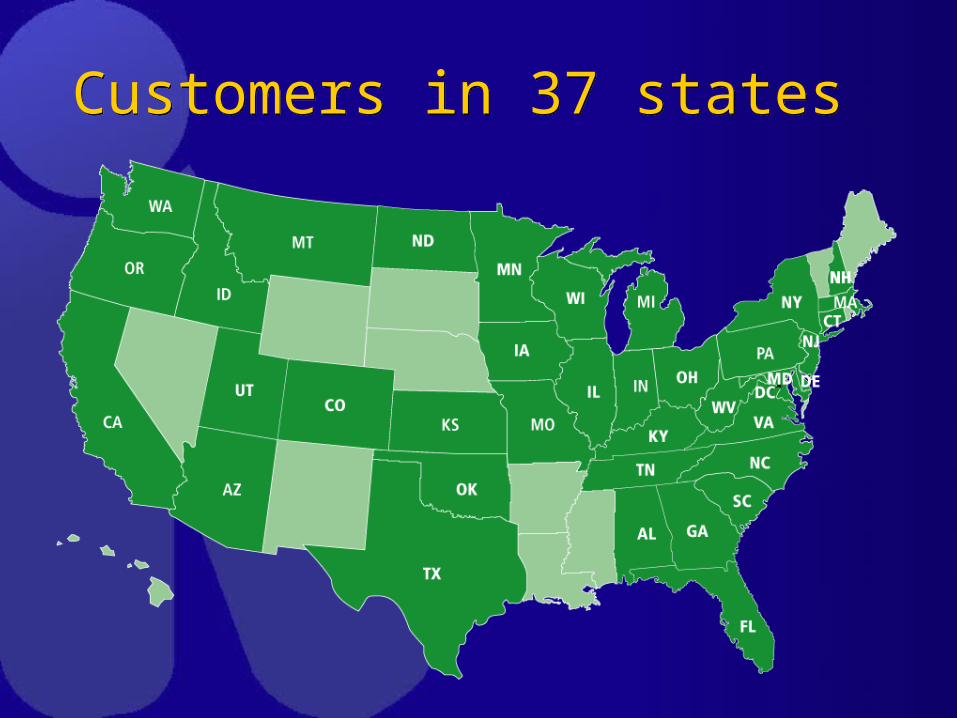
Customers in 37 statesCustomers in 37 states

15 state LTC association endorsements15 state LTC association endorsements

Alliance for Quality Nursing Home CareAlliance for Quality Nursing Home Care
» MyInnerView selected as provider of family satisfaction surveys for member multifacility companies with 2100 locations.
» MyInnerView selected as provider of family satisfaction surveys for member multifacility companies with 2100 locations.

Evidence-based management calls for a paradigm shift in the
approach to quality improvement: An appreciation of data, the ability to turn data into information and
knowledge, and to use that information and knowledge
to improve quality.
Evidence-based Management Philosophy
Evidence-based Management Philosophy


Outcomes: 2006Outcomes: 2006
1.Continued improvement in compliance with state/federal regulations
2.Promotion of financial integrity and fraud prevention
3.Progress in prevention of confirmed abuse and neglect
4.High rates on consumer satisfaction surveys5.Improvement in retention and turnover
1.Continued improvement in compliance with state/federal regulations
2.Promotion of financial integrity and fraud prevention
3.Progress in prevention of confirmed abuse and neglect
4.High rates on consumer satisfaction surveys5.Improvement in retention and turnover

The Georgia ExperienceThe Georgia Experience
Making Quality First WorkMaking Quality First Work

My InnerView’sevidence-
basedpath to
quality and risk management
Turn plan into
action: improveprocess
Turn knowledge
into plan:apply new wisdom
to process
Turninformation into
knowledge:study current
process
Collect
data:ensure validity,
organize
Turn data into
information:benchmark, study
variation
Evaluate
outcomes:measurevariation
© My InnerView Inc.™

Quality of Data-GAQuality of Data-GA

Family response by councilFamily response by council
© 1/1/05, My InnerView Inc.™
25%
30%
35%
40%
45%
GA NE NW WC MG SE SW EC MA
+2%+2%
+1%+1%-4%-4%
+3%+3%
+6%+6%
+5%+5%
+2%+2%+2%+2%+4%+4%
2003 2004
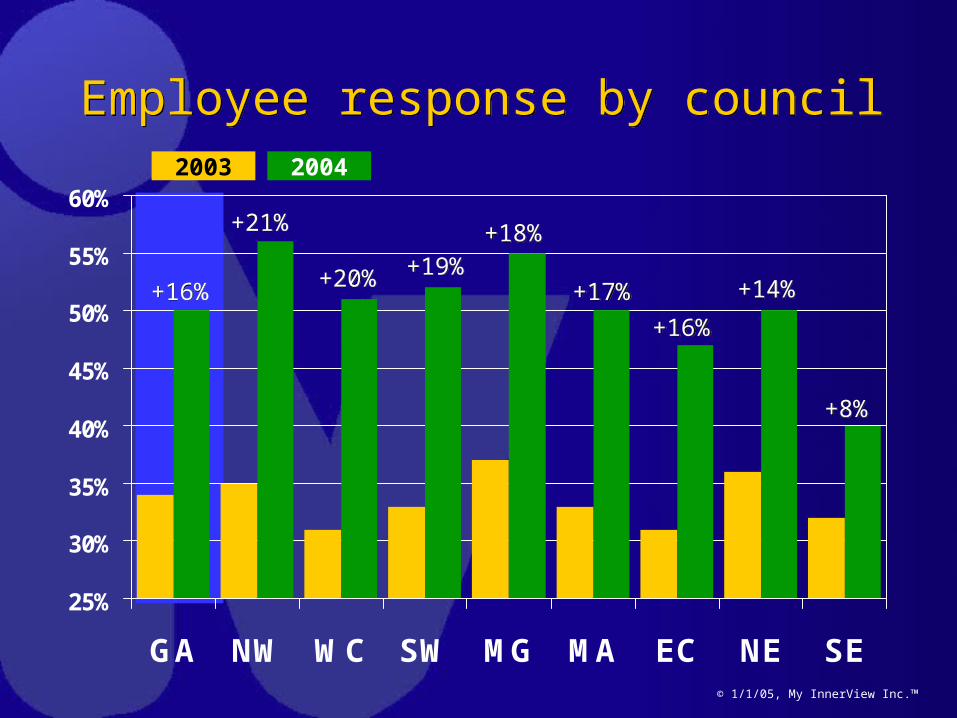
Employee response by councilEmployee response by council
© 1/1/05, My InnerView Inc.™
25%
30%
35%
40%
45%
50%
55%
60%
GA NW WC SW MG MA EC NE SE
+16%+16% +14%+14%
+8%+8%
+18%+18%+21%+21%
+20%+20%+17%+17%
+16%+16%
+19%+19%
2003 2004

© 1/1/05, My InnerView Inc.™
Quality Profile participation rateQuality Profile participation rate
30%
40%
50%
60%
70%
80%
90%
100%
J A S O N D J F M A M J J A S O
2003 2004

© 1/1/05, My InnerView Inc.™
Data submissionData submission
30%
40%
50%
60%
70%
80%
90%
100%
D J F M A M J J A S O N
2003 2004
Submitted data Submitted on time (by 10th of month)

Oscar vs. My InnerView dataOscar vs. My InnerView data
© 1/1/05, My InnerView Inc.™
0
5
10
15
20
25
30
35
RestraintUse
CatheterUse
PressureSores
Anti-psychMed Use
Weight Loss/ Gain
Average Oscar % Average My InnerView %
0
5
10
15
20
25
30
35
RestraintUse
CatheterUse
PressureSores
Anti-psychMed Use
Weight Loss/ Gain
Average Oscar % Average My InnerView %

2004 Special Focus:
LeadershipSkills
2004 Special Focus:
LeadershipSkills

Number of Attendeesat AARP Sponsored Training Sessions
Number of Attendeesat AARP Sponsored Training Sessions
Five or More Persons
Four Persons
Three Persons
Tw o Persons
One Person
No Attendees
8
58
12977
32
44

Many Attendees StatewideMany Attendees Statewide
Attendees
10.08.06.04.02.00.0
200
100
0
Std. Dev = 1.71
Mean = 2.7
N = 348.00

The Voiceof Employees
2003 vs. 2004
The Voiceof Employees
2003 vs. 2004

58.9
56.8
56.5
57.0
57.5
58.0
58.5
59.0
59.5
2003 2004
58.9
56.8
56.5
57.0
57.5
58.0
58.5
59.0
59.5
2003 2004
p = .02
SU
PE
RV
ISIO
NS
UP
ER
VIS
ION
Overall “Supervision” scaleOverall “Supervision” scale

60.0
61.4
59.5
60.0
60.5
61.0
61.5
62.0
2003 2004
60.0
61.4
59.5
60.0
60.5
61.0
61.5
62.0
2003 2004
p = .13
CA
RE
/CO
NC
ER
N O
F S
UP
ER
VIS
OR
CA
RE
/CO
NC
ER
N O
F S
UP
ER
VIS
OR
How your supervisor caresabout you as a person
How your supervisor caresabout you as a person
58.2
59.5
58.0
58.5
59.0
59.5
60.0
2003 2004
58.2
59.5
58.0
58.5
59.0
59.5
60.0
2003 2004
p = .13
CO
MM
UN
ICA
TIO
N B
Y S
UP
ER
VIS
OR
CO
MM
UN
ICA
TIO
N B
Y S
UP
ER
VIS
OR
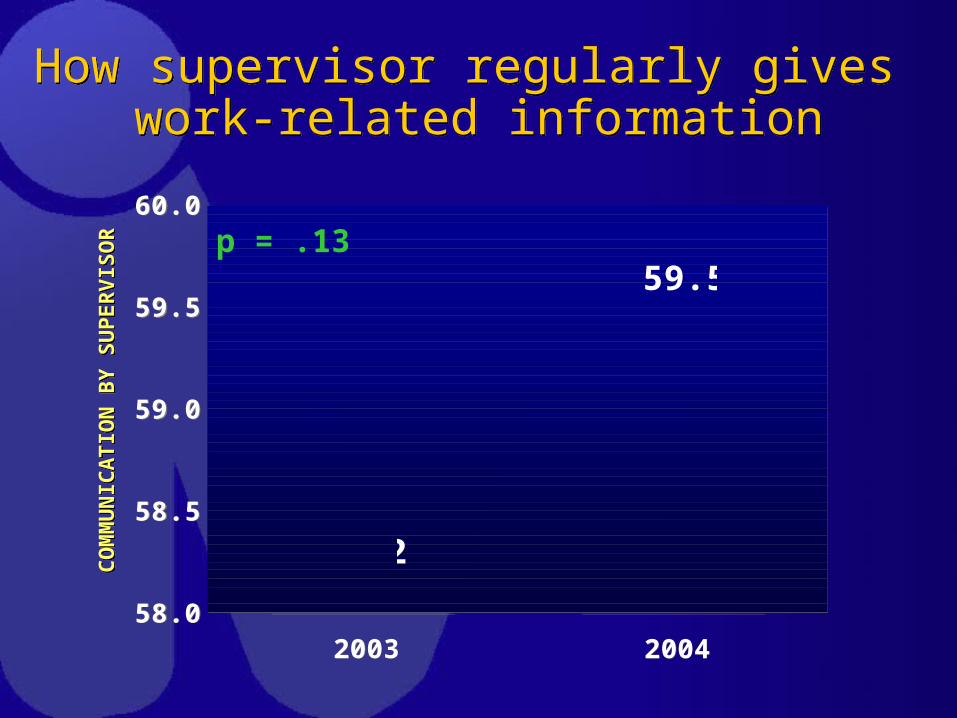
How supervisor regularly gives work-related information
How supervisor regularly gives work-related information

55.7
52.1
51.0
52.0
53.0
54.0
55.0
56.0
2003 2004
55.7
52.1
51.0
52.0
53.0
54.0
55.0
56.0
2003 2004
p = .000
AP
PR
EC
IAT
ION
OF
SU
PE
RV
ISO
RA
PP
RE
CIA
TIO
N O
F S
UP
ER
VIS
OR
How supervisor regularly shows appreciation for job well done
How supervisor regularly shows appreciation for job well done

61.5
58.0
57.0
58.0
59.0
60.0
61.0
62.0
2003 2004
61.5
58.0
57.0
58.0
59.0
60.0
61.0
62.0
2003 2004
p = .000
FA
IRN
ES
S O
F E
VA
LU
AT
ION
SF
AIR
NE
SS
OF
EV
AL
UA
TIO
NS
How fair your performance evaluations are
How fair your performance evaluations are

How the facility helps you deal with job stress or burnout
How the facility helps you deal with job stress or burnout
YEAR
2004.002003.00
Me
an
of
He
lp D
ea
ling
with
Str
ess
or
Bu
rno
ut
44
43
42
41
40
39
44
40
39.6
43.8
p = .000

69.6
67.6
67.0
67.5
68.0
68.5
69.0
69.5
70.0
2003 2004
69.6
67.6
67.0
67.5
68.0
68.5
69.0
69.5
70.0
2003 2004
p = .008
RE
SP
EC
TF
UL
NE
SS
OF
ST
AF
FR
ES
PE
CT
FU
LN
ES
S O
F S
TA
FF
How the staff treats theresident with respect
How the staff treats theresident with respect

Facility Case StudyFacility Case Study

GOOD
2003 2004
TOTAL
2003 2004
EXCELLENT
Family surveysFamily surveys
Overallsatisfaction 33% 38% 43% 60% 76% 98%
Recommendation of facility 39% 48% 41% 45% 80% 93%
Quality of care from nurses 33% 30% 56% 64% 89% 94%
Quality of care from CNAs 33% 34% 48% 55% 81% 89%
2003 2004
IMPROVEMENT DECREASE

GOOD
2003 2004
TOTAL
2003 2004
EXCELLENT
Employee surveysEmployee surveys
Overallsatisfaction 6% 17% 39% 44% 45% 61%
Recommendation of facility asplace to work 18% 26% 32% 39% 50% 65%
Recommendationof facility as placeto receive care 15% 31% 42% 43% 57% 74%
2003 2004
IMPROVEMENT DECREASE

© 1/1/05, My InnerView Inc.™
RNs/LVNs/LPNs without absenteeismRNs/LVNs/LPNs without absenteeism
92%
93%
94%
95%
96%
97%
98%
99%
100%
N D J F M A M J J A S O
2003 2004
State Average Facility

© 1/1/05, My InnerView Inc.™
CNAs/NAs without absenteeismCNAs/NAs without absenteeism
88%
90%
92%
94%
96%
98%
100%
N D J F M A M J J A S O
2003 2004
State Average Facility
© 1/1/05, My InnerView Inc.™
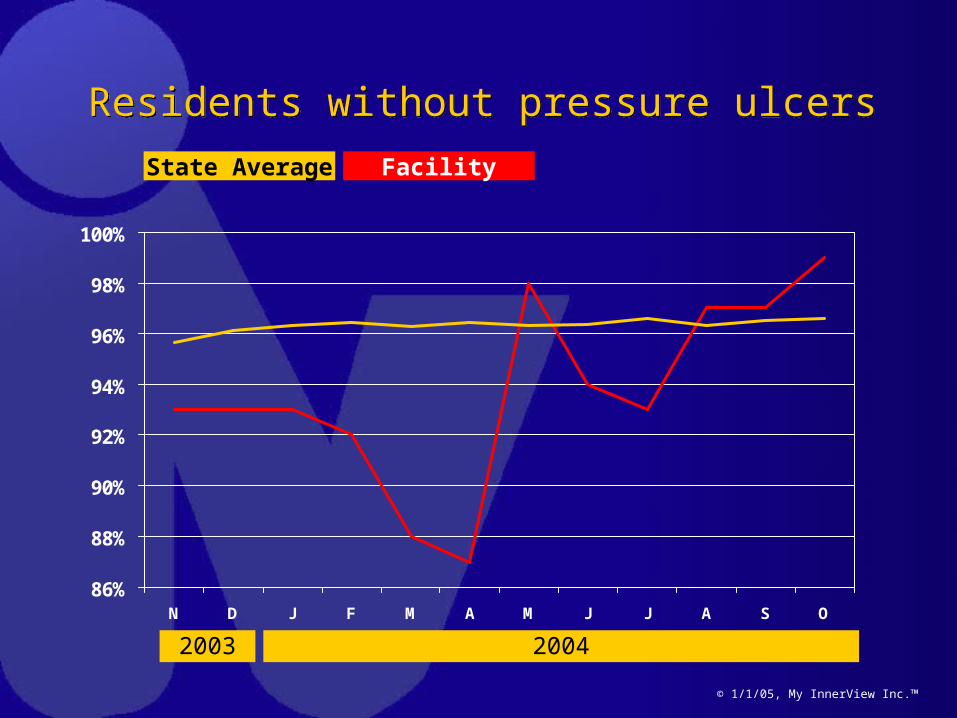
Residents without pressure ulcersResidents without pressure ulcers
86%
88%
90%
92%
94%
96%
98%
100%
N D J F M A M J J A S O
2003 2004
State Average Facility

Key pointsKey points
» Data are absolutely critical to benchmark performance statewide or within individual facilities.
» Without data you have no “beef”.
» Data are absolutely critical to benchmark performance statewide or within individual facilities.
» Without data you have no “beef”.

Statewide Clinical GA Metrics:
July 2003 to Dec 2004
Statewide Clinical GA Metrics:
July 2003 to Dec 2004
85.00
85.50
86.00
86.50
87.00
87.50
J A S O N D J F M A M J J A S O N D85.00
85.50
86.00
86.50
87.00
87.50
J A S O N D J F M A M J J A S O N D
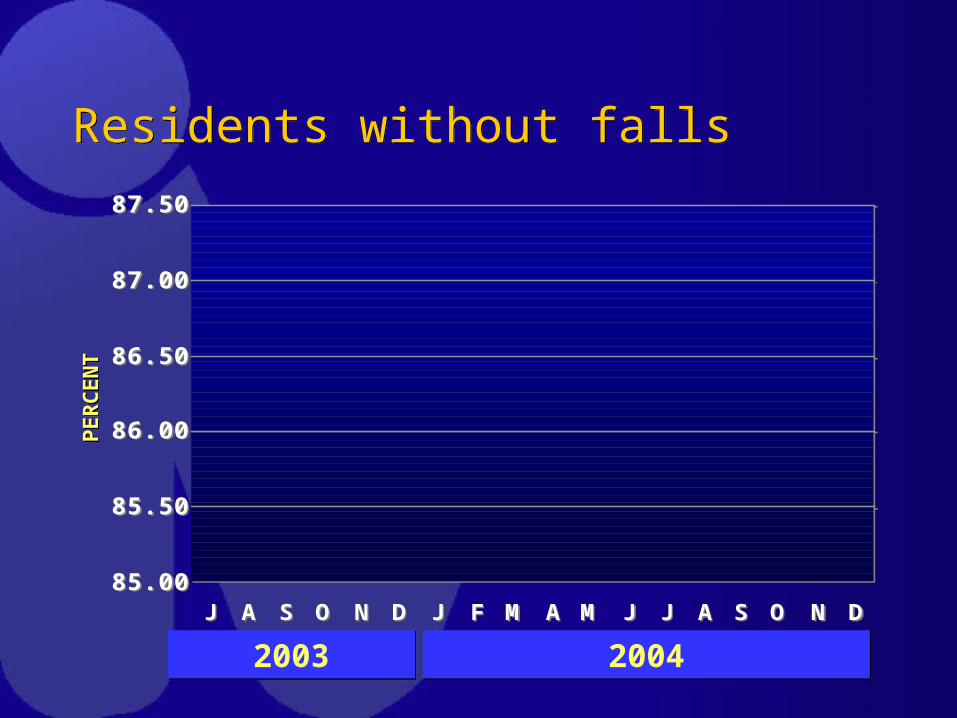
Residents without fallsResidents without fallsP
ER
CE
NT
PE
RC
EN
T
20032003 20042004
84.00
84.50
85.00
85.50
86.00
86.50
87.00
87.50
J A S O N D J F M A M J J A S O N D
84.00
84.50
85.00
85.50
86.00
86.50
87.00
87.50
J A S O N D J F M A M J J A S O N D
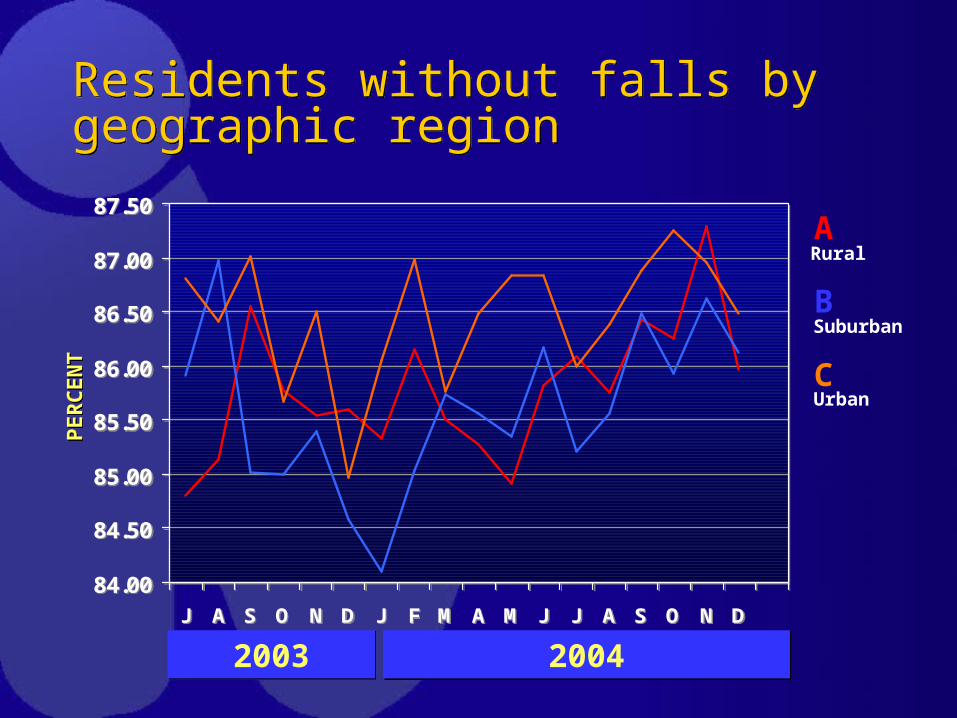
Residents without falls by geographic regionResidents without falls by geographic region
PE
RC
EN
TP
ER
CE
NT
20032003 20042004
A
B
C
Rural
Suburban
Urban

64.50
65.00
65.50
66.00
66.50
67.00
67.50
68.00
68.50
J A S O N D J F M A M J J A S O N D64.50
65.00
65.50
66.00
66.50
67.00
67.50
68.00
68.50
J A S O N D J F M A M J J A S O N D
Residents without anti-psychotic medicationsResidents without anti-psychotic medications
PE
RC
EN
TP
ER
CE
NT
20032003 20042004
55.00
58.00
61.00
64.00
67.00
70.00
73.00
J A S O N D J F M A M J J A S O N D
55.00
58.00
61.00
64.00
67.00
70.00
73.00
J A S O N D J F M A M J J A S O N D
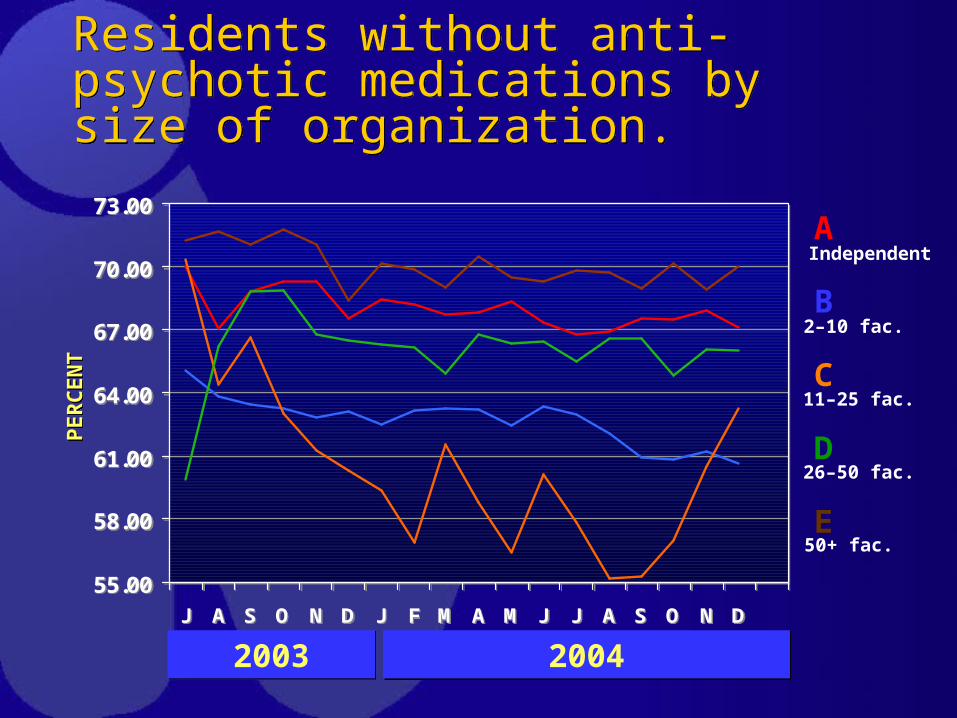
Residents without anti-psychotic medications by size of organization.
Residents without anti-psychotic medications by size of organization.
PE
RC
EN
TP
ER
CE
NT
20032003 20042004
A
B
C
D
E
Independent
2–10 fac.
11–25 fac.
26–50 fac.
50+ fac.

97.50
97.75
98.00
98.25
98.50
98.75
99.00
J A S O N D J F M A M J J A S O N D97.50
97.75
98.00
98.25
98.50
98.75
99.00
J A S O N D J F M A M J J A S O N D
Residents without acquired cathetersResidents without acquired catheters
PE
RC
EN
TP
ER
CE
NT
20032003 20042004

92.50
93.50
94.50
95.50
96.50
97.50
98.50
99.50
J A S O N D J F M A M J J A S O N D
92.50
93.50
94.50
95.50
96.50
97.50
98.50
99.50
J A S O N D J F M A M J J A S O N D
Residents without acquired catheters by ownership typeResidents without acquired catheters by ownership type
PE
RC
EN
TP
ER
CE
NT
20032003 20042004
A
B
C
Government owned (state, county or city)
Not-for-profit (with religious affiliation)
Not-for-profit (without religious affiliation)
D
E
For-profit (privatelyowned)
For-profit(publiclytraded)

90.50
91.00
91.50
92.00
92.50
J A S O N D J F M A M J J A S O N D90.50
91.00
91.50
92.00
92.50
J A S O N D J F M A M J J A S O N D
Residents without acquired physical restraintsResidents without acquired physical restraints
PE
RC
EN
TP
ER
CE
NT
20032003 20042004

86.50
88.50
90.50
92.50
94.50
96.50
J A S O N D J F M A M J J A S O N D
86.50
88.50
90.50
92.50
94.50
96.50
J A S O N D J F M A M J J A S O N D
Residents without acquired physical restraints by ownership type
Residents without acquired physical restraints by ownership type
PE
RC
EN
TP
ER
CE
NT
20032003 20042004
A
B
C
Government owned (state, county or city)
Not-for-profit (with religious affiliation)
Not-for-profit (without religious affiliation)
D
E
For-profit (privatelyowned)
For-profit(publiclytraded)
91.25
92.00
92.75
93.50
94.25
95.00
J A S O N D J F M A M J J A S O N D91.25
92.00
92.75
93.50
94.25
95.00
J A S O N D J F M A M J J A S O N D
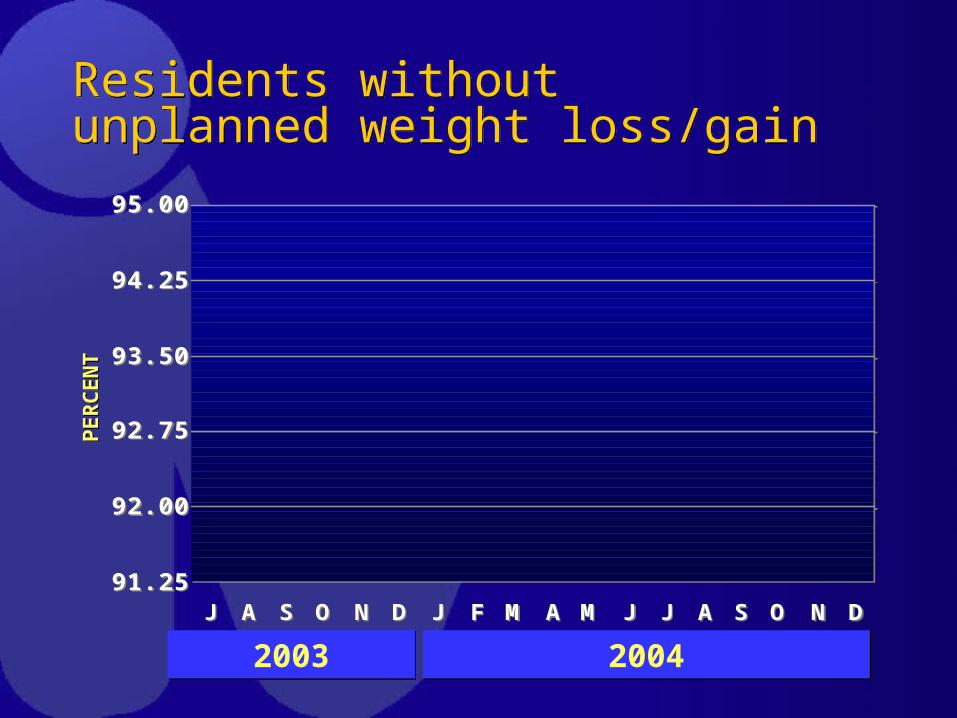
Residents without unplanned weight loss/gainResidents without unplanned weight loss/gain
PE
RC
EN
TP
ER
CE
NT
20032003 20042004

90.00
91.00
92.00
93.00
94.00
95.00
96.00
97.00
98.00
J A S O N D J F M A M J J A S O N D
90.00
91.00
92.00
93.00
94.00
95.00
96.00
97.00
98.00
J A S O N D J F M A M J J A S O N D
Residents without unplanned weight loss/gain by size of organization
Residents without unplanned weight loss/gain by size of organization
PE
RC
EN
TP
ER
CE
NT
20032003 20042004
A
B
C
D
E
Independent
2–10 fac.
11–25 fac.
26–50 fac.
50+ fac.

90.50
91.50
92.50
93.50
94.50
95.50
J A S O N D J F M A M J J A S O N D
90.50
91.50
92.50
93.50
94.50
95.50
J A S O N D J F M A M J J A S O N D
Residents without unplanned weight loss/gain by geographic region
Residents without unplanned weight loss/gain by geographic region
PE
RC
EN
TP
ER
CE
NT
20032003 20042004
A
B
C
Rural
Suburban
Urban

95.85
96.05
96.25
96.45
96.65
96.85
J A S O N D J F M A M J J A S O N D95.85
96.05
96.25
96.45
96.65
96.85
J A S O N D J F M A M J J A S O N D
Residents without acquired pressure ulcersResidents without acquired pressure ulcers
PE
RC
EN
TP
ER
CE
NT
20032003 20042004

94.50
95.00
95.50
96.00
96.50
97.00
97.50
98.00
J A S O N D J F M A M J J A S O N D
94.50
95.00
95.50
96.00
96.50
97.00
97.50
98.00
J A S O N D J F M A M J J A S O N D
Residents without acquired pressure ulcers by size of organization
Residents without acquired pressure ulcers by size of organization
PE
RC
EN
TP
ER
CE
NT
20032003 20042004
A
B
C
D
E
Independent
2–10 fac.
11–25 fac.
26–50 fac.
50+ fac.

Employee Commitment:
Statewide2003 and 2004
Employee Commitment:
Statewide2003 and 2004

93.00
93.50
94.00
94.50
95.00
95.50
J A S O N D J F M A M J J A S O N D93.00
93.50
94.00
94.50
95.00
95.50
J A S O N D J F M A M J J A S O N D
% CNAs/NAswithout turnover% CNAs/NAswithout turnover
PE
RC
EN
TP
ER
CE
NT
20032003 20042004

96.50
97.00
97.50
98.00
98.50
99.00
J A S O N D J F M A M J J A S O N D
96.50
97.00
97.50
98.00
98.50
99.00
J A S O N D J F M A M J J A S O N D
% CNAs/NAs without turnover by geographic region% CNAs/NAs without turnover by geographic region
PE
RC
EN
TP
ER
CE
NT
20032003 20042004
A
B
C
Rural
Suburban
Urban

95.00
95.50
96.00
96.50
97.00
J A S O N D J F M A M J J A S O N D95.00
95.50
96.00
96.50
97.00
J A S O N D J F M A M J J A S O N D
% RNs/LVNs/LPNswithout turnover% RNs/LVNs/LPNswithout turnover
PE
RC
EN
TP
ER
CE
NT
20032003 20042004

94.00
95.00
96.00
97.00
98.00
J A S O N D J F M A M J J A S O N D
94.00
95.00
96.00
97.00
98.00
J A S O N D J F M A M J J A S O N D
% RNs/LVNs/LPNs without turnover by geographic region% RNs/LVNs/LPNs without turnover by geographic region
PE
RC
EN
TP
ER
CE
NT
20032003 20042004
A
B
C
Rural
Suburban
Urban

61.00
61.75
62.50
63.25
64.00
64.75
65.50
J A S O N D J F M A M J J A S O N D61.00
61.75
62.50
63.25
64.00
64.75
65.50
J A S O N D J F M A M J J A S O N D
CNAs/NAs: StabilityCNAs/NAs: StabilityP
ER
CE
NT
PE
RC
EN
T
20032003 20042004

59.00
60.75
62.50
64.25
66.00
J A S O N D J F M A M J J A S O N D
59.00
60.75
62.50
64.25
66.00
J A S O N D J F M A M J J A S O N D
CNAs/NAs: Stability by Geographic RegionCNAs/NAs: Stability by Geographic Region
PE
RC
EN
TP
ER
CE
NT
20032003 20042004
A
B
C
Rural
Suburban
Urban

67.00
67.75
68.50
69.25
70.00
J A S O N D J F M A M J J A S O N D67.00
67.75
68.50
69.25
70.00
J A S O N D J F M A M J J A S O N D
RNs/LVNs/LPNs: StabilityRNs/LVNs/LPNs: StabilityP
ER
CE
NT
PE
RC
EN
T
20032003 20042004

59.00
61.00
63.00
65.00
67.00
69.00
71.00
73.00
J A S O N D J F M A M J J A S O N D
59.00
61.00
63.00
65.00
67.00
69.00
71.00
73.00
J A S O N D J F M A M J J A S O N D
RNs/LVNs/LPNs: Stability by Geographic RegionRNs/LVNs/LPNs: Stability by Geographic Region
PE
RC
EN
TP
ER
CE
NT
20032003 20042004
A
B
C
Rural
Suburban
Urban

59.00
62.00
65.00
68.00
71.00
74.00
J A S O N D J F M A M J J A S O N D
59.00
62.00
65.00
68.00
71.00
74.00
J A S O N D J F M A M J J A S O N D
RNs/LVNs/LPNs: Stability by Size of OrganizationRNs/LVNs/LPNs: Stability by Size of Organization
PE
RC
EN
TP
ER
CE
NT
20032003 20042004
A
B
C
D
E
Independent
2–10 fac.
11–25 fac.
26–50 fac.
50+ fac.

The Voiceof Families
2003 vs. 2004
The Voiceof Families
2003 vs. 2004

50%
60%
70%
80%
90%
100%2003 2004
© 1/1/05, My InnerView Inc.™
Recommendationto others
Recommendationto others
Overallsatisfaction
Overallsatisfaction
85% 84% 85% 84%

71.0
69.1
68.5
69.0
69.5
70.0
70.5
71.0
71.5
2003 2004
71.0
69.1
68.5
69.0
69.5
70.0
70.5
71.0
71.5
2003 2004
p = .005
CH
OIC
ES
/PR
FE
RE
NC
ES
CH
OIC
ES
/PR
FE
RE
NC
ES
How resident’s choices and preferences are met
How resident’s choices and preferences are met

74.3
73.2
73.0
73.5
74.0
74.5
75.0
2003 2004
74.3
73.2
73.0
73.5
74.0
74.5
75.0
2003 2004
p = .07
RE
SID
EN
T-T
O-R
ES
IDE
NT
FR
IEN
DS
HIP
SR
ES
IDE
NT
-TO
-RE
SID
EN
T F
RIE
ND
SH
IPS
How … offered opportunities for friendships with other residentsHow … offered opportunities for friendships with other residents
70.4
68.8
68.5
69.0
69.5
70.0
70.5
71.0
2003 2004
70.4
68.8
68.5
69.0
69.5
70.0
70.5
71.0
2003 2004
p = .03
ME
AN
ING
FU
LN
ES
S O
F A
CT
IVIT
IES
ME
AN
ING
FU
LN
ES
S O
F A
CT
IVIT
IES
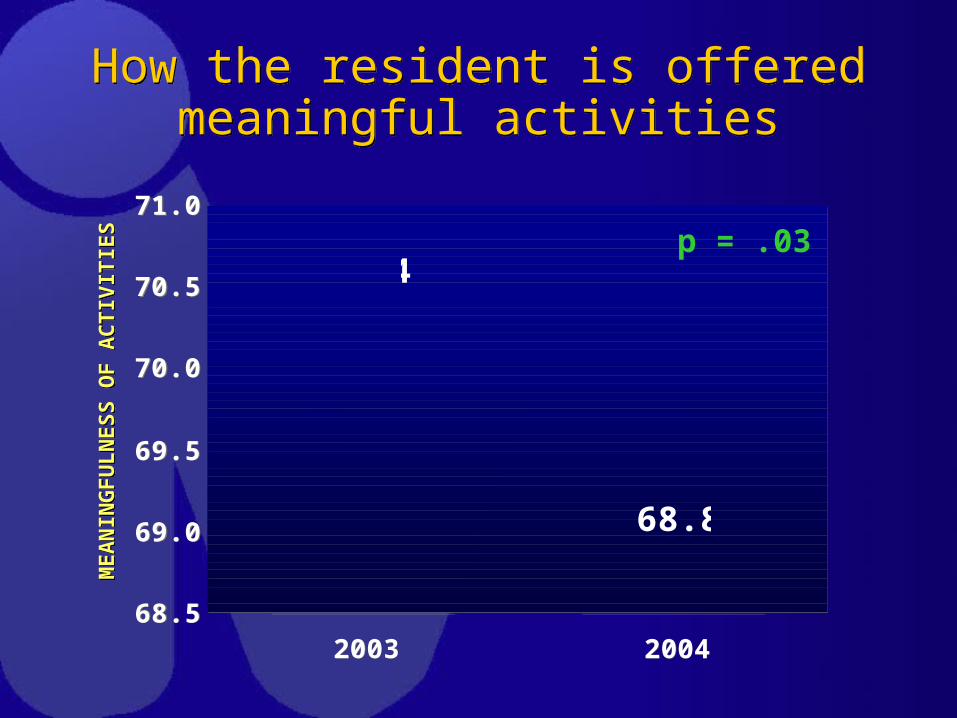
How the resident is offered meaningful activities
How the resident is offered meaningful activities

72.9
70.8
70.5
71.0
71.5
72.0
72.5
73.0
73.5
2003 2004
72.9
70.8
70.5
71.0
71.5
72.0
72.5
73.0
73.5
2003 2004
p = .001
RE
LIG
IOU
S/S
PIR
ITU
AL
OP
PO
RT
UN
ITIE
SR
EL
IGIO
US
/SP
IRIT
UA
L O
PP
OR
TU
NIT
IES
How resident’s religious and spiritual needs are met
How resident’s religious and spiritual needs are met

Organizational Systems Model
Family Satisfaction
Employee Satisfaction
Organizational Factors:
Size Ownership Chain Affiliation Geographic Location

Correlations between Employee Satisfaction and Family Satisfaction Sub-scales
Correlations between Employee Satisfaction and Family Satisfaction Sub-scales
Employee Satisfaction Sub-scales
Pearson
Correlation
Coefficient
Sample
Size
(N)
Training .415** 305
Supervision .921** 314
Management .904** 314
Work Environment .988** 314
Global Satisfaction .530** 305

Scatter Plot of Family Satisfaction and Work EnvironmentScatter Plot of Family Satisfaction and Work Environment
20.00 40.00 60.00 80.00 100.00
Family Satisfaction Percentage Score
30.00
40.00
50.00
60.00
70.00
80.00
90.00
100.00
Wo
rk E
nvi
ron
men
t P
erce
nta
ge
Sco
re

50
60
70
80
Lowest Low High Highest
Facilities with higher family satisfactionhave better work environmentsFacilities with higher family satisfactionhave better work environments
< 54% 54% to 58% 58% to 64% > 64%
Mean = 68.0
EM
PL
OY
EE
EN
VIR
ON
ME
NT
S
CO
RE
(%
)
FAMILY SATISFACTION

60
70
80
90
Lowest Low High Highest
Facilities with higher family satisfactionhave better supervisionFacilities with higher family satisfactionhave better supervision
< 54% 54% to 58% 58% to 64% > 64%
Mean = 72.2
EM
PL
OY
EE
SU
PE
RV
ISIO
N S
CO
RE
(%
)
FAMILY SATISFACTION

Predictors of Family SatisfactionPredictors of Family SatisfactionIndependent
VariableStandardized
BetaSignificance
Facility Size -.16 .003
Ownership Type .09 .098
Chain Type .19 .001
Geographic Region
.09 .074
Employee Satisfaction
Score
.42 .000
R2 = .327 (F=27.8; p < .000)

Creating a Culture of Quality
Creating a Culture of Quality

Quality Improvement ModelQuality Improvement Model
Feedback Loop (Performance Measurement System)
Leadership Core Systems Information Human Resource Clinical Operations Environmental Design
Performance Outcomes Quality of Life Quality of Care Quality of Workplace Staff Turnover Customer Satisfaction Regulatory Compliance

Evidence-basedManagement
Evidence-basedManagement
LeadershipLeadership
ExcellenceExcellence
Culture ChangeCulture Change
Three-legged Platform for ExcellenceThree-legged Platform for Excellence

Key OpportunitiesKey Opportunities
» Leadership development for culture change
» Enhancing quality of life and quality of the workplace through culture change
» Adopting the philosophy of evidence-based management
» Leadership development for culture change
» Enhancing quality of life and quality of the workplace through culture change
» Adopting the philosophy of evidence-based management

Key opportunities, cont’d.Key opportunities, cont’d.
» Policy assessment and development.» Resource allocation.» Pay for performance.» Incentivize best practices.» Reduce liability costs.» Data customization.» Benchmarking in Oklahoma and
outside.
» Policy assessment and development.» Resource allocation.» Pay for performance.» Incentivize best practices.» Reduce liability costs.» Data customization.» Benchmarking in Oklahoma and
outside.

Questions?Questions?
MANAGEMENT INTELLIGENCE FOR HEALTHCAREMANAGEMENT INTELLIGENCE FOR HEALTHCARE