
Okc economic forecast_2016_web
34
2016 GREATER OKLAHOMA CITY ECONOMIC FORECAST OKLAHOMA CITY METRO Prepared by Russell Evans Executive Director, Economist Steven C. Agee Economic Research and Policy Institute Oklahoma City University Eric Long Research Economist Economic Development Division Greater Oklahoma City Chamber [email protected] 405.297.8976 Greater Oklahoma City Chamber · 123 Park Ave. Oklahoma City, OK 73102 · 405.297.8900 www.okcchamber.com · www.greateroklahomacity.com
-
Upload
douglas-shaffer -
Category
Business
-
view
372 -
download
0
Transcript of Okc economic forecast_2016_web
2016
GREATER OKLAHOMA CITY ECONOMIC FORECAST
OKLAHOMA CITY METRO
Prepared by
Russell Evans
Executive Director, Economist
Steven C. Agee Economic Research
and Policy Institute
Oklahoma City University
Eric Long
Research Economist
Economic Development Division
Greater Oklahoma City Chamber
405.297.8976
Greater Oklahoma City Chamber · 123 Park Ave. Oklahoma City, OK 73102 · 405.297.8900www.okcchamber.com · www.greateroklahomacity.com
TABLE OF CONTENTS
Overview & Executive Summary ............................................................... 1
National Economic Conditions and Outlook ...................................... 9
Oklahoma Economic Trends and Outlook .........................................13
Oklahoma City MSA Economic Outlook .............................................. 17
OKC MSA Nonfarm Employment and Unemployment Rate ...........................................................................19
OKC MSA Mining Employment .............................................................. 20
OKC MSA Manufacturing ......................................................................... 20
OKC MSA Retail .............................................................................................21
Appendix A: U.S. Outlook Table .............................................................22
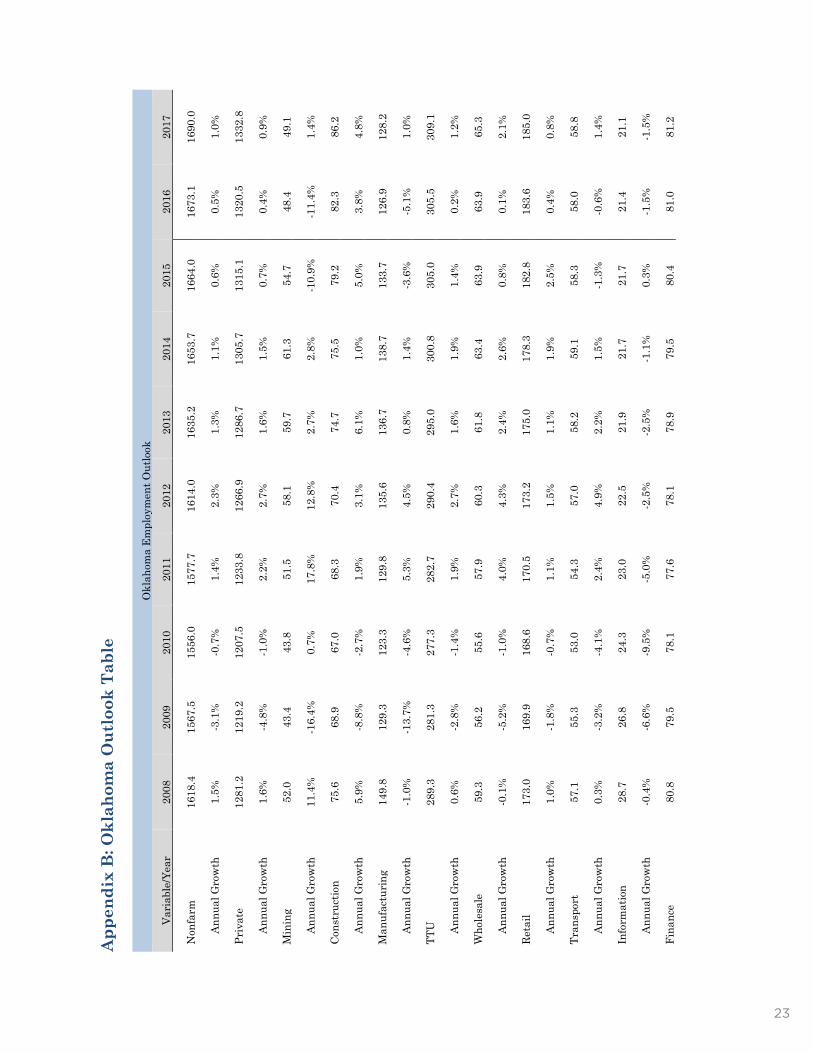
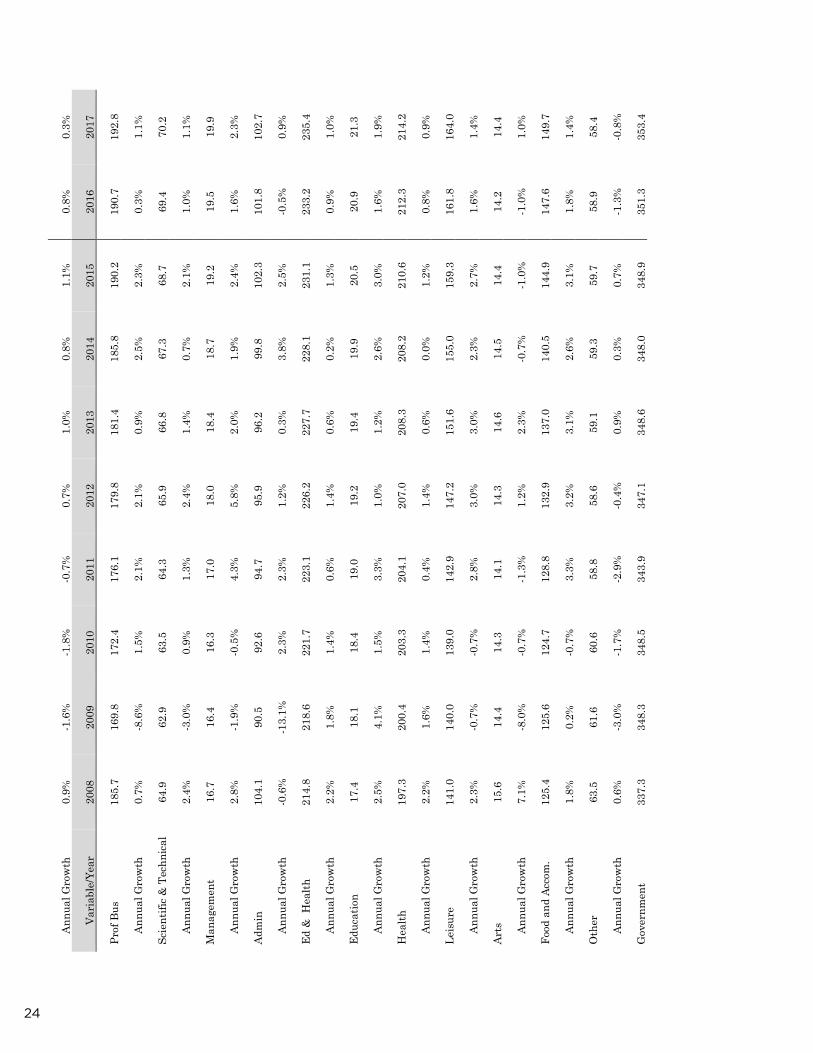
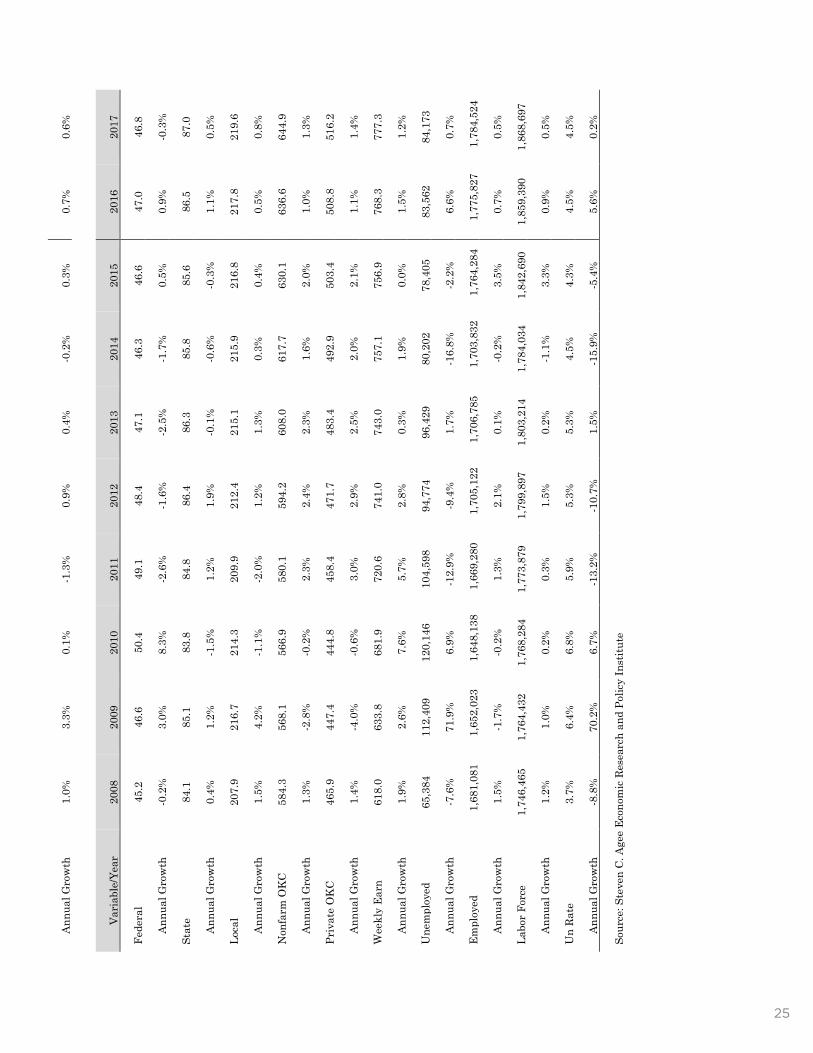
Appendix B: Statewide Employment and Earnings History and Forecast .......................................................23
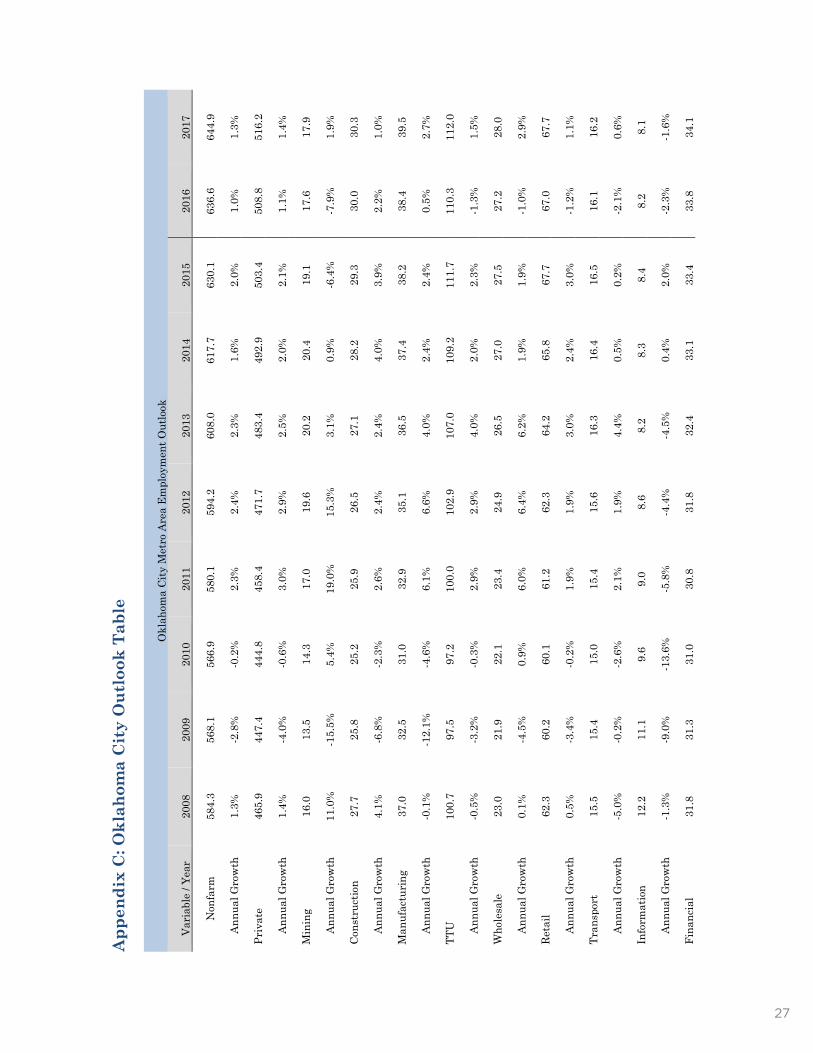
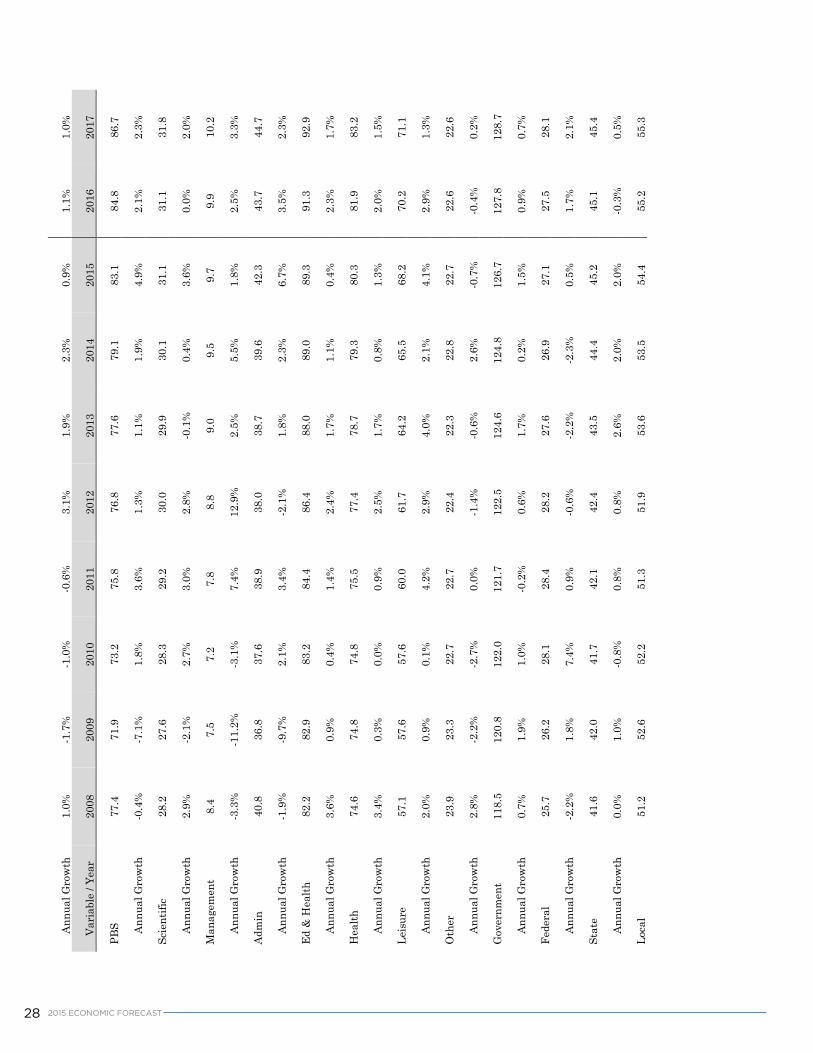
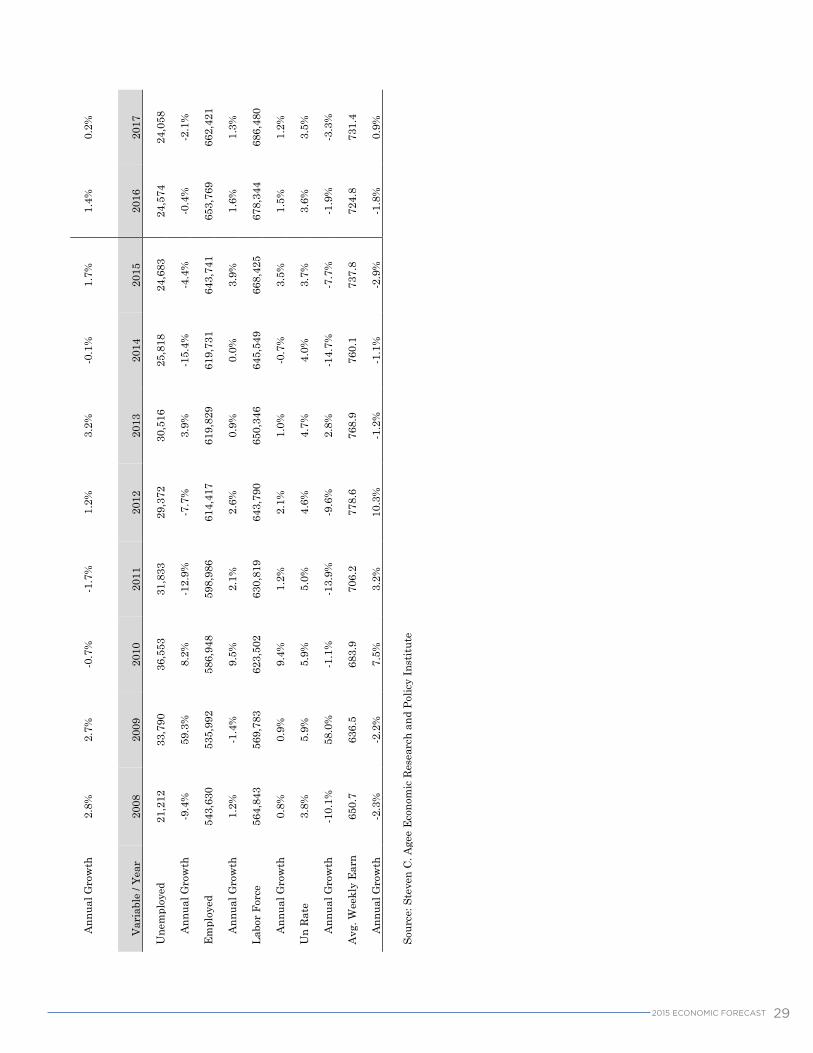
Appendix C: OKC MSA Employment and Earnings History and Forecast ......................................................27
12015 ECONOMIC FORECAST
The Greater Oklahoma City Economic Forecast provides a comprehensive analysis of the national, state and metro economies. It details historic trends, a snapshot of the current situation, as well as a forecast for 2016.
In 2015, the Oklahoma City metro benefited from economic diversity that offset employment losses experienced in the oil and gas sector. Overall, 12,000 jobs were added over prior year, or about 2 percent annual growth. However, Oklahoma City will be hampered by low oil and natural gas prices, and the downturn is expected to have some spillover impacts to other industry segments throughout 2016. Metro job growth in 2016 is expected to be relatively flat at 1 percent or 6,500 jobs.
Challenging economic conditions at the state level and low oil prices are expected to cause a drag on the Oklahoma City metro economy, especially through the first half of 2016. As a Tier 1 energy state, the statewide economy experienced a noticeable impact from the rapid decline in oil prices. Oklahoma, as a state, ranked 47th in job growth the past 12 months of 2015 (0.1 percent), with energy-producing states now filling nine of the bottom 10 slots. Oklahoma City was fortunate to be somewhat sheltered from the brunt of job declines last year. In 2015, the slowdown did not spread in a more systemic way to the broader services sector in the metro. Avoiding a change in that trend will be the biggest challenge that the Oklahoma City metro faces in 2016.
Unemployment for the metro remained low throughout 2015, ending the year near 3.6 percent (November 2015). Oklahoma
City has been among the 10 lowest unemployment large metros for nearly five years (59 consecutive months).
As expected, the current oil & gas environment will have an impact upon select commercial real estate projects. In early 2016, OG&E announced the postponement of construction on its new headquarters location in downtown Oklahoma City. Corresponding to this announcement, the plans for additional towers bringing more residential units and office space opportunities within the same block have also been postponed. Conversely, there was positive news surrounding the sale of the First National Center, the second largest office building in the metro (nearly one million square feet). A team led by local developer Gary Brooks and Texas contractor and developer Charlie Nicholas has a signed contract to purchase the property for $23 million. Plans call for converting the tower at 120 N Robinson into a mix of a hotel and apartments and to tear down two buildings and replace them with parking garages and retail on the first floor.
As one evaluates the broader economic picture, it is important to recognize the successes of the past year and how they can point toward future conditions.
Capital Expenditure from Chamber-Assisted Companies Reaches Five-Year High
2015 brought about the fifth and final year of a five-year economic development program called Forward Oklahoma City IV. As part of that program, overall chamber metrics are tracked for Chamber-assisted companies in five specific areas: job growth, wages, capital investment, tax
OVERVIEW
2 2015 ECONOMIC FORECAST
base and product innovation. In 2015, Chamber-assisted companies announced plans for the creation of 5,804 jobs with an average salary of $48,442. In addition, they announced more than $956.8 million in capital investment. This was the strongest announced capital investment during the five-year program. It was also the third consecutive year with more than $500 million in capital investment.
Five-Year Economic Development Campaign results approach 27,500 jobs, $1.5 million in payroll, and $2.7 billion in capital investment
The conclusion of Forward Oklahoma City IV led to cumulative five-year totals from Chamber-assisted companies of 27,496 jobs announced, $1.5 billion in payroll and $2.7 billion in capital investment. These announcements were tied to 926 projects worked on by the Greater Oklahoma City Economic Development team, including those from existing companies as well as new-to-market firms.
Following an April 2013 announcement, the GE Global Research Center started hiring in 2015 as it leased temporary office space at City Place downtown. The new facility at 300 NE 9th (just south of the Oklahoma School of Science and Mathematics) will open in 2016. The company’s first ever
research facility dedicated to oil & gas technologies will eventually employ 130 high-tech jobs and is expected to have a direct and indirect impact of $13 million on the state and local economies. At the end of 2015, GE was a little more than halfway toward its final hiring goal. It is anticipated to attract international attention from oil & gas partners around the world. Research from this facility will help to reduce costs and expand opportunities for oil and gas companies.
In 2015, Paycom announced plans for constructing a third building on its headquarter campus, resulting in a $16 million investment that will lead to an additional 423 jobs over the next 24 months. Paycom is a human capital technology firm built on payroll that launched in 1998.
Tinker Air Force Base made a February 2015 announcement that it acquired 158 acres of land on the west side of the base that will be used for a depot maintenance facility for the Air Force’s next-generation aerial refueling aircraft, the KC-46A Pegasus. The land purchase was made possible through a joint effort of the U.S. Air Force ($8 million), the City of Oklahoma City ($23.5 million), and Oklahoma County ($12.5 million). The land was formerly owned by Burlington
32015 ECONOMIC FORECAST
Northern Santa Fe Railway, where it operated a rail yard that primarily served the former General Motors manufacturing facility. The acquisition will lead to $500 million capital investment and 1,321 jobs.
The Boeing Company finished the year with approximately 2,400 employees in the Oklahoma City metro. In July 2015, Boeing broke ground on its new $80 million, 400,000-square-foot research and development / laboratory facility at SE 59th and Air Depot Boulevard (adjacent to Tinker Air Force Base). The location houses a portion of the 900 new jobs that Boeing announced in Fall 2014.
In August 2015, the Oklahoma Air National Guard was awarded a new mission that will result in 90 new jobs tied to the 137th Air Special Operations Wing located at Will Rogers. The MC-12W Liberty planes will be flying low-altitude reconnaissance missions over enemy positions and gather information to relay to U.S. soldiers and Marines on the ground.
Progentec Diagnostics, a bioscience company that has developed new autoimmune diagnostic tests (including one for lupus), announced that it will locate in University Research Park. The firm is collaborating with the Oklahoma Medical Research Foundation to commercialize its discovery. The company decided to locate in the region in part as a result of the participation by a broad spectrum of OKC-based companies and institutions in the 2015 annual BIO convention. Over time, about 30 jobs are expected to result from this announcement.
Progrexion ASG, a credit repair firm headquartered in Salt Lake City, announced in December 2015 that it will add 534 jobs in Oklahoma City. The company provides
a full range of services through its well-known brands Lexington Law and Creditrepair.com, the market leaders in consumer credit report repair. Progrexion will be housed in space at OKC Works building (former Lucent facility).
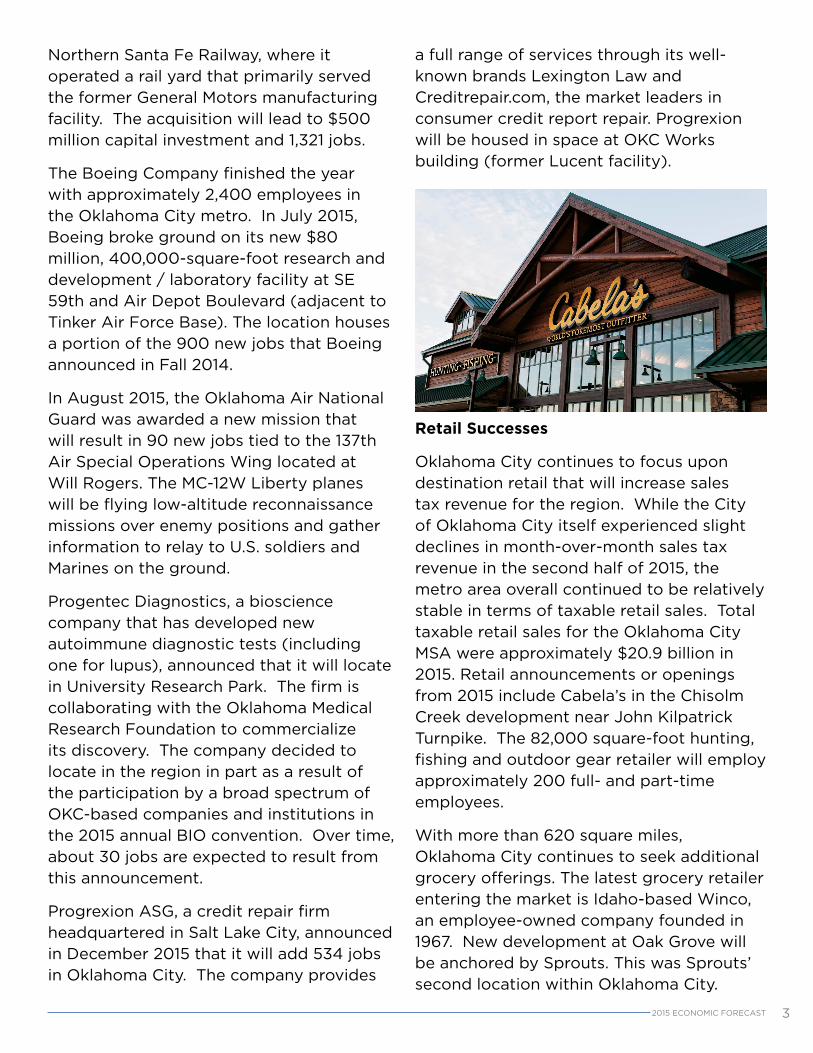
Retail Successes
Oklahoma City continues to focus upon destination retail that will increase sales tax revenue for the region. While the City of Oklahoma City itself experienced slight declines in month-over-month sales tax revenue in the second half of 2015, the metro area overall continued to be relatively stable in terms of taxable retail sales. Total taxable retail sales for the Oklahoma City MSA were approximately $20.9 billion in 2015. Retail announcements or openings from 2015 include Cabela’s in the Chisolm Creek development near John Kilpatrick Turnpike. The 82,000 square-foot hunting, fishing and outdoor gear retailer will employ approximately 200 full- and part-time employees.
With more than 620 square miles, Oklahoma City continues to seek additional grocery offerings. The latest grocery retailer entering the market is Idaho-based Winco, an employee-owned company founded in 1967. New development at Oak Grove will be anchored by Sprouts. This was Sprouts’ second location within Oklahoma City.
4 2015 ECONOMIC FORECAST
Rock legends Gene Simmons and Paul Stanley opened the first Oklahoma location of their Rock and Brews concept in Oklahoma City. This expanding national eatery chain, based in Kansas City, Mo., opened on the Memorial Corridor in October 2015.
Chisholm Creek continues to announce new-to-market concepts such as iFLY, an indoor skydiving adventure, and several restaurants will have locations in this prominent development, including locally-owned Republic Gastropub and Texas-based Fuzzy’s Tacos.
The land adjacent to American Fidelity’s new corporate headquarters at Interstate 235 and Wilshire Boulevard is slated to add an entertainment hub with retail and restaurant concepts.
With a successful and proven track record, The Outlet Shoppes at Oklahoma City draws new tenants such as North Face Outlet, Vera Bradley and Express Outlet. Penn Square Mall, the top-performing mall in the entire state, is aggressively repositioning space and making room for new tenants, including Madewell, Fly Zone, Kids Foot Locker, Luciano, Garage, Altar’d State and an expanded Champs as well as 11 other remodeling projects throughout the mall.
Sweden-based retailer H & M opened its first location in the state at Quail Springs Mall. The grand opening was the best (attendance/sales) in the store’s Midwest region. In addition, Maurice’s, a women’s clothing boutique, opened in August 2015.
Downtown Oklahoma City enjoyed several retail announcements and openings including Mahogany Prime Steak House, Revolve Pizza Kitchen, Brickopolis and Domino’s.
Classen Curve and The Triangle continue to bring in trendy tenants such as Kendra Scott, Impeccable Pig, Aveda Monroe Salon and Zoe’s Kitchen.
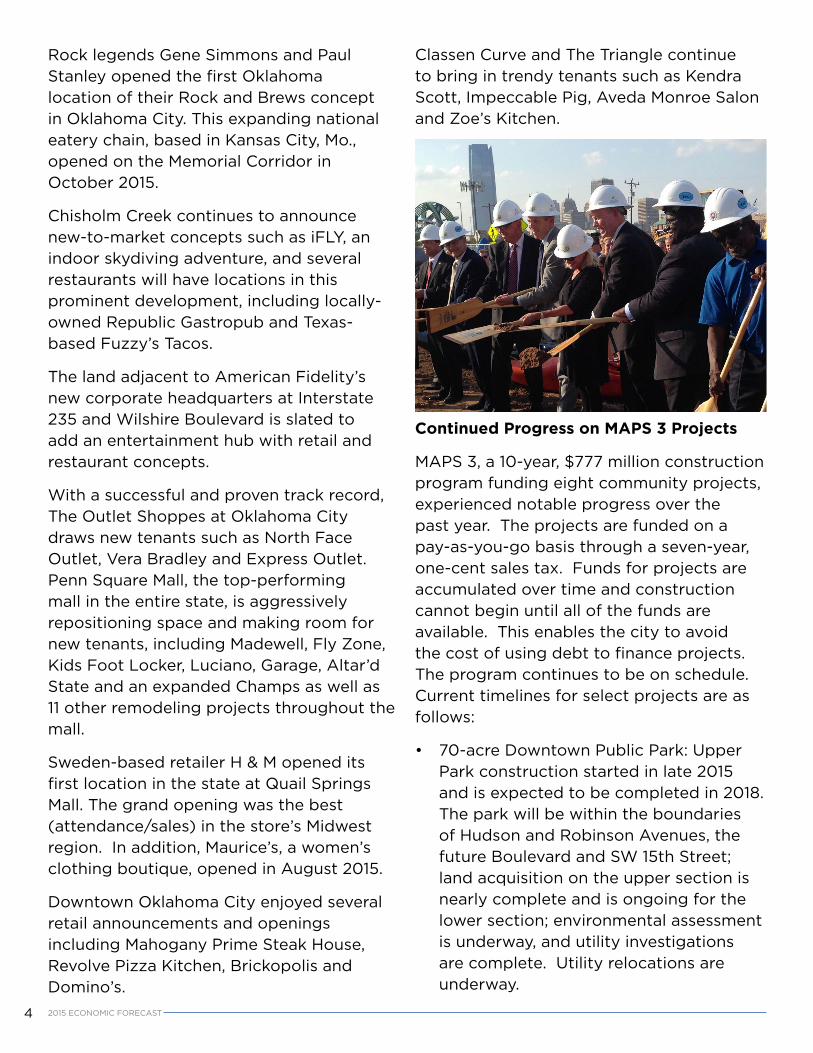
Continued Progress on MAPS 3 Projects
MAPS 3, a 10-year, $777 million construction program funding eight community projects, experienced notable progress over the past year. The projects are funded on a pay-as-you-go basis through a seven-year, one-cent sales tax. Funds for projects are accumulated over time and construction cannot begin until all of the funds are available. This enables the city to avoid the cost of using debt to finance projects. The program continues to be on schedule. Current timelines for select projects are as follows:
• 70-acre Downtown Public Park: Upper Park construction started in late 2015 and is expected to be completed in 2018. The park will be within the boundaries of Hudson and Robinson Avenues, the future Boulevard and SW 15th Street; land acquisition on the upper section is nearly complete and is ongoing for the lower section; environmental assessment is underway, and utility investigations are complete. Utility relocations are underway.
52015 ECONOMIC FORECAST
• Modern Streetcar/Transit: First phase of $130 million construction to be completed in 2016; system design is underway; Santa Fe Railroad station was acquired for use as an intermodal transit hub and design is underway on its renovation; design is underway on the maintenance facility; negotiations with the streetcar manufacturer are underway.
• Senior Health and Wellness Centers: In September 2015, ground was broken on first of four 40,000-square-foot wellness centers. Expected to be open in late 2016, the facility is located at NW 112th Street and Rockwell. The second facility will be located at SW Walker Avenue and Grand Boulevard.
• Oklahoma River improvements: Whitewater facility to offer rafting, kayaking and canoeing for all skill levels. Race course starting and lane-marking systems have been installed. Construction on racecourse lighting and Phase two improvements are complete. Riversport Rapids facility is under construction. Rafting and kayak will be used for Olympic Team Trials in May 2016.
• Oklahoma State Fairgrounds improvements: 290,000-square-feet Expo Center construction is expected to be complete in mid-2016.
• Convention Center: The site for the $287 million new convention center was determined to be just south of the Chesapeake Arena, running south from SW 4th Street to SW 7th Street, between Shields Boulevard and Robinson Avenue. Construction is expected to begin in spring 2017, with the building opening late in 2019.
• The MAPS 3 West River Trail opened in the summer of 2015 and connects the Lake Overholser Trails to the Oklahoma River. The next trail project will be the I-44 Trail along the Interstate 44 corridor.
MAPS 3 will be the culmination of over a decade of development, implementation and construction. These projects will help to shape the quality of life for Oklahoma City’s residents and visitors for years to come.
The following economic forecast is based upon historic growth models and does not necessarily take into account unanticipated growth from relocations or “new-to-market” firms. In addition, announced expansions of existing companies may take place over a multiyear timeframe and not be fully recognized in the next year. Announced projects that have not taken place are not reflected in forecasted job numbers.
6 2015 ECONOMIC FORECAST
EXECUTIVE SUMMARYLast year was described as a tug-of-war between the world’s only fully functioning (or nearly so) economy in the U.S. against the underperforming economies of the rest of the world. As 2015 draws to a close, the struggle is best described as a tie with 2016 serving as overtime. Unfortunately, the continued struggle implies both a disappointing year ahead and lingering uncertainty as to when conditions will improve or how much worse they can get.
The year ahead begins much as the year behind with the U.S. performing nearly to its long-run average and most of the rest of the developed world struggling to do as well. Global economic forecasts range from disappointment to recession with the
weakness stubbornly difficult to explain. The world is awash in both inexpensive commodities led by the collapse in crude oil prices and liquidity as quantitative easing has moved benchmark European interest rates into negative territory, testing the limits of the zero lower bound. Lingering global economic weakness caps any optimism of a recovery in crude oil prices and, by extension, any optimism of a return to robust Oklahoma economic activity.
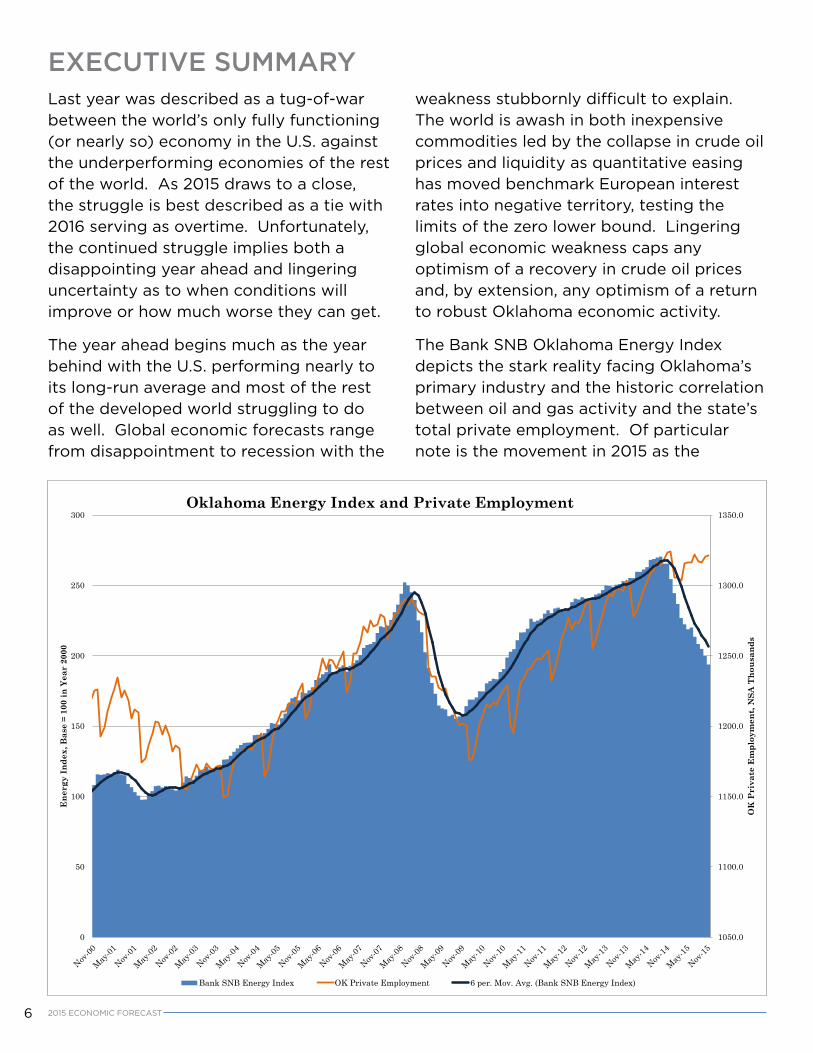
The Bank SNB Oklahoma Energy Index depicts the stark reality facing Oklahoma’s primary industry and the historic correlation between oil and gas activity and the state’s total private employment. Of particular note is the movement in 2015 as the
1050.0
1100.0
1150.0
1200.0
1250.0
1300.0
1350.0
0
50
100
150
200
250
300
OK
Pri
vate
Em
ploy
men
t, N
SA T
hous
ands
Ene
rgy
Inde
x, B
ase
= 10
0 in
Yea
r 20
00
Oklahoma Energy Index and Private Employment
Bank SNB Energy Index OK Private Employment 6 per. Mov. Avg. (Bank SNB Energy Index)
72015 ECONOMIC FORECAST
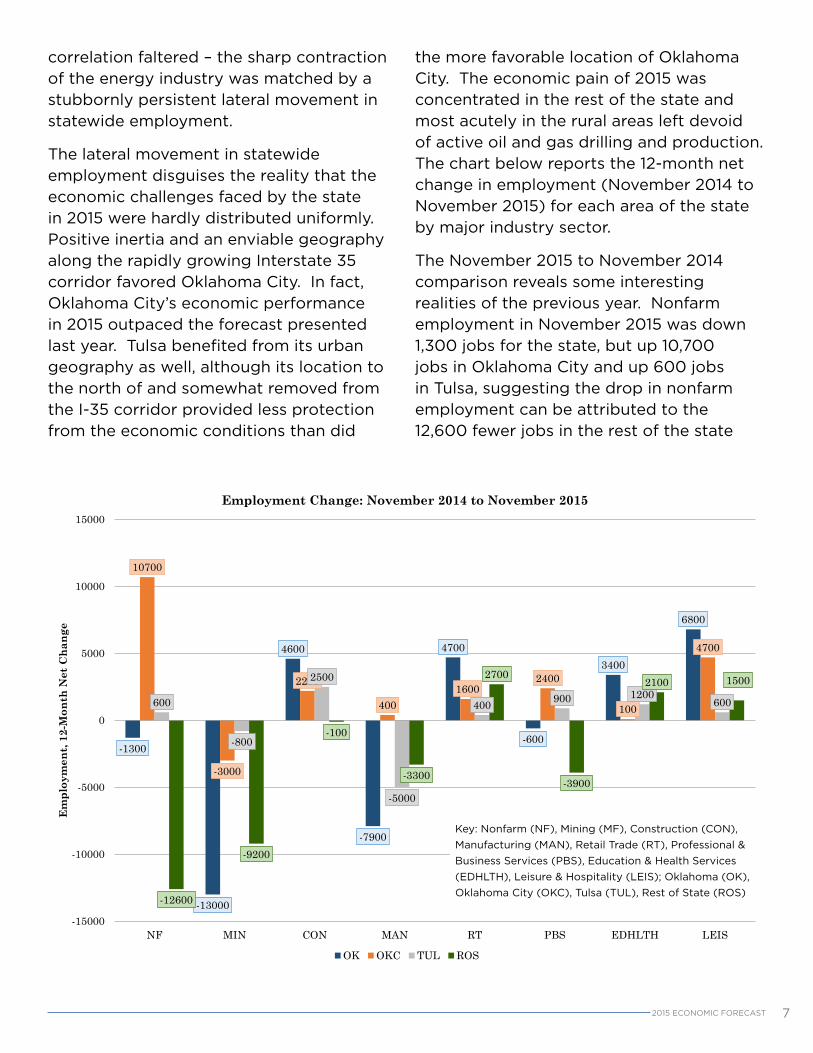
correlation faltered – the sharp contraction of the energy industry was matched by a stubbornly persistent lateral movement in statewide employment.
The lateral movement in statewide employment disguises the reality that the economic challenges faced by the state in 2015 were hardly distributed uniformly. Positive inertia and an enviable geography along the rapidly growing Interstate 35 corridor favored Oklahoma City. In fact, Oklahoma City’s economic performance in 2015 outpaced the forecast presented last year. Tulsa benefited from its urban geography as well, although its location to the north of and somewhat removed from the I-35 corridor provided less protection from the economic conditions than did
the more favorable location of Oklahoma City. The economic pain of 2015 was concentrated in the rest of the state and most acutely in the rural areas left devoid of active oil and gas drilling and production. The chart below reports the 12-month net change in employment (November 2014 to November 2015) for each area of the state by major industry sector.
The November 2015 to November 2014 comparison reveals some interesting realities of the previous year. Nonfarm employment in November 2015 was down 1,300 jobs for the state, but up 10,700 jobs in Oklahoma City and up 600 jobs in Tulsa, suggesting the drop in nonfarm employment can be attributed to the 12,600 fewer jobs in the rest of the state
-1300
-13000
4600
-7900
4700
-600
3400
6800
10700
-3000
2200
4001600
2400
100
4700
600
-800
2500
-5000
400 900 1200600
-12600
-9200
-100
-3300
2700
-3900
2100 1500
-15000
-10000
-5000
0
5000
10000
15000
NF MIN CON MAN RT PBS EDHLTH LEIS
Em
ploy
men
t, 12
-Mon
th N
et C
hang
e
Employment Change: November 2014 to November 2015
OK OKC TUL ROS
Key: Nonfarm (NF), Mining (MF), Construction (CON), Manufacturing (MAN), Retail Trade (RT), Professional & Business Services (PBS), Education & Health Services (EDHLTH), Leisure & Hospitality (LEIS); Oklahoma (OK), Oklahoma City (OKC), Tulsa (TUL), Rest of State (ROS)
8 2015 ECONOMIC FORECAST
(ROS). Mining (oil and gas) jobs are down 13,000 statewide with 3,800 of the lost jobs coming from the state’s metropolitan areas and the remainder (9,200 jobs) from the rest of the state. Manufacturing is up 400 jobs in Oklahoma City even as manufacturing employment statewide is down by 7,900 jobs (down 5,000 in Tulsa and 3,300 in the rest of the state). The remainder of the employment chart above tells much the same story.
While Oklahoma City benefits disproportionately from favorable geography, the long-run forces yielded to the short-run realities in the fall of 2015, foreshadowing the challenges that lie ahead. The worst is yet to come as Oklahoma City moves into its roughest stretch yet with the most acute economic pain expected to linger at least through the summer of 2016.
In creating a baseline economic forecast for the state and Oklahoma City metro area, a few background issues must first be resolved. First, a baseline expectation for the price path of crude oil must be established. Forecasting crude oil prices is admittedly a fool’s errand – and a well-documented fool’s errand at that (see Hamilton 2008, Understanding Crude Oil Prices). Nonetheless, a baseline expectation is necessary to anchor the economic forecast. Second, national economic expectations must be established. Finally, appropriate weighting must be given to both short-run and long-run forces that influence current levels of economic activity. Each of these background issues is discussed in turn in the subsequent section, followed by a formal summary of the economic outlook for Oklahoma and Oklahoma City. The full forecast tables for the U.S., Oklahoma, and Oklahoma City outlook are provided in the appendix.
92015 ECONOMIC FORECAST
THE INFLUENCE OF ENERGY, GEOGRAPHY, AND THE NATIONAL ECONOMYHeading into 2015, it was noted that the world’s economy was being powered by a single functioning engine in the U.S. economy. Little has changed since. The world’s economies, both developed and developing, are struggling to break free of the economic malaise that has come to characterize recent economic history. The economic malaise is inevitably accompanied by lesser demand for energy and the role of global economic growth (or the lack thereof) is often overlooked in explanations of global petroleum prices.
In fact, global energy prices are being hit from both sides – an excess supply and waning demand. Well productivity enhancements are maintaining U.S. crude oil production levels in spite of more than a year of capital reductions while foreign producers like Iraq and Libya have proved resilient in production in spite of domestic turmoil. Additionally, Iran (the fourth
largest producer of crude oil) anxiously prepares to return to global markets, as international sanctions are lifted and OPEC recently announced it would establish a production target in excess of 31 million barrels per day.
The combination of persistent supply and lack of demand is expected to continue at least through 2016 and very likely into 2017. A supply correction is slowly developing in the U.S., but is as yet unlikely to be accompanied by cohesive OPEC action. The best prospect for an abrupt turn in crude oil prices seems to be a breakout of economic activity and a return to robust demand for energy. Unfortunately, this turn would be almost as surprising as a substantive change in OPEC policy.
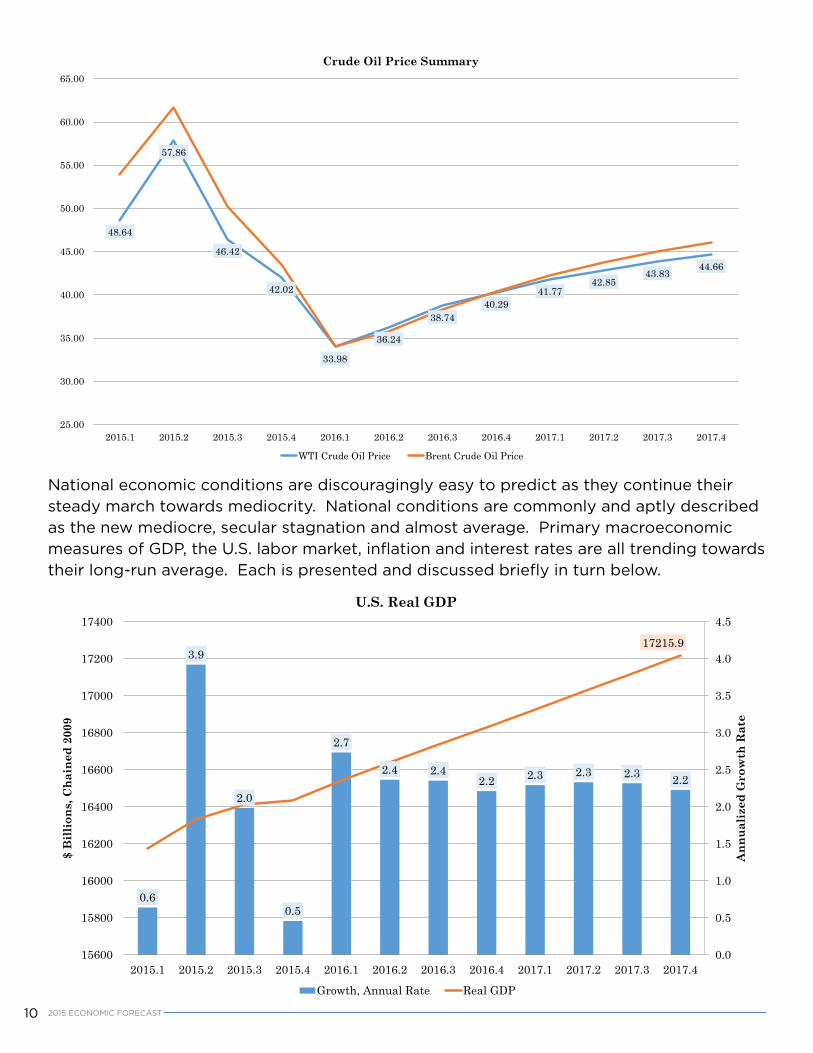
The baseline expectation is that oil prices bottom in the first quarter of 2016 and chart a slow recovery averaging $40 in the fourth quarter of 2016.
10 2015 ECONOMIC FORECAST
National economic conditions are discouragingly easy to predict as they continue their steady march towards mediocrity. National conditions are commonly and aptly described as the new mediocre, secular stagnation and almost average. Primary macroeconomic measures of GDP, the U.S. labor market, inflation and interest rates are all trending towards their long-run average. Each is presented and discussed briefly in turn below.
48.64
57.86
46.42
42.02
33.98
36.24
38.7440.29
41.7742.85
43.8344.66
25.00
30.00
35.00
40.00
45.00
50.00
55.00
60.00
65.00
2015.1 2015.2 2015.3 2015.4 2016.1 2016.2 2016.3 2016.4 2017.1 2017.2 2017.3 2017.4
Crude Oil Price Summary
WTI Crude Oil Price Brent Crude Oil Price
0.6
3.9
2.0
0.5
2.7
2.4 2.42.2 2.3 2.3 2.3 2.2
17215.9
0.0
0.5
1.0
1.5
2.0
2.5
3.0
3.5
4.0
4.5
15600
15800
16000
16200
16400
16600
16800
17000
17200
17400
2015.1 2015.2 2015.3 2015.4 2016.1 2016.2 2016.3 2016.4 2017.1 2017.2 2017.3 2017.4
Ann
ualiz
ed G
row
th R
ate
$ B
illio
ns, C
hain
ed 2
009
U.S. Real GDP
Growth, Annual Rate Real GDP
112015 ECONOMIC FORECAST
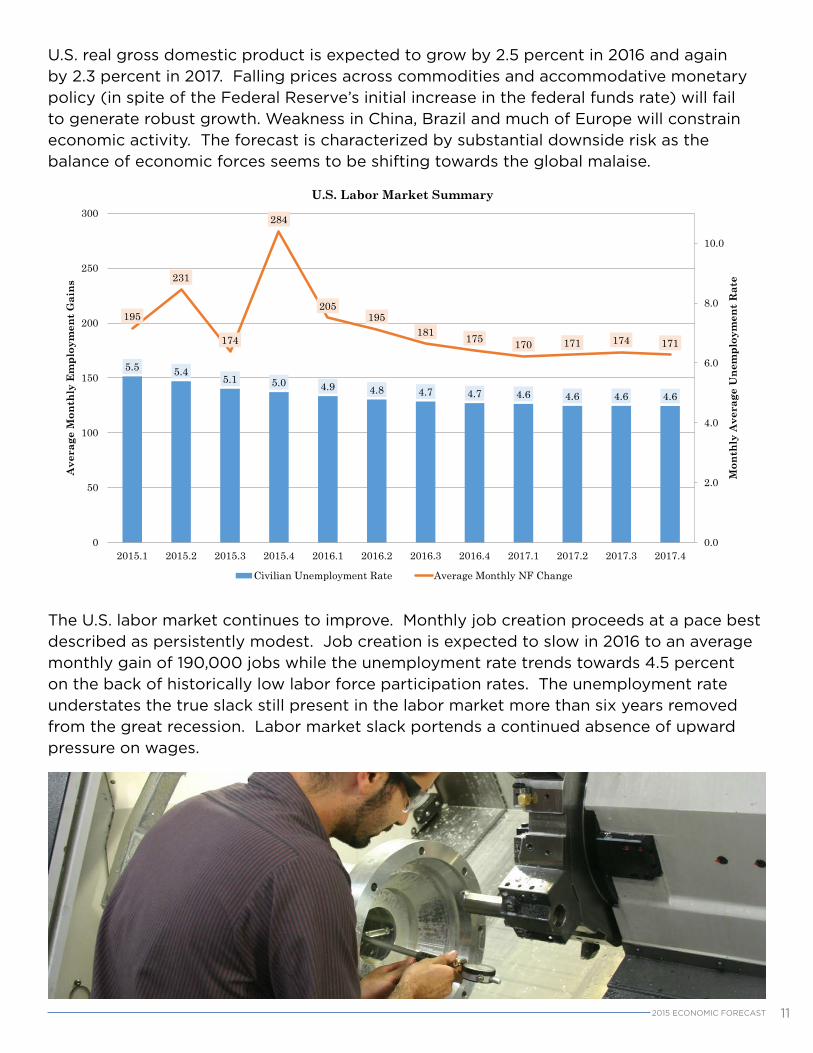
U.S. real gross domestic product is expected to grow by 2.5 percent in 2016 and again by 2.3 percent in 2017. Falling prices across commodities and accommodative monetary policy (in spite of the Federal Reserve’s initial increase in the federal funds rate) will fail to generate robust growth. Weakness in China, Brazil and much of Europe will constrain economic activity. The forecast is characterized by substantial downside risk as the balance of economic forces seems to be shifting towards the global malaise.
The U.S. labor market continues to improve. Monthly job creation proceeds at a pace best described as persistently modest. Job creation is expected to slow in 2016 to an average monthly gain of 190,000 jobs while the unemployment rate trends towards 4.5 percent on the back of historically low labor force participation rates. The unemployment rate understates the true slack still present in the labor market more than six years removed from the great recession. Labor market slack portends a continued absence of upward pressure on wages.
5.5 5.45.1 5.0 4.9 4.8 4.7 4.7 4.6 4.6 4.6 4.6
195
231
174
284
205195
181 175 170 171 174 171
0.0
2.0
4.0
6.0
8.0
10.0
0
50
100
150
200
250
300
2015.1 2015.2 2015.3 2015.4 2016.1 2016.2 2016.3 2016.4 2017.1 2017.2 2017.3 2017.4
Mon
thly
Ave
rage
Une
mpl
oym
ent R
ate
Ave
rage
Mon
thly
Em
ploy
men
t Gai
ns
U.S. Labor Market Summary
Civilian Unemployment Rate Average Monthly NF Change
12 2015 ECONOMIC FORECAST
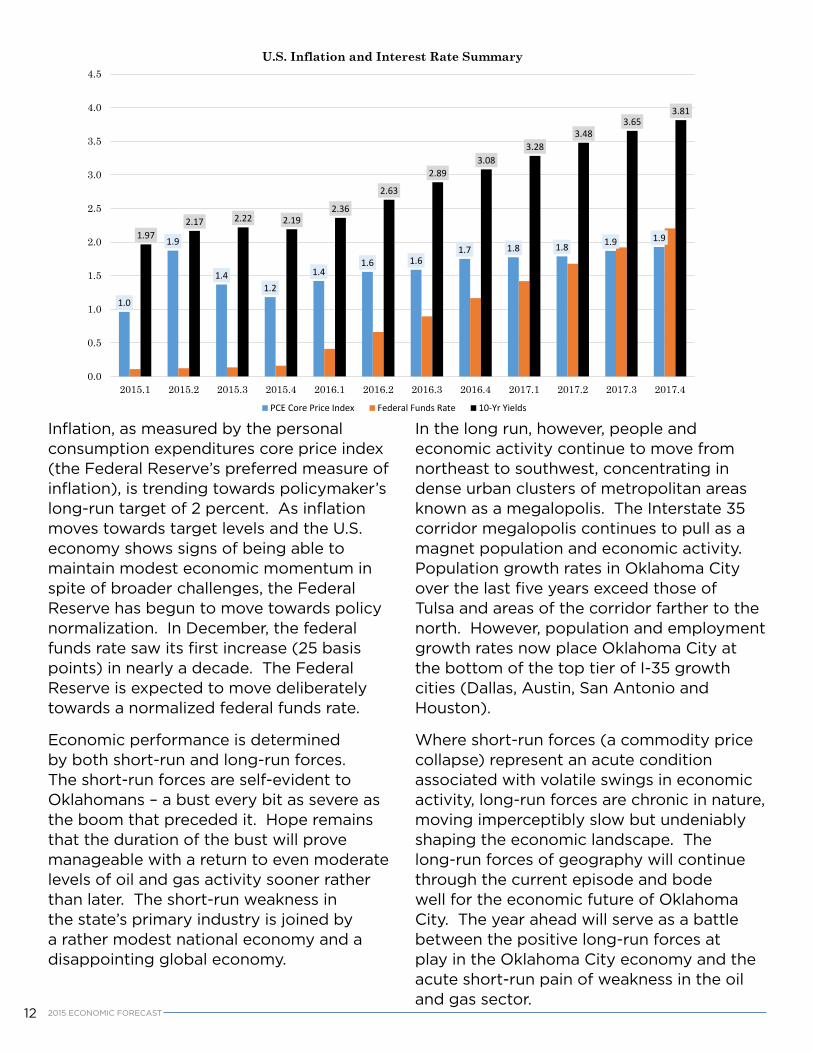
Inflation, as measured by the personal consumption expenditures core price index (the Federal Reserve’s preferred measure of inflation), is trending towards policymaker’s long-run target of 2 percent. As inflation moves towards target levels and the U.S. economy shows signs of being able to maintain modest economic momentum in spite of broader challenges, the Federal Reserve has begun to move towards policy normalization. In December, the federal funds rate saw its first increase (25 basis points) in nearly a decade. The Federal Reserve is expected to move deliberately towards a normalized federal funds rate.
Economic performance is determined by both short-run and long-run forces. The short-run forces are self-evident to Oklahomans – a bust every bit as severe as the boom that preceded it. Hope remains that the duration of the bust will prove manageable with a return to even moderate levels of oil and gas activity sooner rather than later. The short-run weakness in the state’s primary industry is joined by a rather modest national economy and a disappointing global economy.
In the long run, however, people and economic activity continue to move from northeast to southwest, concentrating in dense urban clusters of metropolitan areas known as a megalopolis. The Interstate 35 corridor megalopolis continues to pull as a magnet population and economic activity. Population growth rates in Oklahoma City over the last five years exceed those of Tulsa and areas of the corridor farther to the north. However, population and employment growth rates now place Oklahoma City at the bottom of the top tier of I-35 growth cities (Dallas, Austin, San Antonio and Houston).
Where short-run forces (a commodity price collapse) represent an acute condition associated with volatile swings in economic activity, long-run forces are chronic in nature, moving imperceptibly slow but undeniably shaping the economic landscape. The long-run forces of geography will continue through the current episode and bode well for the economic future of Oklahoma City. The year ahead will serve as a battle between the positive long-run forces at play in the Oklahoma City economy and the acute short-run pain of weakness in the oil and gas sector.
1.0
1.9
1.41.2
1.41.6 1.6
1.7 1.8 1.8 1.9 1.91.972.17 2.22 2.19
2.36
2.63
2.893.08
3.283.48
3.653.81
0.0
0.5
1.0
1.5
2.0
2.5
3.0
3.5
4.0
4.5
2015.1 2015.2 2015.3 2015.4 2016.1 2016.2 2016.3 2016.4 2017.1 2017.2 2017.3 2017.4
U.S. Inflation and Interest Rate Summary
PCE Core Price Index Federal Funds Rate 10-Yr Yields
132015 ECONOMIC FORECAST
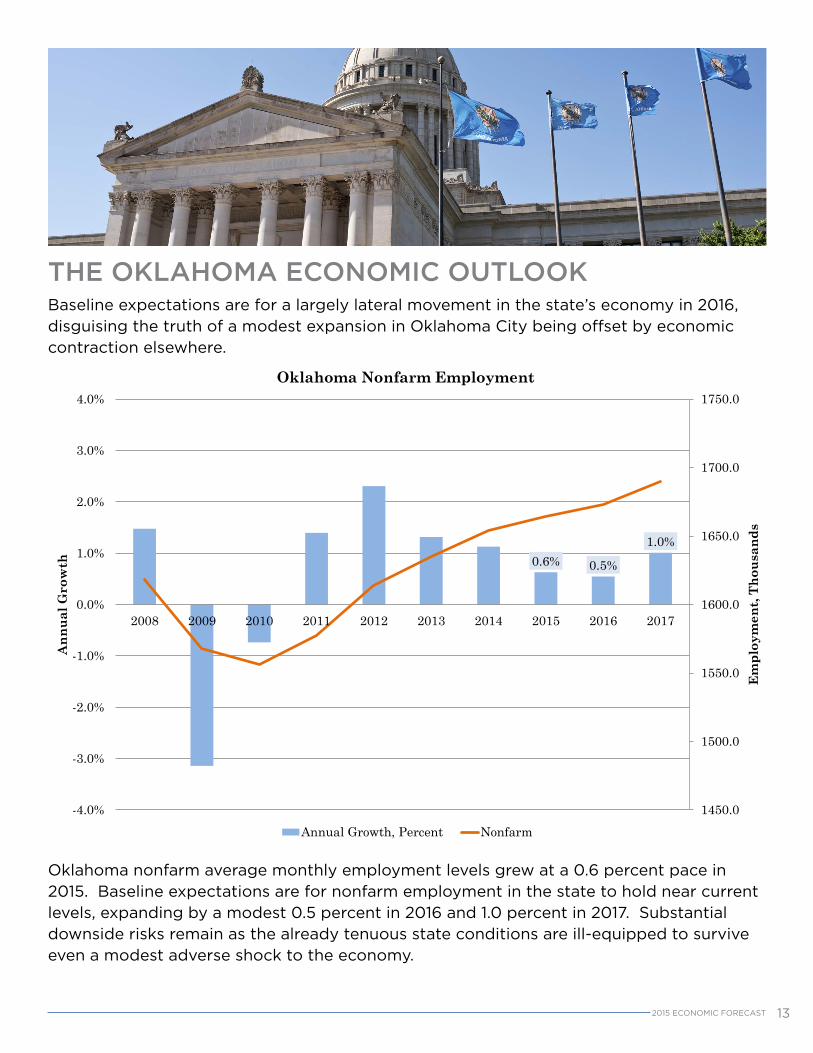
Baseline expectations are for a largely lateral movement in the state’s economy in 2016, disguising the truth of a modest expansion in Oklahoma City being offset by economic contraction elsewhere.
Oklahoma nonfarm average monthly employment levels grew at a 0.6 percent pace in 2015. Baseline expectations are for nonfarm employment in the state to hold near current levels, expanding by a modest 0.5 percent in 2016 and 1.0 percent in 2017. Substantial downside risks remain as the already tenuous state conditions are ill-equipped to survive even a modest adverse shock to the economy.
THE OKLAHOMA ECONOMIC OUTLOOK
0.6% 0.5%
1.0%
1450.0
1500.0
1550.0
1600.0
1650.0
1700.0
1750.0
-4.0%
-3.0%
-2.0%
-1.0%
0.0%
1.0%
2.0%
3.0%
4.0%
2008 2009 2010 2011 2012 2013 2014 2015 2016 2017
Em
ploy
men
t, Th
ousa
nds
Ann
ual G
row
th
Oklahoma Nonfarm Employment
Annual Growth, Percent Nonfarm
14 2015 ECONOMIC FORECAST
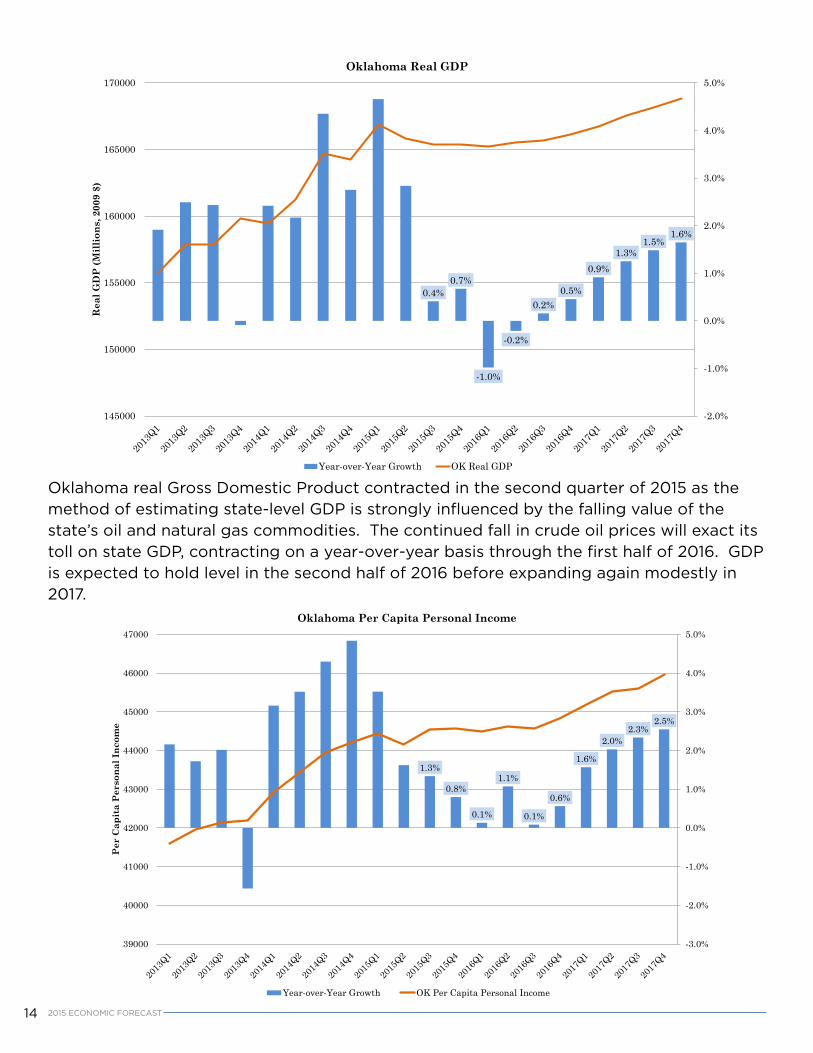
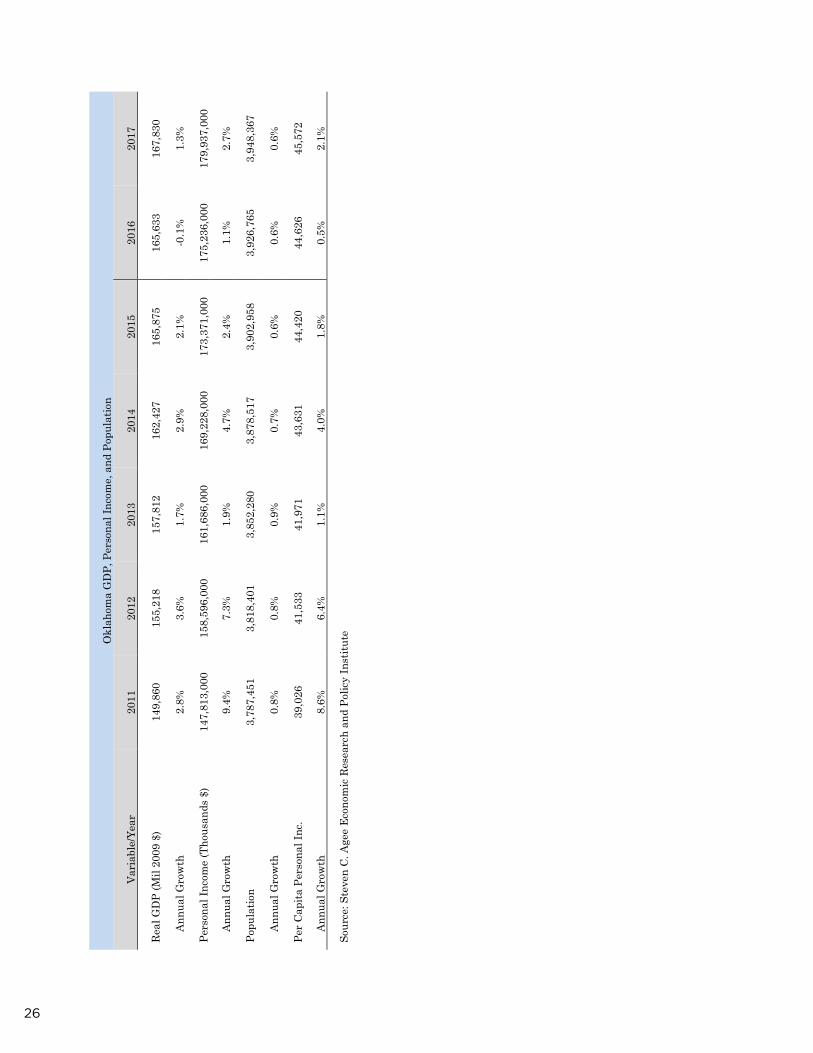
Oklahoma real Gross Domestic Product contracted in the second quarter of 2015 as the method of estimating state-level GDP is strongly influenced by the falling value of the state’s oil and natural gas commodities. The continued fall in crude oil prices will exact its toll on state GDP, contracting on a year-over-year basis through the first half of 2016. GDP is expected to hold level in the second half of 2016 before expanding again modestly in 2017.
0.4%0.7%
-1.0%
-0.2%
0.2%0.5%
0.9%1.3%
1.5%1.6%
-2.0%
-1.0%
0.0%
1.0%
2.0%
3.0%
4.0%
5.0%
145000
150000
155000
160000
165000
170000R
eal G
DP
(Mill
ions
, 200
9 $)
Oklahoma Real GDP
Year-over-Year Growth OK Real GDP
1.3%
0.8%
0.1%
1.1%
0.1%
0.6%
1.6%
2.0%2.3%
2.5%
-3.0%
-2.0%
-1.0%
0.0%
1.0%
2.0%
3.0%
4.0%
5.0%
39000
40000
41000
42000
43000
44000
45000
46000
47000
Per
Cap
ita
Per
sona
l Inc
ome
Oklahoma Per Capita Personal Income
Year-over-Year Growth OK Per Capita Personal Income
152015 ECONOMIC FORECAST
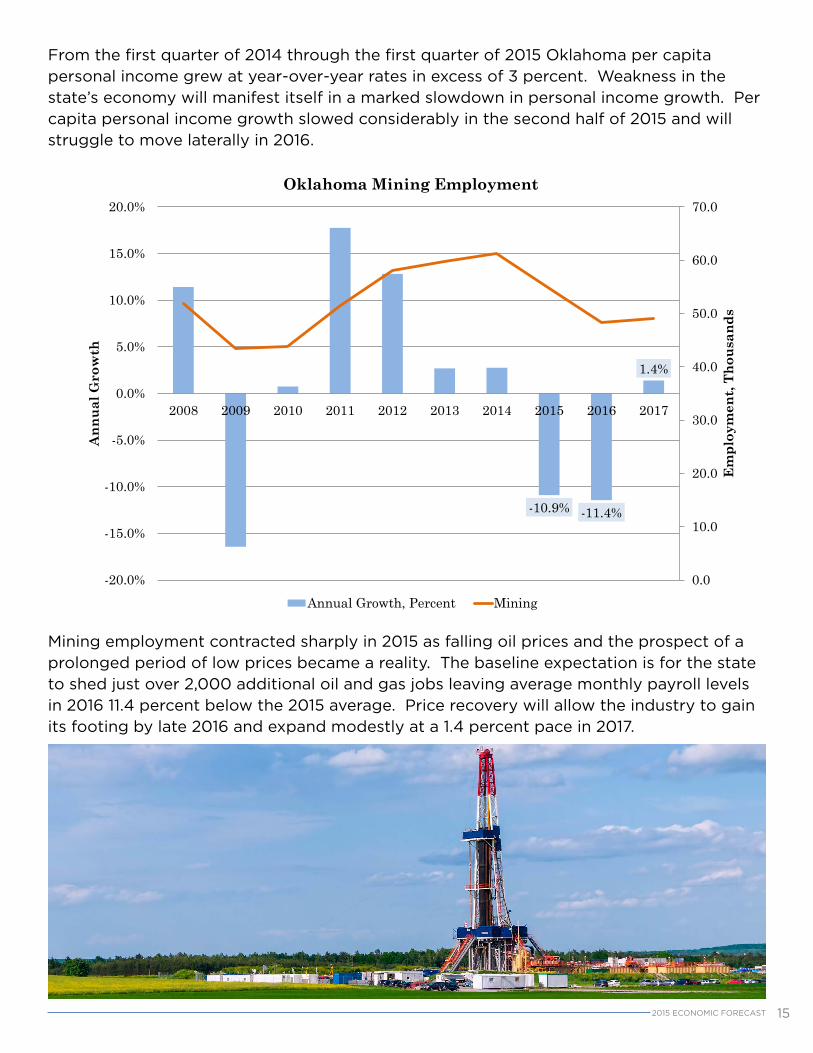
From the first quarter of 2014 through the first quarter of 2015 Oklahoma per capita personal income grew at year-over-year rates in excess of 3 percent. Weakness in the state’s economy will manifest itself in a marked slowdown in personal income growth. Per capita personal income growth slowed considerably in the second half of 2015 and will struggle to move laterally in 2016.
Mining employment contracted sharply in 2015 as falling oil prices and the prospect of a prolonged period of low prices became a reality. The baseline expectation is for the state to shed just over 2,000 additional oil and gas jobs leaving average monthly payroll levels in 2016 11.4 percent below the 2015 average. Price recovery will allow the industry to gain its footing by late 2016 and expand modestly at a 1.4 percent pace in 2017.
-10.9% -11.4%
1.4%
0.0
10.0
20.0
30.0
40.0
50.0
60.0
70.0
-20.0%
-15.0%
-10.0%
-5.0%
0.0%
5.0%
10.0%
15.0%
20.0%
2008 2009 2010 2011 2012 2013 2014 2015 2016 2017
Em
ploy
men
t, Th
ousa
nds
Ann
ual G
row
th
Oklahoma Mining Employment
Annual Growth, Percent Mining
16 2015 ECONOMIC FORECAST
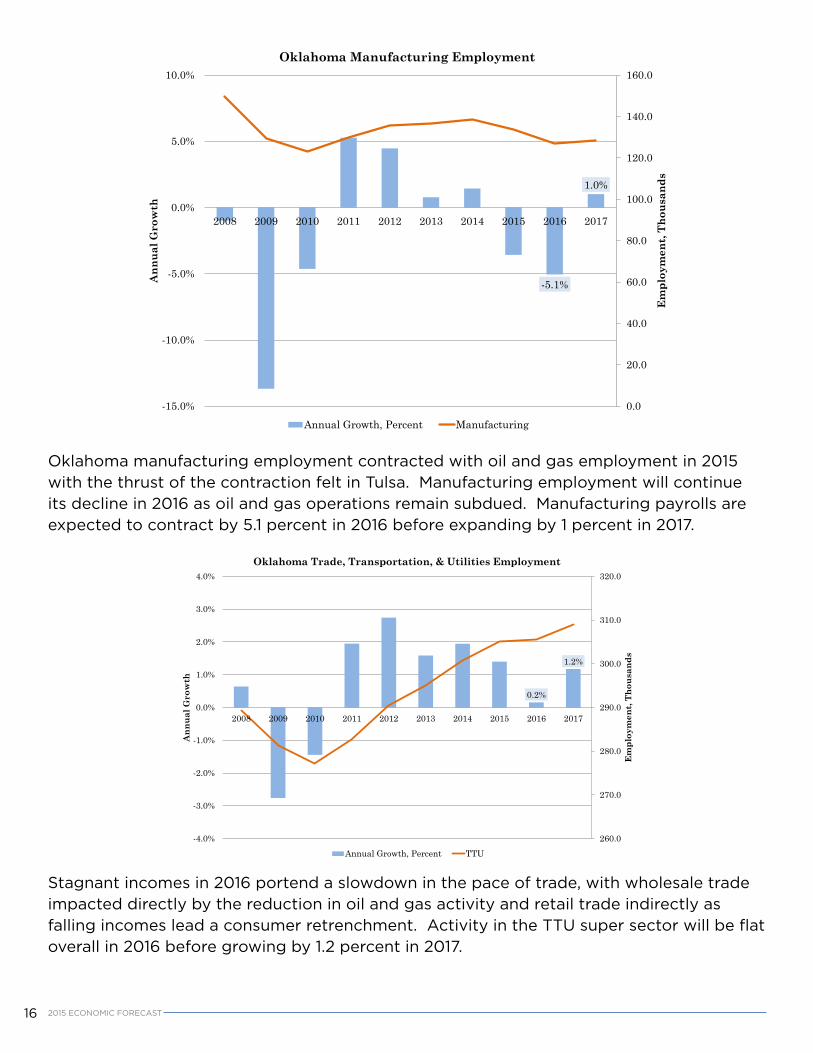
Oklahoma manufacturing employment contracted with oil and gas employment in 2015 with the thrust of the contraction felt in Tulsa. Manufacturing employment will continue its decline in 2016 as oil and gas operations remain subdued. Manufacturing payrolls are expected to contract by 5.1 percent in 2016 before expanding by 1 percent in 2017.
-5.1%
1.0%
0.0
20.0
40.0
60.0
80.0
100.0
120.0
140.0
160.0
-15.0%
-10.0%
-5.0%
0.0%
5.0%
10.0%
2008 2009 2010 2011 2012 2013 2014 2015 2016 2017
Em
ploy
men
t, Th
ousa
nds
Ann
ual G
row
th
Oklahoma Manufacturing Employment
Annual Growth, Percent Manufacturing
Stagnant incomes in 2016 portend a slowdown in the pace of trade, with wholesale trade impacted directly by the reduction in oil and gas activity and retail trade indirectly as falling incomes lead a consumer retrenchment. Activity in the TTU super sector will be flat overall in 2016 before growing by 1.2 percent in 2017.
0.2%
1.2%
260.0
270.0
280.0
290.0
300.0
310.0
320.0
-4.0%
-3.0%
-2.0%
-1.0%
0.0%
1.0%
2.0%
3.0%
4.0%
2008 2009 2010 2011 2012 2013 2014 2015 2016 2017
Em
ploy
men
t, Th
ousa
nds
Ann
ual G
row
th
Oklahoma Trade, Transportation, & Utilities Employment
Annual Growth, Percent TTU
172015 ECONOMIC FORECAST
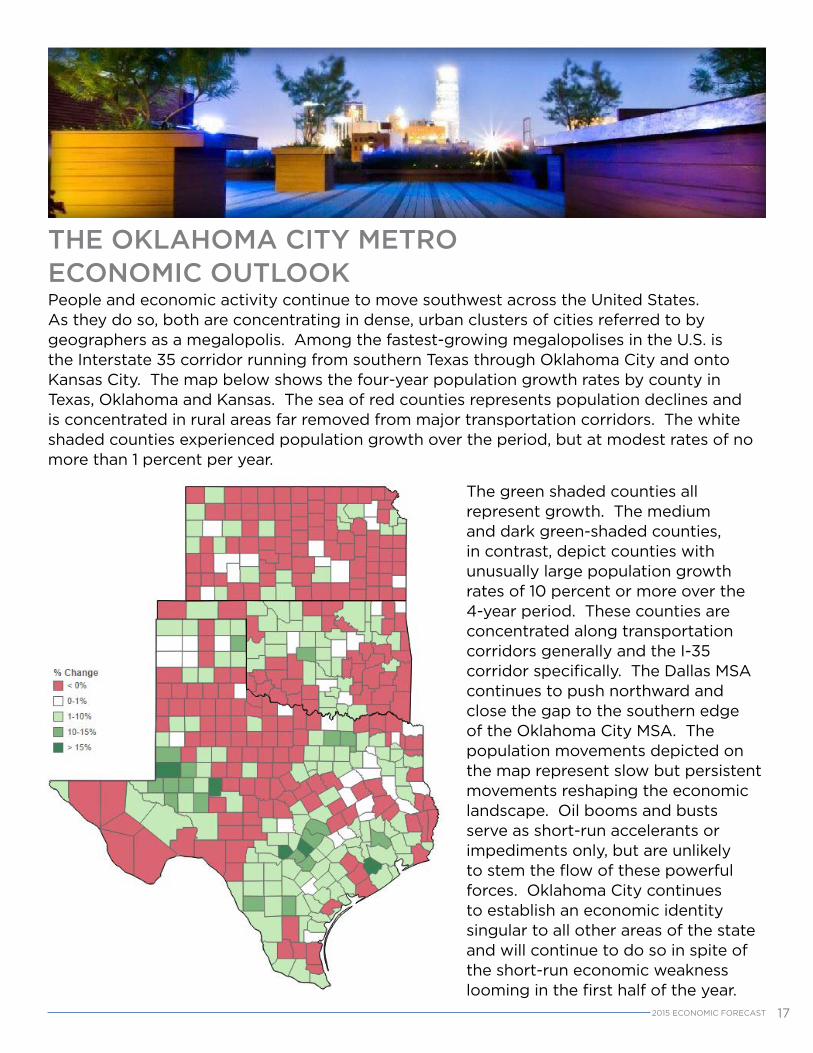
People and economic activity continue to move southwest across the United States. As they do so, both are concentrating in dense, urban clusters of cities referred to by geographers as a megalopolis. Among the fastest-growing megalopolises in the U.S. is the Interstate 35 corridor running from southern Texas through Oklahoma City and onto Kansas City. The map below shows the four-year population growth rates by county in Texas, Oklahoma and Kansas. The sea of red counties represents population declines and is concentrated in rural areas far removed from major transportation corridors. The white shaded counties experienced population growth over the period, but at modest rates of no more than 1 percent per year.
The green shaded counties all represent growth. The medium and dark green-shaded counties, in contrast, depict counties with unusually large population growth rates of 10 percent or more over the 4-year period. These counties are concentrated along transportation corridors generally and the I-35 corridor specifically. The Dallas MSA continues to push northward and close the gap to the southern edge of the Oklahoma City MSA. The population movements depicted on the map represent slow but persistent movements reshaping the economic landscape. Oil booms and busts serve as short-run accelerants or impediments only, but are unlikely to stem the flow of these powerful forces. Oklahoma City continues to establish an economic identity singular to all other areas of the state and will continue to do so in spite of the short-run economic weakness looming in the first half of the year.
THE OKLAHOMA CITY METRO ECONOMIC OUTLOOK
18 2015 ECONOMIC FORECAST
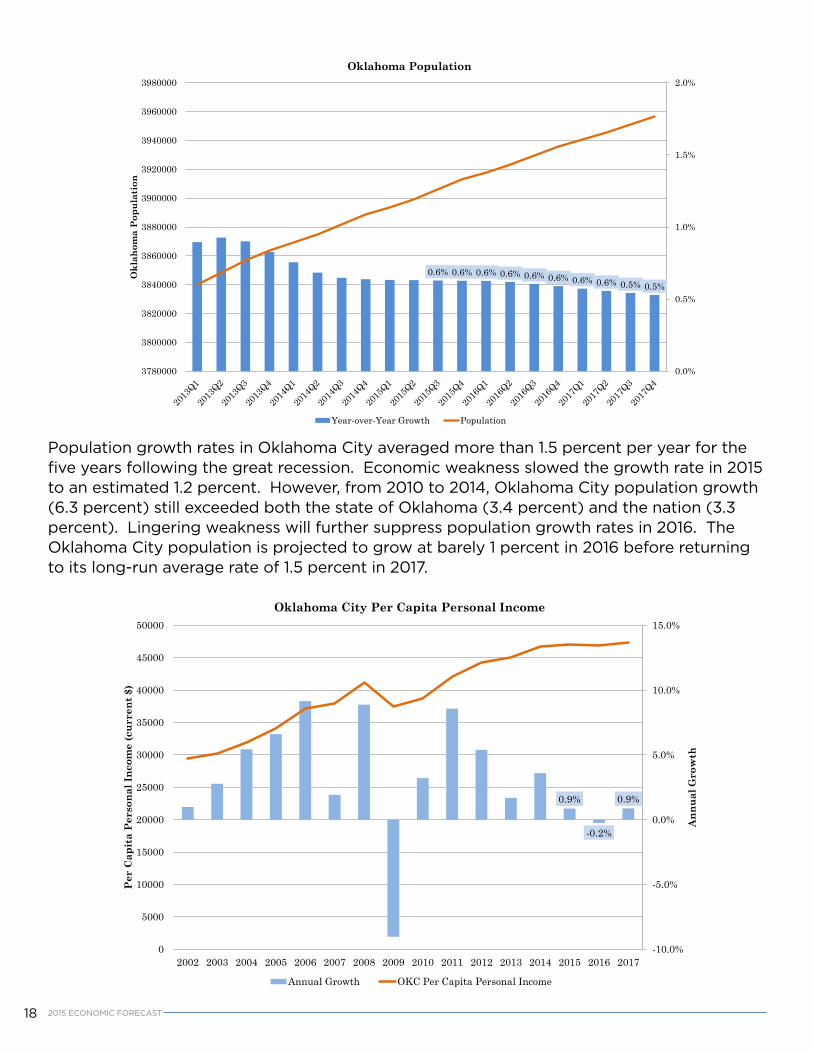
Population growth rates in Oklahoma City averaged more than 1.5 percent per year for the five years following the great recession. Economic weakness slowed the growth rate in 2015 to an estimated 1.2 percent. However, from 2010 to 2014, Oklahoma City population growth (6.3 percent) still exceeded both the state of Oklahoma (3.4 percent) and the nation (3.3 percent). Lingering weakness will further suppress population growth rates in 2016. The Oklahoma City population is projected to grow at barely 1 percent in 2016 before returning to its long-run average rate of 1.5 percent in 2017.
0.6% 0.6% 0.6% 0.6% 0.6% 0.6% 0.6% 0.6% 0.5% 0.5%
0.0%
0.5%
1.0%
1.5%
2.0%
3780000
3800000
3820000
3840000
3860000
3880000
3900000
3920000
3940000
3960000
3980000
Okl
ahom
a P
opul
atio
n
Oklahoma Population
Year-over-Year Growth Population
0.9%
-0.2%
0.9%
-10.0%
-5.0%
0.0%
5.0%
10.0%
15.0%
0
5000
10000
15000
20000
25000
30000
35000
40000
45000
50000
2002 2003 2004 2005 2006 2007 2008 2009 2010 2011 2012 2013 2014 2015 2016 2017
Ann
ual G
row
th
Per
Cap
ita
Per
sona
l Inc
ome
(cur
rent
$)
Oklahoma City Per Capita Personal Income
Annual Growth OKC Per Capita Personal Income
192015 ECONOMIC FORECAST
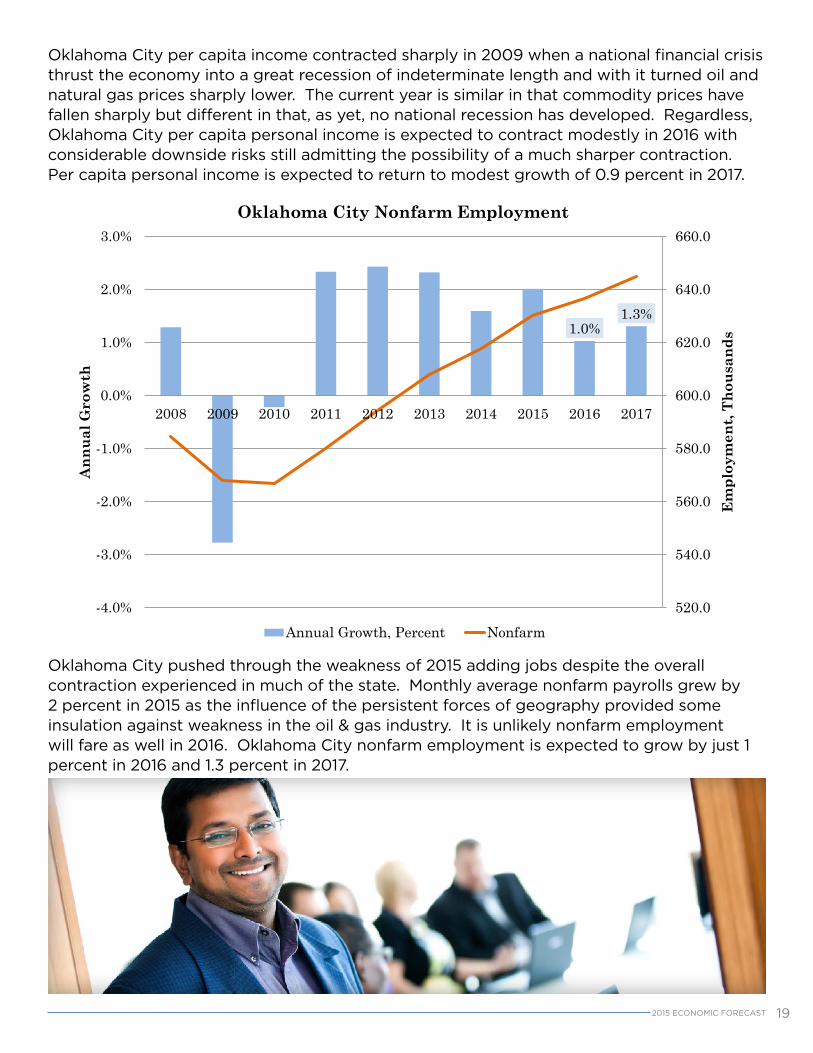
Oklahoma City per capita income contracted sharply in 2009 when a national financial crisis thrust the economy into a great recession of indeterminate length and with it turned oil and natural gas prices sharply lower. The current year is similar in that commodity prices have fallen sharply but different in that, as yet, no national recession has developed. Regardless, Oklahoma City per capita personal income is expected to contract modestly in 2016 with considerable downside risks still admitting the possibility of a much sharper contraction. Per capita personal income is expected to return to modest growth of 0.9 percent in 2017.
Oklahoma City pushed through the weakness of 2015 adding jobs despite the overall contraction experienced in much of the state. Monthly average nonfarm payrolls grew by 2 percent in 2015 as the influence of the persistent forces of geography provided some insulation against weakness in the oil & gas industry. It is unlikely nonfarm employment will fare as well in 2016. Oklahoma City nonfarm employment is expected to grow by just 1 percent in 2016 and 1.3 percent in 2017.
1.0%1.3%
520.0
540.0
560.0
580.0
600.0
620.0
640.0
660.0
-4.0%
-3.0%
-2.0%
-1.0%
0.0%
1.0%
2.0%
3.0%
2008 2009 2010 2011 2012 2013 2014 2015 2016 2017
Em
ploy
men
t, Th
ousa
nds
Ann
ual G
row
th
Oklahoma City Nonfarm Employment
Annual Growth, Percent Nonfarm
20 2015 ECONOMIC FORECAST
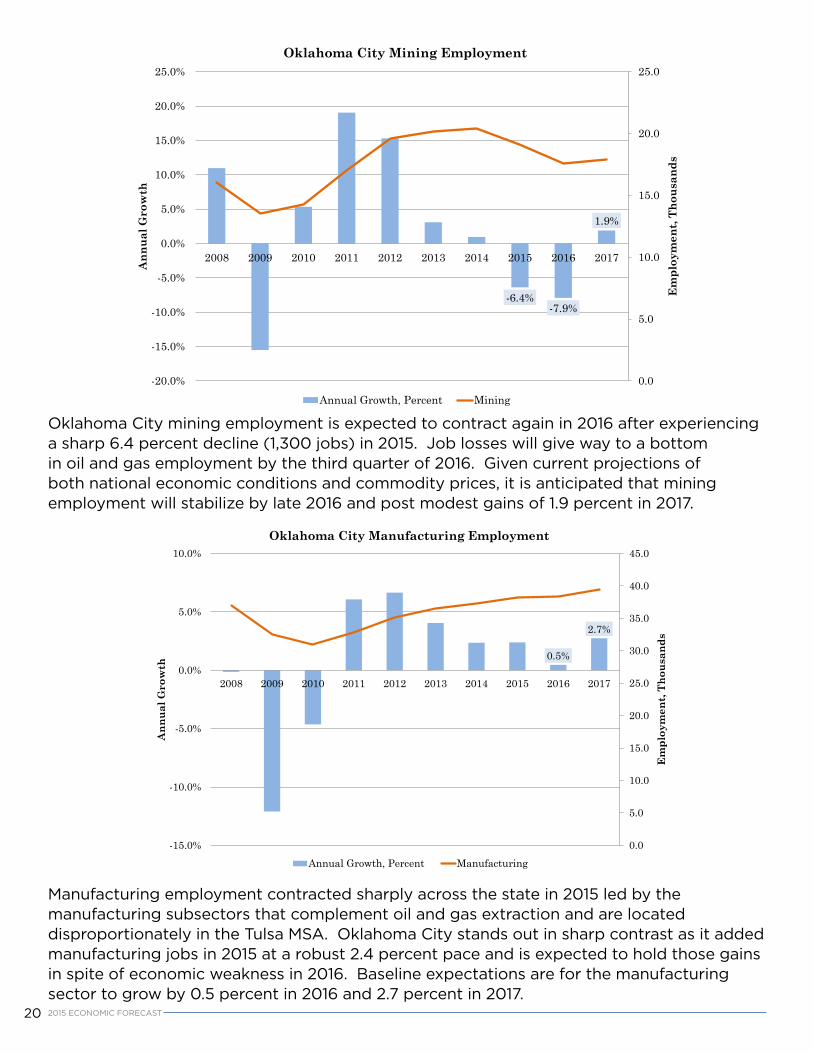
Oklahoma City mining employment is expected to contract again in 2016 after experiencing a sharp 6.4 percent decline (1,300 jobs) in 2015. Job losses will give way to a bottom in oil and gas employment by the third quarter of 2016. Given current projections of both national economic conditions and commodity prices, it is anticipated that mining employment will stabilize by late 2016 and post modest gains of 1.9 percent in 2017.
Manufacturing employment contracted sharply across the state in 2015 led by the manufacturing subsectors that complement oil and gas extraction and are located disproportionately in the Tulsa MSA. Oklahoma City stands out in sharp contrast as it added manufacturing jobs in 2015 at a robust 2.4 percent pace and is expected to hold those gains in spite of economic weakness in 2016. Baseline expectations are for the manufacturing sector to grow by 0.5 percent in 2016 and 2.7 percent in 2017.
-6.4%-7.9%
1.9%
0.0
5.0
10.0
15.0
20.0
25.0
-20.0%
-15.0%
-10.0%
-5.0%
0.0%
5.0%
10.0%
15.0%
20.0%
25.0%
2008 2009 2010 2011 2012 2013 2014 2015 2016 2017
Em
ploy
men
t, Th
ousa
nds
Ann
ual G
row
th
Oklahoma City Mining Employment
Annual Growth, Percent Mining
0.5%
2.7%
0.0
5.0
10.0
15.0
20.0
25.0
30.0
35.0
40.0
45.0
-15.0%
-10.0%
-5.0%
0.0%
5.0%
10.0%
2008 2009 2010 2011 2012 2013 2014 2015 2016 2017
Em
ploy
men
t, Th
ousa
nds
Ann
ual G
row
th
Oklahoma City Manufacturing Employment
Annual Growth, Percent Manufacturing
212015 ECONOMIC FORECAST
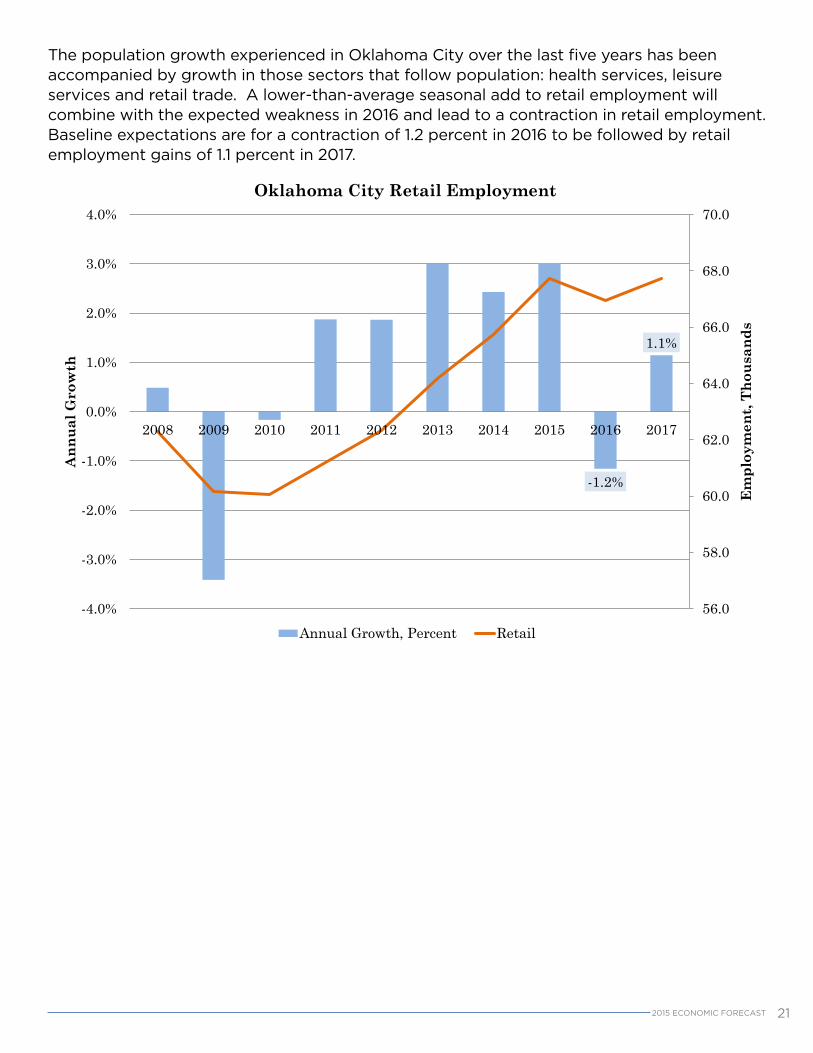
The population growth experienced in Oklahoma City over the last five years has been accompanied by growth in those sectors that follow population: health services, leisure services and retail trade. A lower-than-average seasonal add to retail employment will combine with the expected weakness in 2016 and lead to a contraction in retail employment. Baseline expectations are for a contraction of 1.2 percent in 2016 to be followed by retail employment gains of 1.1 percent in 2017.
-1.2%
1.1%
56.0
58.0
60.0
62.0
64.0
66.0
68.0
70.0
-4.0%
-3.0%
-2.0%
-1.0%
0.0%
1.0%
2.0%
3.0%
4.0%
2008 2009 2010 2011 2012 2013 2014 2015 2016 2017
Em
ploy
men
t, Th
ousa
nds
Ann
ual G
row
th
Oklahoma City Retail Employment
Annual Growth, Percent Retail
22
32
App
endi
x A
: U.S
. Out
look
Tab
le
U.S
. Eco
nom
ic O
utlo
ok S
umm
ary
Key
U.S
. Eco
nom
ic V
aria
bles
/ Ye
ar
2007
20
08
2009
20
10
2011
20
12
2013
20
14
2015
20
16
2017
G
ross
Dom
esti
c P
rodu
ct: A
nnua
l Gro
wth
by
Maj
or
Com
pone
nt
Real
GD
P 1.
9 -2
.8
-0.2
2.
7 1.
7 1.
3 2.
5 2.
5 2.
1 2.
7 2.
4 Pe
rson
al co
nsum
ptio
n ex
pend
iture
s 1.
4 -2
.0
-0.2
3.
1 1.
5 1.
3 2.
3 3.
2 2.
9 3.
1 2.
8 Fi
xed
inve
stm
ent
-1.4
-1
2.5
-11.
9 5.
5 8.
4 7.
0 4.
1 5.
5 3.
6 4.
8 5.
4 In
vent
ory
inve
stm
ent (
$ Bi
llion
s, 20
05)
35.5
-3
3.7
-147
.6
58.2
37
.6
54.7
61
.4
68.0
79
.9
42.6
47
.4
Gov
't co
nsum
ptio
n &
gro
ss in
vest
. 1.
8 3.
3 2.
3 -1
.1
-3.0
-2
.2
-2.9
0.
4 1.
3 1.
3 0.
6 E
mpl
oym
ent a
nd In
dust
rial
Act
ivit
y
Priv
ate
Hou
sing
Sta
rts (
SA, T
hous
ands
of U
nits
) 13
42
900
554
586
612
784
928
1001
11
16
1297
15
25
Ligh
t Veh
icle
Sal
es (M
illio
ns o
f Uni
ts)
16.1
13
.2
10.4
11
.6
12.7
14
.4
15.5
16
.4
17.3
17
.3
16.7
In
dust
rial
Pro
duct
ion
(SA
Perc
ent C
hang
e)
2.5
-8.9
-5
.4
5.9
2.8
2.1
2.3
4.5
-0.3
2.
4 2.
2 M
anuf
actu
ring
Cap
acity
Util
izat
ion
Rate
s 78
.8
74.8
65
.7
70.9
73
.7
74.5
74
.0
75.3
75
.9
75.9
76
.1
NF
Payr
oll E
mpl
oym
ent (
Mon
thly
Avg
., M
illio
ns)
137.
9 13
7.2
131.
2 13
0.3
131.
8 13
4.1
136.
4 13
9.0
141.
9 14
4.4
147.
1 U
nem
ploy
men
t Rat
e (M
onth
ly A
vera
ge)
4.6
5.8
9.3
9.6
8.9
8.1
7.4
6.2
5.3
4.7
4.5
Pri
ces,
Pro
duct
ivit
y, &
Cos
ts
Co
nsum
er P
rice
Inde
x (A
ll It
ems)
4.
0 1.
6 1.
5 1.
2 3.
3 1.
9 1.
2 1.
2 0.
4 2.
0 2.
1 Co
re C
onsu
mer
Pri
ce In
dex
(Ex.
Foo
d &
Ene
rgy)
2.
3 2.
0 1.
8 0.
6 2.
2 1.
9 1.
7 1.
7 1.
9 1.
9 2.
1 Pe
rson
al C
onsu
mpt
ion
Exp.
Pri
ce In
dex
(Ex.
Foo
d &
Ene
rgy)
2.
2 1.
6 1.
4 1.
0 1.
9 1.
8 1.
5 1.
4 1.
4 1.
7 1.
8 Co
mpe
nsat
ion
Per H
our (
Annu
al G
row
th)
3.9
3.0
1.2
1.4
0.6
5.6
-0.1
2.
8 2.
3 2.
8 2.
9 Pr
ice
of W
TI C
rude
(Mon
thly
Ave
rage
$/b
arre
l) 72
.36
99.5
7 61
.69
79.4
3 95
.08
94.2
0 97
.94
93.2
6 49
.78
49.7
7 52
.84
Pric
e of
Bre
nt C
rude
(Mon
thly
Ave
rage
$/b
arre
l) 72
.46
96.8
5 61
.49
79.5
1 11
1.26
11
1.65
10
8.6
4 99
.02
53.6
8 52
.35
56.5
1 In
com
e, In
tere
st R
ates
, and
the
Def
icit
Fede
ral f
unds
rate
5.
02
1.93
0.
16
0.17
0.
10
0.14
0.
11
0.09
0.
13
0.73
1.
75
10-y
ear T
reas
ury
note
yie
ld
4.63
3.
67
3.26
3.
21
2.79
1.
80
2.35
2.
54
2.15
2.
89
3.63
D
ispo
sabl
e Pe
rson
al In
com
e ($
Bill
ions
, 200
9)
1.2
1.1
-0.7
2.
6 1.
7 5.
1 -2
.9
3.6
3.1
2.5
2.4
U.S
. Per
sona
l Sav
ings
Rat
e 3.
0 4.
9 6.
1 5.
6 6.
1 7.
6 4.
8 4.
8 4.
9 4.
7 4.
1 U
nifie
d Fe
dera
l Sur
plus
, Fis
cal Y
ear
-16
1.5
-45
4.8
-14
15.7
-
1294
.2
-12
96.8
-
1089
.2
-680
.2
-48
3.4
-43
8.9
-55
4.6
-51
6.8
Sour
ce: S
teve
n C.
Age
e Ec
onom
ic R
esea
rch
and
Polic
y In
stitu
te; M
acro
advi
sers
MAU
S 20
15 M
odel
23
33
App
endi
x B
: Okl
ahom
a O
utlo
ok T
able
Okl
ahom
a Em
ploy
men
t Out
look
Vari
able
/Yea
r 20
08
2009
20
10
2011
20
12
2013
20
14
2015
20
16
2017
Non
farm
16
18.4
15
67.5
15
56.0
15
77.7
16
14.0
16
35.2
16
53.7
16
64.0
16
73.1
16
90.0
Annu
al G
row
th
1.5%
-3
.1%
-0
.7%
1.
4%
2.3%
1.
3%
1.1%
0.
6%
0.5%
1.
0%
Priv
ate
1281
.2
1219
.2
1207
.5
1233
.8
1266
.9
1286
.7
1305
.7
1315
.1
1320
.5
1332
.8
Annu
al G
row
th
1.6%
-4
.8%
-1
.0%
2.
2%
2.7%
1.
6%
1.5%
0.
7%
0.4%
0.
9%
Min
ing
52.0
43
.4
43.8
51
.5
58.1
59
.7
61.3
54
.7
48.4
49
.1
Annu
al G
row
th
11.4
%
-16.
4%
0.7%
17
.8%
12
.8%
2.
7%
2.8%
-1
0.9%
-1
1.4%
1.
4%
Cons
truc
tion
75.6
68
.9
67.0
68
.3
70.4
74
.7
75.5
79
.2
82.3
86
.2
Annu
al G
row
th
5.9%
-8
.8%
-2
.7%
1.
9%
3.1%
6.
1%
1.0%
5.
0%
3.8%
4.
8%
Man
ufac
turi
ng
149.
8 12
9.3
123.
3 12
9.8
135.
6 13
6.7
138.
7 13
3.7
126.
9 12
8.2
Annu
al G
row
th
-1.0
%
-13.
7%
-4.6
%
5.3%
4.
5%
0.8%
1.
4%
-3.6
%
-5.1
%
1.0%
TTU
28
9.3
281.
3 27
7.3
282.
7 29
0.4
295.
0 30
0.8
305.
0 30
5.5
309.
1
Annu
al G
row
th
0.6%
-2
.8%
-1
.4%
1.
9%
2.7%
1.
6%
1.9%
1.
4%
0.2%
1.
2%
Who
lesa
le
59.3
56
.2
55.6
57
.9
60.3
61
.8
63.4
63
.9
63.9
65
.3
Annu
al G
row
th
-0.1
%
-5.2
%
-1.0
%
4.0%
4.
3%
2.4%
2.
6%
0.8%
0.
1%
2.1%
Reta
il 17
3.0
169.
9 16
8.6
170.
5 17
3.2
175.
0 17
8.3
182.
8 18
3.6
185.
0
Annu
al G
row
th
1.0%
-1
.8%
-0
.7%
1.
1%
1.5%
1.
1%
1.9%
2.
5%
0.4%
0.
8%
Tran
spor
t 57
.1
55.3
53
.0
54.3
57
.0
58.2
59
.1
58.3
58
.0
58.8
Annu
al G
row
th
0.3%
-3
.2%
-4
.1%
2.
4%
4.9%
2.
2%
1.5%
-1
.3%
-0
.6%
1.
4%
Info
rmat
ion
28.7
26
.8
24.3
23
.0
22.5
21
.9
21.7
21
.7
21.4
21
.1
Annu
al G
row
th
-0.4
%
-6.6
%
-9.5
%
-5.0
%
-2.5
%
-2.5
%
-1.1
%
0.3%
-1
.5%
-1
.5%
Fina
nce
80.8
79
.5
78.1
77
.6
78.1
78
.9
79.5
80
.4
81.0
81
.2
24
34
Annu
al G
row
th
0.9%
-1
.6%
-1
.8%
-0
.7%
0.
7%
1.0%
0.
8%
1.1%
0.
8%
0.3%
Vari
able
/Yea
r 20
08
2009
20
10
2011
20
12
2013
20
14
2015
20
16
2017
Prof
Bus
18
5.7
169.
8 17
2.4
176.
1 17
9.8
181.
4 18
5.8
190.
2 19
0.7
192.
8
Annu
al G
row
th
0.7%
-8
.6%
1.
5%
2.1%
2.
1%
0.9%
2.
5%
2.3%
0.
3%
1.1%
Scie
ntifi
c & T
echn
ical
64
.9
62.9
63
.5
64.3
65
.9
66.8
67
.3
68.7
69
.4
70.2
Annu
al G
row
th
2.4%
-3
.0%
0.
9%
1.3%
2.
4%
1.4%
0.
7%
2.1%
1.
0%
1.1%
Man
agem
ent
16.7
16
.4
16.3
17
.0
18.0
18
.4
18.7
19
.2
19.5
19
.9
Annu
al G
row
th
2.8%
-1
.9%
-0
.5%
4.
3%
5.8%
2.
0%
1.9%
2.
4%
1.6%
2.
3%
Adm
in
104.
1 90
.5
92.6
94
.7
95.9
96
.2
99.8
10
2.3
101.
8 10
2.7
Annu
al G
row
th
-0.6
%
-13.
1%
2.3%
2.
3%
1.2%
0.
3%
3.8%
2.
5%
-0.5
%
0.9%
Ed &
Hea
lth
214.
8 21
8.6
221.
7 22
3.1
226.
2 22
7.7
228.
1 23
1.1
233.
2 23
5.4
Annu
al G
row
th
2.2%
1.
8%
1.4%
0.
6%
1.4%
0.
6%
0.2%
1.
3%
0.9%
1.
0%
Educ
atio
n 17
.4
18.1
18
.4
19.0
19
.2
19.4
19
.9
20.5
20
.9
21.3
Annu
al G
row
th
2.5%
4.
1%
1.5%
3.
3%
1.0%
1.
2%
2.6%
3.
0%
1.6%
1.
9%
Hea
lth
197.
3 20
0.4
203.
3 20
4.1
207.
0 20
8.3
208.
2 21
0.6
212.
3 21
4.2
Annu
al G
row
th
2.2%
1.
6%
1.4%
0.
4%
1.4%
0.
6%
0.0%
1.
2%
0.8%
0.
9%
Leis
ure
141.
0 14
0.0
139.
0 14
2.9
147.
2 15
1.6
155.
0 15
9.3
161.
8 16
4.0
Annu
al G
row
th
2.3%
-0
.7%
-0
.7%
2.
8%
3.0%
3.
0%
2.3%
2.
7%
1.6%
1.
4%
Arts
15
.6
14.4
14
.3
14.1
14
.3
14.6
14
.5
14.4
14
.2
14.4
Annu
al G
row
th
7.1%
-8
.0%
-0
.7%
-1
.3%
1.
2%
2.3%
-0
.7%
-1
.0%
-1
.0%
1.
0%
Food
and
Acc
om.
125.
4 12
5.6
124.
7 12
8.8
132.
9 13
7.0
140.
5 14
4.9
147.
6 14
9.7
Annu
al G
row
th
1.8%
0.
2%
-0.7
%
3.3%
3.
2%
3.1%
2.
6%
3.1%
1.
8%
1.4%
Oth
er
63.5
61
.6
60.6
58
.8
58.6
59
.1
59.3
59
.7
58.9
58
.4
Annu
al G
row
th
0.6%
-3
.0%
-1
.7%
-2
.9%
-0
.4%
0.
9%
0.3%
0.
7%
-1.3
%
-0.8
%
Gov
ernm
ent
337.
3 34
8.3
348.
5 34
3.9
347.
1 34
8.6
348.
0 34
8.9
351.
3 35
3.4
25
35
Annu
al G
row
th
1.0%
3.
3%
0.1%
-1
.3%
0.
9%
0.4%
-0
.2%
0.
3%
0.7%
0.
6%
Vari
able
/Yea
r 20
08
2009
20
10
2011
20
12
2013
20
14
2015
20
16
2017
Fede
ral
45.2
46
.6
50.4
49
.1
48.4
47
.1
46.3
46
.6
47.0
46
.8
Annu
al G
row
th
-0.2
%
3.0%
8.
3%
-2.6
%
-1.6
%
-2.5
%
-1.7
%
0.5%
0.
9%
-0.3
%
Stat
e 84
.1
85.1
83
.8
84.8
86
.4
86.3
85
.8
85.6
86
.5
87.0
Annu
al G
row
th
0.4%
1.
2%
-1.5
%
1.2%
1.
9%
-0.1
%
-0.6
%
-0.3
%
1.1%
0.
5%
Loca
l 20
7.9
216.
7 21
4.3
209.
9 21
2.4
215.
1 21
5.9
216.
8 21
7.8
219.
6
Annu
al G
row
th
1.5%
4.
2%
-1.1
%
-2.0
%
1.2%
1.
3%
0.3%
0.
4%
0.5%
0.
8%
Non
farm
OK
C 58
4.3
568.
1 56
6.9
580.
1 59
4.2
608.
0 61
7.7
630.
1 63
6.6
644.
9
Annu
al G
row
th
1.3%
-2
.8%
-0
.2%
2.
3%
2.4%
2.
3%
1.6%
2.
0%
1.0%
1.
3%
Priv
ate
OK
C 46
5.9
447.
4 44
4.8
458.
4 47
1.7
483.
4 49
2.9
503.
4 50
8.8
516.
2
Annu
al G
row
th
1.4%
-4
.0%
-0
.6%
3.
0%
2.9%
2.
5%
2.0%
2.
1%
1.1%
1.
4%
Wee
kly
Earn
61
8.0
633.
8 68
1.9
720.
6 74
1.0
743.
0 75
7.1
756.
9 76
8.3
777.
3
Annu
al G
row
th
1.9%
2.
6%
7.6%
5.
7%
2.8%
0.
3%
1.9%
0.
0%
1.5%
1.
2%
Une
mpl
oyed
65
,384
11
2,40
9 12
0,14
6 10
4,59
8 94
,774
96
,429
80
,202
78
,405
83
,562
84
,173
Annu
al G
row
th
-7.6
%
71.9
%
6.9%
-1
2.9%
-9
.4%
1.
7%
-16.
8%
-2.2
%
6.6%
0.
7%
Empl
oyed
1,68
1,08
1
1,
652,
023
1,64
8,13
8
1,6
69,2
80
1,
705,
122
1
,706
,785
1,70
3,83
2 1
,764
,284
1,77
5,82
7
1,7
84,5
24
Annu
al G
row
th
1.5%
-1
.7%
-0
.2%
1.
3%
2.1%
0.
1%
-0.2
%
3.5%
0.
7%
0.5%
Labo
r For
ce
1,74
6,46
5 1,
764,
432
1,76
8,28
4 1,
773,
879
1,79
9,89
7 1,
803,
214
1,78
4,03
4 1,
842,
690
1,85
9,39
0 1,
868,
697
Annu
al G
row
th
1.2%
1.
0%
0.2%
0.
3%
1.5%
0.
2%
-1.1
%
3.3%
0.
9%
0.5%
Un
Rate
3.
7%
6.4%
6.
8%
5.9%
5.
3%
5.3%
4.
5%
4.3%
4.
5%
4.5%
Annu
al G
row
th
-8.8
%
70.2
%
6.7%
-1
3.2%
-1
0.7%
1.
5%
-15.
9%
-5.4
%
5.6%
0.
2%
Sour
ce: S
teve
n C.
Age
e Ec
onom
ic R
esea
rch
and
Polic
y In
stitu
te
26
36
Okl
ahom
a G
DP,
Per
sona
l Inc
ome,
and
Pop
ulat
ion
Vari
able
/Yea
r 20
11
2012
20
13
2014
20
15
2016
20
17
Real
GD
P (M
il 20
09 $
) 14
9,86
0 15
5,21
8 15
7,81
2 16
2,42
7 16
5,87
5 16
5,63
3 16
7,83
0
Annu
al G
row
th
2.8%
3.
6%
1.7%
2.
9%
2.1%
-0
.1%
1.
3%
Pers
onal
Inco
me
(Tho
usan
ds $
) 14
7,81
3,00
0 15
8,59
6,00
0 16
1,68
6,00
0 16
9,22
8,00
0 17
3,37
1,00
0 17
5,23
6,00
0 17
9,93
7,00
0
Annu
al G
row
th
9.4%
7.
3%
1.9%
4.
7%
2.4%
1.
1%
2.7%
Popu
latio
n 3,
787,
451
3,81
8,40
1 3,
852,
280
3,87
8,51
7 3,
902,
958
3,92
6,76
5 3,
948,
367
Annu
al G
row
th
0.8%
0.
8%
0.9%
0.
7%
0.6%
0.
6%
0.6%
Per C
apita
Per
sona
l Inc
. 39
,026
41
,533
41
,971
43
,631
44
,420
44
,626
45
,572
Annu
al G
row
th
8.6%
6.
4%
1.1%
4.
0%
1.8%
0.
5%
2.1%
Sour
ce: S
teve
n C.
Age
e Ec
onom
ic R
esea
rch
and
Polic
y In
stitu
te
27
37
App
endi
x C
: Okl
ahom
a C
ity
Out
look
Tab
le
Okl
ahom
a Ci
ty M
etro
Are
a Em
ploy
men
t Out
look
Vari
able
/ Ye
ar
2008
20
09
2010
20
11
2012
20
13
2014
20
15
2016
20
17
Non
farm
58
4.3
568.
1 56
6.9
580.
1 59
4.2
608.
0 61
7.7
630.
1 63
6.6
644.
9
Annu
al G
row
th
1.3%
-2
.8%
-0
.2%
2.
3%
2.4%
2.
3%
1.6%
2.
0%
1.0%
1.
3%
Priv
ate
465.
9 44
7.4
444.
8 45
8.4
471.
7 48
3.4
492.
9 50
3.4
508.
8 51
6.2
Annu
al G
row
th
1.4%
-4
.0%
-0
.6%
3.
0%
2.9%
2.
5%
2.0%
2.
1%
1.1%
1.
4%
Min
ing
16.0
13
.5
14.3
17
.0
19.6
20
.2
20.4
19
.1
17.6
17
.9
Annu
al G
row
th
11.0
%
-15.
5%
5.4%
19
.0%
15
.3%
3.
1%
0.9%
-6
.4%
-7
.9%
1.
9%
Cons
truc
tion
27.7
25
.8
25.2
25
.9
26.5
27
.1
28.2
29
.3
30.0
30
.3
Annu
al G
row
th
4.1%
-6
.8%
-2
.3%
2.
6%
2.4%
2.
4%
4.0%
3.
9%
2.2%
1.
0%
Man
ufac
turi
ng
37.0
32
.5
31.0
32
.9
35.1
36
.5
37.4
38
.2
38.4
39
.5
Annu
al G
row
th
-0.1
%
-12.
1%
-4.6
%
6.1%
6.
6%
4.0%
2.
4%
2.4%
0.
5%
2.7%
TTU
10
0.7
97.5
97
.2
100.
0 10
2.9
107.
0 10
9.2
111.
7 11
0.3
112.
0
Annu
al G
row
th
-0.5
%
-3.2
%
-0.3
%
2.9%
2.
9%
4.0%
2.
0%
2.3%
-1
.3%
1.
5%
Who
lesa
le
23.0
21
.9
22.1
23
.4
24.9
26
.5
27.0
27
.5
27.2
28
.0
Annu
al G
row
th
0.1%
-4
.5%
0.
9%
6.0%
6.
4%
6.2%
1.
9%
1.9%
-1
.0%
2.
9%
Reta
il 62
.3
60.2
60
.1
61.2
62
.3
64.2
65
.8
67.7
67
.0
67.7
Annu
al G
row
th
0.5%
-3
.4%
-0
.2%
1.
9%
1.9%
3.
0%
2.4%
3.
0%
-1.2
%
1.1%
Tran
spor
t 15
.5
15.4
15
.0
15.4
15
.6
16.3
16
.4
16.5
16
.1
16.2
Annu
al G
row
th
-5.0
%
-0.2
%
-2.6
%
2.1%
1.
9%
4.4%
0.
5%
0.2%
-2
.1%
0.
6%
Info
rmat
ion
12.2
11
.1
9.6
9.0
8.6
8.2
8.3
8.4
8.2
8.1
Annu
al G
row
th
-1.3
%
-9.0
%
-13.
6%
-5.8
%
-4.4
%
-4.5
%
0.4%
2.
0%
-2.3
%
-1.6
%
Fina
ncia
l 31
.8
31.3
31
.0
30.8
31
.8
32.4
33
.1
33.4
33
.8
34.1
28 2015 ECONOMIC FORECAST
38
Annu
al G
row
th
1.0%
-1
.7%
-1
.0%
-0
.6%
3.
1%
1.9%
2.
3%
0.9%
1.
1%
1.0%
Vari
able
/ Ye
ar
2008
20
09
2010
20
11
2012
20
13
2014
20
15
2016
20
17
PBS
77.4
71
.9
73.2
75
.8
76.8
77
.6
79.1
83
.1
84.8
86
.7
Annu
al G
row
th
-0.4
%
-7.1
%
1.8%
3.
6%
1.3%
1.
1%
1.9%
4.
9%
2.1%
2.
3%
Scie
ntifi
c 28
.2
27.6
28
.3
29.2
30
.0
29.9
30
.1
31.1
31
.1
31.8
Annu
al G
row
th
2.9%
-2
.1%
2.
7%
3.0%
2.
8%
-0.1
%
0.4%
3.
6%
0.0%
2.
0%
Man
agem
ent
8.4
7.5
7.2
7.8
8.8
9.0
9.5
9.7
9.9
10.2
Annu
al G
row
th
-3.3
%
-11.
2%
-3.1
%
7.4%
12
.9%
2.
5%
5.5%
1.
8%
2.5%
3.
3%
Adm
in
40.8
36
.8
37.6
38
.9
38.0
38
.7
39.6
42
.3
43.7
44
.7
Annu
al G
row
th
-1.9
%
-9.7
%
2.1%
3.
4%
-2.1
%
1.8%
2.
3%
6.7%
3.
5%
2.3%
Ed &
Hea
lth
82.2
82
.9
83.2
84
.4
86.4
88
.0
89.0
89
.3
91.3
92
.9
Annu
al G
row
th
3.6%
0.
9%
0.4%
1.
4%
2.4%
1.
7%
1.1%
0.
4%
2.3%
1.
7%
Hea
lth
74.6
74
.8
74.8
75
.5
77.4
78
.7
79.3
80
.3
81.9
83
.2
Annu
al G
row
th
3.4%
0.
3%
0.0%
0.
9%
2.5%
1.
7%
0.8%
1.
3%
2.0%
1.
5%
Leis
ure
57.1
57
.6
57.6
60
.0
61.7
64
.2
65.5
68
.2
70.2
71
.1
Annu
al G
row
th
2.0%
0.
9%
0.1%
4.
2%
2.9%
4.
0%
2.1%
4.
1%
2.9%
1.
3%
Oth
er
23.9
23
.3
22.7
22
.7
22.4
22
.3
22.8
22
.7
22.6
22
.6
Annu
al G
row
th
2.8%
-2
.2%
-2
.7%
0.
0%
-1.4
%
-0.6
%
2.6%
-0
.7%
-0
.4%
0.
2%
Gov
ernm
ent
118.
5 12
0.8
122.
0 12
1.7
122.
5 12
4.6
124.
8 12
6.7
127.
8 12
8.7
Annu
al G
row
th
0.7%
1.
9%
1.0%
-0
.2%
0.
6%
1.7%
0.
2%
1.5%
0.
9%
0.7%
Fede
ral
25.7
26
.2
28.1
28
.4
28.2
27
.6
26.9
27
.1
27.5
28
.1
Annu
al G
row
th
-2.2
%
1.8%
7.
4%
0.9%
-0
.6%
-2
.2%
-2
.3%
0.
5%
1.7%
2.
1%
Stat
e 41
.6
42.0
41
.7
42.1
42
.4
43.5
44
.4
45.2
45
.1
45.4
Annu
al G
row
th
0.0%
1.
0%
-0.8
%
0.8%
0.
8%
2.6%
2.
0%
2.0%
-0
.3%
0.
5%
Loca
l 51
.2
52.6
52
.2
51.3
51
.9
53.6
53
.5
54.4
55
.2
55.3
292015 ECONOMIC FORECAST
39
Annu
al G
row
th
2.8%
2.
7%
-0.7
%
-1.7
%
1.2%
3.
2%
-0.1
%
1.7%
1.
4%
0.2%
Vari
able
/ Ye
ar
2008
20
09
2010
20
11
2012
20
13
2014
20
15
2016
20
17
Une
mpl
oyed
21
,212
33
,790
36
,553
31
,833
29
,372
30
,516
25
,818
24
,683
24
,574
24
,058
Annu
al G
row
th
-9.4
%
59.3
%
8.2%
-1
2.9%
-7
.7%
3.
9%
-15.
4%
-4.4
%
-0.4
%
-2.1
%
Empl
oyed
54
3,63
0 53
5,99
2 58
6,94
8 59
8,98
6 61
4,41
7 61
9,82
9 61
9,73
1 64
3,74
1 65
3,76
9 66
2,42
1
Annu
al G
row
th
1.2%
-1
.4%
9.
5%
2.1%
2.
6%
0.9%
0.
0%
3.9%
1.
6%
1.3%
Labo
r For
ce
564,
843
569,
783
623,
502
630,
819
643,
790
650,
346
645,
549
668,
425
678,
344
686,
480
Annu
al G
row
th
0.8%
0.
9%
9.4%
1.
2%
2.1%
1.
0%
-0.7
%
3.5%
1.
5%
1.2%
Un
Rate
3.
8%
5.9%
5.
9%
5.0%
4.
6%
4.7%
4.
0%
3.7%
3.
6%
3.5%
Annu
al G
row
th
-10.
1%
58.0
%
-1.1
%
-13.
9%
-9.6
%
2.8%
-1
4.7%
-7
.7%
-1
.9%
-3
.3%
Avg.
Wee
kly
Earn
65
0.7
636.
5 68
3.9
706.
2 77
8.6
768.
9 76
0.1
737.
8 72
4.8
731.
4
Annu
al G
row
th
-2.3
%
-2.2
%
7.5%
3.
2%
10.3
%
-1.2
%
-1.1
%
-2.9
%
-1.8
%
0.9%
Sour
ce: S
teve
n C.
Age
e Ec
onom
ic R
esea
rch
and
Polic
y In
stitu
te
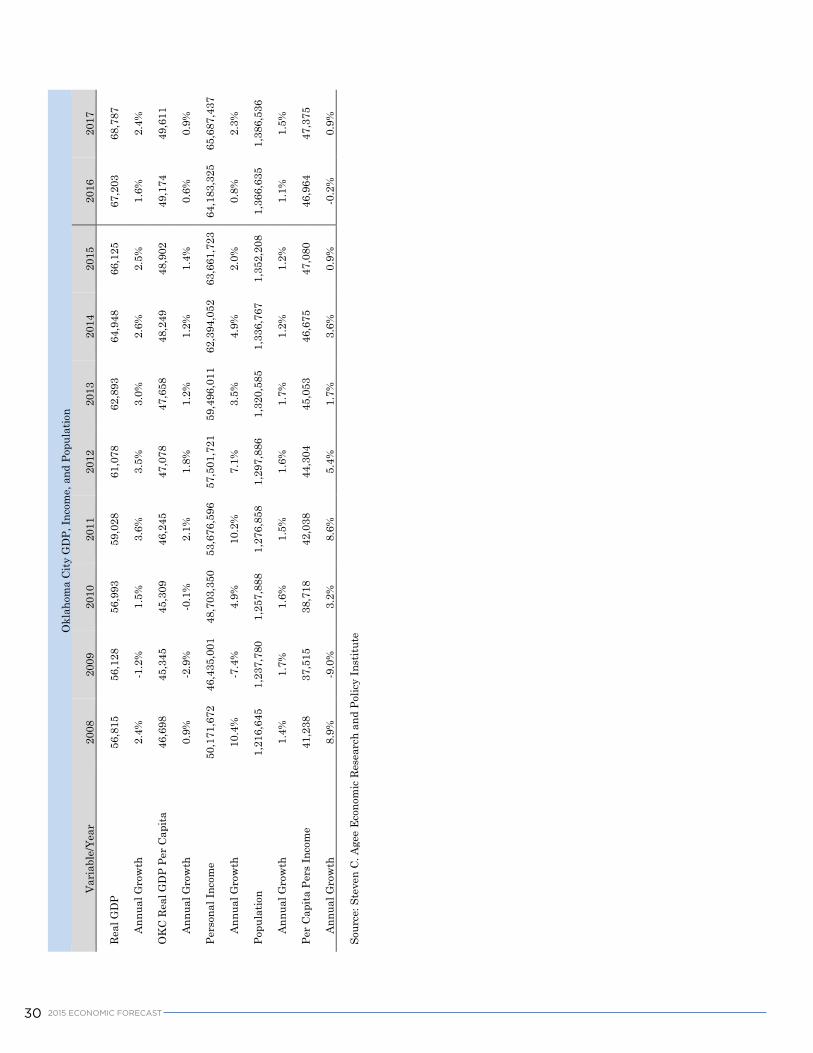
30 2015 ECONOMIC FORECAST
41
Okl
ahom
a Ci
ty G
DP,
Inco
me,
and
Pop
ulat
ion
Vari
able
/Yea
r 20
08
2009
20
10
2011
20
12
2013
20
14
2015
20
16
2017
Real
GD
P 56
,815
56
,128
56
,993
59
,028
61
,078
62
,893
64
,948
66
,125
67
,203
68
,787
Annu
al G
row
th
2.4%
-1
.2%
1.
5%
3.6%
3.
5%
3.0%
2.
6%
2.5%
1.
6%
2.4%
OK
C Re
al G
DP
Per C
apita
46
,698
45
,345
45
,309
46
,245
47
,078
47
,658
48
,249
48
,902
49
,174
49
,611
Annu
al G
row
th
0.9%
-2
.9%
-0
.1%
2.
1%
1.8%
1.
2%
1.2%
1.
4%
0.6%
0.
9%
Pers
onal
Inco
me
50,1
71,6
72
46,4
35,0
01
48,7
03,3
50
53,6
76,5
96
57,5
01,7
21
59,4
96,0
11
62,3
94,0
52
63,6
61,7
23
64,1
83,3
25
65,6
87,4
37
Annu
al G
row
th
10.4
%
-7.4
%
4.9%
10
.2%
7.
1%
3.5%
4.
9%
2.0%
0.
8%
2.3%
Popu
latio
n 1,
216,
645
1,23
7,78
0 1,
257,
888
1,27
6,85
8 1,
297,
886
1,32
0,58
5 1,
336,
767
1,35
2,20
8 1,
366,
635
1,38
6,53
6
Annu
al G
row
th
1.4%
1.
7%
1.6%
1.
5%
1.6%
1.
7%
1.2%
1.
2%
1.1%
1.
5%
Per C
apita
Per
s In
com
e 41
,238
37
,515
38
,718
42
,038
44
,304
45
,053
46
,675
47
,080
46
,964
47
,375
Annu
al G
row
th
8.9%
-9
.0%
3.
2%
8.6%
5.
4%
1.7%
3.
6%
0.9%
-0
.2%
0.
9%
Sour
ce: S
teve
n C.
Age
e Ec
onom
ic R
esea
rch
and
Polic
y In
stitu
te