Oil Spills in U.S. Coastal Waters: Background, … · This report reviews the history and trends of...
38
CRS Report for Congress Prepared for Members and Committees of Congress Oil Spills in U.S. Coastal Waters: Background, Governance, and Issues for Congress Jonathan L. Ramseur Specialist in Environmental Policy April 30, 2010 Congressional Research Service 7-5700 www.crs.gov RL33705
Transcript of Oil Spills in U.S. Coastal Waters: Background, … · This report reviews the history and trends of...

CRS Report for CongressPrepared for Members and Committees of Congress
Oil Spills in U.S. Coastal Waters: Background, Governance, and Issues for Congress
Jonathan L. Ramseur Specialist in Environmental Policy
April 30, 2010
Congressional Research Service
7-5700 www.crs.gov
RL33705

Oil Spills in U.S. Coastal Waters: Background, Governance, and Issues for Congress
Congressional Research Service
Summary During the past two decades, while U.S. oil imports and consumption have steadily risen, oil spill incidents and the volume of oil spilled have not followed a similar course. In general, the annual number and volume of oil spills have shown declines—in some cases, dramatic declines. The 1989 Exxon Valdez spill in Alaskan waters played a large role in stimulating actions that contributed to this trend, particularly the decrease in the annual spill volumes. The Exxon Valdez spill highlighted the need for stronger legislation, inflamed public sentiment, and spurred Congress to enact comprehensive oil spill legislation, resulting in the Oil Pollution Act of 1990 (P.L. 101-380). This law expanded and clarified the authority of the federal government and created new oil spill prevention and preparedness requirements. Moreover, the 1990 legislation strengthened existing liability provisions, providing a greater deterrent against spills. After 1990, spill volume from oil tankers, the vessels that carry and have spilled the most oil, decreased significantly.
Considering that U.S. oil consumption and oil imports have increased in recent decades, the trend of declining spill incidents and volume in past years is noteworthy. However, the risk of a major oil spill remains. Although recent Energy Information Administration (EIA) projections indicate that oil imports are expected to level off in coming years, the United States is expected to continue importing a substantial percentage of the oil it consumes. The threat of oil spills raises the question of whether U.S. officials have the necessary resources at hand to respond to a major spill. There is some concern that the favorable U.S. spill record has resulted in a loss of experienced personnel, capable of responding quickly and effectively to a major oil spill.
Prior to actions by the 109th and 110th Congresses, the Oil Spill Liability Trust Fund was particularly vulnerable to a large and costly spill: Fund managers had projected the fund would be completely depleted by FY2009. Recent legislative developments have increased the oil spill liability limits and raised the tax rate that feeds into the trust fund. With these changes in effect, the most recent projection indicates that the fund will reach almost $1.5 billion by the end of FY2009 and crest $3.5 billion by FY2016. Although the trust fund is now less vulnerable to a major spill, some degree of exposure still remains, thus raising a central policy debate: How should policymakers allocate the costs associated with a major, accidental oil spill? For example, what share of costs should be borne by the responsible party (e.g., oil vessel owner/operators), the oil industry, and the general treasury?
No oil spill is entirely benign. Even a relatively minor spill, depending on the timing and location, can cause significant harm to individual organisms and entire populations. Marine mammals, birds, bottom-dwelling and intertidal species, and organisms in early developmental stages—eggs or larvae—are especially vulnerable to a nearby spill. However, the effects of oil spills can vary greatly. Oil spills can cause impacts over a range of time scales, from only a few days to several years, or even decades in some cases.
This report reviews the history and trends of oil spills in the United States; identifies the legal authorities governing oil spill prevention, response, and cleanup; and examines the threats of future oil spills in U.S. coastal waters.
Oil Spills in U.S. Coastal Waters: Background, Governance, and Issues for Congress
Congressional Research Service
Contents Introduction ................................................................................................................................1
Background ................................................................................................................................1 Oil Spills in U.S. Coastal Waters ...........................................................................................1 Impacts of Oil Spills in Aquatic Environments ......................................................................3
Acute Impacts .................................................................................................................4 Chronic Impacts..............................................................................................................4 Ecosystem Recovery .......................................................................................................5
Economic Costs of Oil Spills.................................................................................................5 Cleanup Costs .................................................................................................................5 Natural Resources Damages ............................................................................................6 Other Economic Costs.....................................................................................................7
Oil Spill Governance...................................................................................................................7 Federal Authorities: Before and After the Exxon Valdez Spill .................................................7
Oil Pollution Act of 1990 ................................................................................................9 Other Federal Laws....................................................................................................... 14
International Conventions ................................................................................................... 15 MARPOL 73/78............................................................................................................ 16 Intervention Convention................................................................................................ 16
Federal Agencies’ Responsibilities ...................................................................................... 17 Response ...................................................................................................................... 17 Prevention and Preparedness ......................................................................................... 18
Federal Funding for the Oil Spill Liability Trust Fund ......................................................... 19 Background .................................................................................................................. 19 Trust Fund Ceiling ........................................................................................................ 19 Fund Projections ........................................................................................................... 20 Fund Vulnerability ........................................................................................................ 20 Addressing Vulnerability............................................................................................... 21 Considerations for Policymakers ................................................................................... 22
State Laws .......................................................................................................................... 23 Threat of Future Oil Spills in U.S. Coastal Waters ..................................................................... 24
Possibilities for Future Oil Spills ......................................................................................... 24 U.S. Oil Imports and Possible Spills .............................................................................. 27
Level of Preparedness ......................................................................................................... 28
Figures Figure 1. Volume and Number of Oil Spills for Incidents Above 100 Gallons in
U.S. Coastal Waters, 1973-2004...............................................................................................2
Figure 2. Volume of Oil Spilled from Vessels into U.S. Coastal Waters, 1980-2004 .....................3
Figure 3. Projected Annual Balances for the Oil Spill Liability Trust Fund, FY2009-FY2016.................................................................................................................... 20
Figure 4. U.S. Petroleum Imports and Consumption, 1990-2005 (Actual) and 2010-2025 (Projected)............................................................................................................ 25

Oil Spills in U.S. Coastal Waters: Background, Governance, and Issues for Congress
Congressional Research Service
Figure 5. Volume and Number of Oil Spills for Incidents Above 100 Gallons in U.S. Coastal Waters, 1995-2004............................................................................................. 26
Figure 6. U.S. Petroleum Imports by Mode of Transportation, 1995-2008.................................. 27
Figure 7. Average Annual Distribution of U.S. Oil Imports by Geographic Region .................... 28
Figure A-1. Percentage Contribution of Oil Inputs into North American Coastal Waters, by Major Source Categories (Based on Average Annual Releases, 1990-1999) ....................... 29
Figure A-2. Volume of Oil Spills into U.S. Coastal Waters from Facilities and Pipelines, 1980-2004.............................................................................................................................. 30
Figure A-3. Annual Number of Spills to U.S. Waters from Facilities and Pipelines, 1980-2004.............................................................................................................................. 31
Figure A-4. Annual Oil Spill Volume for Spills Greater than 50 Gallons from Oil Exploration and Extraction Activities in Federal Waters on the Outer Continental Shelf, 1985-2009.............................................................................................................................. 33
Tables Table 1. Federal Agency Jurisdiction for Oil Spill Prevention and Preparedness Duties,
by Source............................................................................................................................... 18
Appendixes Appendix. Additional Statistical Information Regarding Oil Spills............................................. 29
Contacts Author Contact Information ...................................................................................................... 34

Oil Spills in U.S. Coastal Waters: Background, Governance, and Issues for Congress
Congressional Research Service 1
Introduction Oil is a dominant source of energy in the United States, supplying the nation with approximately 40% of its energy needs. Its use is widespread, providing fuel for the transportation, industrial, and residential sectors. Vast quantities of oil continuously enter the country via vessel or pipeline and are then transported to destinations throughout the nation. With such widespread use and nonstop movement, it is inevitable that some number of spills will occur. One continuing policy issue is whether the nation has the necessary resources and personnel in place to respond to a major spill.
Several major U.S. oil spills have had lasting repercussions that transcended the local environmental and economic effects. The most notable example is the 1989 Exxon Valdez spill, which released approximately 11 million gallons of crude oil into Prince William Sound, Alaska. The Exxon Valdez spill—the largest and most expensive oil spill in U.S. waters to date1—produced extensive consequences beyond Alaska. According to the National Academies of Science, the Exxon Valdez disaster caused “fundamental changes in the way the U.S. public thought about oil, the oil industry, and the transport of petroleum products by tankers ... ‘big oil’ was suddenly seen as a necessary evil, something to be feared and mistrusted.”2
This report focuses on oil spills3 in U.S. coastal waters.4 The first section highlights background issues, including oil spill statistics and potential environmental impacts. The second section discusses the legal framework that governs oil spill prevention and response. The third section examines the threat of future oil spills in coastal waters and whether response personnel are prepared to respond to a major spill.
Background
Oil Spills in U.S. Coastal Waters While U.S. oil imports and consumption have steadily risen, oil spill incidents and volume spilled have not followed a similar course. (See Figure 1.) In general, oil spill events and the volume of oil released have declined over the past two decades; in some years, the declines have been dramatic. Note that this figure does not include data from 2005, described in the text box below.
1 Note that the Exxon Valdez spill ranks only 35th for spill volume on the list of international tanker spills since 1967. See International Tanker Owners Pollution Federation Limited, Historical Data, at http://www.itopf.com/stats.html. 2 See National Research Council (NRC), Oil in the Sea III: Inputs, Fates, and Effects, National Academies of Science (hereinafter “NRC report”), February 2003, p. 11. 3 In this report, “oil” refers to crude oil and petroleum products, including gasoline and other fuels, unless stated otherwise. 4 For the purposes of this report, “U.S. coastal waters” is defined broadly to encompass all waters between the shore and the boundary of the U.S. exclusive economic zone (200 nautical miles from shore). Note that in other documents, “coastal” may refer only to state waters, but in this report, the term “coastal waters” includes state and federally regulated waters.

Oil Spills in U.S. Coastal Waters: Background, Governance, and Issues for Congress
Congressional Research Service 2
Spills Associated with Hurricanes Katrina and Rita (2005) As of the date of this report, the Coast Guard database did not include 2005 spill data. However, there was a substantial increase in spill volume in 2005, due to spills associated with Hurricanes Katrina and Rita. The Minerals Management Service (MMS) summary of hurricane incidents includes the following:
• More than 8 million gallons of oil from aboveground oil storage facilities; however, 50% was reported recovered, and it is unknown has much of the remaining volume impacted coastal waters;
• Over 600,000 gallons (including an estimated 84,000 gallons from one platform incident) were spilled from federal offshore oil platforms and associated pipelines;
• Approximately 3.3 million gallons were spilled from a tank barge, when it struck a submerged oil platform that had been damaged during the storms.
MMS, Petroleum Spills of One Barrel and Greater from Federal Outer Continental Shelf Facilities Resulting from Damages Caused by 2005 Hurricanes Katrina and Rita Including Post-Hurricane Seepage through December 2007 (revised June 23, 2008), at http://www.mms.gov/incidents/.
Figure 1. Volume and Number of Oil Spills for Incidents Above 100 Gallons in U.S. Coastal Waters, 1973-2004
-
5,000,000
10,000,000
15,000,000
20,000,000
25,000,000
1973
1975
1977
1979
1981
1983
1985
1987
1989
1991
1993
1995
1997
1999
2001
2003
Gal
lon
s
-
1,000
2,000
3,000
4,000 Nu
mb
er of S
pills
Total Volume Spill Incidents
Source: Prepared by CRS with data from the United States Coast Guard (USCG) Oil Spill Compendium, available at http://homeport.uscg.mil.
Notes: As of the date of this report, the Coast Guard database included spill data through 2004.
The decline of spill incidents is likely related, at least in part, to international oil pollution standards that went into effect in 1983. These new standards were implemented in the United States by the Act to Prevent Pollution from Ships.5
The substantial drop in the annual spill volume is most attributable to the decline in volume spilled by oil tankers and barges—the vessels that transport oil and have historically spilled the most oil. As shown in Figure 2, the volume of oil spilled from vessels in U.S. waters in the 1990s differed dramatically from the volume spilled in the 1980s. The Exxon Valdez spill of 1989 and the resulting Oil Pollution Act of 1990 (OPA) played key roles in the subsequent spill volume
5 P.L. 96-478, 33 U.S.C. 1901, et seq. These standards and the U.S. law are discussed later in this report.

Oil Spills in U.S. Coastal Waters: Background, Governance, and Issues for Congress
Congressional Research Service 3
reduction. The 1990 Act (discussed below) made comprehensive changes to U.S. oil pollution law by expanding federal response authority and increasing spill liability. The high costs associated with the Exxon Valdez spill,6 and the threat of broad liability imposed by OPA (in some scenarios, unlimited liability), have likely been the central drivers for the spill volume decline seen in the 1990s.
In addition to international and federal governance, 28 states had oil spill liability laws, 19 of which imposed unlimited liability, before the Exxon Valdez spill occurred in 1989.7 After the 1989 spill, some states enacted additional legislation,8 which may have contributed to the declines.
Figure 2. Volume of Oil Spilled from Vessels into U.S. Coastal Waters, 1980-2004
Source: Prepared by CRS with data from the USCG Oil Spill Compendium.
The Appendix to this report contains additional information, including a further breakdown of oil inputs in coastal waters by source category. The Appendix also provides oil spill data and analysis specific to onshore facilities and pipelines, as well as offshore oil extraction operations.
Impacts of Oil Spills in Aquatic Environments No oil spill is entirely benign. Depending on timing and location, even a relatively minor spill can cause significant harm to individual organisms and entire populations.9 Oil spills can cause impacts over a range of time scales, from days to years, or even decades for certain spills. Impacts 6 Exxon has so far paid approximately $3 billion for the spill: $2 billion for cleanup activities and $900 million in a civil settlement for natural resource damages. In June 2006, parties filed for an additional $92 million for damages per a reopener provision in the civil settlement. On June 25, 2008, the Supreme Court ruled on punitive damages, an issue that had been in the court system for more than a decade. The Court awarded damages of $507 million (a 2006 ruling from the U.S. Court of Appeals for the 9th Circuit had set the damages at $2.5 billion—a 50% reduction from the original, 1994 ruling). 7 CRS Report (out-of-print, available from CRS by request), Liability Provisions in State Oil Spill Laws: A Brief Summary, October 1, 1990. 8 For example, California passed the Lempert-Keene-Seastrand Oil Spill Prevention and Response Act in 1990. More information is available at http://www.dfg.ca.gov/ospr/about/history.html#. 9 NRC report, p. 4.

Oil Spills in U.S. Coastal Waters: Background, Governance, and Issues for Congress
Congressional Research Service 4
are typically divided into acute (short-term) and chronic (long-term) effects. Both types are part of a complicated and often controversial equation that is addressed after an oil spill: ecosystem recovery.
Acute Impacts
Depending on the toxicity and concentration of the spill, acute exposure to oil spills can kill various organisms and cause the following debilitating (but not necessarily lethal) effects:10
• reduced reproduction,
• altered development,
• impaired feeding mechanisms, and
• decreased defense from disease.
Birds, marine mammals, bottom-dwelling and intertidal species, and organisms in their developmental stages (e.g., fish eggs and larvae) are particularly vulnerable to oil spills.11
In addition to the impacts to individual organisms, oil spills can lead to a disruption of the structure and function of the ecosystem. Certain habitats—such as coral reefs, mangrove swamps, and salt marshes—are especially vulnerable, because the physical structure of the habitats depends upon living organisms.
These potential acute effects to individual organisms and marine ecosystems have been “unambiguously established” by laboratory studies and well-studied spills, such as the Exxon Valdez.12
Chronic Impacts
Long-term, chronic exposure typically occurs from continuous oil releases—leaking pipelines, offshore production discharges, and non-point sources (e.g., urban runoff). Although spills are normally associated with acute impacts, some oil spills have also demonstrated chronic exposure and effects.13 There is increasing evidence that chronic, low-level exposures to oil contaminants can significantly affect the survival and reproductive success of marine birds and mammals.14 However, because of the complexity of factors, including a longer time period and presence of other pollutants, determining the precise effects on species and ecosystems due to chronic oil exposure in a particular locale is difficult for scientists. As a result, studies involving chronic effects are often met with debate and some controversy.
10 These “sub-lethal” effects can occur at concentrations that are several orders of magnitude lower than concentrations that cause death. NRC report, p. 127. 11 NRC report, Chapter 5; also multiple conversations with National Oceanic Atmospheric Administration (NOAA) personnel (2008). 12 NRC report, p. 120. 13 NRC report, p. 121. 14 NRC report, p. 134.

Oil Spills in U.S. Coastal Waters: Background, Governance, and Issues for Congress
Congressional Research Service 5
Ecosystem Recovery
Interested parties may have differing opinions at to what constitutes ecosystem recovery. At one end of the spectrum, local groups may demand that an ecosystem be returned to pre-spill conditions. NOAA regulations (15 CFR Section 990.30) state that recovery “means the return of injured natural resources and services to baseline”—in other words, a return to conditions as they would have been had the spill not occurred. Baseline conditions may not equate with pre-spill conditions. Multiple variables affect local species and ecosystem services. For example, one species at a spill site could have been on the decline at the time of an incident, because of changing water temperatures, for example. These types of trends are considered when trustees evaluate restoration efforts. Restoration leaves room for site-specific interpretation, which, in the case of the Exxon Valdez spill and cleanup, continues to generate considerable argument.
Economic Costs of Oil Spills The economic costs that can result from an oil spill can be broken into three categories: cleanup expenses, natural resource damages, and the various economic losses incurred by the affected community or individuals.
Cleanup Costs
The cleanup costs of an oil spill can vary greatly and are influenced by a mix of factors: location characteristics, oil type, and oil volume. Location is generally considered the most important factor because it involves multiple variables. Areas with less water movement, such as marshlands, will generally cost more to clean up than open water. Tourist destinations or sensitive habitats, such as coral reefs, will likely require more stringent cleanup standards, thus increasing the costs. The political and social culture at the spill site plays a part as well. A spill in a high-profile area—for example, the November 7, 2007, spill (53,000 gallons) from a container ship into the San Francisco Bay—may receive special attention. Major oil spills, especially ones that affect shoreline ecosystems, are often met with extensive media coverage, placing pressure on parties to take action. Coupled with this pressure, authorities (federal or state) at these locations may require extensive oil spill response requirements, which can influence cleanup cost. For instance, spill costs in the United States are considerably higher than in other parts of the world.15
The more persistent and viscous oil types, such as heavy crude oil and intermediates known as bunker fuels, are more expensive to clean up. Gasoline and other lighter refined products may require only minimal cleanup action. These materials will evaporate or disperse relatively quickly, leaving only a small volume of petroleum product available for recovery.
Compared with other factors, spill volume is less important. A major spill away from shore will likely cost considerably less than a minor spill in a sensitive location. Certainly, the amount of oil spilled affects cleanup costs, because, all things being equal, a larger spill will require a larger and more expensive cleanup effort. However, the relationship between cleanup costs and spill volume
15 The average cleanup cost is three times higher in the United States than in Europe (based on 1997 data and excluding the Exxon Valdez costs). See, Etkin, Dagmar, “Estimating Cleanup Costs for Oil Spills,” paper presented at the 1999 International Oil Spill Conference, 1999, citing data from the Oil Spill Intelligence Report International Oil Spill Database.

Oil Spills in U.S. Coastal Waters: Background, Governance, and Issues for Congress
Congressional Research Service 6
is not linear. Cleaning up a smaller spill is likely to cost more than a larger spill on a per-gallon basis.16
Natural Resources Damages
This category of costs relates to the environmental impacts caused by an oil spill. Pursuant to OPA, the party responsible for an oil spill is liable for any loss of natural resources (e.g., fish, animals, plants, and their habitats) and the services provided by the resource (e.g., drinking water, recreation).
When a spill occurs, natural resource trustees conduct a natural resource damage assessment to determine the extent of the harm. Trustees may include representatives from tribal governments as well as officials from state agencies (designated by the relevant governor) and federal agencies (designated by the President), such as NOAA.17
The Oil Pollution Act (OPA) of 1990 states that the measure of natural resource damages includes
• the cost of restoring, rehabilitating, replacing, or acquiring the equivalent of, the damaged natural resources;
• the diminution in value of those natural resources pending restoration; and
• the reasonable cost of assessing those damages.18
Pursuant to OPA, NOAA developed regulations pertaining to natural resource damage assessments in 1996.19 Natural resource damages may include both losses of direct use and passive uses. Direct use value may derive from recreational (e.g., boating), commercial (e.g., fishing), or cultural or historical uses of the resource. In contrast, a passive-use value may derive from preserving the resource for its own sake or for enjoyment by future generations.20
The damages are compensatory, not punitive. Collected damages cannot be placed into the general treasury revenues of the federal or state government, but must be used to restore or replace lost resources.21 Indeed, NOAA’s regulations focus on the costs of primary restoration—returning the resource to its baseline condition—and compensatory restoration—addressing interim losses of resources and their services.22
16 This is primarily due to the fact that a spill of any size (e.g., in a sensitive area) will require that equipment and response experts be sent to the scene. See Etkin, Dagmar, “Estimating Cleanup Costs for Oil Spills,” paper presented at the 1999 International Oil Spill Conference, 1999, p. 5. 17 For more information, see NOAA’s Damage Assessment, Remediation, and Restoration Program at http://www.darrp.noaa.gov/about/index.html. 18 33 U.S.C. Section 2706(d). 19 61 Federal Register 440 (January 5, 1996). See also NOAA, Injury Assessment Guidance Document for Natural Resource Damage Assessment Under the Oil Pollution Act of 1990 (1996). 20 See 15 CFR Section 990.30, definition of “value.” 21 33 U.S.C. Section 2706(f); William D. Brighton, Natural Resource Damages under the Comprehensive Environmental Response, Compensation, and Liability Act (2006), U.S. Department of Justice, Environment and Natural Resources Division. 22 William D. Brighton, Natural Resource Damages under the Comprehensive Environmental Response, Compensation, and Liability Act (2006), U.S. Department of Justice, Environment and Natural Resources Division.

Oil Spills in U.S. Coastal Waters: Background, Governance, and Issues for Congress
Congressional Research Service 7
Other Economic Costs
Oil spills can generate costs other than response expenses or damages to natural resources. An oil spill can disrupt business activity near the spill, particularly businesses that count on the reputation of the local environment. For example, the local tourist industry may be affected. In some cases, a well-publicized oil spill can weaken the tourist industry near the spill site, regardless of the actual threat to human health created by the spill.
Local infrastructure and services can be disrupted by an oil spill. Port and harbor operations may be interrupted, altering the flow of trade goods. Power plants that use cooling water systems may need to temporarily cease operations. For example, the Salem Nuclear Plant—the second-largest nuclear plant in the United States—was forced to halt activity due to a substantial oil spill (more than 250,000 gallons) in the Delaware River in November 2004.
Unlike natural resource damage claims, which are brought by the appropriate natural resource trustees, the costs described in this section would be submitted as claims by the third parties suffering the specific loss.
Oil Spill Governance When the Exxon Valdez ran aground in March 1989, there were multiple federal statutes, state statutes, and international conventions that dealt with oil discharges. The governing framework for oil spills in the United States remains a combination of federal, state, and international authorities. Within this framework, several federal agencies have the authority to implement oil spill regulations. The framework and primary federal funding process (the Oil Spill Liability Trust Fund) used to respond to oil spills are described below.
Federal Authorities: Before and After the Exxon Valdez Spill The following list highlights the primary federal authorities that were in effect when the Exxon Valdez spill occurred in 1989:
• Clean Water Act (1972):23 The Clean Water Act (CWA) represented the broadest authority for addressing oil spills at the time of the Exxon Valdez spill. Section 311 of the CWA established requirements for oil spill reporting, response, and liability. The act also created a fund (311 Fund), maintained by federal appropriations, that could be used for cleanup and natural resource restoration.
• Deepwater Port Act (1974):24 This statute addressed oil spills and liability issues at deepwater oil ports. The act also set up the Deepwater Port Fund to provide for prompt cleanup and compensate damages above liability limits. The fund was financed by a per-gallon tax on oil transferred at a deepwater port.
23 The official statutory name is the Federal Water Pollution Control Act, P.L. 92-500, as amended, codified at 33 U.S.C. 1251, et seq. 24 P.L. 93-627, codified at 33 U.S.C. 1501, et seq.

Oil Spills in U.S. Coastal Waters: Background, Governance, and Issues for Congress
Congressional Research Service 8
• Trans-Alaska Pipeline Authorization Act (1973):25 This act covered oil spills and liability relating to the Trans-Alaska Pipeline System (TAPS). Although the pipeline is constructed over land, spills from it could reach coastal waters via inland rivers. The act created a trust fund, financed through a lessee fee, that could be used to respond to spills and damages from the pipeline.
• Outer Continental Shelf Lands Act Amendments (1978):26 This act established an oil spill liability structure and rules for oil extraction facilities in federal offshore waters. With this legislation, Congress created the Offshore Pollution Fund, financed by a per-gallon fee on produced oil, that could be used for oil spill cleanup and damages.
• National Oil and Hazardous Substances Pollution Contingency Plan (NCP): The NCP was first established in 1968, after U.S. policymakers observed the response to a 37-million-gallon oil tanker spill (Torrey Canyon) off the coast of England.27 The NCP contains the federal government’s procedures for responding to oil spills and hazardous substance releases.28 Subsequent laws have amended the NCP, including the CWA in 1972 and the Comprehensive Environmental Response, Compensation, and Liability Act (CERCLA or Superfund) in 1980.
After the Exxon Valdez spill, many observers29 described the above legal collection as an ineffective patchwork. Arguably, each law had perceived shortcomings (discussed below in the context of post-Exxon Valdez legislation), and none provided comprehensive oil spill coverage.
For more than 15 years prior to the Exxon Valdez incident, Congress made attempts to enact a unified oil pollution law. Several contentious issues produced deadlocks, hindering the passage of legislation. One of the central points of debate, state preemption, dealt with whether a federal oil spill law should limit a state’s ability to impose stricter requirements, particularly unlimited liability. Other liability questions also generated debate. For example, if an oil spill occurred, should the owner of the cargo (i.e., oil) be held liable, as was the ship owner/operator? Another point of contention was whether oil-carrying vessels should be required to have double hulls. Although proponents argued that a second hull would help prevent oil spills, the shipping industry raised concern that implementing such a mandate would disrupt oil transportation and potentially affect the national economy. A final issue involved the interaction between domestic legislation (federal and state) and international measures. Some were concerned that if the United States became a party to certain international agreements under consideration in the 1980s,30 the international standards would preempt federal and state laws, especially those establishing liability limits. Proponents argued that these concerns were overstated, and stressed that joining the international agreements was especially important for the United States because of the international nature of oil transportation and associated pollution.
25 P.L. 93-153, codified at 43 U.S.C. 1651, et seq. 26 P.L. 95-372, codified at 43 U.S.C. 1801, et seq. 27 See EPA “National Contingency Plan Overview” at http://www.epa.gov/emergencies/content/lawsregs/ncpover.htm. 28 The NCP is codified at 40 CFR Part 300. 29 See, for example, U.S. Congress, House Committee on Merchant Marine and Fisheries, Report accompanying H.R. 1465, Oil Pollution Prevention, Removal, Liability, and Compensation Act of 1989, 1989, H.Rept. 101-242, Part 2, 101st Cong., 1st sess., p. 32. 30 The two agreements under consideration were the 1984 Protocols to the International Convention on Civil Liability for Oil Pollution Damage and the Protocols to the International Fund for Compensation for Oil Pollution Damages.

Oil Spills in U.S. Coastal Waters: Background, Governance, and Issues for Congress
Congressional Research Service 9
Following the 1989 Exxon Valdez spill, Members faced great pressure to overcome the disputes discussed above.31 The spill highlighted the inadequacies of the existing coverage and generated public outrage. The end result was the Oil Pollution Act of 1990 (OPA)32—the first comprehensive law to specifically address oil pollution to waterways and coastlines of the United States.
Oil Pollution Act of 1990
With the enactment of OPA on August 18, 1990, Congress consolidated the existing federal oil spill laws under one program. The 1990 law expanded the existing liability provisions within the CWA and created new free-standing requirements regarding oil spill prevention and response. Key OPA provisions are discussed below.
Spill Response Authority
When responding to a spill, many considered the lines of responsibility under the pre-OPA regime to be unclear,33 with too much reliance on spillers to perform proper cleanup.34 OPA strengthened and clarified the federal government’s role in oil spill response and cleanup. OPA Section 4201 amended Section 311(c) of the CWA to provide the President (delegated to the USCG or EPA) with three options: perform cleanup immediately (“federalize” the spill), monitor the response efforts of the spiller, or direct the spiller’s cleanup activities. The revised response authorities addressed concerns “that precious time would be lost while waiting for the spiller to marshall its cleanup forces.”35
The federal government determines the level of cleanup required. Although the federal government must consult with designated trustees of natural resources and the governor of the state affected by the spill, the decision that cleanup is completed and can be ended rests with the federal government. States may require further work, but without the support of federal funding.36
31 A handful of other oil spills followed the Exxon Valdez in 1989 and 1990 (e.g., the Mega Borg spilled 5 million gallons of oil in the Gulf of Mexico), further spurring congressional action. 32 P.L. 101-380, primarily codified at U.S.C. 2701, et seq. 33 See, for example, Wilkinson, Cynthia et al., “Slick Work: An Analysis of the Oil Pollution Act of 1990,” Journal of Energy, Natural Resources, and Environmental Law, 12 (1992), p. 190. 34 See, Grumbles, Benjamin, and Manley, Joan, “The Oil Pollution Act of 1990: Legislation in the Wake of a Crisis,” Natural Resources and Environment, 10:2 (1995), p. 38. 35 U.S. Congress, House Committee on Merchant Marine and Fisheries, Report accompanying H.R. 1465, Oil Pollution Prevention, Removal, Liability, and Compensation Act of 1989, 1989, H.Rept. 101-242, Part 2, 101st Cong., 1st sess., p. 84. 36 OPA Section 1011.

Oil Spills in U.S. Coastal Waters: Background, Governance, and Issues for Congress
Congressional Research Service 10
National Contingency Plan
OPA expanded the role and breadth of the NCP. The 1990 law established a multi-layered planning and response system to improve preparedness and response to spills in marine environments.37 Among other things, the act also required the President to establish procedures and standards (as part of the NCP) for responding to worst-case oil spill scenarios.38
Tank Vessel and Facility Response Plans
As a component of the enhanced NCP, OPA amended the CWA to require that U.S. tank vessels, offshore facilities, and certain onshore facilities39 prepare and submit oil spill response plans to the relevant federal agency. In general, vessels and facilities are prohibited from handling, storing, or transporting oil if they do not have a plan approved by (or submitted to) the appropriate agency40 (Table 1).
The plans should, among other things, identify how the owner or operator of a vessel or facility would respond to a worst-case scenario spill. Congress did not intend for every vessel to have onboard all the personnel and equipment needed to respond to a worst-case spill, but vessels must have a plan and procedures to call upon—typically through a contractual relationship—the necessary equipment and personnel for responding to a worst-case spill.41
In 2004, Congress enacted an amendment requiring non-tank vessels (i.e., ships carrying oil for their own fuel use) over 400 gross tons to prepare and submit a vessel response plan.42 Congress reasoned that many non-tank vessels have as much oil onboard as small tank vessels, thus presenting a comparable risk from an oil spill. Moreover, the international standards for oil spill prevention43 apply to tanker and non-tanker vessels alike. Thus, the 2004 amendment brought the U.S. law more in line with international provisions.
Double-Hull Design for Vessels
The issue of double hulls received considerable debate for many years prior to OPA, and it was one of the stumbling blocks for unified oil spill legislation. Proponents maintained that double-hull construction provides extra protection if a vessel becomes damaged.44 However, opponents
37 OPA Section 4202, amending Section 311(j) of the CWA. 38 OPA Section 4201(b), amending Section 311(d)(2)(J) of the CWA. 39 The response plan requirement is applicable only to an onshore facility that, because of its location, could reasonably be expected to cause substantial harm to the environment by discharging into navigable waters, adjoining shorelines, or the exclusive economic zone. CWA Section 311(j)(5)(iii). 40 OPA Section 4202, amending Section 311(j)(5)(E) of the CWA. 41 U.S. Congress, House Committee on Merchant Marine and Fisheries, Report accompanying H.R. 1465, Oil Pollution Prevention, Removal, Liability, and Compensation Act of 1989, 1989, H.Rept. 101-242, Part 2, 101st Cong., 1st sess., p. 87. OPA Section 4202, amending Section 311(j)(5)(C)(iii) of the CWA. 42 Amendments Relating to the Oil Pollution Act of 1990, Title VII of Coast Guard and Maritime Transportation Act of 2004 (P.L. 108-293), codified at 33 U.S.C. 1321. 43 Primarily the shipboard oil pollution emergency plans required by MARPOL 73/78, discussed later in this report. 44 A study from the National Academy of Sciences reached this conclusion in 1999. See National Research Council, Double hull Tanker Legislation: An Assessment of the Oil Pollution Act of 1990, National Academies of Science, 1999, p. 144.

Oil Spills in U.S. Coastal Waters: Background, Governance, and Issues for Congress
Congressional Research Service 11
argued that a double-hulled vessel might cause stability problems if an accident occurred, thus negating the benefits.45 Stakeholders also highlighted the impacts that a double-hull requirement would entail for the shipping industry (e.g., cost and time of retrofitting, ship availability).46 The OPA requirements for double hulls reflected some of these concerns.
The act required new vessels carrying oil and operating in U.S. waters to have double hulls.47 However, OPA provided certain exceptions, depending on the size of the vessel (e.g., less than 5,000 gross tons)48 and its particular use (e.g., lightering).49 For older vessels, OPA established a staggered retrofitting schedule, based on vessel age and size. Many of the age-based deadlines have already passed. By 2015 at the latest, the law requires that all oil-carrying vessels operating in U.S. waters have double hulls.
Liability Issues
OPA unified the liability provisions of existing oil spill law, creating a freestanding liability regime. Section 1002 states that responsible parties are liable for any discharge of oil (or threat of discharge) from a vessel or facility50 to navigable waters, adjoining shorelines, or the exclusive economic zone51 of the United States (i.e., 200 miles beyond the shore).
Regarding the existing oil spill law prior to OPA, Congress recognized that “there is no comprehensive legislation in place that promptly and adequately compensates those who suffer other types of economic loss as a result of an oil pollution incident.”52 OPA broadened the scope of damages (i.e., costs) for which an oil spiller would be liable. Under OPA, a responsible party is liable for all cleanup costs incurred, not only by a government entity, but also by a private party.53 In addition to cleanup costs, OPA significantly increased the range of liable damages to include the following:
• injury to natural resources,
• loss of personal property (and resultant economic losses),
• loss of subsistence use of natural resources,
45 Opponents maintained that if water entered the space between hulls, the ship could become unstable, hindering salvage and possibly capsizing. Wilkinson, Cynthia et al., “Slick Work: An Analysis of the Oil Pollution Act of 1990,” Journal of Energy, Natural Resources, and Environmental Law, 12 (1992), p. 196. 46 U.S. Congress, Conference Report accompanying H.R. 1465, Oil Pollution Act of 1990, 1990, Conf.Rept. 101-653, 101st Cong., 2nd sess., pp. 140-141. 47 OPA Section 4115, amending 46 U.S.C. 3703. 48 This exception applied to many inland barges. 49 Lightering is the process of transferring oil from a large vessel to a smaller vessel. This common practice occurs in designated areas that are typically many miles away from shore. 50 The definition of “facility” is broadly worded and includes pipelines and motor vehicles. OPA Section 1001. 51 Under the pre-OPA regime (primarily the CWA), a discharge 12 miles beyond shore had to affect the natural resources before liability attached. Under OPA Section 1002, the discharge itself triggers liability. Wilkinson, Cynthia et al., “Slick Work: An Analysis of the Oil Pollution Act of 1990,” Journal of Energy, Natural Resources, and Environmental Law, 12 (1992), p. 201. 52 U.S. Congress, House Committee on Merchant Marine and Fisheries, Report accompanying H.R. 1465, Oil Pollution Prevention, Removal, Liability, and Compensation Act of 1989, 1989, H.Rept. 101-242, Part 2, 101st Cong., 1st sess., p. 31. 53 OPA Section 1002(b)(1).

Oil Spills in U.S. Coastal Waters: Background, Governance, and Issues for Congress
Congressional Research Service 12
• lost revenues resulting from destruction of property or natural resource injury,
• lost profits resulting from property loss or natural resource injury, and
• costs of providing extra public services during or after spill response.54
OPA provided several defenses from liability: act of God, act of war, and act or omission of a third party. Although these defenses are more narrow than those for oil spills under the pre-OPA framework (primarily the CWA), they are similar to those of the Superfund statute,55 established in 1980 for releases of hazardous substances.
Except for certain behavior, including acts of gross negligence or willful misconduct,56 OPA set liability limits (or caps) for cleanup costs and other damages. Until 2006, liability limits for vessels were based on vessel carrying capacity, generally $1,200 per gross ton. As an example, the liability limit for the 2004 Athos tanker spill in Delaware River was approximately $45 million.57
OPA requires the President to issue regulations to adjust the liability limits at least every three years to take into account changes in the consumer price index (CPI). Despite this requirement, adjustments to liability limits were not made until Congress amended OPA in July 2006. The Coast Guard and Maritime Transportation Act of 2006 (P.L. 109-241) increased limits to $1,900/gross ton for double-hulled vessels and $3,000/gross ton for single-hulled vessels. Furthermore, the Coast Guard made its first CPI adjustment to the liability limits in 2009, increasing the limits to $2,100 and $3,200, respectively.58
Mobile offshore drilling units (MODUs), like the Deepwater Horizon unit involved in the April 2010 incident in the Gulf of Mexico, are first treated as tank vessels for their liability caps. If removal and damage costs exceed this liability cap, a MODU is deemed to be an offshore facility for the excess amount.59
Offshore facility liability is capped at “all removal costs plus $75 million”; onshore facilities and deepwater port liability is limited to $350 million. Although these limits are much higher than under the pre-OPA liability structure, Congress did not alter the limits with the tank vessel increases.
54 OPA Section 1002(b)(2). 55 Section 107(b) of the Comprehensive Environmental Response, Compensation, and Liability Act (CERCLA, commonly known as Superfund), P.L. 96-510. 56 In addition, liability limits are unavailable if the violation of a federal safety, construction, or operating requirement proximately caused the spill. Spillers must also report the incident and cooperate with response officials to take advantage of the liability caps. OPA Section 1004(c). 57 37,895 gross tons x $1,200/ton = $45.47 million. Vessel data from United States Coast Guard, Investigation into the Striking of Submerged Objects by the Tank Vessel Athos I in the Delaware River on November 26, 2004 with a Major Discharge of Oil, January 2006, p. 4. 58 U.S. Coast Guard, “Consumer Price Index Adjustments of Oil Pollution Act of 1990 Limits of Liability—Vessels and Deepwater Ports,” Federal Register Volume 74, No. 125 (July 1, 2009), pp. 31357-31369. 59 33 USC 2704(b).

Oil Spills in U.S. Coastal Waters: Background, Governance, and Issues for Congress
Congressional Research Service 13
The Oil Spill Liability Trust Fund
Prior to OPA, federal funding for oil spill response was generally considered inadequate,60 and damage recovery was difficult for private parties.61 To help address these issues, Congress established the Oil Spill Liability Trust Fund (OSLTF).
Pursuant to Executive Order (EO) 12777, the USCG created the National Pollution Funds Center (NPFC) to manage the trust fund in 1991. The fund may be used for several purposes:
• prompt payment of costs for responding to and removing oil spills;
• payment of the costs incurred by the federal and state trustees of natural resources for assessing the injuries to natural resources caused by an oil spill, and developing and implementing the plans to restore or replace the injured natural resources;
• payment of parties’ claims for uncompensated removal costs, and for uncompensated damages (e.g., financial losses of fishermen, hotels, and beachfront businesses);
• payment for the net loss of government revenue, and for increased public services by a state or its political subdivisions; and
• payment of federal administrative and operational costs, including research and development, and $25 million per year for the Coast Guard’s operating expenses.
Although Congress created the OSLTF in 1986,62 Congress did not authorize its use or provide its funding until after the Exxon Valdez incident. In 1990, OPA provided the statutory authorization necessary to put the fund in motion. Through OPA, Congress transferred other federal liability funds63 into the OSLTF. In complementary legislation, Congress imposed a 5-cent-per-barrel tax on the oil industry to support the fund.64 Collection of this fee ceased on December 31, 1994, due to a sunset provision in the law. However, in April 2006, the tax resumed as required by the Energy Policy Act of 2005 (P.L. 109-58). In addition, the Emergency Economic Stabilization Act of 2008 (P.L. 110-343) increased the tax rate to 8 cents through 2016. In 2017, the rate increases to 9 cents. The tax is scheduled to terminate at the end of 2017.65 The level of funding in the trust fund is discussed below.
60 Wilkinson, Cynthia et al., “Slick Work: An Analysis of the Oil Pollution Act of 1990,” Journal of Energy, Natural Resources, and Environmental Law, 12 (1992), p. 188. 61 U.S. Congress, House Committee on Merchant Marine and Fisheries, Report accompanying H.R. 1465, Oil Pollution Prevention, Removal, Liability, and Compensation Act of 1989, 1989, H.Rept. 101-242, Part 2, 101st Cong., 1st sess., p. 35. 62 Omnibus Budget Reconciliation Act of 1986 (P.L. 99-509). 63 The CWA Section 311(k) revolving fund; the Deepwater Port Liability Fund; the Trans-Alaska Pipeline Liability Fund; and the Offshore Oil Pollution Compensation Fund. 64 Omnibus Budget Reconciliation Act of 1989 (P.L. 101-239). Other revenue sources for the fund include interest on the fund, cost recovery from the parties responsible for the spills, and any fines or civil penalties collected. 65 Section 405 of P.L. 110-343.
Oil Spills in U.S. Coastal Waters: Background, Governance, and Issues for Congress
Congressional Research Service 14
Financial Responsibility
To preserve the trust fund and ensure that responsible parties can be held accountable for oil spill cleanup and damages, OPA requires that vessels maintain evidence of financial responsibility (e.g., insurance). The Coast Guard’s National Pollution Funds Center carries out this mandate by issuing Certificates of Financial Responsibility (COFRs) to shipping vessel owners when owners demonstrate the ability to pay for oil spill cleanup and damages. In general, vessels over 300 gross tons are required to have a valid COFR to operate in U.S. waters.
Other Federal Laws
Although OPA is the primary domestic legislation for oil spills, other federal laws contain provisions that relate to oil spills. Many of these provisions were in place before OPA. The following list is not all-inclusive, but it highlights the main requirements authorized by laws other than OPA.
Clean Water Act
Section 311(j)(1) of the 1972 CWA called for regulations to prevent the discharge of oil from vessels, onshore facilities, and offshore facilities. Pursuant to this statutory requirement,66 the EPA crafted regulations67 for spill prevention control and countermeasure (SPCC) plans in 1973, some of which are scheduled to go into effect July 1, 2009.68 SPCC plans address the “procedures, methods, and equipment and other requirements for equipment to prevent discharges.”69 The EPA’s SPCC plans apply only to non-transportation, onshore facilities that exceed a certain oil storage capacity and that, in the event of a spill, can be reasonably expected, because of their location, to produce an oil discharge that would reach navigable waters or adjoining shorelines of the United States.70 Unlike other oil spill preparedness provisions, SPCC plans focus more on prevention than on response activities, requiring, for example, secondary containment (e.g., dikes, berms) for oil-storage equipment.
Outer Continental Shelf Lands Act
The primary federal law governing oil development and operations in federal waters is the Outer Continental Shelf Lands Act (OCSLA) of 1953 and its subsequent amendments. The OCSLA provided the foundation for regulations (30 CFR Part 250) that are implemented by the Minerals Management Service (MMS). Sections of the MMS regulations address oil spill prevention and response issues by requiring that various equipment and procedures be in place at offshore facilities. For more information, see CRS Report RL33404, Offshore Oil and Gas Development: Legal Framework, by Adam Vann.
66 And in accordance with Executive Order 11735 (August 3, 1973), granting EPA the authority to regulate non-transportation-related onshore and offshore facilities. 67 U.S. EPA, “Oil Pollution Prevention: Non-Transportation Related Onshore and Offshore Facilities,” Federal Register, vol. 38, no. 237 (December 11, 1973), pp. 34164-34170. 68 For more information see EPA’s SPCC website at http://www.epa.gov/emergencies/content/spcc/index.htm. 69 CWA Section 311(j)(1)(C). 70 See 40 CFR Section 112.1.

Oil Spills in U.S. Coastal Waters: Background, Governance, and Issues for Congress
Congressional Research Service 15
Pipeline Legislation
The U.S. pipeline network is extensive. Recent estimates indicate there are more than 33,000 miles of pipelines just in the Gulf of Mexico.71 Moreover, U.S. inland pipelines are concentrated in coastal areas, particularly in the Gulf states, and these pipelines may have an impact on coastal waters if spills reach waterways that empty into coastal waters.
Several laws govern oil pipelines. The Hazardous Liquid Pipeline Act of 1979 (P.L. 96-129) granted authority to the Department of Transportation (DOT) to regulate various issues regarding oil spills from pipelines. On December 29, 2006, the President signed the Pipeline Safety Improvement Act of 2006 (P.L. 109-468) to improve pipeline safety and security practices, and to reauthorize the federal Office of Pipeline Safety. The Office of Pipeline Safety (OPS), which is part of the DOT, implements provisions concerning pipeline design, construction, operation and maintenance, and spill response planning. For further information on pipeline legislation, see CRS Report RL33347, Pipeline Safety and Security: Federal Programs, by Paul W. Parfomak.
Vessel Legislation
Several federal laws directly or indirectly deal with oil pollution from vessels.72 Laws concerning navigation reduce the possibilities of vessel collision or hull breach by objects in the waterways.73 Other laws call for particular vessel design standards. For example, the Ports and Waterways Safety Act of 1972,74 amended by the Port and Tanker Safety Act of 1978,75 called for specific construction and equipment design requirements for oil tankers. (As noted, OPA subsequently amended this statute in 1990 by establishing a phased-in schedule for double-hulled tankers.) Congress enacted the 1970s legislation to coincide with international initiatives. In fact, many of the federal laws concerning vessel standards and pollution control procedures were written to implement international conventions. These laws are discussed in the next section.
International Conventions The relationship between international and domestic law can be complex. In general, international conventions (i.e., treaties), when signed by the United States and (if necessary) ratified by the Senate, are on equal footing with federal law. Parties to such conventions must often implement domestic legislation to carry out the provisions outlined in the convention. Several of the federal laws governing oil spills were fashioned in this manner.76
71 See, for example, MMS Press Release from February 2, 2005, at http://www.mms.gov/ooc/press/2005/press0202.htm. 72 For a comprehensive list of federal maritime legislation see USCG, Marine Safety Manual, Vol. IX (undated), Chapter 1, available at http://homeport.uscg.mil. 73 For example, the Rivers and Harbors Act of 1899, as amended (33 U.S.C. 401, et seq.), and the International Regulations for Preventing Collisions at Sea, as amended (33 U.S.C. 1601, et seq.). 74 P.L. 92-340, 33 U.S.C. 1221, et seq. 75 P.L. 95-474, codified at 33 U.S.C. 1221-1232 and 46 U.S.C. 3701-3718. 76 If a treaty is considered “self-executing,” domestic legislation implementing the treaty is not necessary. For more details on these issues, see CRS Report RL32528, International Law and Agreements: Their Effect Upon U.S. Law, by Michael John Garcia.

Oil Spills in U.S. Coastal Waters: Background, Governance, and Issues for Congress
Congressional Research Service 16
International conventions have played an important role in developing consistent standards for oil-carrying vessels from different nations. A primary player in this regard is the International Maritime Organization (IMO), a body of the United Nations, which sets international maritime vessel safety and marine pollution standards. The Coast Guard represents the United States at IMO meetings.
Multiple international conventions concern vessels and their impact on the marine environment. The two conventions described below are the most relevant to oil pollution in coastal waters.
MARPOL 73/78
The IMO implements the 1973 International Convention for the Prevention of Pollution from Ships, as modified by the Protocol of 1978 (MARPOL 73/78).77 Vessels whose nations are signatories to MARPOL are subject to its requirements, regardless of where they sail, and member nations are responsible for the vessels registered under their flag.
MARPOL 73/78 includes six annexes, each covering a different pollution type. Annex I (Prevention of Pollution by Oil) entered into force in 198378 and established requirements for controlling oil discharges to sea. Annex I requires vessels to have equipment that minimizes oil discharge, such as oil-water separators, and shipboard oil pollution emergency plans (SOPEPs). Although the SOPEP applicability is similar to that of the vessel response plan (VRP) required by OPA,79 the purpose of the SOPEP is somewhat different. A SOPEP is intended to provide guidance to the vessel’s officers regarding proper onboard emergency procedures when an oil spill occurs,80 whereas the VRP is more focused on responding to the spill itself.
The United States implements Annex I through the act to Prevent Pollution from Ships (APPS).81 APPS applies to all U.S.-flagged ships, irrespective of location, and to all foreign-flagged vessels in U.S. waters or at ports under U.S. jurisdiction. The USCG issues and enforces regulations necessary to carry out the APPS provisions. The USCG inspection program is a key component of its oil spill prevention effort.
Intervention Convention
The 1967 Torrey Canyon spill off the coast of Great Britain was one of the first major spills to receive worldwide attention.82 The incident raised many questions regarding oil spill response, particularly when dealing with vessels from other nations. For example, the incident prompted debate over actions allowable if a nation’s waters and environment are threatened by a spill from another nation’s vessel. The 1969 International Convention Relating to Intervention on the High
77 For convention texts and other materials, see http://www.imo.org. 78 The phrase “entry into force” signifies that the requisite number of nations have ratified the convention or annex, thus making the agreed upon requirements binding for all participating nations. For more discussion of the procedures of international conventions, see the IMO website at http://www.imo.org. 79 All vessels of any type over 400 gross tons traveling over international waters must have a SOPEP approved by their flag state. See USCG VRP/SOPEP “FAQs” at http://www.uscg.mil/vrp. 80 USCG, 1997, Marine Safety Manual, Marine Environment Protection, Volume IX, p. 4-24. 81 P.L. 96-478, 33 U.S.C. 1901, et seq. 82 The Torrey Canyon, a Liberian-flagged tanker, spilled approximately 35 million gallons of crude oil.

Oil Spills in U.S. Coastal Waters: Background, Governance, and Issues for Congress
Congressional Research Service 17
Seas in Cases of Oil Pollution Casualties (the Intervention Convention) sought to address these issues.
To implement this convention in the United States, Congress passed the Intervention on the High Seas Act of 1974.83 Under this act, if the USCG determines there to be a “grave and imminent danger to the coastline or related interests of the United States from pollution or threat of pollution of the sea by convention oil [i.e., as defined in the convention],” the USCG can take action to “prevent, mitigate, or eliminate that danger.”
Federal Agencies’ Responsibilities Unlike most countries, the United States shares jurisdiction over its territorial seas (0-12 nautical miles from shore) with its coastal states. The 1953 Submerged Lands Act (SLA) gave coastal states jurisdiction over the submerged lands, waters, and natural resources (e.g., oil deposits) located, in most cases, within three nautical miles off the coastline.84 The waters, seabed, and natural resources beyond the states’ waters are exclusively federal, and extend to the edge of the exclusive economic zone (200 nautical miles from shore). However, the federal government maintains the authority to regulate commerce, navigation, national defense, power production, and international affairs within state waters.
The oil spill legal framework involves implementation by multiple federal agencies. Agency responsibilities can be divided into two categories: (1) oil spill response and cleanup and (2) oil spill prevention/preparedness.
Response
Oil spill response authority is determined by the location of the spill: the USCG has response authority in coastal waters, and the EPA covers inland oil spills.85
As the primary response authority in coastal waters, the USCG has the ultimate authority to ensure that an oil spill is effectively removed and actions are taken to prevent further discharge from the source. During response operations, the USCG coordinates the efforts of federal, state, and private parties.
Coast Guard response efforts are supported by NOAA’s Office of Response and Restoration. NOAA provides scientific analysis and consultation during oil spill response activities.86
83 P.L. 93-248 , 33 U.S.C. 1471, et seq. 84 Most state waters extend 3 nautical miles (1 nautical mile = 6,076 feet, or 1.15 miles) from shore. Louisiana waters extend 3 imperial nautical miles (1 imperial nautical mile = 6,080 feet). Texas and Gulf Coast of Florida waters extend 3 marine leagues (equating to 9 nautical miles). See the MMS, OCS, website (“Definitions and Jurisdictions”) at http://www.mms.gov/incidents/pollution.htm. 85 The terms inland and coastal are defined in the National Contingency Plan (40 CFR Section 300.5). The coastal zone covers all waters subject to the tide, the Great Lakes, and all seaward waters (extending 200 nautical miles beyond shore). The inland zone covers all other U.S. waters. Spills in inland waters can potentially affect coastal waters and ecosystems, particularly if the spill occurs in water systems near the coast. In fact, a fine line may separate specific inland and coastal waters (e.g., consider the nexus between a bay and a river). 86 For more information see NOAA’s Office of Response and Restoration website, at http://response.restoration.noaa.gov/index.php.

Oil Spills in U.S. Coastal Waters: Background, Governance, and Issues for Congress
Congressional Research Service 18
Assistance can include oil spill tracking, cleanup alternatives, and knowledge of at-risk natural resources. Moreover, NOAA experts begin to collect data to assess natural resource damages during response operations.
Prevention and Preparedness
Regarding oil spill prevention and preparedness duties, jurisdiction is determined by the potential sources (e.g., vessels, facilities, pipelines) of oil spills. A series of executive orders (EOs), coupled with memoranda of understanding (MOU), have established the various agency responsibilities.87 Table 1 identifies the agencies responsible for implementing prevention and preparedness regulations for the potential sources of oil spills.
Table 1. Federal Agency Jurisdiction for Oil Spill Prevention and Preparedness Duties, by Source
Potential Source of Oil Spill Responsible Agency
Vessels USCG
Onshore, non-transportation facilities EPA
Onshore, transportation facilities USCG and Department of Transportation (DOT)
Deepwater portsa USCG and DOT
Offshore facilities (oil/gas extraction) Minerals Management Service (MMS) within the Department of Interior
Offshore pipelines directly associated with oil extraction activities (i.e., “production lines”)b
MMS
Offshore pipelines not directly associated with oil extraction activities (i.e., “transmission lines”)
Office of Pipeline Safety (OPS) within the DOT
Inland pipelines OPS
a. There is only one deepwater port in U.S. coastal waters: the Louisiana Offshore Oil Port (LOOP).
b. For further discussion on federal pipeline jurisdiction, see National Research Council, Improving the Safety of Marine Pipelines, National Academies of Science, 1994, pp. 86-89.
Prevention responsibilities include, among other things, assessing whether facilities or vessels have the necessary equipment in place. As discussed above, vessels may be required to have double hulls; facilities may need secondary containment.
Preparedness duties involve oversight tasks, such as evaluating facility and vessel response plans. Preparedness responsibilities also include developing and maintaining contingency plans at various levels: area, regional, and national. Personnel training is a vital component of sustaining readiness. NOAA oil spill experts help train responders in government service and private business.
87 Executive Order (EO) 12777 (October 18, 1991) delegates authorities pursuant to the Oil Pollution Act of 1990. This order was amended by EO 13286 (March 5, 2003), which reorganized duties in response to the creation of the Department of Homeland Security.

Oil Spills in U.S. Coastal Waters: Background, Governance, and Issues for Congress
Congressional Research Service 19
In addition, OPA requires agencies to conduct internal examinations to test preparedness.88 As part of this requirement, the USCG conducts Spills of National Significance (SONS) exercises to analyze the Coast Guard’s ability to respond to a major oil spill.
Federal Funding for the Oil Spill Liability Trust Fund In recent years, the level of funding for the trust fund has created some concern, highlighting a central policy debate: how should policymakers allocate the costs associated with a major, accidental oil spill? What share of costs should be borne by the responsible party (e.g., oil vessel owner/operators), the oil industry, and the general treasury?
Background
Prior to actions by the 109th and 110th Congresses, the trust fund was particularly vulnerable to a large and costly spill (e.g., the Exxon Valdez). After conducting two recent Spills of National Significance (SONS) exercises (in 2002 and 2004), the Coast Guard observed that a major spill could exceed the available resources in the trust fund.89
In 2005, Congress reinstated the 5-cent-per-barrel tax on oil, thus providing a dedicated source of revenue for the trust fund.90 In 2006, Congress raised the vessel liability limits, thus requiring the responsible party to pay a greater proportion of the oil spill costs.91 In 2008, the Emergency Economic Stabilization Act of 2008 (EESA; P.L. 110-343) increased the tax rate to 8 cents per barrel through 2016; in 2017, the rate is scheduled to increase to 9 cents per barrel. The tax terminates at the end of 2017.
Trust Fund Ceiling
In addition to increasing the tax rate, EESA repealed the requirement that the tax be suspended if the unobligated balance of the fund exceeded $2.7 billion. Under the original tax legislation (the Omnibus Budget Reconciliation Act of 1989 (P.L. 101-239)), the per-barrel tax would be suspended in any calendar quarter if the fund balance reached $1 billion, restarting again if it dipped below that number. With the Energy Policy Act of 2005 (P.L. 109-58), Congress raised this threshold from $1 billion to $2.7 billion.
In a report from the Senate Committee on Finance (S.Rept. 110-228), which discussed a provision similar to the repealing language of EESA,92 the committee stated that this change would simplify the administration of the tax. In effect, this change removes the former trust fund ceiling of $2.7 billion. As illustrated in Figure 3, the fund is currently projected to crest $3.5 billion by 2016. Policymakers may question whether it is necessary to have the trust fund reach this level. Others 88 As required by OPA Section 4202(a), which amended CWA Section 311(j)(7), codified in 33 U.S.C. 1321(j)(7). 89 See U.S. Department of Homeland Security, U.S. Coast Guard, California SONS 2004: After Action Report, pp. 46 and A-7. 90 Energy Policy Act of 2005 (P.L. 109-58). 91 Coast Guard and Maritime Transportation Act of 2006 (P.L. 109-241). 92 S.Rept. 110-228 accompanied S. 2345 (110th Congress), which contained (among other provisions) a provision to raise the tax rate and repeal the fund ceiling. S. 2345 was reported from the Senate Committee on Finance on November 13, 2007, but no further action was taken.

Oil Spills in U.S. Coastal Waters: Background, Governance, and Issues for Congress
Congressional Research Service 20
have suggested increasing the amount of trust fund monies that can be used to support oil spill research and development programs.93
Fund Projections
Before the recent legislative changes, fund managers projected the fund would be completely depleted by FY2009.94 With the 2005 and 2008 statutes in effect, the most recent projection (May 2009) indicates that the fund will reach almost $1.5 billion by the end of FY2009 (Figure 3).
The projections are somewhat uncertain because of potential claims arising from recent spills, including the 2007 spill into San Francisco Bay, the 2008 spill into the Mississippi River, and oil spills associated with Hurricanes Katrina and Rita (2005). In the months following the 2005 hurricanes, officials were concerned that associated claims against the fund would be substantial.95 However, these concerns have so far not been realized. As of the date of this report, claims related to Katrina and Rita have been relatively minor.96
Figure 3. Projected Annual Balances for the Oil Spill Liability Trust Fund, FY2009-FY2016
0
500
1,000
1,500
2,000
2,500
3,000
3,500
4,000
FY2009 FY2010 FY2011 FY2012 FY2013 FY2014 FY2015 FY2016
Mill
ion
s o
f D
olla
rs
Source: Prepared by CRS with data from National Pollution Funds Center (personal correspondence, May 7, 2009).
Fund Vulnerability
Although the trust fund is less vulnerable to a major spill due to recent legislative changes, some degree of exposure still remains. As a reference point, the Exxon Valdez spill tallied
93 See H.R. 2693, introduced by Representative Woolsey on June 3, 2009. 94 USCG, Report on the Oil Spill Liability Trust Fund, May 2005, p. 11. 95 A background document that was offered at an April 27, 2006, hearing stated, “the Coast Guard had estimated these costs could exceed $800 million” (House Subcommittee on Coast Guard and Maritime Transportation, Hearing on the Implementation of the Oil Pollution Act). 96 Per telephone conversation with an official from NPFC (March 30, 2009).

Oil Spills in U.S. Coastal Waters: Background, Governance, and Issues for Congress
Congressional Research Service 21
approximately $2 billion in cleanup costs and $1 billion in natural resource damages (not including third-party claims). If an accidental oil spill from a vessel matching the size of the Exxon Valdez (95,000 gross tons)97 were to occur, the vessel liability (under the new limits) would be capped at either $285 million (single hull) or $181 million (double hull). Cleanup costs and damages in excess of the liability limits could be covered by the trust fund.98 OPA Section 900199 established per-incident expenditure caps: no more than $1 billion (or the maximum amount available in the fund) for all eligible costs, and no more than $500 million for natural resource damages. Thus, a major spill, particularly one in a sensitive environment, could threaten the viability of the fund.
In addition, the above scenario assumes that the owner/operator can take advantage of the liability limits provided by OPA (e.g., obeyed relevant regulations and did not act with “gross negligence or willful misconduct”). If liability is not capped, the owner/operator could be liable for all costs. However, in the case of a significant spill (akin to the Exxon Valdez), some owner/operator companies may go bankrupt before paying for the entire cost of the spill. Such a scenario may also threaten the trust fund.
Addressing Vulnerability
The following options are among several that Congress might consider to address these concerns:
• First, Congress could maintain the status quo, in which the costs are shared between responsible parties, the oil industry, and general taxpayers. Responsible parties (i.e., owners/operators of vessels and facilities) are liable up to their liability caps (if applicable); the trust fund, which is funded through the tax on the oil industry, covers costs above liability limits; general treasury funds would cover costs if the trust fund is depleted.
• Second, Congress could further increase the liability limits for vessels, so that the responsible party would be required to pay a greater portion of the total spill cost before accessing trust fund dollars.
• Third, Congress could (further) increase the per-barrel oil tax to more quickly raise the fund’s balance. A fully funded OSLTF would be more capable of absorbing the costs in excess of a spiller’s liability limit.
• Fourth, policymakers may consider expanding liable parties to include the owner of the oil being transported. This option was considered during the development of OPA.100 More recently, the Coast Guard Authorization Act for Fiscal Year 2008 (S. 1892 in the 110th Congress) would have, among other things, altered the
97 The Exxon Valdez has been renamed the Sea River Mediterranean, and its specifications can be found at the USCG Port State Information Exchange database at http://cgmix.uscg.mil/PSIX/. 98 Except for emergency funds available to federal officials, the trust fund distributes monies through a claims process. Persons who have incurred cleanup costs or suffered damages from an oil spill may submit a claim for reimbursement from the trust fund. This includes responsible parties who have reached their respective liability limits. For more details on this process, see the National Pollution Fund Center’s website at http://www.uscg.mil/npfc/. 99 Codified in 26 U.S.C. 9509. 100 The House version of the bill—101st Congress, H.R. 1465—would have held, under certain conditions, oil owners liable for 50% of the costs and damages.

Oil Spills in U.S. Coastal Waters: Background, Governance, and Issues for Congress
Congressional Research Service 22
liability structure of OPA to make owners of oil liable for spills under certain conditions.
Considerations for Policymakers
The above options spotlight a central policy debate: how should policymakers allocate the costs associated with a major, accidental oil spill?
The first option would maintain the status quo, which represents a cost-sharing structure. Currently, responsible parties and the oil industry bear the costs for all but the most significant spills; general treasury funds are needed if the fund is depleted. Some groups may contend that this conflicts with the “polluter pays” principle, arguing that general treasury funds should never have to pay for oil spill cleanup or damages. Some combination of options two, three, and four could reduce the possibility of this occurrence.
The second option would help preserve the trust fund by increasing the liability limit of the spiller. Setting liability limits is a challenge because lawmakers must apportion the risk of a costly, accidental spill fairly between the responsible party and the trust fund. The shipping industry would likely argue that a further increase would be disruptive due to the cost of maintaining additional financial assurance. Considering that the limits were increased substantially in July 2006, this option might be less feasible than others.
The third option would increase the cost share borne by the oil industry overall. Some would argue that this follows the polluter pays principle. One view holds that the relevant industry—oil transportation and the oil industry in general—should bear the environmental costs that may develop during the course of business. A different interpretation of the “polluter pays” principle finds that only the responsible party, not industry overall, should pay. One with such a view might conclude that the third option—increasing the per barrel tax—is overreaching and unfair, because it increases the costs borne by the entire industry, instead of on the actual responsible party.101
There are likely many economic policy arguments both for and against an additional per-barrel tax on oil. For instance, some groups may claim that an additional oil barrel tax will be reflected in higher energy costs (gasoline, home heating oil) for consumers, which could disproportionately affect lower-income households. (In general, these types of tax policy debates are beyond the scope of this report.) However, policymakers might consider whether any negative consequences from an additional tax on industry would outweigh the potential benefits of allocating the costs to the oil industry. Regardless, raising the per-barrel tax for this purpose seems unlikely, considering that the rate was recently increased in 2008.
The fourth option, if implemented, would potentially subject oil companies to liability from spills of their own oil. In line with one view of the polluter pays principle, some may argue that oil owners should be at least partially responsible for the various costs associated with spills of their own oil.102 Oil industry stakeholders would likely argue that this option is unfair, because, for 101 The Bush Administration maintained an analogous view of the “polluter pays” principle in the context of whether or not to reinstate the Superfund tax on the chemical and oil industry. See CRS Report RL31410, Superfund Taxes or General Revenues: Future Funding Issues for the Superfund Program, by Jonathan L. Ramseur, Mark Reisch, and James E. McCarthy. 102 In addition, this change would arguably make OPA liability more in line with the liability structure of the Comprehensive Environmental Response Compensation and Liability Act (CERCLA or Superfund, P.L. 96-510), (continued...)

Oil Spills in U.S. Coastal Waters: Background, Governance, and Issues for Congress
Congressional Research Service 23
example, they would have limited control (besides selecting a carrier) over the transportation of their cargo. Moreover, the oil industry would likely point out that they are already supporting oil spill cleanup generally, through the per-barrel tax. Thus, they would likely argue that attaching direct liability to cargo owners would be an inequitable distribution of costs.
Policymakers may find the fourth option attractive, because of the financial strength—or perceived financial strength—of the oil companies.103 If the United States faces a multi-billion dollar oil spill (and the vessel owner/operators are unable to pay), some may argue that the oil owners should absorb the costs (above the limit of the trust fund) rather than funds from the general treasury. However, this particular liability issue is complicated: further legal and/or policy issues associated with this liability change are beyond the scope of this report.
State Laws As mentioned above, multiple states had oil spill liability laws before the passage of OPA in 1990. During the 15 years prior to OPA’s passage, the issue of whether or not to preempt state liability laws was perhaps the primary obstacle to enacting unified oil spill legislation. Proponents of preemption argued that differing state laws—particularly the various levels of liability—frustrate the shipping industry and are contrary to the goal of comprehensive federal legislation. Preemption opponents maintained that states should be allowed (as with most other federal environmental statutes) to set stiffer standards regarding liability, compensation, and cleanup.104 In the aftermath of the Exxon Valdez spill, the scales tipped to the side of anti-preemption. According to OPA Section 1018 (referred to as a “savings clause”), the act will not preempt any state from imposing additional liability or requirements with respect to the discharge of oil or related response activity (e.g., cleanup standards). A 2003 study identified 16 states that impose unlimited liability for oil spills.105
There was some concern that the language of OPA’s savings clause would allow states to regulate matters typically reserved for the federal government, such as oil tanker construction. To address this issue, the conference report stated that the savings clause would not disturb a 1978 Supreme Court decision that dealt with the intersection of federal and state authority to regulate the shipping industry.106 In that case, the Court invalidated a Washington State law that had attempted to govern oil tanker design, size, and movement in Puget Sound.107
(...continued)
which governs releases of hazardous substances. 103 Although record profits for certain oil companies have been highlighted in recent years, it is beyond the scope of this report to assess the extent of profits and financial worth of the oil industry overall, or the percentage of firms that achieved record profits. 104 In fact, one argument against preemption was that existing requirements under particular state laws would be diminished or negated entirely. See Benjamin Grumbles and Joan Manley, “The Oil Pollution Act of 1990: Legislation in the Wake of a Crisis,” Natural Resources and Environment, 10:2 (1995), p. 38. 105 Etkin, Dagmar, 2003, A Worldwide Review of Marine Oil Spill Fines and Penalties, at http://www.environmental-research.com/erc_papers/ERC_paper_10.pdf. 106 U.S. Congress, Conference Report accompanying H.R. 1465, Oil Pollution Act of 1990, 1990, Conf.Rept. 101-653, 101st Cong., 2nd sess., p. 122. 107 Ray v. Atlantic Richfield, 435 U.S. 151 (1978).

Oil Spills in U.S. Coastal Waters: Background, Governance, and Issues for Congress
Congressional Research Service 24
Regardless of the clarification in the conference report, the line between federal and state jurisdiction continues to be tested. In 2000, the Supreme Court struck down a Washington State rule calling for various personnel requirements, such as training, on oil tankers.108 Similarly, in July 2006, a federal district court in Massachusetts ruled against a state law that would govern logistics, such as tanker design, personnel qualifications, and navigation.109
Threat of Future Oil Spills in U.S. Coastal Waters This section examines the threat of future oil spills in coastal waters by assessing the possibilities for such spills, including spill location and oil type (crude versus refined product) and the nation’s level of preparedness (or readiness) for responding to a major spill.
Possibilities for Future Oil Spills Oil is expected to remain a primary source of energy in the United States for at least the next several decades.110 Although earlier projections indicated a steady rise in oil imports,111 imports have declined over the past several years. The most recent estimate (December 2009) from the Energy Information Administration (EIA) forecasts that oil imports will remain relatively consistent in coming years.112 Similarly, earlier estimates (projections made prior to 2009) indicated that consumption would continue to increase, but the EIA 2010 projection shows a decline from 2005 through 2010 (Figure 4).113 However, estimates for future years indicate that consumption will continue to increase. Regardless, Figure 4 illustrates that the United States will continue to import a substantial percentage of the oil it consumes.114
108 United States v. Locke, 529 U.S. 89 (2000). 109 United States v. Massachusetts, 440 F. Supp. 2d 24 (D. Mass. 2006). 110 Energy Information Administration (EIA), Annual Energy Outlook 2010, Early Release (hereinafter EIA 2010 Report), December 2009, at http://www.eia.doe.gov/. 111 See the 2007 version (and earlier editions) of the EIA’s Annual Energy Outlook. 112 EIA 2010 Report. 113 EIA 2010 Report, Table 11. 114 EIA 2010 Report.
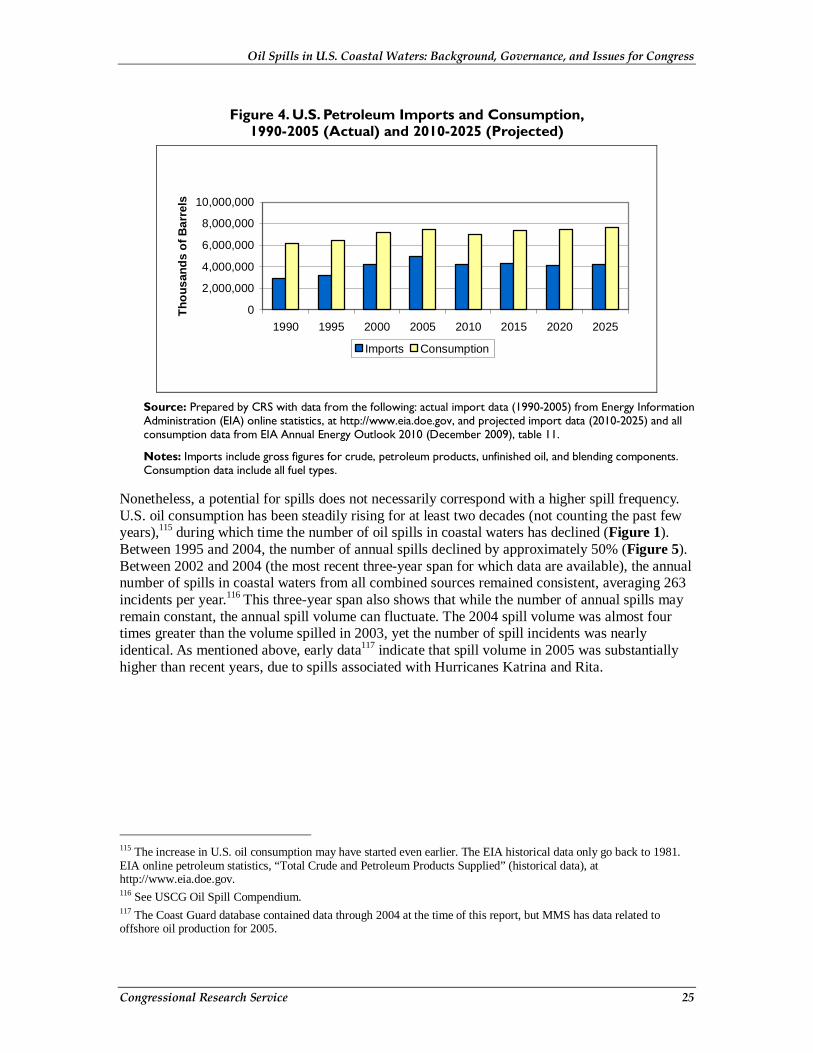
Oil Spills in U.S. Coastal Waters: Background, Governance, and Issues for Congress
Congressional Research Service 25
Figure 4. U.S. Petroleum Imports and Consumption, 1990-2005 (Actual) and 2010-2025 (Projected)
0
2,000,000
4,000,000
6,000,000
8,000,000
10,000,000
1990 1995 2000 2005 2010 2015 2020 2025
Th
ou
san
ds
of
Bar
rels
Imports Consumption
Source: Prepared by CRS with data from the following: actual import data (1990-2005) from Energy Information Administration (EIA) online statistics, at http://www.eia.doe.gov, and projected import data (2010-2025) and all consumption data from EIA Annual Energy Outlook 2010 (December 2009), table 11.
Notes: Imports include gross figures for crude, petroleum products, unfinished oil, and blending components. Consumption data include all fuel types.
Nonetheless, a potential for spills does not necessarily correspond with a higher spill frequency. U.S. oil consumption has been steadily rising for at least two decades (not counting the past few years),115 during which time the number of oil spills in coastal waters has declined (Figure 1). Between 1995 and 2004, the number of annual spills declined by approximately 50% (Figure 5). Between 2002 and 2004 (the most recent three-year span for which data are available), the annual number of spills in coastal waters from all combined sources remained consistent, averaging 263 incidents per year.116 This three-year span also shows that while the number of annual spills may remain constant, the annual spill volume can fluctuate. The 2004 spill volume was almost four times greater than the volume spilled in 2003, yet the number of spill incidents was nearly identical. As mentioned above, early data117 indicate that spill volume in 2005 was substantially higher than recent years, due to spills associated with Hurricanes Katrina and Rita.
115 The increase in U.S. oil consumption may have started even earlier. The EIA historical data only go back to 1981. EIA online petroleum statistics, “Total Crude and Petroleum Products Supplied” (historical data), at http://www.eia.doe.gov. 116 See USCG Oil Spill Compendium. 117 The Coast Guard database contained data through 2004 at the time of this report, but MMS has data related to offshore oil production for 2005.
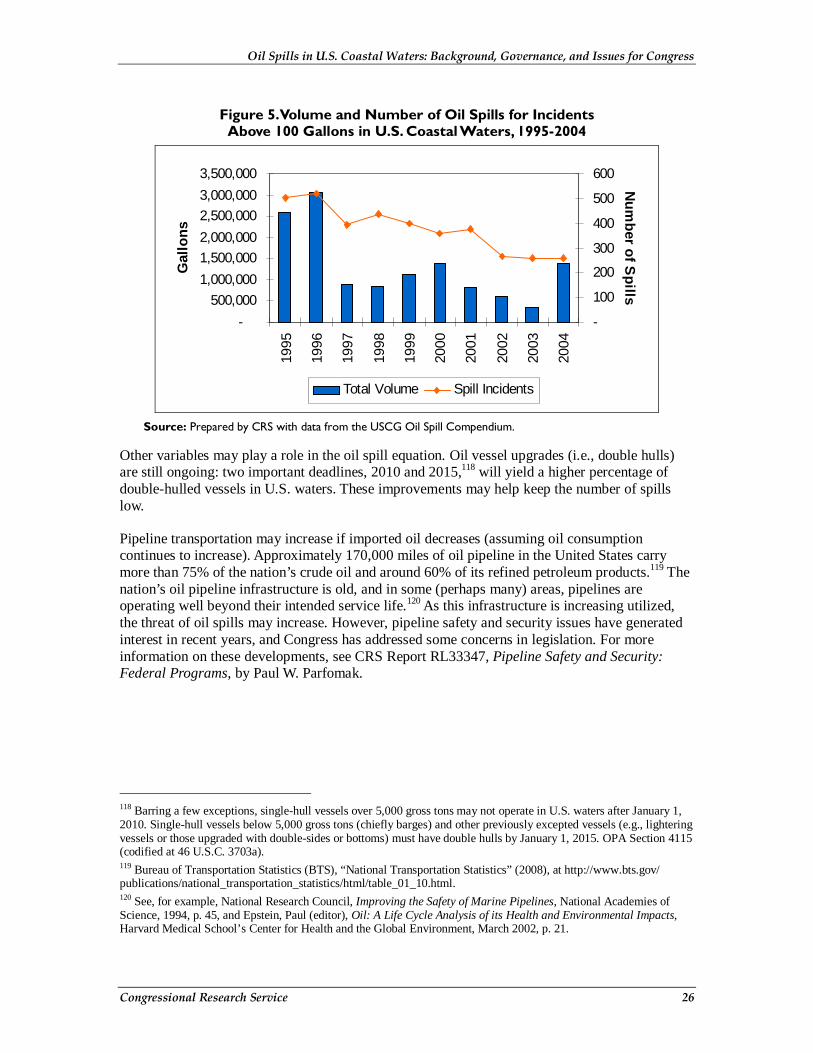
Oil Spills in U.S. Coastal Waters: Background, Governance, and Issues for Congress
Congressional Research Service 26
Figure 5. Volume and Number of Oil Spills for Incidents Above 100 Gallons in U.S. Coastal Waters, 1995-2004
-
500,000
1,000,000
1,500,000
2,000,000
2,500,000
3,000,000
3,500,000
1995
1996
1997
1998
1999
2000
2001
2002
2003
2004
Gal
lon
s
-
100
200
300
400
500
600N
um
ber o
f Sp
ills
Total Volume Spill Incidents
Source: Prepared by CRS with data from the USCG Oil Spill Compendium.
Other variables may play a role in the oil spill equation. Oil vessel upgrades (i.e., double hulls) are still ongoing: two important deadlines, 2010 and 2015,118 will yield a higher percentage of double-hulled vessels in U.S. waters. These improvements may help keep the number of spills low.
Pipeline transportation may increase if imported oil decreases (assuming oil consumption continues to increase). Approximately 170,000 miles of oil pipeline in the United States carry more than 75% of the nation’s crude oil and around 60% of its refined petroleum products.119 The nation’s oil pipeline infrastructure is old, and in some (perhaps many) areas, pipelines are operating well beyond their intended service life.120 As this infrastructure is increasing utilized, the threat of oil spills may increase. However, pipeline safety and security issues have generated interest in recent years, and Congress has addressed some concerns in legislation. For more information on these developments, see CRS Report RL33347, Pipeline Safety and Security: Federal Programs, by Paul W. Parfomak.
118 Barring a few exceptions, single-hull vessels over 5,000 gross tons may not operate in U.S. waters after January 1, 2010. Single-hull vessels below 5,000 gross tons (chiefly barges) and other previously excepted vessels (e.g., lightering vessels or those upgraded with double-sides or bottoms) must have double hulls by January 1, 2015. OPA Section 4115 (codified at 46 U.S.C. 3703a). 119 Bureau of Transportation Statistics (BTS), “National Transportation Statistics” (2008), at http://www.bts.gov/publications/national_transportation_statistics/html/table_01_10.html. 120 See, for example, National Research Council, Improving the Safety of Marine Pipelines, National Academies of Science, 1994, p. 45, and Epstein, Paul (editor), Oil: A Life Cycle Analysis of its Health and Environmental Impacts, Harvard Medical School’s Center for Health and the Global Environment, March 2002, p. 21.

Oil Spills in U.S. Coastal Waters: Background, Governance, and Issues for Congress
Congressional Research Service 27
U.S. Oil Imports and Possible Spills
The United States obtains its oil from a combination of domestic and foreign sources. The ratio of this mix and the method of its delivery could play a role in the number and volume of oil spills in the coming years. The following sections discuss this delivery system and its implications for oil spills in greater detail.
Only Canada delivers oil by pipeline to the United States. Although Canada is the leading single source of U.S. oil imports,121 the vast majority of U.S. oil imports arrive via vessel (Figure 6).
Figure 6. U.S. Petroleum Imports by Mode of Transportation, 1995-2008
-
1,000,000
2,000,000
3,000,000
4,000,000
5,000,000
6,000,000
199
5
199
6
199
7
199
8
199
9
200
0
200
1
200
2
200
3
200
4
200
5
200
6
200
7
200
8
Th
ou
san
ds
of
Bar
rels
Vessel Imports Pipeline Imports
Source: Prepared by CRS with data from EIA online statistics (U.S. Imports by Country of Origin), at http://www.eia.doe.gov.
Note: Pipeline imports represent imports from Canada; vessel imports are from all other nations.
Most of the U.S. oil imports (55%) arrive via the Gulf Coast (Figure 7).122 Of the oil spills within the Coast Guard’s jurisdiction (i.e., marine and coastal areas), approximately 50% of the incidents and the volume spilled have occurred in the Gulf of Mexico and its shoreline states.123 The Gulf will likely remain an area of special attention, because the number of vessels arriving with oil will increase in coming years.
121 Approximately 19% of total U.S. oil imports came from Canada in 2008. Energy Information Association, Petroleum Statistics, U.S. Imports by Country of Origin, available at http://www.eia.doe.gov. 122 Although most crude oil (62%) enters the United States through the Gulf, most of the petroleum products (70%) enter through ports on the east coast. EIA online statistics (Imports by Area of Entry), available at http://www.eia.doe.gov. 123 USCG Spill Compendium, Cumulative Data And Graphics For Oil Spills (1973-2004), at http://www.uscg.mil/hq/g-cp/comrel/factfile/index.htm.

Oil Spills in U.S. Coastal Waters: Background, Governance, and Issues for Congress
Congressional Research Service 28
Figure 7. Average Annual Distribution of U.S. Oil Imports by Geographic Region
East Coast25%
Midwest9%
Gulf Coast53%
West Coast10%
Rocky Mountains
3%
Source: Prepared by CRS with data from EIA online statistics (Imports by Area of Entry), available at http://www.eia.doe.gov.
Note: The above reflects an average of the years 2000-2008.
Level of Preparedness Although many consider the United States’ spill record over the last 15 years, particularly for major spills, to have been favorable, the absence of a major spill raises at least one issue. Because the nation has not been forced to respond to a major oil spill for such a long period, some have voiced concern that the nation might have lost the expertise and institutional knowledge necessary for quick and effective response action. The USCG found evidence to support this concern after the 2004 Spill of National Significance (SONS) exercise.124 The After Action Report concluded:
Oil spill response personnel did not appear to have even a basic knowledge of the equipment required to support salvage or spill cleanup operations.... There was a shortage of personnel with experience to fill key positions. Many middle-level spill management staff had never worked a large spill and some had never been involved in an exercise. As a result, some issues and complex processes unique to spill response were not effectively addressed.125
124 The California SONS 2004 was conducted in April 2004 and was the fourth SONS exercise performed by the USCG. The purpose of the SONS exercises is to ensure and evaluate the readiness of personnel to respond to a major oil spill. The 2004 SONS exercise was the largest to date and the first international SONS (involving Mexico). 125 U.S. Department of Homeland Security, U.S. Coast Guard, California SONS 2004: After Action Report, September 2004, p. 46.

Oil Spills in U.S. Coastal Waters: Background, Governance, and Issues for Congress
Congressional Research Service 29
Appendix. Additional Statistical Information Regarding Oil Spills
Sources of Oil Inputs to U.S. Coastal Waters Oil enters the coastal waters of the United States from a wide variety of sources. These sources comprise four major categories: natural seeps, oil consumption, oil transportation, and oil extraction.126 The majority of oil inputs are from natural seeps—geologic openings on the ocean floor. (See Figure A-1.) Well-known natural seeps are found in the Gulf of Mexico and off the coast of southern California, regions with extensive oil exploration and production. Although the seeps release large volumes of oil each year,127 the surrounding ecosystem can adapt, and even thrive, because the rate of release is relatively slow.128
Figure A-1. Percentage Contribution of Oil Inputs into North American Coastal Waters, by Major Source Categories
(Based on Average Annual Releases, 1990-1999)
Oil Consumption33%
Natural Seeps62%Oil
Transportation4%
Oil Extraction1%
Source: Prepared by the Congressional Research Service (CRS) with data from the National Research Council (NRC) of the National Academies of Science, 2003, Oil in the Sea III: Inputs, Fates, and Effects, p. 69.
126 NRC report, pp. 67-88. 127 The NRC report (p. 69) estimates that natural seeps off North America release 47 million gallons of oil each year (converted from tonnes). 128 NRC report, p. 2.
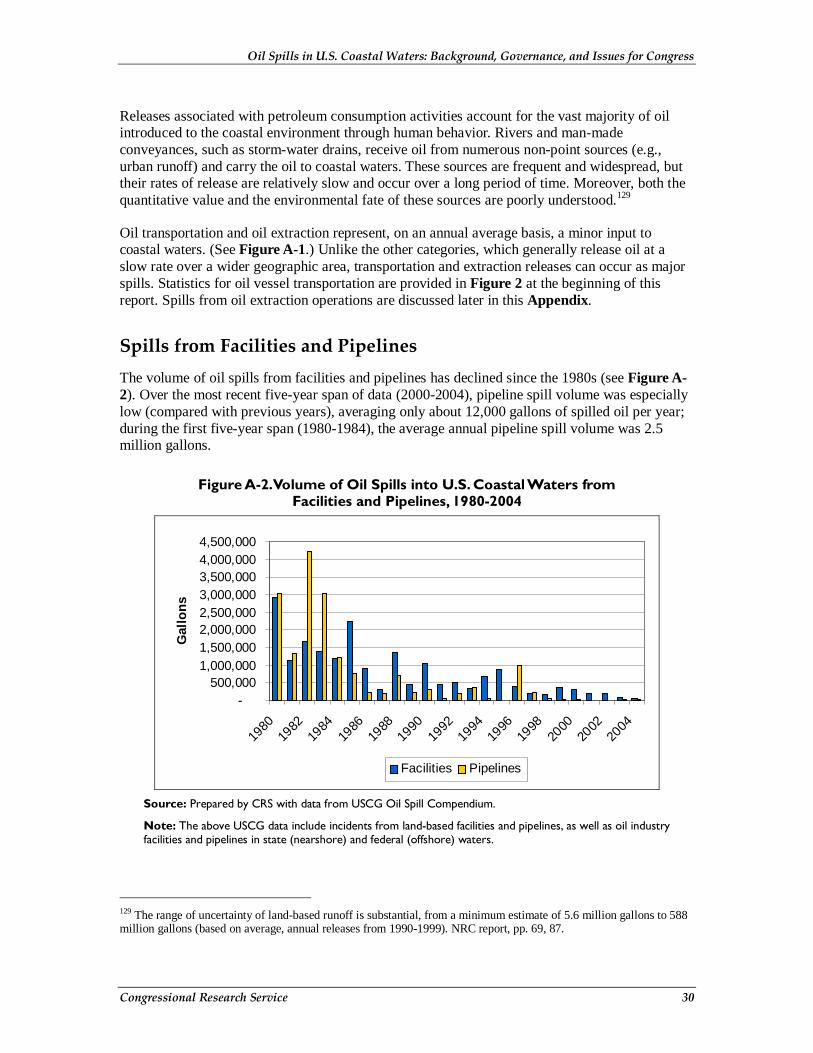
Oil Spills in U.S. Coastal Waters: Background, Governance, and Issues for Congress
Congressional Research Service 30
Releases associated with petroleum consumption activities account for the vast majority of oil introduced to the coastal environment through human behavior. Rivers and man-made conveyances, such as storm-water drains, receive oil from numerous non-point sources (e.g., urban runoff) and carry the oil to coastal waters. These sources are frequent and widespread, but their rates of release are relatively slow and occur over a long period of time. Moreover, both the quantitative value and the environmental fate of these sources are poorly understood.129
Oil transportation and oil extraction represent, on an annual average basis, a minor input to coastal waters. (See Figure A-1.) Unlike the other categories, which generally release oil at a slow rate over a wider geographic area, transportation and extraction releases can occur as major spills. Statistics for oil vessel transportation are provided in Figure 2 at the beginning of this report. Spills from oil extraction operations are discussed later in this Appendix.
Spills from Facilities and Pipelines The volume of oil spills from facilities and pipelines has declined since the 1980s (see Figure A-2). Over the most recent five-year span of data (2000-2004), pipeline spill volume was especially low (compared with previous years), averaging only about 12,000 gallons of spilled oil per year; during the first five-year span (1980-1984), the average annual pipeline spill volume was 2.5 million gallons.
Figure A-2. Volume of Oil Spills into U.S. Coastal Waters from Facilities and Pipelines, 1980-2004
-500,000
1,000,0001,500,0002,000,0002,500,0003,000,0003,500,0004,000,0004,500,000
1980
1982
1984
1986
1988
1990
1992
1994
1996
1998
2000
2002
2004
Gal
lon
s
Facilities Pipelines
Source: Prepared by CRS with data from USCG Oil Spill Compendium.
Note: The above USCG data include incidents from land-based facilities and pipelines, as well as oil industry facilities and pipelines in state (nearshore) and federal (offshore) waters.
129 The range of uncertainty of land-based runoff is substantial, from a minimum estimate of 5.6 million gallons to 588 million gallons (based on average, annual releases from 1990-1999). NRC report, pp. 69, 87.

Oil Spills in U.S. Coastal Waters: Background, Governance, and Issues for Congress
Congressional Research Service 31
The number of spills from pipelines in U.S. waters began to decline in the mid-1980s (Figure A-3). According to the Coast Guard data, there were only two spills between 2002 and 2004, each spill releasing approximately 15,000 gallons of oil. This low number of pipeline spills may be misleading, because some incidents might not be captured by the Coast Guard’s database. In a disclaimer on its website, the Coast Guard points out that its Oil Spill Compendium includes spills “investigated” by the Coast Guard.130 Some spills in coastal waters may be under another agency’s jurisdiction, such as the Office of Pipeline Safety or Minerals Management Service. Although the Coast Guard still includes some of these spills in the database, others are not included.
Spills from facilities have not followed a pattern of steady decline since 1980, but have fluctuated over the last two decades. However, in recent years the number of annual spills has been relatively stable.
Figure A-3. Annual Number of Spills to U.S. Waters from Facilities and Pipelines, 1980-2004
-
500
1,000
1,500
2,000
2,500
3,000
1980
1982
1984
1986
1988
1990
1992
1994
1996
1998
2000
2002
2004
Facilities Pipelines
Source: Prepared by CRS with data from the USCG Oil Spill Compendium.
Spills from Oil Exploration and Production Operations As depicted in Figure A-1, oil extraction activities contribute approximately 1% of the total oil input to North American waters. The vast majority (95%) of this (1%) oil extraction input comes from operational discharges, which are regulated by a Clean Water Act permit system. Thus, oil extraction spills represent, on an annual basis, only a relatively minor (only 0.05%) component of the total input to North American waters.
130 See Oil Spill Compendium at http://www.uscg.mil/hq/g-cp/comrel/factfile/index.htm.

Oil Spills in U.S. Coastal Waters: Background, Governance, and Issues for Congress
Congressional Research Service 32
However, oil well blowouts from offshore oil extraction operations have historically been a source of major oil spills. The largest accidental oil spill in world history—the IXTOC I, estimated at 140 million gallons—was due to an oil well blowout in Mexican Gulf Coast waters in 1979.131 A 1969 well blowout off the coast of Santa Barbara released approximately 4 million gallons into the environment and has been credited with catalyzing some of the landmark environmental legislation of the 1970s.
The spill record for offshore platforms in federal waters132 was noteworthy during the 1980s and 1990s. According to the Minerals Management Service (MMS)133 oil spill database, there were no oil spills over 1,000 barrels134 from federally regulated offshore facilities between 1981 and 2001 (Figure A-4). This effort was achieved in the context of increasing oil production on the outer continental shelf (OCS).135
Excluding the past two years, annual spill volumes from offshore facilities in federal waters increased in the 2000s (Figure A-4). Since 2002, there have been six offshore facility spills in federal waters over 1,000 barrels, the largest estimated at 2,000 barrels (84,000 gallons). Part of the increase in facility spill volume is attributable to a more comprehensive reporting regime. For example, tanks or machines with oil that are lost at sea during hurricanes are now counted as spills.136
Deepwater Horizon Incident in the Gulf of Mexico—April 2010 On April 20, 2010, an explosion occurred at the Deepwater Horizon drilling platform in the Gulf of Mexico, approximately 50 miles southeast of Louisiana. The explosion led to a significant fire, disabling the facility and leading to a full evacuation. The fire continued to burn until the platform sank into the Gulf on April 22. Federal agency responders include USCG, MMS, NOAA, and the National Transportation Safety Board (NSTB). Response activities were initiated immediately after the explosion and will continue indefinitely. At the date of this report, the Coast Guard reported that the well was continuing to release over 200,000 gallons of crude oil per day. This estimate is subject to change. Reporting on the Deepwater Horizon incident will be updated as new information is made available.
For more information and updates, see the Coast Guard’s incident website at http://www.d8externalaffairs.com/go/site/2931/ and NOAA Incident News at http://www.incidentnews.gov/incident/8220.
As Figure A-4 indicates, there were several years in which offshore pipelines contributed a relatively minor (or zero) spill volume. However, periodic large spills generated the vast majority of the spill volume from offshore operations between 1985 and 2000. For example, in 1988, there was only one pipeline spill over 1,000 barrels, but that one incident released 15,576 barrels into the environment (654,192 gallons).
131 NRC report, p. 33. 132 Federal waters extend 200 nautical miles from shore but do not include the waters adjacent to shore that are under state control (as discussed earlier in this report). 133 The MMS, in the U.S. Department of Interior, is the federal agency responsible for managing the oil and gas resources on the outer continental shelf. 134 1,000 barrels = 42,000 gallons. 135 The annual crude oil production in the Gulf of Mexico (the primary source of offshore crude oil) increased by 112% from 1981 to 2001. Energy Information Administration, Crude Oil Production statistics, at http://www.eia.doe.gov/. 136 Per August 15, 2006, telephone conversation with MMS official.

Oil Spills in U.S. Coastal Waters: Background, Governance, and Issues for Congress
Congressional Research Service 33
The vast majority of the offshore spills in federal waters have taken place in the Gulf of Mexico. In fact, there have been only four spills greater than 50 barrels (2,100 gallons) in the Pacific Region since 1985, none occurring after 1996.137
Figure A-4. Annual Oil Spill Volume for Spills Greater than 50 Gallons from Oil Exploration and Extraction Activities in Federal Waters on the
Outer Continental Shelf, 1985-2009
-
100,000
200,000
300,000
400,000
500,000
600,000
700,000
800,000
900,000
1985
1987
1989
1991
1993
1995
1997
1999
2001
2003
2005
2007
2009
Gal
lons
OCS Pipelines OCS Facilities
Source: Prepared by CRS with data from the Minerals Management Service (MMS) spill database, at http://www.mms.gov/incidents/IncidentStatisticsSummaries.htm.
Note: The MMS database includes spills from chemicals (e.g., methanol), but the above only includes spills of crude oil and petroleum products.
Although Figure A-4 and the above discussion pertain only to federal waters, there are numerous platforms and pipelines in state waters as well. The majority of the oil extraction operations are located in state waters off the coast of Louisiana and Texas. The precise volume and incident frequency in state waters are difficult to determine. The NRC report describes the data as “generally lacking,”138 but the report estimates that oil spills from operations in state waters account for twice the oil discharges of activities in federal waters.139 This estimate is noteworthy considering that spills in state waters present a potentially greater threat to the more sensitive shoreline environments. However, a recent analysis prepared for the American Petroleum Institute offers data that indicate that platform spills in state waters have contributed substantially less than in federal waters.140
137 MMS Oil Spill database, at http://www.mms.gov/incidents/pollution.htm. 138 NRC report, p. 193. 139 NRC report, p. 38. 140 American Petroleum Institute, Analysis of U.S. Oil Spillage (August 2009), prepared by Dagmar Etkin.

Oil Spills in U.S. Coastal Waters: Background, Governance, and Issues for Congress
Congressional Research Service 34
Author Contact Information Jonathan L. Ramseur Specialist in Environmental Policy [email protected], 7-7919