Oil Spills: Background and Governance
33
Oil Spills: Background and Governance Jonathan L. Ramseur Specialist in Environmental Policy September 15, 2017 Congressional Research Service 7-5700 www.crs.gov RL33705
Transcript of Oil Spills: Background and Governance

Oil Spills: Background and Governance
Jonathan L. Ramseur
Specialist in Environmental Policy
September 15, 2017
Congressional Research Service
7-5700
www.crs.gov
RL33705
Oil Spills: Background and Governance
Congressional Research Service
Summary Oil is a primary source of energy in the United States. Domestic oil production has increased in
recent years, and vast quantities of oil continually enter the country via vessel or pipeline, moving
throughout the country to various destinations. With such widespread use and nonstop movement,
it is inevitable that some number of spills will occur.
Oil spills have raised environmental concerns for decades. Several major U.S. oil spills have had
lasting repercussions that transcended local environmental and economic effects: the1969 well
blowout off the coast of Santa Barbara, California; the 1989 Exxon Valdez oil spill in Prince
William Sound, Alaska; and the 2010 Deepwater Horizon oil spill in the Gulf of Mexico. More
recent spills in various locations from other sources, including pipelines and rail transportation,
have garnered attention from policymakers. The impacts of an oil spill depend on the size of the
spill, the rate of the spill, the type of oil spilled, and the location of the spill. Depending on timing
and location, even a relatively minor spill can cause significant harm to individual organisms and
entire populations. Oil spills can cause impacts over a range of time scales, from days to years, or
even decades for certain spills.
Over the past two decades, the annual number and volume of oil spills have shown declines—in
some cases, dramatic declines. However, this trend was altered dramatically by the 2010
Deepwater Horizon oil spill in the Gulf of Mexico. The incident led to a significant release of oil:
According to estimates, the well released more than 100 million gallons of oil before it was
contained on July 15, 2010 (86 days later). Scientists continue to study the fate and impact of the
spill.
The governing framework for oil spills in the United States remains a combination of federal,
state, and international authorities. Within this framework, several federal agencies have the
authority to implement oil spill regulations. Agency responsibilities can be divided into two
categories: (1) oil spill response and cleanup and (2) oil spill prevention/preparedness.
Oil spill response authority is determined by the location of the spill: the U.S. Coast Guard has
response authority in the U.S. coastal zone, and the Environmental Protection Agency (EPA)
covers the inland zone. The Clean Water Act, as amended by the Oil Pollution Act (OPA) in 1990,
provides the federal authority to perform cleanup immediately using federal resources, monitor
the response efforts of the spiller, or direct the spiller’s cleanup activities. The lead federal
responder (either from Coast Guard or EPA) determines the level of cleanup required. Federal
responders have immediate access to funds in the Oil Spill Liability Trust Fund to support
cleanup activities. The trust fund is primarily financed by a per-barrel tax on domestic crude oil
and imported petroleum products. The fund’s balance is estimated to reach $5.4 billion at the end
of FY2017.
Parties responsible for an oil spill may be liable for cleanup costs, natural resource damages, and
specific economic damages, including personal property damage and lost profits or earning
capacity. OPA provided (1) limited defenses from liability—act of God, act of war, and act or
omission of certain third parties—and (2) conditional liability limits (or caps) for cleanup costs
and other damages.
Jurisdiction over oil spill prevention and preparedness duties is determined by the potential
sources (e.g., vessels, facilities, pipelines) of oil spills. A series of executive orders, coupled with
memoranda of understanding, have established the various agency responsibilities. For example,
EPA oversees onshore facilities, the Coast Guard oversees vessels, the Department of
Transportation oversees pipelines and rail transportation, and the Department of the Interior’s
Bureau of Ocean Energy Management oversees offshore facilities (e.g., oil platforms).

Oil Spills: Background and Governance
Congressional Research Service
Contents
Introduction ..................................................................................................................................... 1
Background ..................................................................................................................................... 1
Oil Spill Data: Recent Trends ................................................................................................... 2 Coast Guard Data ................................................................................................................ 2 PHMSA Data ...................................................................................................................... 5
Impacts of Oil Spills in Aquatic Environments ......................................................................... 8 Acute Impacts ..................................................................................................................... 8 Chronic Impacts .................................................................................................................. 8 Ecosystem Recovery ........................................................................................................... 9
Economic Costs of Oil Spills .................................................................................................... 9 Cleanup Costs ..................................................................................................................... 9 Natural Resources Damages ............................................................................................. 10 Other Economic Costs ....................................................................................................... 11
Oil Spill Governance ...................................................................................................................... 11
Oil Pollution Act of 1990 ........................................................................................................ 12 Spill Response Authority .................................................................................................. 12 National Contingency Plan ............................................................................................... 12 Tank Vessel and Facility Response Plans .......................................................................... 13 Double-Hull Design for Vessels ........................................................................................ 13 Liability Issues .................................................................................................................. 14 The Oil Spill Liability Trust Fund .................................................................................... 17 Financial Responsibility .................................................................................................... 19
Other Federal Laws ................................................................................................................. 20 Clean Water Act ................................................................................................................ 20 Outer Continental Shelf Lands Act ................................................................................... 21 Pipeline Statutes ................................................................................................................ 21 Vessel Statutes ................................................................................................................... 22
Federal Agencies’ Responsibilities .......................................................................................... 22 Response ........................................................................................................................... 22 Prevention and Preparedness ............................................................................................ 23
International Conventions ....................................................................................................... 24 MARPOL 73/78 ................................................................................................................ 25 Intervention Convention ................................................................................................... 25
State Laws ............................................................................................................................... 26
Figures
Figure 1. Oil Spills from All Sources in U.S. Coast Guard’s Jurisdiction: 2002-2016 ................... 3
Figure 2. Volume of Oil Spills by Source in the Coast Guard’s Jurisdiction: 1974-2016 ............... 4
Figure 3. Oil Spills from Pipeline and Rail Transportation: 2002-2016 .......................................... 6
Figure 4. Pipeline vs. Rail Crude Oil Spill Incidents: 2010-2016 ................................................... 7
Figure 5. Pipeline vs. Rail Crude Oil Spill Volume: 2010-2016 ..................................................... 7
Figure 6. Oil Spill Liability Trust Fund ......................................................................................... 19

Oil Spills: Background and Governance
Congressional Research Service
Tables
Table 1. Oil Spill Liability Limits by Source of Potential Spill .................................................... 16
Table 2. Federal Agency Jurisdiction for Oil Spill Prevention and Preparedness Duties, by
Source ......................................................................................................................................... 24
Appendixes
Appendix. Federal Authorities Before and After the Exxon Valdez Spill ...................................... 28
Contacts
Author Contact Information .......................................................................................................... 29

Oil Spills: Background and Governance
Congressional Research Service 1
Introduction Oil is a dominant source of energy in the United States, accounting for approximately 37% of
total energy consumption in 2016.1 Its use is widespread, providing fuel for the transportation,
industrial, and residential sectors. Vast quantities of oil continuously enter the country via vessel
or pipeline. Vast quantities continually move throughout the country to various destinations. With
such widespread use and nonstop movement, it is inevitable that some number of spills will
occur.
This report provides background information regarding oil spills and identifies the legal
authorities and processes for oil spill prevention, response, liability, and compensation. The first
section highlights background issues, including oil spill statistics and potential environmental
impacts. The second section discusses the legal and regulatory framework that governs oil spill
prevention and response.
Background Oil spills occur from a wide variety of sources.2 Some sources release relatively minor amounts
per individual release but, in aggregate, contribute a significant annual volume (e.g., recreational
vessels). Other sources, such oil tankers or offshore oil wells, release oil on a less frequent basis
but have the potential to release a significant volume in one incident. These variances in
frequency and volume of oil releases create different environmental impacts as well as different
challenges for responders and policymakers.
Major oil well blowouts are relatively uncommon but have accounted for the largest unintentional
oil spills in world history. In 1979, the IXTOC I oil well blowout released an estimated 140
million gallons in Mexican Gulf Coast waters.3 By comparison, the largest oil tanker spill in
world history—the Atlantic Empress off the coast of Tobago in 1979—was estimated at
approximately 84 million gallons.4
Over the past few decades, two major U.S. oil spills have had lasting repercussions that
transcended local environmental and economic effects:
1. 2010 Deepwater Horizon oil spill: On April 20, 2010, an explosion occurred at
the Deepwater Horizon drilling platform in the Gulf of Mexico, resulting in 11
fatalities. The platform had been attached to the Macondo oil well approximately
5,000 feet below sea level. Two days later the platform sank into the Gulf, and
responders discovered that the well was releasing oil at a significant rate.
According to estimates, the well released more than 100 million gallons of oil
before it was contained 86 days later.5
1 Energy Information Administration, Monthly Energy Review, Primary Energy Consumption by Source, Table 1.3, ,
https://www.eia.gov/totalenergy/data/monthly/pdf/sec1_7.pdf. 2 In this report, oil refers to crude oil and petroleum products, including gasoline and other fuels, unless stated
otherwise. 3 NRC report, 2003, p. 33. 4 For a list of the largest oil tanker spills, see International Tanker Owners Pollution Federation (ITOPF) website, at
http://www.itopf.com/. 5 BP and the federal government disputed the final spill volume. Spill volume is a central factor in assessing civil
penalties under the Clean Water Act. The parties agreed that responders recovered 34 million gallons (810,000 barrels)
at the wellhead before the oil could contact sea water. After accounting for this collection, the U.S. government
(continued...)

Oil Spills: Background and Governance
Congressional Research Service 2
2. 1989 Exxon Valdez oil spill: On March 24, 1989, the Exxon Valdez oil tanker ran
aground on Bligh Reef in Prince William Sound, Alaska, releasing approximately
11 million gallons of crude oil.6 Cleanup efforts lasted for six months in 1989
until the U.S. Coast Guard suspended operations due to weather and climatic
conditions. Cleanup efforts resumed during the warmer months of 1990 and
1991. The Exxon Valdez spill produced extensive consequences beyond Alaska.
According to the National Academies, the Exxon Valdez disaster caused
“fundamental changes in the way the U.S. public thought about oil, the oil
industry, and the transport of petroleum products by tankers. ... ‘Big oil’ was
suddenly seen as a necessary evil, something to be feared and mistrusted.”7
Oil Spill Data: Recent Trends
No single agency or organization collects oil spill data from all of the major sources for all
locations. Although the National Response Center collects and provides details about a wide
spectrum of incidents, the spill volume data are often initial, unverified estimates, and drawing
lessons from these data may be difficult.
A national assessment of oil spill volume and frequency necessitates data collection from several
sources, including the U.S. Coast Guard and the Department of Transportation’s Pipeline and
Hazardous Materials Safety Administration (PHMSA). Combining the data from these sources
may be problematic, because (1) some incidents may be included in both sources of data; and (2)
the data collection processes and scopes may vary. Therefore, data from these sources are
presented separately below.
Coast Guard Data
The Coast Guard has maintained an Oil Spill Compendium with spill data for various sources
within its jurisdiction for responding to oil spills.8 Pursuant to the National Contingency Plan
(discussed below), the Coast Guard’s oil spill response jurisdiction is the “coastal zone,” defined
in regulations to include
all United States waters subject to the tide, United States waters of the Great Lakes,
specified ports and harbors on inland rivers, waters of the contiguous zone, other waters
(...continued)
estimated the net discharge at 176 million gallons (4.19 million barrels). BP estimated a net discharge of 103 million
gallons (2.45 million barrels). In the context of Clean Water Act penalty calculations, a federal court concluded that the
discharge was ultimately 134 million gallons (3.19 million barrels). See U.S. District Court for the Eastern District of
Louisiana, Findings of Fact and Conclusions of Law, Oil Spill by the Oil Rig Deepwater Horizon in the Gulf of Mexico
on April 20, 2010, January 15, 2015, http://www.laed.uscourts.gov/OilSpill/Orders/1152015FindingsPhaseTwo.pdf. 6 Note that the Exxon Valdez spill ranks only 35th for spill volume on the list of international tanker spills since 1967.
See International Tanker Owners Pollution Federation Limited, “Historical Data,” http://www.itopf.com/stats.html. 7 See National Research Council (NRC), Oil in the Sea III: Inputs, Fates, and Effects, National Academies of Science
(hereinafter “NRC report, 2003”), February 2003, p. 11. 8 The Coast Guard states that its Oil Spill Compendium includes spills that have been “investigated” by the Coast
Guard. Further, “this data is provided ‘as reported,’ with no interpretation or filtering. For example, incidents that fall
within the jurisdiction of other agencies, or that are not required to be reported under existing Coast Guard regulations,
may or may not be included in the compendium.” USCG Oil Spill Compendium, https://homeport.uscg.mil (click on
“Investigations”).

Oil Spills: Background and Governance
Congressional Research Service 3
of the high seas subject to the NCP, and the land surface or land substrata, ground waters,
and ambient air proximal to those waters.9
Figure 1 illustrates the number of oil spill incidents and spill volume between 2002 and 2016
from data provided by the Coast Guard. The spill data include incidents from vessels, facilities,
and pipelines. The 2010 Deepwater Horizon oil spill is not included in the figure, because the
magnitude of its spill volume—more than 100 million gallons—makes it difficult to compare to
annual spill volumes. The figure does include an estimate of oil released on the surface
(approximately 400,000 gallons) from the Deepwater Horizon mobile offshore drilling unit.
The figure indicates that the number of incidents has decreased over time. Except for several
large incidents in 2005 and 2006 (and the Deepwater Horizon incident in 2010), the volume of
spilled oil has remained relatively consistent. In 2005, approximately 8 million gallons of oil were
released from Louisiana facilities damaged during Hurricane Katrina; in 2006, approximately 2
million gallons spilled from a refinery in Louisiana.10
Figure 1. Oil Spills from All Sources in U.S. Coast Guard’s Jurisdiction: 2002-2016
Does not include the volume from the 2010 uncontrolled Macondo well
Source: Prepared by CRS; 2002-2011 data from the USCG Oil Spill Compendium, at https://homeport.uscg.mil
(click on “Investigations”); 2012-2015 data from the Bureau of Transportation Statistics, “Petroleum Oil Spills
Impacting Navigable U.S. Waterways,” which cites the Coast Guard as its data sources; 2016 data provided to
CRS in personal correspondence with Coast Guard (June 2017).
Notes: The Coast Guard states that its Oil Spill Compendium includes spills that have been “investigated” by
the Coast Guard. Further, “this data is provided ‘as reported,’ with no interpretation or filtering. For example,
incidents that fall within the jurisdiction of other agencies, or that are not required to be reported under existing
Coast Guard regulations, may be included in the compendium.” For example, starting in 2007, the Coast Guard
data did not include spill data from onshore pipelines.
The spill volume from the 2010 uncontrolled Macondo well is not included in the above figure: the magnitude of
its spill volume (estimated at more than 100 million gallons) makes it difficult to compare to annual spill volumes.
The figure does include an estimate of oil released (approximately 400,000 gallons) from the Deepwater Horizon
mobile offshore drilling unit.
9 40 C.F.R. §300.5. 10 U.S. Coast Guard, Oil Spill Compendium, Part II.

Oil Spills: Background and Governance
Congressional Research Service 4
Figure 2 compares the volume of spills over a longer time period from the same selected sources
identified in Figure 1. As Figure 2 illustrates, the annual oil spill volumes from all sources—
particularly tankers and barges—declined dramatically in the 1990s compared to previous
decades. This historical decline is likely related, at least in part, to the Oil Pollution Act of 1990
(OPA), which was enacted after the 1989 Exxon Valdez oil spill.11
The 1990 act (discussed below)
made comprehensive changes to U.S. oil pollution law by expanding federal response authority
and increasing spill liability. The high costs associated with the Exxon Valdez spill,12 and the
threat of broad liability imposed by OPA (in some scenarios, unlimited liability), were likely
significant drivers for the spill volume decline seen in the 1990s.
Figure 2. Volume of Oil Spills by Source in the Coast Guard’s Jurisdiction: 1974-2016
Does not include the volume from 2010 uncontrolled Macondo well in the Gulf of Mexico
Source: Prepared by CRS; 2002-2011 data from the USCG Oil Spill Compendium, at https://homeport.uscg.mil
(click on “Investigations”); 2012-2015 data from the Bureau of Transportation Statistics, “Petroleum Oil Spills
Impacting Navigable U.S. Waterways,” which cites the Coast Guard as its data sources; 2016 data provided to
CRS in personal correspondence with Coast Guard (June 2017). The “other” category includes a wide spectrum
of sources, such as deepwater ports, fixed offshore and inshore platforms, facilities (of multiple types), aircraft,
land vehicles, and railroad equipment.
Notes: The Coast Guard states that its Oil Spill Compendium includes spills that have been “investigated” by
the Coast Guard. Further, “this data is provided ‘as reported,’ with no interpretation or filtering. For example,
11 In addition, several substantial oil spills occurred in 1990, including the Mega Borg tanker that spilled over 4 million
gallons of oil in the Gulf of Mexico. 12 The Exxon Valdez spill tallied approximately $2 billion in cleanup costs and $1 billion in natural resource damages
(not including third-party claims)—in 1990 dollars. Punitive damage claims were litigated for more than 12 years,
eventually reaching the U.S. Supreme Court in 2008 (Exxon Shipping v. Baker, 128 S. Ct. 2605 (2008)). Plaintiffs were
eventually awarded approximately $500 million in punitive damages. An additional $500 million in interest on those
damages was subsequently awarded.

Oil Spills: Background and Governance
Congressional Research Service 5
incidents that fall within the jurisdiction of other agencies, or that are not required to be reported under existing
Coast Guard regulations, may be included in the compendium.” For example, starting in 2007, the Coast Guard
data did not include spill data from onshore pipelines.
The spill volume from the 2010 uncontrolled Macondo well is not included in the above figure: the magnitude of
its spill volume (estimated at more than 100 million gallons) makes it difficult to compare to annual spill volumes.
The figure does include an estimate of oil released (approximately 400,000 gallons) from the Deepwater Horizon
mobile offshore drilling unit.
PHMSA Data
PHMSA collects oil spill data for pipelines and rail transportation—two modes of oil
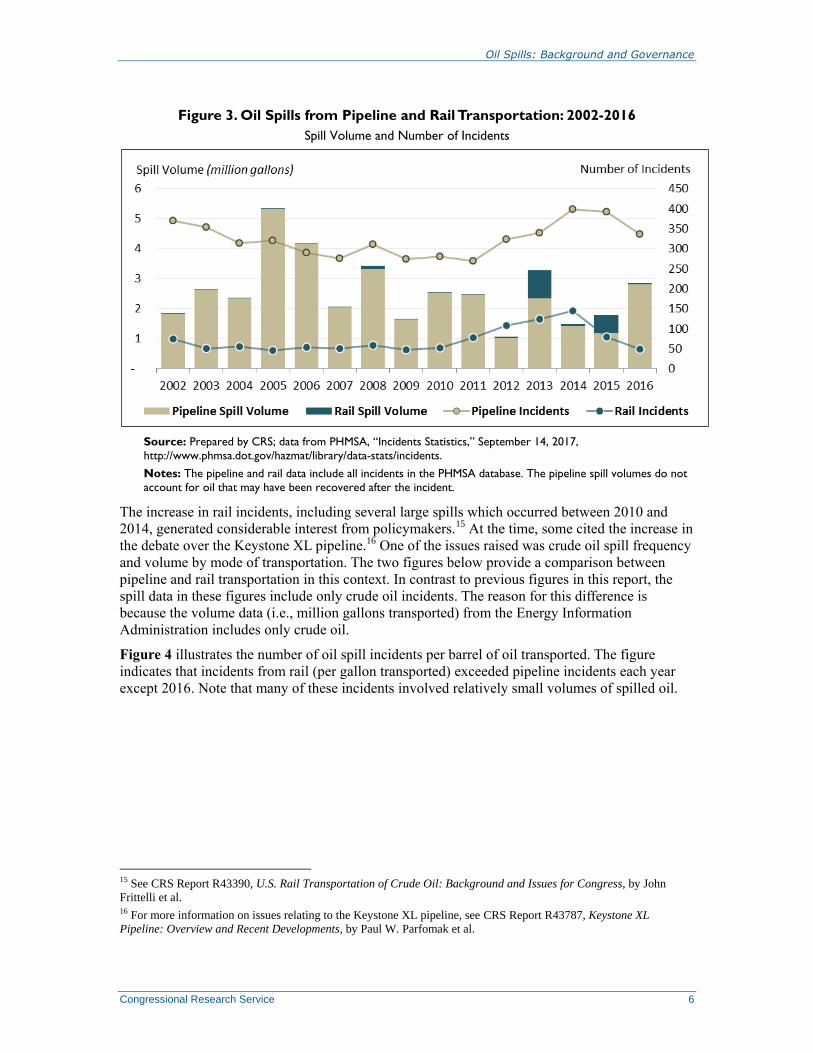
transportation that have received attention in recent years. Figure 3 illustrates the number of oil
incidents and spill volume by mode of transportation between 2002 and 2016. The pipeline and
rail data illustrated in the figure include incidents that involve spills as small as one gallon.
As the figure indicates, pipeline incidents increased between 2011 and 2014 but have decreased
since then. Spill volumes have fluctuated over time depending on the number and size of major
spills in particular years. For example, in 2016, three pipeline incidents resulted in spills of over
300,000 gallons. In 2015, only two spills resulted in releases of over 100,000 gallons.
Spills from rail transportation increased dramatically between 2009 and 2014 largely due to the
increased transportation of crude oil by rail.13 In 2015 and 2016, the number of incidents by rail
decreased as crude by rail transportation decreased.14 As with pipeline spill volume, the annual
spill volumes from rail transportation are a function of the number and size of major spills. For
example, the increased rail volume in 2013 is the result of two major incidents of over 450,000
gallons. The increased rail volume in 2015 is the result of three major incidents of over 100,000
gallons.
13 Based on data from the Association of American Railroads, “Moving Crude Oil by Rail,” September 2014,
https://www.aar.org. For further details, see CRS Report R43390, U.S. Rail Transportation of Crude Oil: Background
and Issues for Congress, by John Frittelli et al. 14 For more details, see CRS In Focus IF10727, Rail Transportation of Crude Oil and the FAST Act: An Update, by
John Frittelli.
Oil Spills: Background and Governance
Congressional Research Service 6
Figure 3. Oil Spills from Pipeline and Rail Transportation: 2002-2016
Spill Volume and Number of Incidents
Source: Prepared by CRS; data from PHMSA, “Incidents Statistics,” September 14, 2017,
http://www.phmsa.dot.gov/hazmat/library/data-stats/incidents.
Notes: The pipeline and rail data include all incidents in the PHMSA database. The pipeline spill volumes do not
account for oil that may have been recovered after the incident.
The increase in rail incidents, including several large spills which occurred between 2010 and
2014, generated considerable interest from policymakers.15 At the time, some cited the increase in
the debate over the Keystone XL pipeline.16 One of the issues raised was crude oil spill frequency
and volume by mode of transportation. The two figures below provide a comparison between
pipeline and rail transportation in this context. In contrast to previous figures in this report, the
spill data in these figures include only crude oil incidents. The reason for this difference is
because the volume data (i.e., million gallons transported) from the Energy Information
Administration includes only crude oil.
Figure 4 illustrates the number of oil spill incidents per barrel of oil transported. The figure
indicates that incidents from rail (per gallon transported) exceeded pipeline incidents each year
except 2016. Note that many of these incidents involved relatively small volumes of spilled oil.
15 See CRS Report R43390, U.S. Rail Transportation of Crude Oil: Background and Issues for Congress, by John
Frittelli et al. 16 For more information on issues relating to the Keystone XL pipeline, see CRS Report R43787, Keystone XL
Pipeline: Overview and Recent Developments, by Paul W. Parfomak et al.

Oil Spills: Background and Governance
Congressional Research Service 7
Figure 4. Pipeline vs. Rail Crude Oil Spill Incidents: 2010-2016
Spill Incidents per Million Gallons Transported
Source: Prepared by CRS; oil spill data from PHMSA, “Incidents Statistics,” September 14, 2017,
http://www.phmsa.dot.gov/hazmat/library/data-stats/incidents; pipeline transport data from Energy Information
Administration, “Refinery Receipts of Crude Oil by Method of Transportation,” http://www.eia.gov; rail
transportation data from EIA, “Movements of Crude Oil and Selected Products by Rail.” The pipeline and rail
data include all crude oil incidents in the PHMSA database.
Figure 5 compares the volume of oil spilled per volume of oil transported by mode of
transportation. The figure indicates that in four of the last seven years the volume of oil spilled by
pipeline rail (per gallon transported) exceeded that of rail transport. However, in the three years in
which rail transport volume exceeded pipeline volume (per volume transported), the differences
between rail and pipeline volumes were more substantial. As discussed above, these differences
are due to a small number of relatively large spills from rail that occurred in those years.
Figure 5. Pipeline vs. Rail Crude Oil Spill Volume: 2010-2016
Spill Volume per Million Gallons Transported
Source: Prepared by CRS; oil spill data from PHMSA, “Incidents Statistics,” September 14, 2017,
http://www.phmsa.dot.gov/hazmat/library/data-stats/incidents; pipeline transport data from Energy Information
Administration, “Refinery Receipts of Crude Oil by Method of Transportation,” http://www.eia.gov; rail

Oil Spills: Background and Governance
Congressional Research Service 8
transportation data from EIA, “Movements of Crude Oil and Selected Products by Rail.” The pipeline and rail
data include all crude oil incidents in the PHMSA database.
Impacts of Oil Spills in Aquatic Environments
The impacts of an oil spill depend on the size of the spill, the rate of the spill, the type of oil
spilled, and the location of the spill. Depending on timing and location, even a relatively minor
spill can cause significant harm to individual organisms and entire populations.17 Oil spills can
cause impacts over a range of time scales, from days to years, or even decades for certain spills.
Impacts are typically divided into acute (short-term) and chronic (long-term) effects. Both types
are part of a complicated and often controversial equation that is addressed after an oil spill:
ecosystem recovery.
Acute Impacts
Depending on the toxicity and concentration of the spill, acute exposure to oil spills can kill
various organisms and cause the following debilitating (but not necessarily lethal) effects:18
reduced reproduction,
altered development,
impaired feeding mechanisms, and
decreased defense from disease.
Birds, marine mammals, bottom-dwelling and intertidal species, and organisms in their
developmental stages (e.g., fish eggs and larvae) are particularly vulnerable to oil spills.19
In addition to the impacts to individual organisms, oil spills can lead to a disruption of the
structure and function of the ecosystem. Certain habitats—such as coral reefs, mangrove swamps,
and salt marshes—are especially vulnerable, because the physical structure of the habitats
depends upon living organisms.
These potential acute effects to individual organisms and marine ecosystems have been
“unambiguously established” by laboratory studies and well-studied spills.20
Chronic Impacts
Long-term, chronic exposure typically occurs from continuous oil releases—leaking pipelines,
offshore production discharges, and non-point sources (e.g., urban runoff). Although spills are
normally associated with acute impacts, some oil spills have also demonstrated chronic exposure
and effects.21 There is increasing evidence that chronic, low-level exposures to oil contaminants
can significantly affect the survival and reproductive success of marine birds and mammals.22
However, because of the complexity of factors, including a longer time period and presence of
17 NRC report, 2003, p. 4. 18 These “sub-lethal” effects can occur at concentrations that are several orders of magnitude lower than concentrations
that cause death. NRC report, 2003, p. 127. 19 NRC report, 2003, Chapter 5; also multiple conversations with National Oceanic and Atmospheric Administration
(NOAA) personnel (2008). 20 NRC report, 2003, p. 120. 21 NRC report, 2003, p. 121. 22 NRC report, 2003, p. 134.

Oil Spills: Background and Governance
Congressional Research Service 9
other pollutants, determining the precise effects on species and ecosystems due to chronic oil
exposure in a particular locale is difficult for scientists. As a result, studies involving chronic
effects are often met with debate and some controversy.
Ecosystem Recovery
Interested parties may have differing opinions as to what constitutes ecosystem recovery. At one
end of the spectrum, local groups may demand that an ecosystem be returned to pre-spill
conditions. NOAA regulations (15 C.F.R. §990.30) state that recovery “means the return of
injured natural resources and services to baseline”—in other words, a return to conditions as they
would have been had the spill not occurred. Baseline conditions may not equate with pre-spill
conditions. Multiple variables affect local species and ecosystem services. For example, one
species at a spill site could have been on the decline at the time of an incident, because of
changing water temperatures. These types of trends are considered during the restoration
evaluative process (discussed below). Restoration leaves room for site-specific interpretation,
which, in the case of the Exxon Valdez spill and cleanup, continues to generate considerable
argument.
Economic Costs of Oil Spills
The economic costs that can result from an oil spill can be broken into three categories: cleanup
expenses, natural resource damages, and the various economic losses incurred by the affected
community or individuals.
Cleanup Costs
The cleanup costs of an oil spill can vary greatly and are influenced by a mix of factors: location
characteristics, oil type, and oil volume.
Location
Location is generally considered the most important factor because it involves multiple variables.
Areas with less water movement, such as marshlands, will generally cost more to clean up than
open water. Some spill locations may have relatively robust populations of indigenous micro-
organisms that help degrade the oil naturally.23
Tourist destinations or sensitive habitats, such as coral reefs, will likely require more stringent
cleanup standards, thus increasing the costs. The political and social culture at the spill site plays
a part as well. A spill in a high-profile area may receive special attention.24 Major oil spills,
especially ones that affect shoreline ecosystems, are often met with extensive media coverage,
placing pressure on parties to take action. Coupled with this pressure, authorities (federal, state, or
local) at these locations may require extensive oil spill response requirements, which can
23 See, for example, Terry Hazen et al., “Deep-Sea Plume Enriches Indigenous Oil-Degrading Bacteria,” Science
(Online), August 24, 2010; Richard Camilli et al., “Tracking Hydrocarbon Plume Transport and Biodegradation at
Deepwater Horizon,” Science (Online), August 19, 2010. 24 For example, the November 7, 2007, spill (53,000 gallons) from a container ship into the San Francisco Bay
generated considerable interest.

Oil Spills: Background and Governance
Congressional Research Service 10
influence cleanup cost. For instance, spill costs in the United States are considerably higher than
in other parts of the world.25
Oil Type
The more persistent and viscous oil types, such as heavy crude oil (e.g., crude oil derived from oil
sands) and intermediates known as bunker fuels, are more expensive to clean up. Gasoline and
other lighter refined products may require only minimal cleanup action. Generally, these materials
will evaporate or disperse relatively quickly, leaving only a small volume of petroleum product in
the environment.
Oil Volume
Compared with other factors, spill volume is less important. A major spill away from shore will
likely cost considerably less than a minor spill in a sensitive location. Certainly, the amount of oil
spilled affects cleanup costs, because, all things being equal, a larger spill will require a larger and
more expensive cleanup effort. However, the relationship between cleanup costs and spill volume
is not linear. Cleaning up a smaller spill is likely to cost more than a larger spill on a per-gallon
basis.26
Natural Resources Damages
This category of costs relates to the environmental impacts caused by an oil spill. Pursuant to
OPA, the party responsible for an oil spill is liable for any loss of natural resources (e.g., fish,
animals, plants, and their habitats) and the services provided by the resource (e.g., drinking water,
recreation).
When a spill occurs, natural resource trustees conduct a natural resource damage assessment to
determine the extent of the harm. Trustees may include officials from federal agencies designated
by the President, state agencies designated by the relevant governor, and representatives from
tribal and foreign governments.27 The various trustees assess damages to natural resources under
their respective jurisdictions.28 If multiple trustees are involved, they must select a lead
administrative trustee (LAT), who coordinates trustee activities and serves as a liaison between oil
spill responders. The LAT need not be from a federal agency; however, only a federal LAT can
submit a request to the Oil Spill Liability Trust Fund for the initial assessment funding.29
The Oil Pollution Act (OPA) of 1990 states that the measure of natural resource damages includes
25 The average cleanup cost is three times higher in the United States than in Europe (based on 1997 data and excluding
the Exxon Valdez costs). See Etkin, Dagmar, “Estimating Cleanup Costs for Oil Spills,” paper presented at the 1999
International Oil Spill Conference, 1999, citing data from the Oil Spill Intelligence Report International Oil Spill
Database. 26 This is primarily due to the fact that a spill of any size (e.g., in a sensitive area) will require that equipment and
response experts be sent to the scene. See Etkin, Dagmar, “Estimating Cleanup Costs for Oil Spills,” paper presented at
the 1999 International Oil Spill Conference, 1999, p. 5. 27 For more information, see NOAA’s Damage Assessment, Remediation, and Restoration Program at
http://www.darrp.noaa.gov/about/index.html. 28 33 U.S.C. §2706(c). In some cases, trustees may share responsibility over the same resource. See, for example,
Department of the Interior’s “Pollution Response and Natural Resource Trusteeship Training Module On NRDA,” at
http://www.doi.gov/oepc/response/a01.htm. 29 33 U.S.C. §2712 and Executive Order (EO) 12777 (October 18, 1991).

Oil Spills: Background and Governance
Congressional Research Service 11
the cost of restoring, rehabilitating, replacing, or acquiring the equivalent of the
damaged natural resources;
the diminution in value of those natural resources pending restoration; and
the reasonable cost of assessing those damages.30
Pursuant to OPA, NOAA developed regulations pertaining to natural resource damage
assessments in 1996.31 Natural resource damages may include both losses of direct use and
passive uses. Direct use value may derive from recreational (e.g., boating), commercial (e.g.,
fishing), or cultural or historical uses of the resource. In contrast, a passive-use value may derive
from preserving the resource for its own sake or for enjoyment by future generations.32
The damages are compensatory, not punitive. Collected damages cannot be placed into the
general Treasury revenues of the federal or state government, but must be used to restore or
replace lost resources.33 NOAA’s regulations focus on the costs of primary restoration—returning
the resource to its baseline condition—and compensatory restoration—addressing interim losses
of resources and their services.34
Other Economic Costs
Oil spills can generate costs other than response expenses or damages to natural resources. An oil
spill can disrupt business activity near the spill, particularly businesses and individuals that count
on the resources and reputation of the local environment. For example, the local fishing and
tourist industry may be affected. In some cases, a well-publicized oil spill can weaken local or
regional industries near the spill site, regardless of the actual threat to human health created by
the spill.
Local infrastructure and services can be disrupted by an oil spill. Port and harbor operations may
be interrupted, altering the flow of trade goods. Power plants that use cooling water systems may
need to temporarily cease operations. For example, the Salem Nuclear Plant—the second-largest
nuclear plant in the United States—was forced to halt activity due to a substantial oil spill (more
than 250,000 gallons) in the Delaware River in November 2004.
Oil Spill Governance When the Exxon Valdez ran aground in March 1989, there were multiple federal statutes, state
statutes, and international conventions that dealt with oil discharges. The spill highlighted the
inadequacies of the existing coverage and generated public outrage.35 Following the spill,
Members of Congress faced great pressure to address these issues. (See the Appendix for further
30 33 U.S.C. §2706(d). 31 61 Federal Register 440 (January 5, 1996). See also NOAA, Injury Assessment Guidance Document for Natural
Resource Damage Assessment Under the Oil Pollution Act of 1990 (1996). 32 See 15 C.F.R. §990.30, definition of “value.” 33 33 U.S.C. §2706(f); William D. Brighton, Natural Resource Damages under the Comprehensive Environmental
Response, Compensation, and Liability Act (2006), U.S. Department of Justice, Environment and Natural Resources
Division. 34 William D. Brighton, Natural Resource Damages under the Comprehensive Environmental Response,
Compensation, and Liability Act (2006), U.S. Department of Justice, Environment and Natural Resources Division. 35 A handful of other oil spills followed the Exxon Valdez in 1989 and 1990 (e.g., the Mega Borg spilled 5 million
gallons of oil in the Gulf of Mexico), further spurring congressional action.

Oil Spills: Background and Governance
Congressional Research Service 12
information concerning these issues.) The end result was the Oil Pollution Act of 1990 (OPA)36—
the first comprehensive law to specifically address oil pollution to waterways and coastlines of
the United States.
The governing framework for oil spills in the United States remains a combination of federal,
state, and international authorities. Within this framework, several federal agencies have the
authority to implement oil spill regulations. The framework and primary federal funding process
used to respond to oil spills are described below.
Oil Pollution Act of 1990
With the enactment of OPA on August 18, 1990, Congress consolidated the existing federal oil
spill laws under one program (Appendix). The 1990 law expanded the existing liability
provisions within the Clean Water Act (CWA)37 and created new free-standing requirements
regarding oil spill prevention and response. Key OPA provisions are discussed below.
Spill Response Authority
When responding to a spill, many considered the lines of responsibility under the pre-OPA regime
to be unclear,38 with too much reliance on spillers to perform proper cleanup.39 OPA strengthened
and clarified the federal government’s role in oil spill response and cleanup. OPA Section 4201
amended Section 311(c) of the CWA to provide the President (delegated to the U.S. Coast Guard
or EPA) with authority to perform cleanup immediately using federal resources,40 monitor the
response efforts of the spiller, or direct the spiller’s cleanup activities. The revised response
authorities addressed concerns “that precious time would be lost while waiting for the spiller to
marshall its cleanup forces.”41
The federal government—specifically the On-Scene Coordinator (OSC) for spills in the Coast
Guard’s jurisdiction—determines the level of cleanup required. Although the federal government
must consult with designated trustees of natural resources and the governor of the state affected
by the spill, the decision that cleanup is completed and can be ended rests with the federal
government. States may require further work, but without the support of federal funding.42
National Contingency Plan
The first National Oil and Hazardous Substances Pollution Contingency Plan (NCP) was
administratively prepared in 1968 after observing the British government’s response to a 37-
36 P.L. 101-380, primarily codified at U.S.C. §2701 et seq. 37 The official statutory name is the Federal Water Pollution Control Act, P.L. 92-500, as amended, codified at 33
U.S.C. §1251 et seq. 38 See, for example, Wilkinson, Cynthia et al., “Slick Work: An Analysis of the Oil Pollution Act of 1990,” Journal of
Energy, Natural Resources, and Environmental Law, 12 (1992), p. 190. 39 See Grumbles, Benjamin, and Manley, Joan, “The Oil Pollution Act of 1990: Legislation in the Wake of a Crisis,”
Natural Resources and Environment, 10:2 (1995), p. 38. 40 Leading up to the passage of OPA, parties referred to this approach as “federalizing” the spill. 41 U.S. Congress, House Committee on Merchant Marine and Fisheries, Report accompanying H.R. 1465, Oil Pollution
Prevention, Removal, Liability, and Compensation Act of 1989, 1989, H.Rept. 101-242, Part 2, 101st Cong., 1st sess., p.
84. 42 OPA §1011.

Oil Spills: Background and Governance
Congressional Research Service 13
million-gallon oil tanker spill (Torrey Canyon) off the coast of England.43 The NCP contains the
federal government’s procedures for responding to oil spills and hazardous substance releases.44
OPA expanded the role and breadth of the NCP. The 1990 law established a multi-layered
planning and response system to improve preparedness and response to spills in marine
environments.45 Among other things, the act also required the President to establish procedures
and standards (as part of the NCP) for responding to worst-case oil spill scenarios.46
For further details on the NCP, see CRS Report R43251, Oil and Chemical Spills: Federal
Emergency Response Framework, by David M. Bearden and Jonathan L. Ramseur.
Tank Vessel and Facility Response Plans
As a component of the enhanced NCP, OPA amended the CWA to require that U.S. tank vessels,
offshore facilities, and certain onshore facilities47 prepare and submit oil spill response plans to
the relevant federal agency. In general, vessels and facilities are prohibited from handling,
storing, or transporting oil if they do not have a plan approved by (or submitted to) the
appropriate agency (discussed below).48
The plans should, among other things, identify how the owner or operator of a vessel or facility
would respond to a worst-case scenario spill. Congress did not intend for every vessel to have
onboard all the personnel and equipment needed to respond to a worst-case spill, but vessels must
have a plan and procedures to call upon—typically through a contractual relationship—the
necessary equipment and personnel for responding to a worst-case spill.49
In 2004, Congress enacted an amendment requiring non-tank vessels (i.e., ships carrying oil for
their own fuel use) over 400 gross tons to prepare and submit a vessel response plan.50 Congress
reasoned that many non-tank vessels have as much oil onboard as small tank vessels, thus
presenting a comparable risk from an oil spill. Moreover, the international standards for oil spill
prevention51 apply to tanker and non-tanker vessels alike. Thus, the 2004 amendment brought the
U.S. law more in line with international provisions.
Double-Hull Design for Vessels
The issue of double hulls received considerable debate for many years prior to OPA, and it was
one of the stumbling blocks for unified oil spill legislation. Proponents maintained that double-
43 See EPA “National Contingency Plan Overview” at http://www.epa.gov/emergencies/content/lawsregs/ncpover.htm. 44 The NCP is codified at 40 C.F.R. Part 300. 45 OPA §4202, amending §311(j) of the CWA. 46 OPA §4201(b), amending §311(d)(2)(J) of the CWA. 47 The response plan requirement is applicable only to an onshore facility that, because of its location, could reasonably
be expected to cause substantial harm to the environment by discharging into navigable waters, adjoining shorelines, or
the exclusive economic zone. CWA §311(j)(5)(iii). 48 OPA §4202, amending §311(j)(5)(E) of the CWA. 49 U.S. Congress, House Committee on Merchant Marine and Fisheries, Report accompanying H.R. 1465, Oil Pollution
Prevention, Removal, Liability, and Compensation Act of 1989, 1989, H.Rept. 101-242, Part 2, 101st Cong., 1st sess., p.
87. OPA §4202, amending §311(j)(5)(C)(iii) of the CWA. 50 Amendments Relating to the Oil Pollution Act of 1990, Title VII of Coast Guard and Maritime Transportation Act of
2004 (P.L. 108-293), codified at 33 U.S.C. §1321. 51 Primarily the shipboard oil pollution emergency plans required by MARPOL 73/78, discussed later in this report.
Oil Spills: Background and Governance
Congressional Research Service 14
hull construction provides extra protection if a vessel becomes damaged.52 However, opponents
argued that a double-hulled vessel might cause stability problems if an accident occurred, thus
negating the benefits.53 Stakeholders also highlighted the impacts that a double-hull requirement
would entail for the shipping industry (e.g., cost and time of retrofitting, ship availability).54 The
OPA requirements for double hulls reflected some of these concerns.
The act required new vessels carrying oil and operating in U.S. waters to have double hulls.55
However, OPA provided certain exceptions, depending on the size of the vessel (e.g., less than
5,000 gross tons)56 and its particular use (e.g., lightering).57 For older vessels, OPA established a
staggered retrofitting schedule, based on vessel age and size. As of January 2010, single-hull
vessels (with several exceptions, some of which expired in 2015) cannot operate in U.S. waters.
Liability Issues58
OPA unified the liability provisions of existing oil spill statutes, creating a freestanding liability
regime. Section 1002 states that responsible parties are liable for any discharge of oil (or threat of
discharge) from a vessel or facility59 to navigable waters, adjoining shorelines, or the exclusive
economic zone60 of the United States (i.e., 200 nautical miles beyond the shore).
Regarding the oil spill statutes prior to OPA, Congress recognized that “there is no
comprehensive legislation in place that promptly and adequately compensates those who suffer
other types of economic loss as a result of an oil pollution incident.”61 OPA broadened the scope
of damages (i.e., costs) for which an oil spiller would be liable. Under OPA, a responsible party is
liable for all cleanup costs incurred, not only by a government entity, but also by a private party.62
In addition to cleanup costs, OPA significantly increased the range of liable damages to include
the following:
injury to natural resources,
52 A study from the National Academy of Sciences reached this conclusion in 1999. See National Research Council,
Double hull Tanker Legislation: An Assessment of the Oil Pollution Act of 1990, National Academies of Science, 1999,
p. 144. 53 Opponents maintained that if water entered the space between hulls, the ship could become unstable, hindering
salvage and possibly capsizing. Cynthia Wilkinson et al., “Slick Work: An Analysis of the Oil Pollution Act of 1990,”
Journal of Energy, Natural Resources, and Environmental Law, 12 (1992), p. 196. 54 U.S. Congress, Conference Report accompanying H.R. 1465, Oil Pollution Act of 1990, H. Conf. Rept. 101-653, at
140-141 (1990). 55 OPA §4115, amending 46 U.S.C. §3703. 56 This exception applied to many inland barges. 57 Lightering is the process of transferring oil from a large vessel to a smaller vessel. This common practice occurs in
designated areas that are typically many miles away from shore. 58 For a discussion of liability issues raised by the 2010 Deepwater Horizon oil spill, see CRS Report R41679, Liability
and Compensation Issues Raised by the 2010 Gulf Oil Spill, by Jonathan L. Ramseur. 59 The definition of “facility” is broadly worded and includes pipelines and motor vehicles. OPA §1001. 60 Under the pre-OPA regime (primarily the CWA), a discharge 12 miles beyond shore had to affect the natural
resources before liability attached. Under OPA §1002, the discharge itself triggers liability. Cynthia Wilkinson et al.,
“Slick Work: An Analysis of the Oil Pollution Act of 1990,” Journal of Energy, Natural Resources, and Environmental
Law, 12 (1992), p. 201. 61 U.S. Congress, House Committee on Merchant Marine and Fisheries, Report accompanying H.R. 1465, Oil Pollution
Prevention, Removal, Liability, and Compensation Act of 1989, 1989, H.Rept. 101-242, Part 2, 101st Cong., 1st sess., p.
31. 62 OPA §1002(b)(1).

Oil Spills: Background and Governance
Congressional Research Service 15
loss of personal property (and resultant economic losses),
loss of subsistence use of natural resources,
lost revenues resulting from destruction of property or natural resource injury,
lost profits and earning capacity resulting from property injury or natural
resource injury, and
costs of providing extra public services during or after spill response.63
OPA provided limited defenses from liability: act of God, act of war, and act or omission of
certain third parties. These defenses are similar to those of the Superfund statute,64 established in
1980 for releases of hazardous substances (which does not include oil).
Except for certain behavior, including acts of gross negligence or willful misconduct,65 OPA set
liability limits (or caps) for cleanup costs and other damages. OPA requires the President to issue
regulations to adjust the liability limits at least every three years to take into account impacts of
inflation over time.66 The statute directs the President to use the consumer price index (CPI) to
account for these impacts. Administrations subsequent to the enactment of OPA in 1990 did not
adjust the liability limits until Congress amended OPA in 2006: The Coast Guard and Maritime
Transportation Act of 2006 adjusted the liability limits for vessels in statute.67 Subsequent limits
were adjusted through agency rulemakings.
For purposes of liability limits, OPA divides potential sources of oil spills into four general
categories. The liability limits differ by category, and in some cases, the scope of liability varies.
The categories and their scopes of liability are:
Tank vessels: Liability limit includes both removal costs and natural resource and
economic damages. The limit is based on vessel size measured in gross tonnage.
All other vessels: Liability limit includes both removal costs and natural resource
and economic damages. The limit is based on vessel size measured in gross
tonnage. The limits are lower than those for tank vessels.
Offshore facilities (not including deepwater ports): Liability limit applies only to
damages (natural resource and economic damages). Liability for removal costs is
not limited.
Onshore facilities and deepwater ports: Liability limit includes both removal
costs and natural resource and economic damages.
Table 1 identifies the liability limit for each of the oil spill source categories listed above as
enacted in OPA. The table includes adjustments made in the Coast Guard and Maritime
Transportation Act of 2006, which modified only the limits for vessels, and subsequent
adjustments made through agency regulations.
63 OPA §1002(b)(2). 64 Section 107(b) of the Comprehensive Environmental Response, Compensation, and Liability Act (CERCLA,
commonly known as Superfund), P.L. 96-510. 65 In addition, liability limits are unavailable if the violation of a federal safety, construction, or operating requirement
proximately caused the spill. Spillers must also report the incident and cooperate with response officials to take
advantage of the liability caps. OPA §1004(c). 66 OPA §1004(d)(4). 67 P.L. 109-241.

Oil Spills: Background and Governance
Congressional Research Service 16
Table 1. Oil Spill Liability Limits by Source of Potential Spill
Oil Pollution Act of 1990 Coast Guard and Maritime
Transportation Act of 2006 Current Limits
Tank Vessels
and Barges
For vessels greater than 3,000
gross tons:
-the greater of $1,200 per
gross ton or $10 million
For vessels less than or equal
to 3,000 gross tons:
-the greater of $1,200 per
gross ton or $2 million
Single-hulls (including a single-
hull vessel fitted with double
sides only or double bottom
only)
For vessels greater than 3,000
gross tons:
-the greater of $3,000 per
gross ton or $22 million
For vessels less than or equal
to 3,000 gross tons:
-the greater of $3,000 per
gross ton or $6 million
Double-hulls
For vessels greater than 3,000
gross tons:
-the greater of $1,900 per
gross ton or $16 million
For vessels less than or equal
to 3,000 gross tons:
-the greater of $1,900 per
gross ton or $4 million
Single-hulls (including a
single-hull vessel fitted with
double sides only or double
bottom only)
For vessels greater than
3,000 gross tons:
-the greater of $3,500 per
gross ton or $25.8 million
For vessels less than or equal
to 3,000 gross tons:
- the greater of $3,500 per
gross ton or $7 million
Double-hulls
For vessels greater than
3,000 gross tons:
-the greater of $2,200 per
gross ton or $18.8 million
For vessels less than or equal
to 3,000 gross tons:
-the greater of $2,200 per
gross ton or $4.7 milliona
Non-Tank
Vessels
The greater of $600 per gross
ton or $500,000
The greater of $950 per gross
ton or $800,000
The greater of $1,100 per
gross ton or $939,800b
Offshore
Facilities
$75 million
In contrast to other sources,
this limit applies only to the
sum of natural resource
damages and covered economic
damages; removal costs are not
limited.
No change; same as OPA $134 millionc
In contrast to other sources,
this limit applies only to the
sum of natural resource
damages and covered
economic damages; removal
costs are not limited.
Onshore
Facilities
(includes
pipelines and
railroads)
$350 million
The President may decrease
limit through regulations, but
this authority has not been
exercised.
No change; same as OPA $634 milliond
Deepwater
Ports: Louisiana
Offshore Oil
Port (LOOP)e
$350 million
The Secretary (of the
department in which the Coast
Guard operates) may adjust
this limit to not less than $50
million.f
In 1995, the Department of
Transportation set the liability
limit for the LOOP at $62
million.g
No change; same as 1995
regulatory change
$96.4 million for the LOOPh
Source: Prepared by CRS.
a. The Coast Guard made regulatory adjustments to the liability limits pursuant to the consumer price index
provision (OPA Section 1004) in 2009 and 2015. See (1) and U.S. Coast Guard, “Consumer Price Index
Adjustments of Oil Pollution Act of 1990 Limits of Liability—Vessels and Deepwater Ports,” 74 Federal

Oil Spills: Background and Governance
Congressional Research Service 17
Register 31357, July 1, 2009; and (2) U.S. Coast Guard, “Consumer Price Index Adjustments of Oil Pollution
Act of 1990 Limits of Liability—Vessels, Deepwater Ports and Onshore Facilities,” 80 Federal Register 72342,
November 19, 2015. The limits are codified in 33 C.F.R. §138.230.
b. The Coast Guard made regulatory adjustments to the liability limits pursuant to the consumer price index
provision (OPA Section 1004) in 2009 and 2015. See (1) and U.S. Coast Guard, “Consumer Price Index
Adjustments of Oil Pollution Act of 1990 Limits of Liability—Vessels and Deepwater Ports,” 74 Federal
Register 31357, July 1, 2009; and (2) U.S. Coast Guard, “Consumer Price Index Adjustments of Oil Pollution
Act of 1990 Limits of Liability—Vessels, Deepwater Ports and Onshore Facilities,” 80 Federal Register 72342,
November 19, 2015. The limits are codified in 33 C.F.R. §138.230.
c. The Bureau of Ocean Energy Management made regulatory adjustments to the liability limits pursuant to
the consumer price index provision (OPA Section 1004) in 2014. See Bureau of Ocean Energy Management,
“Consumer Price Index Adjustments of 1990 Limit of Liability for Offshore Facilities,” 79 Federal Register
73832, December 12, 2014.
d. The Coast Guard made regulatory adjustments to the liability limits pursuant to the consumer price index
provision (OPA Section 1004) in 2015. U.S. Coast Guard, “Consumer Price Index Adjustments of Oil
Pollution Act of 1990 Limits of Liability—Vessels, Deepwater Ports and Onshore Facilities,” 80 Federal
Register 72342, November 19, 2015. The limits are codified in 33 C.F.R. §138.230.
e. LOOP is the only deepwater port for oil in U.S. coastal waters. Three other deepwater ports are in
operation that accept liquefied natural gas. See U.S. Department of Transportation, Maritime
Administration, “Approved Applications and Operational Facilities,” https://www.marad.dot.gov/ports/office-
of-deepwater-ports-and-offshore-activities/approved-applications-and-operational-facilities/.
f. The Homeland Security Act of 2002 (P.L. 107-296) transferred the Coast Guard from the Department of
Transportation to the Department of Homeland Security.
g. Department of Transportation, “Limit of Liability for Deepwater Ports,” 60 Federal Register 39849, August 4,
1995.
h. The Coast Guard made regulatory adjustments to the liability limits pursuant to the consumer price index
provision (OPA Section 1004) in 2009 and 2015. See (1) and U.S. Coast Guard, “Consumer Price Index
Adjustments of Oil Pollution Act of 1990 Limits of Liability—Vessels and Deepwater Ports,” 74 Federal
Register 31357, July 1, 2009; and (2) U.S. Coast Guard, “Consumer Price Index Adjustments of Oil Pollution
Act of 1990 Limits of Liability—Vessels, Deepwater Ports and Onshore Facilities,” 80 Federal Register 72342,
November 19, 2015. The limits are codified in 33 C.F.R. §138.230. This rulemaking adjusted the limit for
deepwater ports, other than LOOP, to $634 million. As noted above, LOOP is the only deepwater port
that accepts shipments of oil.
The Oil Spill Liability Trust Fund
Prior to OPA, federal funding for oil spill response was generally considered inadequate,68 and
damages recovery was difficult for private parties.69 To help address these issues, Congress
supplemented OPA’s expanded range of covered damages with the Oil Spill Liability Trust Fund
(OSLTF).
Pursuant to Executive Order (EO) 12777, the Coast Guard created the National Pollution Funds
Center (NPFC) to manage the trust fund in 1991. The fund may be used for several purposes:
prompt payment of costs for responding to and removing oil spills;
payment of the costs incurred by the federal and state trustees of natural
resources for assessing the injuries to natural resources caused by an oil spill, and
68 Wilkinson, Cynthia et al., “Slick Work: An Analysis of the Oil Pollution Act of 1990,” Journal of Energy, Natural
Resources, and Environmental Law, 12 (1992), p. 188. 69 U.S. Congress, House Committee on Merchant Marine and Fisheries, Report accompanying H.R. 1465, Oil Pollution
Prevention, Removal, Liability, and Compensation Act of 1989, 1989, H.Rept. 101-242, Part 2, 101st Cong., 1st sess., p.
35.

Oil Spills: Background and Governance
Congressional Research Service 18
developing and implementing the plans to restore or replace the injured natural
resources;
payment of parties’ claims for uncompensated removal costs, and for
uncompensated damages (e.g., financial losses of fishermen, hotels, and
beachfront businesses);
payment for the net loss of government revenue, and for increased public
services by a state or its political subdivisions; and
payment of federal administrative and operational costs, including research and
development, and $25 million per year for the Coast Guard’s operating expenses.
Although Congress created the OSLTF in 1986,70 Congress did not authorize its use or provide its
funding until after the Exxon Valdez incident. In 1990, OPA provided the statutory authorization
necessary to put the fund in motion. Through OPA, Congress transferred balances from other
federal liability funds71 into the OSLTF. In complementary legislation, Congress imposed a 5-
cent-per-barrel tax on the oil industry to support the fund.72 Collection of this fee ceased on
December 31, 1994, due to a sunset provision in the law. However, in April 2006, the tax resumed
as required by the Energy Policy Act of 2005 (P.L. 109-58). In addition, the Emergency Economic
Stabilization Act of 2008 (P.L. 110-343) increased the tax rate to 8 cents through 2016. In 2017,
the rate increased to 9 cents. The tax is scheduled to terminate at the end of 2017.73
Figure 6 illustrates the receipts, expenditures, and end-of-year balances for the OSLTF. At the
end of FY2017, the projected balance is $5.4 billion.
70 Omnibus Budget Reconciliation Act of 1986 (P.L. 99-509). 71 The CWA §311(k) revolving fund; the Deepwater Port Liability Fund; the Trans-Alaska Pipeline Liability Fund; and
the Offshore Oil Pollution Compensation Fund. 72 Omnibus Budget Reconciliation Act of 1989 (P.L. 101-239). Other revenue sources for the fund include interest on
the fund, cost recovery from the parties responsible for the spills, and any fines or civil penalties collected. 73 Section 405 of P.L. 110-343.

Oil Spills: Background and Governance
Congressional Research Service 19
Figure 6. Oil Spill Liability Trust Fund
Receipts, Expenditures, and End-of-Year Balances
Source: Prepared by CRS; data from annual Office of Management and Budget, Budget of the United States
Government, Appendices.
Notes: The initial gap between the end-of-year balance (line) and the receipts-expenditures columns is due to
the FY1991 starting balance of $358 million. The relative increases in “other receipts” in 1995 and 2000 are due
to transfers from the Trans-Alaska pipeline fund of $119 million and $182 million, respectively. The increases in
expenditures and “other receipts” between 2010 and 2013 are related to the 2010 Deepwater Horizon oil spill.
Financial Responsibility
To preserve the trust fund and ensure that responsible parties can be held accountable for oil spill
cleanup and damages, OPA requires that vessels and offshore facilities maintain evidence of
financial responsibility (e.g., insurance). The Coast Guard’s National Pollution Funds Center
(NPFC) implements the financial responsibility provisions for vessels; the Bureau of Ocean
Energy Management implements this requirement for offshore facilities.
The current levels of financial responsibility are related to the current liability limits for various
sources (e.g., vessels, offshore facilities) of potential oil spills. The liability limits differ by
potential source. In the case of vessels, whose liability limits are a single dollar amount
encompassing both removal costs and other damages, the financial responsibility levels are
directly tied to the corresponding liability caps. Current law requires responsible parties for
vessels to demonstrate the “maximum amount of liability to which the responsible party could be
subjected under [the liability limits in OPA Section 1004; 33 U.S.C. 2704].”
Because the structure of offshore facility liability limit is different than vessels, the corresponding
financial responsibility limit provisions differ. Responsible parties for offshore facilities in federal

Oil Spills: Background and Governance
Congressional Research Service 20
waters must demonstrate $35 million financial responsibility, unless the President determines a
greater amount (not to exceed $150 million) is justified (33 U.S.C. 2716(c)). The federal
regulations that are authored by this statutory provision (30 C.F.R. Part 254) base the financial
responsibility amount—between $35 million and $150 million—on a facility’s worst-case
discharge volume (as defined in 30 C.F.R. §253.14). For example, a facility with a worst-case
discharge volume over 105,000 barrels74—the highest level of worst-case discharge listed in the
regulations—must maintain $150 million in financial responsibility.
Other Federal Laws
Although OPA is the primary domestic legislation for oil spills, other federal laws contain
provisions that relate to oil spills. Many of these provisions were in place before OPA. The
following list is not all-inclusive, but it highlights the main requirements authorized by laws other
than OPA.
Clean Water Act
The Clean Water Act (CWA) was the primary federal statute governing oil spills prior to OPA and
many provisions continue to apply. A key provision is found in Section 311(b)(3), which prohibits
the discharge of oil or hazardous substances into U.S. navigable waters. In addition, the CWA
contains various penalty provisions for noncompliance, including violations of the discharge
prohibition of Section 311(b).
Pursuant to statutory requirements in the CWA,75 the EPA crafted regulations76 for spill
prevention control and countermeasure (SPCC) plans in 1973. SPCC plans address the
“procedures, methods, and equipment and other requirements for equipment to prevent
discharges.”77 The EPA’s SPCC plans apply only to non-transportation, onshore facilities that
exceed a certain oil storage capacity and that, in the event of a spill, can be reasonably expected,
because of their location, to produce an oil discharge that would reach navigable waters or
adjoining shorelines of the United States.78 Unlike other oil spill preparedness provisions, SPCC
plans focus more on prevention than on response activities, requiring, for example, secondary
containment (e.g., dikes, berms) for oil-storage equipment.
The agency offered several regulatory amendments after the 1973 rulemaking. Following the
passage of the Oil Pollution Act of 1990 (OPA),79 the agency proposed substantial changes and
clarifications that were not made final until July 2002. For reasons beyond the scope of this
report, EPA extended the 2002 rule’s compliance date on multiple occasions and made further
amendments to the 2002 rule. For most types of facilities subject to SPCC requirements, the
74 This amount is significantly less than the 4.9 million barrels estimated to have been released during the 2010 Gulf
spill. See National Incident Command’s Flow Rate Technical Group, press release, August 2, 2010. 75 Section 311(j)(1) of the 1972 CWA called for regulations to prevent the discharge of oil from vessels, onshore
facilities, and offshore facilities. Executive Order 11735 (August 3, 1973) granted EPA the authority to regulate non-
transportation-related onshore and offshore facilities. 76 U.S. EPA, “Oil Pollution Prevention: Non-Transportation Related Onshore and Offshore Facilities,” Federal
Register, vol. 38, no. 237 (December 11, 1973), pp. 34164-34170. 77 CWA §311(j)(1)(C). 78 See 40 C.F.R. §112.1. 79 P.L. 101-380, primarily codified at U.S.C. §2701 et seq.
Oil Spills: Background and Governance
Congressional Research Service 21
deadline for complying with the changes made in 2002 was November 10, 2011.80 However, a
subsequent EPA rulemaking extended this compliance date for farms to May 10, 2013.81
Notwithstanding these recent deadlines, the 2002 final rule and subsequent revisions did not alter
the requirement for owners or operators of facilities, including farms, to maintain and continue
implementing their SPCC plans in accordance with the SPCC regulations that have been in effect
since 1974.82
Outer Continental Shelf Lands Act
The primary federal law governing oil development and operations in waters in federal
jurisdiction is the Outer Continental Shelf Lands Act (OCSLA) of 1953 and its subsequent
amendments (43 U.S.C. §§1331-1356). The OCSLA provided the foundation for regulations (30
C.F.R. Parts 250 and 550) that are implemented by the Bureau of Ocean Energy Management
(BOEM) and the Bureau of Safety and Environmental Enforcement (BSEE).83 Sections of these
regulations address oil spill prevention and response issues by requiring that various equipment
and procedures be in place at offshore facilities.84
Pipeline Statutes
The U.S. pipeline network is extensive: The Pipeline and Hazardous Materials Safety
Administration estimates that there are more than 160,000 miles of hazardous liquid pipelines in
the United States.85 Moreover, U.S. inland pipelines are concentrated in coastal areas, particularly
in the Gulf states, and these pipelines may have an impact on coastal waters if spills reach
waterways that empty into coastal waters.
Several laws govern oil pipelines. The Hazardous Liquid Pipeline Act of 1979 (P.L. 96-129)
granted authority to the Department of Transportation (DOT) to regulate various issues regarding
oil spills from pipelines. On December 29, 2006, the President signed the Pipeline Safety
Improvement Act of 2006 (P.L. 109-468) to improve pipeline safety and security practices, and to
reauthorize the federal Office of Pipeline Safety.86 The Office of Pipeline Safety (OPS), which is
part of the DOT, implements provisions concerning pipeline design, construction, operation and
maintenance, and spill response planning.87
80 EPA, “Oil Pollution Prevention; Spill Prevention, Control, and Countermeasure (SPCC) Rule-Compliance Date
Amendment,” 75 Federal Register 63903, October 14, 2010. 81 EPA, “Oil Pollution Prevention; Spill Prevention, Control, and Countermeasure (SPCC) Rule-Compliance Date
Amendment for Farms,” 76 Federal Register 72120, November 22, 2011. 82 For further information on the SPCC regulations, see CRS Report R44536, Spill Prevention, Control, and
Countermeasure (SPCC) Regulations: Background and Issues for Congress, by Jonathan L. Ramseur. 83 These agencies replaced the former Minerals Management Service (MMS). On May 19, 2010, the Secretary of the
Department of the Interior (DOI) replaced the MMS with the Bureau of Ocean Energy Management, Regulation, and
Enforcement (BOEMRE). On October 1, 2011, DOI divided BOEMRE into three separate entities: the Bureau of
Ocean Energy Management (BOEM), the Bureau of Safety and Environmental Enforcement (BSEE), and the Office of
Natural Resources Revenue (ONRR). 84 For more information, see CRS Report RL33404, Offshore Oil and Gas Development: Legal Framework, by Adam
Vann. 85 See “General Pipeline FAQs,” at http://www.phmsa.dot.gov (accessed September 2017). 86 See 49 U.S.C. §60101 et seq. 87 For further information on pipeline legislation, see CRS Report R41536, Keeping America’s Pipelines Safe and
Secure: Key Issues for Congress, by Paul W. Parfomak.
Oil Spills: Background and Governance
Congressional Research Service 22
Vessel Statutes
Several federal laws directly or indirectly deal with oil pollution from vessels.88 Laws concerning
navigation reduce the possibilities of vessel collision or hull breach by objects in the waterways.89
Other laws call for particular vessel design standards. For example, the Ports and Waterways
Safety Act of 1972,90 amended by the Port and Tanker Safety Act of 1978,91 called for specific
construction and equipment design requirements for oil tankers. (As noted, OPA subsequently
amended this statute in 1990 to establish a phased-in schedule for double-hulled tankers.)
Congress enacted the 1970s legislation to coincide with international initiatives. In fact, many of
the federal laws concerning vessel standards and pollution control procedures were written to
implement international conventions. These are discussed below.
Federal Agencies’ Responsibilities
The United States shares jurisdiction over its coastal waters with the coastal states. The 1953
Submerged Lands Act (SLA) gave coastal states jurisdiction over the submerged lands, waters,
and natural resources (e.g., oil deposits) located, in most cases, within 3 nautical miles off the
coastline.92 The waters, seabed, and natural resources beyond the states’ waters are exclusively
federal, and extend to the edge of the exclusive economic zone (200 nautical miles from shore).
However, the federal government maintains the authority to regulate commerce, navigation,
national defense, power production, and international affairs within state waters.
The oil spill legal framework involves implementation by multiple federal agencies. Agency
responsibilities can be divided into two categories: (1) oil spill response and cleanup and (2) oil
spill prevention/preparedness.
Response
As mentioned above, the National Oil and Hazardous Substances Pollution Contingency Plan
(NCP) contains the federal government’s framework and operative requirements for responding
to an oil spill (and releases of hazardous substances). Although first developed through
administrative processes in 1968, subsequent laws have amended the NCP, including the Clean
Water Act in 1972; the Comprehensive Environmental Response, Compensation, and Liability
Act (CERCLA or Superfund) in 1980; and the Oil Pollution Act (OPA) in 1990. Oil spill response
actions required under the regulations of the NCP are binding and enforceable, per these
enforcement authorities.
The NCP establishes the National Response System (NRS), a multi-tiered and coordinated
national response strategy for addressing oil spills and releases of hazardous substances. The NCP
88 For a comprehensive list of federal maritime legislation see USCG, Marine Safety Manual, Vol. IX (undated),
Chapter 1, available at http://homeport.uscg.mil. 89 For example, the Rivers and Harbors Act of 1899, as amended (33 U.S.C. §401 et seq.), and the International
Regulations for Preventing Collisions at Sea, as amended (33 U.S.C. §1601 et seq.). 90 P.L. 92-340, 33 U.S.C. §1221 et seq. 91 P.L. 95-474, codified at 33 U.S.C. §§1221-1232 and 46 U.S.C. §§3701-3718. 92 Most state waters extend 3 nautical miles (1 nautical mile = 6,076 feet, or 1.15 miles) from shore. Louisiana waters
extend 3 imperial nautical miles (1 imperial nautical mile = 6,080 feet). Texas and Gulf Coast of Florida waters extend
3 marine leagues (equating to 9 nautical miles). See the MMS, OCS, website (“Definitions and Jurisdictions”) at
http://www.mms.gov/incidents/pollution.htm. See also CRS Report RL33404, Offshore Oil and Gas Development:
Legal Framework, by Adam Vann.

Oil Spills: Background and Governance
Congressional Research Service 23
provisions specific to oil spill response are codified in 40 C.F.R. Part 300, Subpart D. Key
components of the NRS include the following:
National Response Team (NRT): composed of representatives from the federal
departments and agencies assigned roles in responding to oil spills. The U.S.
Coast Guard chairs the NRT when a response is being mounted to a spill in a
coastal region.
Regional Response Teams (RRTs): composed of regional representatives of each
NRT member agency, state governments, and local governments. The Coast
Guard leads the relevant RRT during responses to oil spills in coastal waters.
Area Committees (ACs): composed of qualified personnel from federal, state,
and local agencies. The primary function of each AC is to prepare an Area
Contingency Plan (ACP) for its designated area.
On-Scene Coordinator (OSC): who directs the response efforts and coordinates
all other efforts at the scene.
Oil spill response authority is determined by the location of the spill: the Coast Guard has
response authority in the coastal zone, and the EPA covers the inland zone.93 The OSC has the
ultimate authority to ensure that an oil spill is effectively removed and actions are taken to
prevent further discharge from the source. The OSC is broadly empowered to direct and
coordinate all response and recovery activities of federal, state, local, and private entities
(including the responsible party), and will draw on resources available through the appropriate
ACPs and RRTs.
Although the OSC must consult with designated trustees of natural resources and the governor of
the state affected by the spill, the OSC has the authority and responsibility to determine when
removal (i.e., cleanup) is complete.
Other agencies, particularly those on the NRT and relevant RRT, may play a role in response
activities. As the chair of the NRT (and vice-chair during oil spills in the coastal zone), EPA may
provide response support. For example, during the Deepwater Horizon spill response, EPA
conducted air and water sampling and provided environmental monitoring support, particularly
regarding the use of dispersants.
In addition, NOAA provides scientific analysis and consultation during oil spill response
activities.94 Assistance can include oil spill tracking, cleanup alternatives, and knowledge of at-
risk natural resources. Moreover, NOAA experts begin to collect data to assess natural resource
damages during response operations.
Prevention and Preparedness
Regarding oil spill prevention and preparedness duties, jurisdiction is determined by the potential
sources (e.g., vessels, facilities, pipelines) of oil spills. A series of executive orders (EOs),
coupled with memoranda of understanding (MOU), have established the various agency
93 The terms inland zone and coastal zone are defined in the National Contingency Plan (40 C.F.R. §300.5). The coastal
zone covers all waters subject to the tide, the Great Lakes, and all seaward waters (extending 200 nautical miles beyond
shore). The inland zone covers all other U.S. waters. Spills in inland waters can potentially affect coastal waters and
ecosystems, particularly if the spill occurs in water systems near the coast. In fact, a fine line may separate specific
inland and coastal waters (e.g., consider the nexus between a bay and a river). 94 For more information see NOAA’s Office of Response and Restoration website, at
http://response.restoration.noaa.gov/index.php.

Oil Spills: Background and Governance
Congressional Research Service 24
responsibilities.95 Table 2 identifies the agencies responsible for implementing prevention and
preparedness regulations for the potential sources of oil spills.
Table 2. Federal Agency Jurisdiction for Oil Spill Prevention
and Preparedness Duties, by Source
Potential Source of Oil Spill Responsible Agency
Vessels Coast Guard
Onshore, non-transportation facilities Environmental Protection Agency
Onshore, transportation facilities Coast Guard and Department of Transportation
Deepwater portsa Coast Guard and Department of Transportation
Offshore facilities (oil/gas extraction) Bureau of Ocean Energy Management within the Department of
Interior
Offshore pipelines directly associated with oil extraction
activities (i.e., “production lines”)b
Bureau of Ocean Energy Management within the Department of
Interior
Offshore pipelines not directly associated with oil
extraction activities (i.e., “transmission lines”)
Office of Pipeline Safety within the Department of Transportation
Inland pipelines Office of Pipeline Safety within the Department of Transportation
a. There is only one deepwater port for oil in U.S. coastal waters: the Louisiana Offshore Oil Port (LOOP).
b. For further discussion on federal pipeline jurisdiction, see National Research Council, Improving the Safety of
Marine Pipelines, National Academy of Sciences, 1994, pp. 86-89.
Prevention responsibilities include, among other things, assessing whether facilities or vessels
have the necessary equipment in place. As discussed above, vessels may be required to have
double hulls; facilities may need secondary containment.
Preparedness duties involve oversight tasks, such as evaluating facility and vessel response plans.
Preparedness responsibilities also include developing and maintaining contingency plans at
various levels: area, regional, and national. Personnel training is a vital component of sustaining
readiness. NOAA oil spill experts help train responders in government service and private
business.
In addition, OPA requires agencies to conduct internal examinations to test preparedness.96 As
part of this requirement, the Coast Guard conducts Spills of National Significance (SONS)
exercises to analyze the Coast Guard’s ability to respond to a major oil spill.
International Conventions
The relationship between international and domestic law can be complex. For example, a “self-
executing” agreement taking the form of a treaty, signed by the Executive and ratified with the
advice and consent of the Senate, stands on equal footing with federal statute. On the other hand,
if an international agreement is not self-executing, implementing legislation may be necessary for
the agreement’s provisions to be given domestic legal effect, including to provide U.S. agencies
with the domestic legal authority necessary to carry out functions contemplated under the
95 Executive Order (EO) 12777 (October 18, 1991) delegates authorities pursuant to the Oil Pollution Act of 1990. This
order was amended by EO 13286 (March 5, 2003), which reorganized duties in response to the creation of the
Department of Homeland Security. 96 As required by OPA §4202(a), which amended CWA §311(j)(7), codified in 33 U.S.C. §1321(j)(7).

Oil Spills: Background and Governance
Congressional Research Service 25
agreement. Several federal laws governing oil spills were fashioned to implement obligations
contained in international agreements.97
International conventions have played an important role in developing consistent standards for
oil-carrying vessels from different nations. A primary player in this regard is the International
Maritime Organization (IMO), a body of the United Nations, which sets international maritime
vessel safety and marine pollution standards. The Coast Guard represents the United States at
IMO meetings.
Multiple international conventions concern vessels and their impact on the marine environment.
Described below are two selected conventions that contain provisions that are particularly
relevant to oil pollution in coastal waters.
MARPOL 73/78
The IMO implements the 1973 International Convention for the Prevention of Pollution from
Ships, as modified by the Protocol of 1978 (MARPOL 73/78).98 Vessels whose nations are
signatories to MARPOL are subject to its requirements, regardless of where they sail, and
member nations are responsible for the vessels registered under their flag.
MARPOL 73/78 includes six annexes, each covering a different pollution type. Annex I
(Prevention of Pollution by Oil) entered into force in 198399 and established requirements for
controlling oil discharges to sea. Annex I requires vessels to have equipment that minimizes oil
discharge, such as oil-water separators, and shipboard oil pollution emergency plans (SOPEPs).
Although the SOPEP applicability is similar to that of the vessel response plan (VRP) required by
OPA,100 the purpose of the SOPEP is somewhat different. A SOPEP is intended to provide
guidance to the vessel’s officers regarding proper onboard emergency procedures when an oil
spill occurs,101 whereas the VRP is more focused on responding to the spill itself.
The United States implements Annex I through the Act to Prevent Pollution from Ships
(APPS).102 APPS applies to all U.S.-flagged ships, irrespective of location, and to all foreign-
flagged vessels in U.S. waters or at ports under U.S. jurisdiction. The Coast Guard issues and
enforces regulations necessary to carry out the APPS provisions. The Coast Guard inspection
program is a key component of its oil spill prevention effort.
Intervention Convention
The 1967 Torrey Canyon spill off the coast of Great Britain was one of the first major spills to
receive worldwide attention.103 The incident raised many questions regarding oil spill response,
97 If a treaty is considered “self-executing,” domestic legislation implementing the treaty is not necessary. For more
details on these issues, see CRS Report RL32528, International Law and Agreements: Their Effect upon U.S. Law, by
Michael John Garcia. 98 For convention texts and other materials, see http://www.imo.org. 99 The phrase “entry into force” signifies that the requisite number of nations have ratified the convention or annex,
thus making the agreed upon requirements binding for all participating nations. For more discussion of the procedures
of international conventions, see the IMO website at http://www.imo.org. 100 All vessels of any type over 400 gross tons traveling over international waters must have a SOPEP approved by their
flag state. See USCG VRP/SOPEP “FAQs” at http://www.uscg.mil/vrp. 101 USCG, 1997, Marine Safety Manual, Marine Environment Protection, Volume IX, p. 4-24. 102 P.L. 96-478, 33 U.S.C. §1901 et seq. 103 The Torrey Canyon, a Liberian-flagged tanker, spilled approximately 35 million gallons of crude oil.

Oil Spills: Background and Governance
Congressional Research Service 26
particularly when dealing with vessels from other nations. For example, the incident prompted
debate over responses allowable if a nation’s waters and environment are threatened by a spill
from another nation’s vessel. The 1969 International Convention Relating to Intervention on the
High Seas in Cases of Oil Pollution Casualties (the Intervention Convention) sought to address
these issues.
To implement this convention in the United States, Congress passed the Intervention on the High
Seas Act of 1974.104 Under this act, if the Coast Guard determines there to be a “grave and
imminent danger to the coastline or related interests of the United States from pollution or threat
of pollution of the sea by convention oil [i.e., as defined in the convention],” the Coast Guard can
take action to “prevent, mitigate, or eliminate that danger.”
State Laws
As mentioned above, multiple states had oil spill liability laws before the passage of OPA in
1990. During the 15 years prior to OPA’s passage, the issue of whether or not to preempt state
liability laws was perhaps the primary obstacle to enacting unified oil spill legislation. Proponents
of preemption argued that differing state laws—particularly the various levels of liability—
frustrate the shipping industry and were contrary to the goal of comprehensive federal legislation.
Preemption opponents maintained that states should be allowed (as with most other federal
environmental statutes) to set stiffer standards regarding liability, compensation, and cleanup.105
In the aftermath of the Exxon Valdez spill, the scales tipped to the side of anti-preemption.
According to OPA Section 1018 (referred to as a “savings clause”), the act will not preempt any
state from imposing “additional liability or requirements” with respect to the discharge of oil or
related response activity (e.g., cleanup standards). A 2003 study identified 16 states that impose
unlimited liability for oil spills.106
There was some concern that the language of OPA’s savings clause would allow states to regulate
matters typically reserved for the federal government, such as oil tanker construction. To address
this issue, the conference report stated that the savings clause would not disturb a 1978 Supreme
Court decision that dealt with the intersection of federal and state authority to regulate the
shipping industry.107 In that case, the Court determined that a Washington State law was
preempted. The state law had attempted to govern oil tanker design, size, and movement in Puget
Sound.108
Regardless of the clarification in the conference report, the line between federal and state
jurisdiction (i.e., the extent of federal preemption) continues to be tested. In 2000, the Supreme
Court struck down (as preempted) a Washington State rule calling for various personnel
requirements, such as training, on oil tankers.109 Similarly, in March 2010, a federal district court
104 P.L. 93-248 , 33 U.S.C. §1471 et seq. 105 One argument against preemption was that existing requirements under particular state laws would be diminished or
negated entirely. See Benjamin Grumbles and Joan Manley, “The Oil Pollution Act of 1990: Legislation in the Wake of
a Crisis,” Natural Resources and Environment, 10:2 (1995), p. 38. 106 Dagmar Etkin, 2003, A Worldwide Review of Marine Oil Spill Fines and Penalties, at http://www.environmental-
research.com/erc_papers/ERC_paper_10.pdf. See also, CRS Congressional Distribution Memorandum, “Oil Spill
Liability in the Gulf States,” July 2, 2010 (on file with author). 107 U.S. Congress, Conference Report accompanying H.R. 1465, Oil Pollution Act of 1990, H. Conf. Rept. 101-653, at
122 (1990). 108 Ray v. Atlantic Richfield, 435 U.S. 151 (1978). 109 United States v. Locke, 529 U.S. 89 (2000).

Oil Spills: Background and Governance
Congressional Research Service 27
in Massachusetts ruled against a state law—finding it preempted—that would affect tanker
design, personnel qualifications, and navigation.110
110 United States v. Massachusetts, 2010 Westlaw 1345018 (D. Mass. March 31, 2010).

Oil Spills: Background and Governance
Congressional Research Service 28
Appendix. Federal Authorities Before and After the
Exxon Valdez Spill The following list highlights the primary federal authorities that were in effect when the Exxon
Valdez spill occurred in 1989:
Clean Water Act (1972): The Clean Water Act (CWA) represented the broadest
authority for addressing oil spills at the time of the Exxon Valdez spill. Section
311 of the CWA established requirements for oil spill reporting, response, and
liability. The act also created a fund (311 Fund), maintained by federal
appropriations, that could be used for cleanup and natural resource restoration.
Deepwater Port Act (1974):111 This statute addressed oil spills and liability issues
at deepwater oil ports. The act also set up the Deepwater Port Fund to provide for
prompt cleanup and to compensate damages above liability limits. The fund was
financed by a per-gallon tax on oil transferred at a deepwater port.
Trans-Alaska Pipeline Authorization Act (1973):112 This act covered oil spills and
liability relating to the Trans-Alaska Pipeline System (TAPS). Although the
pipeline is constructed over land, spills from it could reach coastal waters via
inland rivers. The act created a trust fund, financed through a lessee fee, that
could be used to respond to spills and damages from the pipeline.
Outer Continental Shelf Lands Act Amendments (1978):113 This act established
an oil spill liability structure and rules for oil extraction facilities in federal
offshore waters. With this legislation, Congress created the Offshore Pollution
Fund, financed by a per-gallon fee on produced oil, that could be used for oil
spill cleanup and damages.
National Oil and Hazardous Substances Pollution Contingency Plan (NCP): The
first NCP was administratively prepared in 1968 after observing the British
government’s response to a 37-million-gallon oil tanker spill (Torrey Canyon) off
the coast of England.114 The NCP contains the federal government’s procedures
for responding to oil spills and hazardous substance releases.115
After the Exxon Valdez spill, many observers116 described the above legal collection as an
ineffective patchwork. Arguably, each law had perceived shortcomings (discussed below in the
context of post-Exxon Valdez legislation), and none provided comprehensive oil spill coverage.
For more than 15 years prior to the Exxon Valdez incident, Congress made attempts to enact a
unified oil pollution law. Several contentious issues produced deadlocks, hindering the passage of
legislation. One of the central points of debate, state preemption, dealt with whether a federal oil
spill law should limit a state’s ability to impose stricter requirements, particularly unlimited
111 P.L. 93-627, codified at 33 U.S.C. §1501 et seq. 112 P.L. 93-153, codified at 43 U.S.C. §1651 et seq. 113 P.L. 95-372, codified at 43 U.S.C. §1801 et seq. 114 See EPA “National Contingency Plan Overview” at http://www.epa.gov/emergencies/content/lawsregs/ncpover.htm. 115 The NCP is codified at 40 C.F.R. Part 300. 116 See, for example, U.S. Congress, House Committee on Merchant Marine and Fisheries, Report accompanying H.R.
1465, Oil Pollution Prevention, Removal, Liability, and Compensation Act of 1989, 1989, H.Rept. 101-242, Part 2,
101st Cong., 1st sess., p. 32.

Oil Spills: Background and Governance
Congressional Research Service 29
liability. Other liability questions also generated debate. For example, if an oil spill occurred,
should the owner of the cargo (i.e., oil) be held liable, as was the ship owner/operator? Another
point of contention was whether oil-carrying vessels should be required to have double hulls.
Although proponents argued that a second hull would help prevent oil spills, the shipping
industry raised concern that implementing such a mandate would disrupt oil transportation and
potentially affect the national economy. A final issue involved the interaction between domestic
legislation (federal and state) and international measures. Some were concerned that if the United
States became a party to certain international agreements under consideration in the 1980s,117 the
international standards would preempt federal and state laws, especially those establishing
liability limits. Proponents argued that these concerns were overstated and stressed that joining
the international agreements was especially important for the United States because of the
international nature of oil transportation and associated pollution.
Author Contact Information
Jonathan L. Ramseur
Specialist in Environmental Policy
[email protected], 7-7919
117 The two agreements under consideration were the 1984 Protocols to the International Convention on Civil Liability
for Oil Pollution Damage and the Protocols to the International Fund for Compensation for Oil Pollution Damages.