Oil Spills, 1971-75, Gulf of Mexico - USGS · PDF fileSimplified flow diagram for offshore oil...
53
GEOLOGICAL SURVEY CIRCULAR 741 Oil Spills, 1971-75, Gulf of Mexico Outer Continental Shelf
Transcript of Oil Spills, 1971-75, Gulf of Mexico - USGS · PDF fileSimplified flow diagram for offshore oil...

GEOLOGICAL SURVEY CIRCULAR 741
Oil Spills, 1971-75,
Gulf of Mexico
Outer Continental Shelf

Oil Spills, 1971-75,
Gulf of Mexico
Outer Continental Shelf
By Elmer P. Danenberger
GEOLOGICAL SURVEY CIRCULAR 741
Statistics and discussion of oil spills
resulting from offshore operations on Federal oil and gas leases in the Gulf of Mexico
1976

United States Department of the InteriorTHOMAS S. KLEPPE, Secretary
Geological SurveyV. E. McKelvey, Director
Free on application to the Branch of Distribution, Eastern Region, U.S. Geological Survey, 604 South Pickett Street, Alexandria, VA 22304

CONTENTS
Page
System of measurement units ................. IVAbstract..................................... 1Introduction................................. 2Sources and reliability of data.............. 5Major spills................................. 7Minor spills................................. 10
Production-platform spills.............. 12Pipeline and pump spills................ 15Spills of less than 1 barrel............ 16Production incidents, by operator....... 17Production incidents, by platform....... 18
Other sources of spillage.................... 19Conclusions.................................. 20Selected references.......................... 22
ILLUSTRATIONS
Page
Figure 1. Index map showing Outer Continental Shelf leasing areasin the Gulf of Mexico off Texas and Louisiana........ 27
2. Bar graph showing number and volume of 1- to 50-barrelspills, by year, 1971-75............................. 28
3. Schematic diagram showing casing program and production safety system of a typical 12,000*-foot-deep well, Gulf of Mexico....................................... 33
4. Simplified flow diagram for offshore oil and gasproduction........................................... 34
5-10. Bar graphs showing:5. Number and volume of 1- to 50-barrel spills, by
year, 1971-75, for production platforms and for pipelines and pumps....................... 35
6. Principal causes of production-platform spillsof 1-50 barrels, by year, 1971-75............. 37
7. Principal causes of sump-system spills of 1-50 barrels on production platforms, by year, 1971-75....................................... 38
8. Number of 1- to 50-barrel spills involving failure of high-low level controls on production platforms, by year, 1971-75........ 39
9. Principal causes of pipeline and pump spills of 1-50 barrels, by year and volume of spills, 1971-75....................................... 40
10. Principal causes of pipeline and pump spills of 1-50 barrels, by year and number of spills, 1971-75....................................... 43
III

Page
Figure 11. Graph showing comparison, by year, of the number of structures having spills with the total number of fixed and major structures........................... 44
12. Bar graph showing estimated volumes of petroleumhydrocarbons introduced annually into the world's oceans, in millions of metric tons................... 46
TABLES
Page
Table 1. Annual production of oil and condensate from all opera tions on the Outer Continental Shelf, 1971-75........ 27
2. Number and volume of spills each year, 1971-75, Gulfof Mexico Outer Continental Shelf.................... 29
3. Causes of oil spills of more than 50 barrels, 1971-75.. 304. Causes of oil spills of 1-50 barrels, 1971-75.......... 305. Oil spills of more than 1,000 barrels, 1971-75......... 316. Blowouts resulting in pollution, casualties, or
property damage, 1971-75............................. 327. Causes of 1- to 50-barrel spills on production
platforms, 1971-75................................... 338. Causes of 1- to 50-barrel spills on production
platforms, 1971-75, grouped according to systemthat failed.......................................... 36
9. Causes of 1- to 50 barrel spills from pipelines andpumps, 1971-75....................................... 41
10. Frequency of spills among production platforms havingat least one 1- to 50-barrel spill during 1971-75.... 42
11. Production-platform spills of 1-50 barrels,identified by operator, 1971-75...................... 45
12. Budget of petroleum hydrocarbons into the oceans....... 47
SYSTEM OF MEASUREMENT UNITS
[The following report uses the English system of units. The English units can be converted to metric units by multiplying by the factors given in the following list]
To convert English unit
Acres........
Barrels (oil)
Barrels (36° API oil) Cubic feet...........
Feet..............................Miles, statute....................
geographical or nautical... Square miles, statute.............
Multiply by
0.4047 4.047x10- 3
0.159 1.590xl0 2 0.1342 2.832x10- 2
28.32 0.3048
609852
2.590
To obtain Metric unit
Hectares (ha). Square kilometers (km 2) Cubic meters (m 3 ). Liters (1). Metric tons. Cubic meters (m 3 ). Liters (1). Meters (m). Kilometers (km). Kilometers (km). Square kilometers (km2 )
IV

Oil Spills, 1971-75, Gulf of Mexico
Outer Continental Shelf
By Elmer P. Danenberger
ABSTRACT
Oil spillage connected with federally supervised drilling and produc
tion activities has been a matter of wide public concern. In its
supervision of mineral-resource development on the Outer Continental Shelf
(OCS), the U.S. Geological Survey is responsible for the day-to-day
inspection and monitoring of OCS oil and gas operations. During these
activities, the U.S. Geological Survey records and investigates hydro
carbon discharges resulting from such operations. Beginning in 1971, all
spills have been recorded, and a computer file has been maintained on all
spills of 1 barrel or more.
The total Gulf of Mexico OCS oil spillage recorded during January 1,
1971-December 31, 1975, amounted to 51,421 barrels. Production during that
period amounted to 35,219 barrels per barrel spilled. In all, 5,857 spills
were recorded, but 85.5 percent of the total spill volume was contributed
by just 5 incidents. The environmental effect of these incidents appar
ently was minimal and of short duration. No spills of more than 50 barrels
resulted from drilling operations during the period. The only spillage
resulting from blowouts was caused by nondrilling incidents, including
completion, production, and workover.
The amount of oil discharged from spills of less than 50 barrels
decreased by more than half between 1971 and 1975. The improvement
reflects changes in the operating philosophy of the offshore industry,
tightening of U.S. Geological Survey operating orders, and substantial
increases in the inspection force. Most production-platform spills involve

failures in the sump system, the separator system, or other hydrocarbon-
handling equipment; improved sump-system designs and better high-low-level
controls have reduced both the number and the volume of spills. Pipeline
and pump spills also declined significantly, although the decline appears
less attributable to revisions in OCS operating requirements. No operator
consistently contributed a disproportionate amount of spillage. Most of
the platforms having production spills had only one spill during the
period. Of the 304 platforms having incidents, 255 had 2 spills or less
and 188 had only 1 spill.
Comparison of the volume spilled with the volume produced for Gulf of
Mexico OCS operations during 1971-75 results in a spillage rate of 0.0028
percent. Spillage from tankers is estimated to be greater. The OCS
drilling and production spillage rate is not expected to increase during
exploration and development of the frontier areas.
INTRODUCTION
The Department of the Interior is authorized by the Outer Continental
Shelf Lands Act of August 7, 1953, to grant mineral leases on Outer
Continental Shelf (OCS) lands and to prescribe such regulations as might be
necessary to carry out the provision of the act. After the 1973 oil
embargo, in response to calls for "energy self-sufficiency," the Depart
ment expanded its Outer Continental Shelf oil and gas leasing program. The
Bureau of Land Management has tentatively scheduled lease sales for 17
areas before 1979. Thirteen of these areas have not yet been evaluated by
exploratory drilling and are considered "frontier" (unexplored) areas.
Public opinion toward these leasing programs ranges from expectation to
apprehension and distrust; the concern arises from such matters as the
likelihood of oil spills and the impact of these spills on the marine
environment, valuable estuaries, commercial fishing, and tourism. This
report summarizes statistics on oil spills during 1971-75 in the Gulf of
Mexico and discusses the causes of these incidents and the damage that
resulted.
The Gulf of Mexico (fig. 1) is now and has been for 30 years the
world's most active offshore oil and gas area; since 1947, almost 13,000

wells have been drilled in Federal waters. During 1971-75, more than 1.8
billion barrels of oil and condensate were produced from Federal lands in
the Gulf (table 1); this was more than 10 percent of the nation's domestic
crude oil production and approximately 15 percent of the natural gas
production. At the end of 1975, approximately 65 mobile drilling units
were operating in the Gulf in water depths as great as 1,775 feet. Oil and
gas are currently being produced from 2,079 platforms in waters up to 373
feet, and a steel tower is being constructed for a Gulf of Mexico site in
water deeper than 1,000 feet. Subsea production systems, deepwater guyed
towers designed to yield slightly to environmental forces, and other
prototype equipment that are now being tested in the Gulf will greatly
increase the capability of offshore development.
Although both onshore and offshore oil and gas operations were
pioneered and developed in this country, few Americans are acquainted with
actual oil and gas development practices, and some have misconceptions
about the conduct of such operations. Oil spillage is a particularly
emotional topic and can readily be misunderstood or distorted. The errors
can arise from numerous sources. Study teams, though lacking sufficient
statistical data, may seek to apply historical data to projections of spill
estimates for "frontier areas." Definitions and statistics can intention
ally be presented so as to generate an intended result. Oil-spill
forecasts for frontier areas especially difficult to make may be
influenced more by the forecaster's prejudices and understanding of the
statistics than by the historical record. Interchanging statistical
information from many different sources can lead to unreasonable conclu
sions. In some instances, frontier-area oil-spill forecasts have been
expressed as high and low estimates for spills of several categories (such
as drilling, production, and transportation). Addition of the high
(maximum) estimates for each category gives unrealistically high estimates
for total spillage. Other annual spillage forecasts are based on peak
annual production for the oil field under consideration; multiplication of
this maximum annual estimate by the anticipated years of production from
the field gives an inordinately high estimate for total spillage. Simi
larly, some projected studies do not take into consideration technical

innovations that will be introduced, and other studies overcompensate for
future improvements.
The absence of universally recognized definitions for such terms as
"major spill," "minor spill," and "blowout," allows considerable latitude
in categorizing incidents. One observer could justifiably say that there
has only been 1 major pollution incident in the history of OCS operations,
whereas another might with equal validity cite 30 incidents.
In its capacity as manager of leased lands on the OCS, the U.S.
Geological Survey issued, effective August 28, 1969, OCS Order No. 7. This
Order establishes pollution-prevention and waste-disposal requirements and
requires that all spills, regardless of size, be reported to the U.S.
Geological Survey. After issuance of this Order, the Survey significantly
increased its field inspection staff and its contracted helicopter fleet,
which enables regular, frequent inspection flights. The reporting
requirements and the staffing increases were essential to establishing
complete data on oil spills.
The first full year, 1970, of applicability of OCS Order No. 7, which
established the requirements for reporting and recording spills, disclosed
various shortcomings of the procedures. Reports on some spills were
expressed in general terms such as "minor spill," rather than as the "best
estimate" of the quantity spilled, which is essential for statistical
analysis. The cause of the spill was not always identified or accurately
recorded. Spill data for periods prior to 1971 are, therefore, of limited
value, especially for minor spills. By the end of 1970, most of the spill-
reporting problems had been resolved.
The historical record on oil spills is utilized to forecast discharges
in frontier areas, despite the questionable applicability, and such sta
tistics provide one means of evaluating offshore oil and gas operations.
Complete statistics on hydrocarbon discharges are maintained by the U.S.
Geological Survey, in its role of supervising OCS oil and gas operations.
Because of the public interest, these data are presented here for the years
1971-75, for which statistics are complete.

SOURCES AND RELIABILITY OP DATA
Safety and pollution prevention are two major objectives of the U.S.
Geological Survey OCS Lease Management Program. Meeting the objectives
required establishing an effective oil-spill and accident-report data
base. At the request of the Survey's Director, the Water Resources
Division reviewed the Conservation Division's Lease Management Program;
this study (U.S. Geological Survey, 1972) led to development of an OCS
Events File, which utilizes the General Information Processing System
(GIPSY), an information-handling tool developed at the University of
Oklahoma. This computer file, which is updated monthly, encompasses
information on all spills of 1 barrel or more, blowouts, fires and
explosions, fatalities, and miscellaneous accidents; the data for each
incident consist of date, location, type of operation, probable causes, and
a brief description of the event.
The compilation of spill data, by cause, presented in tables 3,4, and
7-9, is derived from the OCS Events File. The annual breakdown of oil
spills by size (table 2) was compiled from the monthly reports on Gulf of
Mexico OCS operations. For spills of 50 barrels or more, the total number
and volume of spills as compiled from the Events File (table 3) correlates
precisely with the more-than-50-barrel-spill totals from table 2.
Table 4, derived from the OCS Events File, shows 872 spills of 1-50
barrels. Fifteen of those incidents are in both the pipeline and
production-platform categories. Another seven spills were each 50
barrels, resulting in an actual Events File count of 850 incidents
involving 1-49 barrels. These compare with 887 such incidents compiled
manually from the operations reports. The two data sources agree within 1
percent on a volume-spilled basis. '
The above figures indicate that the two data sources agree and that
virtually every incident has been recorded in the Events File. How well
are oil-spill incidents being reported? The reporting depends to a large
degree on the cooperation of the operators. This reporting is supplemented

by U.S. Geological Survey inspection and surveillance. At least 10
inspection teams operate daily offshore, weather permitting; for example,
during 1975, 3,388 pollution-surveillance flights were made. Any slicks or
other indications of pollution are reported immediately by the inspection
team, and an attempt is made to identify the source of such discharge. If
the pollution is emanating from an offshore production facility, the faulty
piece of equipment or the entire platform is shut-in at once. Any willful
violators of regulations regarding discharge are subject to criminal
prosecution by the Department of Justice.
U.S. Geological Survey field engineers and technicians believe that
the offshore operators have been diligent in adhering to the spill-
reporting requirements of DCS Order No. 7. Although some minor spills may
go unreported, an operator has, from a regulatory standpoint, little
incentive not to comply with reporting requirements. The enforcement
action resulting from a reported minor oil spill is if there are no
aggravating circumstances an order to shut-in, whereas failure to report
an incident could lead to criminal prosecution. The sustained increase in
the number of less-than-1-barrel spills reported during 1971-75, in con
trast to the declining number of larger spills, supports the contention
that spill reporting became more complete during the 5 years.
Many of the oil slicks detected in the Gulf of Mexico are not related
to oil and gas operations but result from discharges from tankers, commer
cial fleets, natural seeps, and other unrelated sources (table 12).
Determining the amount of oil spilled can be difficult. In many
instances, the volume of the spill can be accurately determined, by
measuring the differentials between successive meters, measuring the
volume changes in production-equipment contents, knowing the flow rate's
into the various pieces of platform equipment and the overflow period, and
other means of detecting losses.from the closed-production system. Volumes
discharged from blowouts commonly can be estimated from production history
(if available), well tests, and other reservoir data. If no precise means
of measuring is available, the quantity discharged can be estimated from
the size and appearance of the slick. For example, a barely discernible
slick might contain only 25 gallons of oil per square mile, whereas a dark-
6

brown slick could amount to more than 1,300 gallons per square mile. The
estimate must also take into consideration natural processes acting upon
the spill, such as weathering, solubility, emulsification, and biode-
gradation. Therefore, the reliability of visual estimates is low, and
estimates on 1 spill can vary by 100 percent or more. In the past, no
effort has been made to evaluate the precision of the discharge estimate.
A means of rating the objectivity of an estimate on a scale of 1 to 10 is
being considered, whereby a precise volume determined from meter differen
tials would receive an accuracy rating of 10, and a rough estimate based on
the size and appearance of the slick would be rated as 1. This scale would
provide a clearer picture of the accuracy of the volumetric determinations
and would allow maximum- and minimum-discharge calculations based on the
best estimates of spillage.
MAJOR SPILLS
The total Gulf of Mexico OCS oil spillage recorded during 1971-75 was
51,421 barrels (table 2). Gulf of Mexico OCS oil and condensate production
during the 5 years totaled 1.811 billion barrels (table 1); 1971, 1972, and
1973 were the 3 highest production years in the history of Gulf of Mexico
OCS operations. During the 5 years 35,219 barrels were produced per barrel
spilled. l The total value of the oil and gas produced from both the Gulf of
Mexico and the Pacific OCS during 1971-75 was $14.3 billion; in that time,
the Federal Government received $13.9 billion in rentals, royalties, and
bonuses a large share of the revenues generated by OCS operations. The
bonuses paid to the Government for the right to explore and develop OCS
This spill figure applies only to the Gulf of Mexico OCS. At present the only other offshore production in Federal waters is in the Santa Barbara Channel, where 104.7 million barrels of oil were produced during 1971-75. No spills of more than 50 barrels occurred in the Channel during the period. The only chronic discharges are related to oil seeps. Seepage around platform A in the Channel, triggered by the 1969 blowout, continues at a rate of 4-5 barrels per day. Hundreds of natural oil and gas seeps exist in the Channel and discharge an estimated 200-250 barrels per day (Fisher, 1975) . The Coal Oil Point area is the most active seep area, venting an average of about 50-70 barrels per day (Alien and Schlueter, 1969).
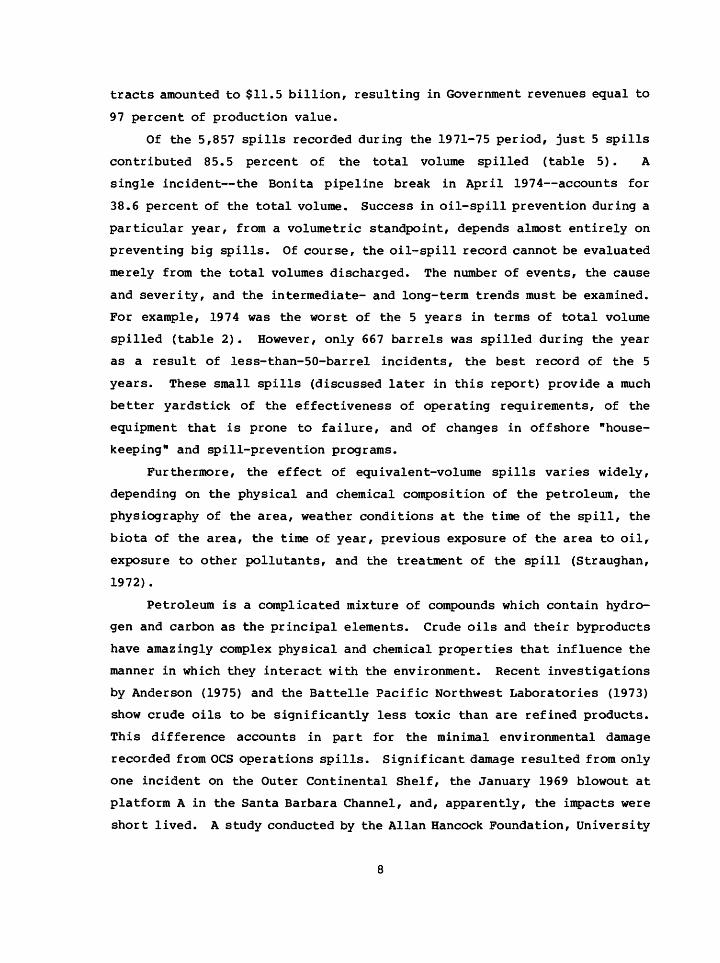
tracts amounted to $11.5 billion, resulting in Government revenues equal to
97 percent of production value.
Of the 5,857 spills recorded during the 1971-75 period, just 5 spills
contributed 85.5 percent of the total volume spilled (table 5). A
single incident the Bonita pipeline break in April 1974 accounts for
38.6 percent of the total volume. Success in oil-spill prevention during a
particular year, from a volumetric standpoint, depends almost entirely on
preventing big spills. Of course, the oil-spill record cannot be evaluated
merely from the total volumes discharged. The number of events, the cause
and severity, and the intermediate- and long-term trends must be examined.
For example, 1974 was the worst of the 5 years in terms of total volume
spilled (table 2). However, only 667 barrels was spilled during the year
as a result of less-than-50-barrel incidents, the best record of the 5
years. These small spills (discussed later in this report) provide a much
better yardstick of the effectiveness of operating requirements, of the
equipment that is prone to failure, and of changes in offshore "house
keeping" and spill-prevention programs.
Furthermore, the effect of equivalent-volume spills varies widely,
depending on the physical and chemical composition of the petroleum, the
physiography of the area, weather conditions at the time of the spill, the
biota of the area, the time of year, previous exposure of the area to oil,
exposure to other pollutants, and the treatment of the spill (Straughan,
1972).
Petroleum is a complicated mixture of compounds which contain hydro
gen and carbon as the principal elements. Crude oils and their byproducts
have amazingly complex physical and chemical properties that influence the
manner in which they interact with the environment. Recent investigations
by Anderson (1975) and the Battelle Pacific Northwest Laboratories (1973)
show crude oils to be significantly less toxic than are refined products.
This difference accounts in part for the minimal environmental damage
recorded from OCS operations spills. Significant damage resulted from only
one incident on the Outer Continental Shelf, the January 1969 blowout at
platform A in the Santa Barbara Channel, and, apparently, the impacts were
short lived. A study conducted by the Allan Hancock Foundation, University
8

of Southern California (Straughan, 1971), found that flora and fauna in the
Channel were damaged much less than had been predicted, and that the area
is recovering well. The only environmental damage recorded as a result of
the 5 largest spills in the Gulf of Mexico (table 5) during the 5 years
occurred when minor amounts of oil intermittently reached approximately
1,000 feet of beach on the Chandeleur Islands after the September 9, 1974,
Cobia pipeline break. On only two occasions prior to 1971, both in 1970,
did minor amounts of oil reach the coastline after Gulf of Mexico DCS oil
spills. Few bird deaths or other obvious forms of environmental damage
have been attributed to DCS oil and gas operations in the Gulf.
Four of the five spills in 1971-75 which exceeded 1,000 barrels were
related to transportation of oil from OCS production facilities (table 5).
Of the 20 spills of more than 50 barrels (table 3), 9 were transportation
incidents, and 6 were caused by failures in production-platform equipment.
Of course, production-platform operations and transportation activities
span the entire range of regular offshore-production activities and can,
logically, be expected to account for most of the spillage. Spills of 50
barrels or more yielded 90.6 percent of the total volume discharged during
1971-75, and 96.0 and 97.1 percent, respectively, for 1973 and 1974. In
1971, 1972, and 1975, when no spill exceeded 500 barrels, the more-than-50-
barrel spills account, respectively, for only 46.3, 12.7, and 27.2 percent
of the total volume spilled.
Particularly noteworthy is that no spills of more than 50 barrels
resulted from drilling operations during 1971-75, even though 4,105 new
wells were started. No such spill has occurred since July 19, 1965, when
1,688 barrels of crude oil was discharged into the Gulf during a blowout in
the Ship Shoal area off the coast of Louisiana. (An oil blowout which
began on March 16, 1969, though technically a nondrilling incident, could
be classified with the drilling events. The well had been drilled to total
depth, and control was lost during completion operations when the rig
shifted during a storm; 2,500 barrels was discharged through the tubing.)
Furthermore, no spill in excess of 50 barrels has been recorded during
exploratory drilling either on the Federal OCS or, to our knowledge, in any
other offshore area throughout the world. Nevertheless, exploratory

drilling is often labeled as environmentally the most hazardous aspect of
offshore operations. The record does not support such contentions.
Some analyses of offshore accidents combine all blowouts into one
category and assume that they are related to drilling operations. Then the
total number of wells drilled during a given period is simply divided by
the total number of blowouts, to derive a figure showing wells drilled per
blowout. In similar manner, the oil discharged from these blowouts is
divided by the number of wells drilled, to obtain a figure showing barrels
spilled per well drilled. The resulting figures are misleading, because
many of the blowouts and much of the resulting spillage did not result from
drilling operations. It is therefore incorrect to use these figures to
predict, from a forecast of the number of wells to be drilled, the number
of blowouts and the amount of spillage which will result from offshore
activity. For frontier areas, where operations may never advance past the
exploratory drilling stage, the system of projection is particularly
unsatisfactory.
During 1971-75, 22 blowouts occurred during drilling, workover, or
production. Nine of the 22 caused significant pollution or property
damage. Of the nine (table 6) , five were associated with drilling
operations. However, the 4 nondrilling incidents were responsible for all
725 barrels of "blowout spillage." According to OCS blowout records, which
go back to 1956, only two drilling-related blowouts caused significant oil
spills the Santa Barbara blowout, during which at least 25,000 barrels of
oil was discharged, and the previously mentioned July 1965 Gulf of Mexico
blowout. The two most serious blowouts in the Gulf of Mexico OCS occurred
in 1970 on production platforms and discharged more than 83,000 barrels.
MINOR SPILLS
The aggregate volume of less-than-50-barrel spills accounts for only
9.4 percent of the total spillage; numerically, 99.5 percent of the spills
are in this quantity category. The great number of such spills 5,830
during the 5 years allows a more detailed statistical analysis and a more
reliable observation of trends. The amount of oil discharged from these
spills was reduced by 52 percent between 1971 and 1975. Discharges from 1-
10

to 14-barrel incidents decreased by 66 percent during that time. If all
spills of 1-50 barrels are considered (fig. 2), the reduction in discharge
volume between 1971 and 1975 is 70 percent. (Seven spills discharged 50
barrels each.)
Although 1975 Gulf of Mexico OCS oil and condensate production was 19
percent less than in 1971, production facilities have steadily increased.
Therefore, reduced production is unlikely to have contributed to the
improved oil-spill picture. The number of OCS platforms in the Gulf of
Mexico increased from approximately 1,800 at the end of 1970 to 2,079 on
December 31, 1975; the total number of completions jumped from 8,667 to
10,274. Despite the production decrease, the increases in surface equip
ment would increase the failure probability.
The reduction in minor spills is largely attributable to changes in
operating and regulatory philosophy as industry and Government responded
to public concerns about the environment. Three serious incidents the
Santa Barbara blowout and two major fires in the Gulf of Mexico occurred
sequentially during 1969 and 1970 and drastically affected the conduct of
OCS operations. The offshore industry was under the constant scrutiny of
legislators, scientists, and other concerned citizens who formerly had
given little thought to offshore oil and gas operations. Industry reacted
quickly to improve its public image, examining its offshore operating
procedures and initiating safety programs to prevent the recurrence of
Santa Barbara-type pollution spectaculars.
The abruptly heightened public interest also affected the regulatory
role of the U.S. Geological Survey. New operating requirements in the
form of OCS Orders pertaining to drilling procedures, subsurface safety
devices, platform safety and production equipment, and oil and gas pipe
lines were instituted. The inspection force of 7 technicians was
increased approximately 700 percent between 1969 and 1975. The total
inspection staff including technicians, engineers, and other support per
sonnel increased tenfold. Numerous additional changes were made in U.S.
Geological Survey regulatory programs.
OCS Order No. 8, which outlines platform safety and pollution-control
requirements, and OCS Order No. 9, which deals with OCS pipelines, were,
11

when combined with industry's own efforts, very effective in reducing tht
number of spills. As shown in table 4, almost 60 percent of the spillage
from 1- to 50-barrel incidents is related to production-platform events.
The largest number of spills were caused by failures in the sump system,
separator system, and other hydrocarbon-handling equipment (table 7).
OCS Order No. 8 reflects the results of a study of all safety systems
then in effect and selection of those devices that seemed least susceptible
to failure. Redundant systems are required, in many instances. If one
piece of equipment fails, all connected equipment is shut-in. Earlier
regulations governing OCS production had been general in nature, allowing
operators considerable latitude in judgment factors; each company had its
own philosophy concerning safety practices and clean operations. Stand
ardization of antipollution and safety procedures has had a leveling effect
on all operators. Now each facility must meet the same requirements,
regardless of size, distance from shore, value, or other criteria. Figures
3 and 4 show some of the safety equipment which is required on an OCS
production platform.
Production-Platform Spills
Minor production-platform discharges declined during 1971-75; the
particularly sharp drop in 1972 corresponds with the implementation of OCS
Order No. 8, which became effective on October 30, 1970, and allowed 1 year
(until October 30, 1971) for full compliance. The number and volume of 1-
to 50-barrel platform spills decreased by 45.9 percent and 49.3 percent,
respectively, during 1972 (fig. 5). Each platform-spills category,
including sump and separator systems, well and header system, and other
hydrocarbon-handling equipment, showed significant declines in 1972 (fig.
6). The "other hydrocarbon-handling equipment" category primarily com
prises surge-tank and production-tank incidents. The spill-volume decline
continued through 1975; the number of spills tended to level off in 1975.
Between 1971 and 1975, the number and volume of production-platform spills
declined by 75.9 percent and 81.6 percent, respectively (fig. 5). The
larger reduction in spill volume, as compared with the reduction in number
of spills, indicates that the spills which are occurring are smaller and
12

possibly that the 1- and 2-barrel incidents are being more diligently
reported. This trend is particularly noticeable in 1975 as the number of
production-platform and pipeline and pump spills increased slightly, while
the volumes continued to decrease.
Most of the production-platform spills are related to failures in the
sump system, the separator system, or other hydrocarbon-handling equipment
(tables 7, 8). Both closed sumps and open-ended sump piles are utilized in
the Gulf of Mexico to collect the deck drainage and the produced water.
From an environmental standpoint, the closed tanks are generally consid
ered to be preferable. The oil is skimmed from the closed tank and
recycled through the low-pressure-separation system, and the water is
discharged into the Gulf. Nevertheless, these systems are not problem-
free; and if the tanks and sump pumps are too small, heavy rains can cause
hydrocarbons to overflow.
The sump piles are generally long pipes or tanks, open at the bottom,
that extend well beneath the water surface. Hydrocarbons are skimmed from
the tank and rerouted through the production system, while clarified water
is discharged into the Gulf. Problems result when a surge of oil from an
overflowing piece of production equipment overloads the sump, when sump
pumps fail to operate, when heavy rains overload the sump allowing oil to
flow from the open end, and when high-level controls fail, allowing the
sump to overfill. The open-ended sumps can be particularly troublesome in
shallow water because of the reduced hydrostatic head and the increased
effect of wave action.
The number of sump-related spills decreased substantially between
1971 and 1974 and increased slightly in 1975 (figs. 6, 7). This improve
ment is largely a result of operator initiatives stemming from OCS Order
No. 8 and company policy changes. New closed-tank sumps and combination
sump tank-sump pile systems were installed on certain platforms. Effluents
containing significant oil concentrations are routed to separate oil
sumps. The decline in the "carry under or overfill" incidents reflects
these changes. The newer production platforms incorporate more elaborate
treatment schemes. On certain large platforms, an oil sump tank collects
oil from all pressure drains and pumps it to the production surge tanks.
13

The water drains carry fluids to another closed sump tank. The effluent
from the drain sump tank is pumped to a dirty-water surge tank. Oil
skimmed from this tank is routed to the oil sump. The water is piped to a
gas flotation unit, which lowers the oil content below 50 parts per
million, and is then pumped to a clean-water surge tank. Oil is skimmed
from the flotation unit and from the clean-water surge tank and is piped to
the oil sump. Water from the clean-water surge tank is finally discharged
into the receiving waters through a disposal tube. Obviously, this is an
effective and elaborate sump system. Nevertheless, for old platforms which
have been using open-ended sumps for years and are producing from fields in
their twilight years, requiring installation of such an elaborate system is
difficult to justify. Inasmuch as these platforms have been producing for
years with no apparent adverse environmental impact and, further, the costs
of installing elaborate drainage-treatment systems could significantly
reduce ultimate resource recovery, the U.S. Geological Survey has not
required extreme changes in these systems. Proposed Environmental Protec
tion Agency regulations pursuant to the Federal Water Pollution Control Act
do, however, specify that deck-drainage discharges meet the same oil
limitations which apply to produced waters.
The major single cause of spills in the separator system and other
hydrocarbon-handling equipment is the failure of high-level controls
(table 8). The internal float devices required by OCS Order No. 8 are
designed to automatically shut-in production when the tank fills to a
specified level. During 1971-75, 126 spills in the 1- to 50-barrel
category involved high-low level control failures. However, the number of
these spills has declined sharply (fig. 8). Order No. 8 requires operators
to submit to the U.S. Geological Survey semiannual records showing the
present status and past history of each device including dates and details
of inspection, testing, repairs, adjustment, and reinstallation. Testing
of high-level controls may be difficult; in many separators and production
vessels, filling the tank is required to activate and test the high-level
controls, a time-consuming procedure. Because of the number of items which
must be inspected, conducting this test may be impractical for operators
and inspectors, and the test is often bypassed. In recent years, many
14

operators have been installing high- and low-level sensors in external
columns that can be isolated from the vessel. This isolation permits the
devices to be tested without interrupting production. The increase in
these external controls probably contributed significantly to the decline
in spills resulting from high-low level control failures. The revised
version of OCS Order No. 8 requires that operators install the sensors in
external columns unless solids deposition or foaming hinders activation of
the device.
Much of the reduction in production-equipment incidents is attributed
to the implementation schedule of OCS Order No. 8. Operators were given
only 3 months from the October 30, 1970, effective date to comply with most
of the provisions regarding automatic shut-in valves, pressure- and
liquid-level sensors, and sump systems. Because of the short time allowed,
much of the equipment was installed hastily and unsatisfactorily. Once the
facilities were equipped to meet the Order's requirements, many of the
systems were redesigned, and neater, more effective components were
installed. The spill statistics reflect these improvements.
Pipeline And Pump Spills
The decline in pipeline and pump incidents (fig. 5) is not so clearly
attributable to revisions in the OCS Orders. Although OCS Order No. 9,
"Oil and Gas Pipelines," which became fully effective in early 1971,
undoubtedly contributed to the sharp decline in incidents during 1972, most
of the improvement appears to be related to better platform management. In
1972 the total number and volume of these incidents dropped 30.6 and 40.0
percent, respectively, from 1971 levels. The respective declines between
1971 and 1975 were 56.9 and 64.6 percent. The major causes of pipeline and
pump spills (table 9; fig. 9) are (1) pipeline ruptures and breaks, (2)
pipeline pump failures, (3) discharge or transfer line ruptures or coupling
failures, and (4) miscellaneous incidents. Improvement in the latter two
categories (figs. 9, 10) is primarily responsible for the sharp reduction
in pipeline and pump spills between 1971 and 1975. Improvements in these
two categories are probably more directly related to "good housekeeping"
than to OCS Order No. 9. Because many of the pipelines in the Gulf of
15

Mexico are old, a significant reduction in minor pipeline leaks could not
be expected to result from implementation of Order No. 9. Improvement is
expected as inspection programs improve and as advanced cathodic protec
tion and monitoring systems are used.
There is also no indication of a consistent decline in events related
to pump failures. Half the 42 pump spills (table 9) resulted from
mechanical failures (seal, housing , packing, or piston head burst; union or
plunger failed). One-fourth the pump spills also involved high-level
control failures. When a pump is deactivated, the production vessel which
precedes the pump in the flow scheme normally a surge or storage tank may
begin to overfill. When the fluid in the tank exceeds a specified level,
the high-level float required by OCS Order No. 8 should automatically shut-
in the incoming production. Therefore, 10 of the pump spills could have
been prevented had the high-level control operated properly. In three
other instances, the high-level control was activated, but a surface safety
valve on one of the wells failed, allowing production to continue.
Even though the number of pump spills has not steadily declined (fig.
10), the low number of these spills 2 in 1974 and 4 in 1975 relative to
the tremendous volumes of hydrocarbons being handled indicates the general
success of the equipment. Three of the 1975 incidents occurred because
hydrocarbons continued to flow through damaged pumps when a plate loosened,
when a plunger broke, or when a face gasket blew. Only 1 of-the 1975 pump
spills involved the failure of a high-level control.
Spills Of Less Than 1 Barrel
The less-than-1-barrel spills were the only group to steadily
increase during 1971-75 (table 2). These spills increased by 15 percent
between 1971 and 1974 and decreased slightly in 1975. Much of this
increase can probably be traced to more conscientious interpretation of OCS
Order No. 7, which requires that operators report all spills. Operators
are now very diligent in their observance of this requirement, sometimes
reporting spills as small as 1 pint. Statistics are not maintained on the
total volume discharged in spills of less than 1 barrel. For record-
16

keeping purposes, it is assumed that one-fourth barrel (10.5 gallons) is
discharged in each incident. Inasmuch as many of the incidents involve
several gallons or less, this volumetric approximation probably represents
a maximum figure for these spills.
Production Incidents, By Operator
table 11 identifies, by operator, production-platform spills of 1-50
barrels. This limited analysis is one means of evaluating the effective
ness of regulatory changes and modifications in platform-management. The
column showing each operator's oil production for fiscal year 1975 (July 1,
1974-June 30, 1975) indicates the magnitude of that operator's activities.
The amount of oil production is only one factor in contrasting oil spills
by operator. A complete analysis would, of course, consider many other
factors, such as the amount of condensate production, the number of oil and
condensate production platforms and the production per platform, the age of
the fields and their production facilities, the types of spills, and the
sources of spills (whether clustered at one field or scattered).
The 1- to 50-barrel production-platform incidents were tabulated
(table 11) because these are the most frequent type of spill and the type
which OCS Order No. 8 was designed to curtail. They also give same
indication of the success of each operator's housekeeping programs. The
individual trends for most operators correspond to the general trend (fig.
5) for production-platform spills. The number of spills generally declined
between 1971 and 1975, with a consistent sharp decline in spills between
1971 and 1972. As expected, more spills are attributable to the large
producers. No operator consistently contributed a disproportionate amount
of spillage. The 1975 statistics are particularly encouraging: no single
operator discharged more than 50 barrels.
The only 2 spills of more than 50 barrels in 1975 were related not to
faulty operating practices on the platform but to workboat mishaps. In
March a workboat bumped a platform and spilled 166 barrels of diesel fuel;
and in September an anchor ship pulled an anchor too close to the drillship
and ruptured a diesel fuel tank, spilling 100 barrels.
17

Production Incidents, By Platform
The 536 chronic (1-50 barrels) production-platform incidents during
1971-75 were divided among 304 platforms (table 10) . Figure 11 relates the
number of structures having spills to the total number of fixed structures
and the number of major structures. A major structure is defined as
having two or more pieces of production equipment (vessels other than test
separators) and (or) more than five producible completions. Nearly all the
production incidents occurred at major platforms. In 1971 structures
having spills represented 19 percent of the estimated number of major
structures. That figure declined to 3.6 percent in 1974 and 4.2 percent in
1975.
To determine what percentage of the major platforms were actually
producing or handling production from other platforms, the Gulf of Mexico
platform file was examined. At the end of 1975 there were no producing
wells on 117 of the 1,020 major platforms; 67 of these 117 nonproducing
platforms were, however, being utilized for hydrocarbon separation and
handling. Therefore, all but 50 (4.9 percent) of the major platforms were
"candidates" for oil spillage at that time. The remaining 50 major
platforms were in development-drilling or abandonment stages or were
temporarily shut-in for mechanical reasons.
At the end of 1975, 1,202 structure complexes had at least 1 producing
completion. The term "structure complex" is used because at some sites
production equipment, personnel living quarters, and other facilities are
separated onto several platforms attached by walkways. At the end of 1975
there were 1,786 complexes comprising 2,079 platforms. The ratio of the
number of platforms with 1975 production spills (43) to the number of
producing complexes at the end of 1975 was 0.036 (fig. 11).
Of the 304 platforms having production spills during 1971-75, 188
platforms had only 1 spill (table 10). Thirteen platforms had at least 5
spills, with the maximum being 12. Of these 13 platforms, only 2 had more
than 1 spill during 1974-75. Eight of the 13 had all their spills in 1971-
73 and none in 1974-75.
18

OTHER SOURCES OF SPILLAGE
Comparison of volume spilled to volume produced for Gulf of Mexico DCS
Operations (drilling, production, and transportation) during 1971-75 dis
closes a spillage rate of 0.0028 percent. According to the Council on
Environmental Quality (1974) the historical spillage rate for tankers is
0.016 percent, more than 5 times the rate for Gulf of Mexico OCS opera
tions. This estimate is for tankers of international registry, and it is
generally accepted that U.S.-registration vessels have a better record.
Furthermore, the development of deepwater ports, the application of new
regulations restricting tanker discharges, and the application of new
technology should significantly reduce the tanker-spillage rate.
The National Academy of Sciences (NAS) has estimated the sources of
petroleum hydrocarbons entering the oceans (table 12; fig. 12). Only 1.3
percent of these hydrocarbons are attributed to offshore production. The
NAS best estimate for annual discharges from offshore production is 0.08
million metric tons, or approximately 600,000 barrels. This estimate is 25
to 600 times the annual spillage for the Gulf of Mexico OCS in 1971-75.
Almost two-thirds of the world's offshore production platforms, almost
one-half of the world's offshore drilling activity, and approximately one-
eighth of the offshore production occurred on the Gulf of Mexico OCS (1974
figures); thus, the NAS spillage estimate for offshore operations is by no
means conservative and is probably somewhat too high. The NAS estimates
that tanker discharges account for almost 2.13 million metric tons annu
ally, or almost 16 million barrels. At present production rates, this
equals the total oil and condensate production from the Gulf of Mexico OCS
for 17 days.
The NAS also estimates that 0.6 million metric tons, or 4.5 million
barrels, is discharged annually from natural seeps, more than 7 times the
spillage attributed to offshore production. According to Fisher (1975), an
estimated 70 thousand to 90 thousand barrels the equivalent of the 1969
Santa Barbara spill and several times the maximum annual Gulf of Mexico
spillage seeps annually into Santa Barbara Channel waters.
19

These figures give perspective to the broad problem of spills. They
are not intended to minimize the potential for localized environmental
disturbances from OCS activities or to excuse operations-related spillage
or careless drilling and production practices; nonetheless, they do
indicate that even if the hydrocarbon-discharge rate from operation
activities approaches zero, tremendous volumes of hydrocarbons still will
enter the oceans.
CONCLUSIONS
The spill statistics serve as a means of evaluating the effectiveness
of U.S. Geological Survey regulatory programs and pinpointing problem
areas and research needs. Also, the public should be informed on the
nature of offshore oil and gas operations, including the potential for oil
spills and other environmental impacts. The more detailed oil-spill data,
together with the growing body of information on the biological impacts of
crude discharges, will allow better cost-benefit analyses and a more
rational evaluation of offshore oil and gas leasing programs.
The assumption is often made that the more severe oceanographic and
meteorological conditions in frontier areas, such as the Gulf of Alaska and
the North Atlantic, will cause more oil-spill incidents than have occurred
in the Gulf of Mexico. This probably will not happen. Operators in these
frontier areas will, from the outset, assess the resource potential by
means of exploratory drilling. Very few spills have occurred during
drilling and even fewer during exploratory drilling. No significant
spillage has resulted from oil and gas operations in the harsh environment
of the North Sea, where approximately 800 wells have already been drilled.
Development and production operations in the frontier areas will
differ somewhat from those in the Gulf of Mexico. Owing to the tremendous
costs of development, only major fields will be commercially exploited.
Production facilities will more closely resemble those utilized in the
North Sea than those operating in the Gulf Of Mexico. In the Gulf of
Mexico, more than 2,000 structures (many of which are single-well "satel
lites") are producing from over 1,600 oil reservoirs and approximately
1,200 gas reservoirs. Most of these reservoirs are small and have an
20

average of less than two completed wells. Only 4 Gulf of Mexico fields
produced an average of more than 50,000 BOPD (barrels of oil per day)
during 1974 the Bay Marchand Block 2 Field (in State and Federal waters.
South Timbalier area), West Delta Block 30 Field, Eugene Island Block 330
Field, and Grand Isle Block 43 Field. By contrast, fields in the North Sea
are far fewer and much larger. At least 10 fields in just the British
sector of the North Sea will have peak daily productions in excess of
50,000 barrels, 6 will exceed 100,000 BOPD, and at least 4 will ultimately
produce more than 200,000 BOPD. North Sea steel and concrete towers are
designed to accommodate a large number of wells and high production
volumes. The $330 million Brent B platform is expected to produce as much
as 160,000 BOPD. Although the Gulf of Alaska and the Atlantic Coast areas
probably will be less productive, large fields and North Sea-type struc
tures will be necessary for commercial exploitation. The enormous size and
expense of the facilities dictate that only the best production and safety
equipment and operations personnel be used. The chance of failure is
believed to be less because more production will be processed by less
equipment. All safety and pollution-control equipment will be designed as
an integral part of those platforms, rather than being added after many
years of production. The redundancy which has been added to Gulf of Mexico
systems will be original equipment for the frontier areas. Platform
drainage systems will be fitted to the requirements of the structure, and
no open sumps will be permitted. Pipeline systems will be protected by the
latest cathodic protection systems and automatic volumetric sensors. New
equipment is being developed for detecting pipeline corrosion by pumping
special ultrasonic tools through the line. Reductions in the relative
number and severity of oil spills in the frontier areas can reasonably be
expected, should these areas prove productive.
Though continuing to seek a reduction in unnecessary discharges of oil
and other liquid and solid waste materials from OCS structures, we must
acknowledge the practical limitations to these discharge reductions. For
example, there have been no indications of biological impacts from dis
charges of produced waters with an oil content of approximately 50 parts
per million from OCS platforms. Such discharges quickly disperse to
21

nontoxic levels in the low parts per billion range. Hydrocarbons present
in these concentrations feed microbial oxidizers and may be beneficial.
Some researchers determined, in laboratory experiments, that hydrocarbons
present in seawater in concentrations less than 30 parts per billion
actually stimulated phytoplankton growth (Gordon and Prouse, 1973).
Lowering the hydrocarbon levels in formation-water discharges is techni
cally feasible, but the resulting increase in costs and the loss in energy
output are difficult to reconcile.
Although a cost-benefit approach may be both difficult and publicly
unacceptable when the issues involve ocean-floor disturbances to sea life,
conflicts with commercial fishing, and disturbances to onshore species and
migratory fish and mammals, application of expensive restrictions should
be preceded by demonstrable evidence that some benefit will indeed result.
Efforts to protect valuable environmental resources have at times imposed
restrictions based more on emotions than on scientific thought. Admit
tedly, restrictions against needless discharges must be diligently
enforced, and additional environmental research and protection funds
should be directed toward solving specific problems. In conjunction with
the National Research Council Marine Board, Straughan (1975) outlined such
a problem-oriented approach.
This report has presented statistics on one important problem associ
ated with offshore oil and gas production. Similar statistical files will
be developed to monitor operations in frontier areas. The frequency of
inspections will be increased for initial exploratory operations in these
areas. The causes of oil spillage in all offshore areas will be constantly
examined, and efforts made to reduce them. Further modifications in the
data system will better identify trouble areas.
SELECTED REFERENCES
Adams, M. V., John, C. B., Kelly, R. F., LaPointe, A. E., and Meurer, R. W., 1975, Mineral resource management of the Outer Continental Shelf: U.S. Geol. Survey Circ. 720, 32 p. [reprinted 1976].
Alien, A. A., and Schlueter, R. S., 1969, Estimates of surface pollution resulting from submarine oil seeps at Platform A and Coal Oil Point: Santa Barbara, Calif., General Research Corp. Tech. Memo. 1230, 43 p.
22

Anderson, J. W., 1975, Laboratory studies on the effects of oil on marine organisms An overview: Am. Petroleum Inst. Pub. 4249, 70 p.
Battelle Pacific Northwest Laboratories, 1973, Effects of oil andchemically dispersed oil on selected marine biota A laboratorystudy: Am. Petroleum Inst. Pub. 4191, 104 p.
Fisher, P. J., 1975, Natural gas and oil seeps, Santa Barbara Basin, California: California State Univ. at Northridge, Dept. Geosciences, spec. rept. prepared for Natl. Oceanic and Atmospheric Admin., Sea Grants 04-3-158-45, 04-5-158-20, 37 p.
Fisher, P. J., and Stevenson, A. J., 1973, Natural hydrocarbon seeps along the northern shelf of the Santa Barbara Basin, California: Offshore Technology Conf., 5th Ann., Houston, Tex., 1973, Paper 1738, 10 p.
Garvey, Gerald, 1972, Energy, ecology, economy: New York, W. W. Norton and Co., 235 p.
Gordon, D. C., Jr., and Prouse, N. J., 1973, The effects of three different oils on marine phytoplankton photosynthesis: Dartmouth, Nova Scotia, Bedford Inst. Oceanography.
Harris, W. M., Piper, S. K., and McFarlane, B. E., compilers, 1976, Outer Continental Shelf statistics Oil, gas, sulfur, salt, leasing, drilling, production, income, 1953 through 1975, calendar year 1975: U.S. Geol. Survey Conservation Div. Spec. Rept., 91 p.
McCulloh, T. H., 1969, Geologic characteristics of the Dos Cuadras offshore oil field [California], in Geology, petroleum development, and seismicity of the Santa Barbara Channel region, California: U.S. Geol. Survey Prof. Paper 679-C, p. 29-46.
National Academy of Sciences, 1975, Petroleum in the marine environment A report by the Ocean Affairs Board on the inputs, fates, and the effects of petroleum in the marine environment (Conf. at Airlie, Va., May 21-25, 1973): Natl. Acad. Sci., 107 p.
Sharp, J. M., and Tyson, J. W., compilers, 1974, The offshore ecology investigation Final project planning council consensus report: Galveston, Tex., Gulf Universities Research Consortium (GURC) Rept. 138, 39 p.
Smith, R. A., Slack, J. R., and Davis, R. K., 1976, An oilspill risk analysis for the Mid-Atlantic Outer Continental Shelf lease area: U.S. Geol. Survey Open-File Rept. 76-451, 24 p.
Staff, Offshore (Magazine), 1975, Worldwide drilling and production report: v. 35, no. 7, p. 71-93.
23

Straughan, Dale, 1971, Summary of biological effects of oil pollution in the Santa Barbara Channel, Part I: Allan Hancock Foundation, Southern California Univ., News Release, 9 p.
1972, Factors causing environmental changes after an oil spill:Jour. Petroleum Technology, v. 24, p. 250-254.
______1975, Environmental studies as they relate to offshore petroleum operations, Appendix I, Fourth report of the review committee on safety of OCS petroleum operations: Natl. Research Council, Marine Board, p. 9-25.
(U.S.) Council on Environmental Quality, 1974, OCS oil and gas An environmental assessment: Washington, Council Environmental Quality Rept. to the President, v. 1, 214 p.
U.S. Geological Survey, 1972, Outer Continental Shelf lease management study Safety and pollution control: Washington, U.S. Geol. Survey Water Resources Div. Systems Lab. Group Rept., 116 p.
24

FIGURES AND TABLES


Table 1. Annual production (barrels) of oil and condensate
from all operations on the Outer Continental Shelf (PCS) ,
1971-75
Calendar year
1971.....19721973.....1974.....1975.....
Gulf of Mexico OCSLouisiana
385,760,351 387,590,662 374,196,856 342,435,496 313,592,559
Texas
1,685,047 1,733,018 1,617,829 1,381,825 1,340,136
Pacific OCSSanta Barbara Channel
31,103,548 22,562,213 18,915,314 16,776,744 15,304,757
Total. 1,803,575,924 7,757,855 104,662,576
TEXAS
San Antonio
VALABAMA
!
100 MILES
I 50
i r100 150 KILOMETERS
1. Padre Island2. Mustang Island3. Matagorda4. Brazos5. Galveston6. High Island7. West Cameron
AREAS
8. East Cameron9. Vermilion
10. South Marsh Island11. Eugene Island12. Ship Shoal13. South Timbalier14. South Pelto
15. Grand Isle16. West Delta17. South Pass18. Main Pass19. Breton
Sound20. Chandeleur
Figure 1. Index map showing Outer Continental Shelf leasing areas off Texas and Louisiana. Line indicates 600-foot water depth.
27

1600
1400
1200
1000
111 DC DC< 800
HI
0 600
400
200
1515
I
Volume of spills
Number of spills
847
337
670
207
454 456
166
I105
I
1600
1400
1200
1000
800
600
400
200
1971 1972 1973 1974 1975
Figure 2. Number and volume of 1- to 50-barrel spills by year, 1971-75, Gulf of Mexico Outer Continental Shelf.
28

Table
2. Number an
d vo
lume
of sp
ills
each y
ear,
19
71-7
5,
to
vo
Gulf
of Me
xico
Out
er
Spil
ls of
less th
an 50 barrels
Year
1971
....
.19
72..
...
1973.....
1974.....
1975.....
1971
....
.1972.....
1973.....
1974
....
.1975.....
Less th
an
1 bbl
913
953
1,00
5 1,
051
1,02
1
228
238
251
263
255
1-14
bbl 321
202
162 75
100
1,00
8 70
3 58
5 329
344
15-49
bbl 11 4 4 3 5
257 91
85
75
112
Tota
l
1,245
1,15
9 1,
171
1,12
9 1,126
Tota
l
1,493
1,032
921
667
711
50-4
99
bbl
Numb
er of
11 2 1 6 2
Cont
inen
tal
Shelf
Spil
ls500-999
bbl
spil
ls
0 0 0 0 0
volu
me (b
arre
ls)
of
1,28
5 150
240
675
266
0 0 0 0 0
of 50 barrels
or mo
re
1,00
0-
9,999
bbl 0 0 3 1 0
spil
ls
0 0 21
,935
2,
213 0
10,000
bbl
or more
0 0 0 1 0 0 0 0 19,833 0
Total 11 2 4 8 2
1,285
150
22,1
75
22,7
21
266
All
spills
Total
1,256
1,161
1,17
5 1,137
1,128
2,778
1,182
23,0
96
23,3
88
977
I/
Includes se
ven
spills of
50 barrels
each
: 5
spil
ls in
19
71,
and
1 spill
each in 19
72 and
1974.

Table 3. Causes of oil spills of more than 50 barrels, 1971-75,
Gulf of Mexico Outer Continental Shelf
Cause Number of spills
Total volume (bbl)
Volume (bbl) per spill Maximum Minimum
Production-platform equipmentmalfunction or misuse............
Pipeline leaks and breaks..........Drilling and workover mishaps......Barge spill (leak; or
oil transfer)....................Workboat spillage during unloading
of diesel fuel; or collision with platform....................
Other causes.......................
10,92527,396
0
7,100
9,93519,833
0
7,000
506320
240200
75700
100
100120
Table 4. Causes of oil spills of 1-50 barrels, 1971-75,
Gulf of Mexico Outer Continental Shelf
Cause Number Total Volume (bbl) per spill of spills volume (bbl) Average Maximum Minimum
Production-platform equipment malfunction or misuse..........
Pipeline and pump failure........Drilling and workover mishaps....Miscellaneous-equipment failures
and employee errors............
53623220
84
2,2861,105.5
64.5
440
4.264.753.23
5.24
503510
36
30

Tabl
e 5. Oil spills of more than 1,000
barrels, 19
71-7
5,
Gulf o
f Me
xico
Outer Co
ntin
enta
l Shelf
[Not
e:
No spills of
th
is m
agnitude o
ccurred
in 19
71,
1972,
1975
]
Date
Jan.
9.
....
...
Jan.
26
....
...
May
12. ..
....
.
Volume (bbl)
Loca
tion
. ,
, ,
spil
led
1973
West
Del
ta Block 79
, 9,935
OCS-
G 14
49,
plat
form
A.
South
Pelto Block
23,
7,000
OCS-G
1238.
West
Del
ta Blo
ck 73
, 5,000
16- inch p
ipeline
to
Gran
d Is
le B
lock
16
.
Cause
Structure
supporting oi
lst
orag
e ta
nk be
nt,
rupt
ured
tank.
Barge
developed
a leak in
heavy
seas
and
par
tially sank,
rele
asin
g oi
l.
Inte
rnal
co
rros
ion
caus
ednumerous p
ipeline
leak
s.
1974
Apri
l 17
,
Sept.
9.
Euge
ne Island Block 31
7,
19,833
Bonita p
ipeline.
Main Pa
ss Block 73
, 2,213
Cobia
pipeline.
Drag
ging
anchor sn
agge
d an
d ru
ptur
ed p
ipel
ine.
Pipeline break
apparently
caus
ed by
hu
rric
ane.

Table 6. Blowouts resulting in pollution, casualties, or property damage,
1971-75, Gulf of Mexico Outer Continental Shelf
Date Location _ ^ Volume^P* °f (bbl) accident ^^
Casualties, property damage
Blowouts during drilling
March 3-6,1971
Dec. 3-5,1972
May 5-26,1973
Oct. 1-2,1973
March 19,1975
West Came r onBlock 639,OCS-G 2027,well 1.
South PassBlock 78,OCS-G 2185,well 2.
South Marsh IslandBlock 268,OCS-G 2310,well 2.
West Came r onBlock 543,OCS-G 2010,platform A,well A-4.
High IslandBlock A-471,OCS-G 2690,well 1.
Gas blowout, at well 0depth 3,956 ft.
Gas blowout, 3,850 ft.; 0last string ofcasing set at1,018 ft.
Gas blowout during 0drilling, depth11,393 ft.
Blowout, explosion, 0and fire; gas; welldepth 8,540 ft.
Gas blowout, 1,150 ft. 0
Blowout-preventerassembly and drillpipe lost; welllost.
Rig collapsed and waslost in crater.
Well lost.
Three men injuredslightly; allplatform equipmentdestroyed or badlydamaged.
Well and rig lost.
Blowouts during nondrilling operations
Oct. 16-Dec. 10,1971
June 10,1974
Dec. 22-31, 1974
June 12,1975
Eugene IslandBlock 215,OCS-0678,platform B.
South PeltoBlock 20,OCS 073,platform 13,well 13.
South PeltoBlock 19,OCS 073,platform 12,well 12.
South Marsh IslandBlock 50,OCS 0788,platform B.
Explosion and fire at 450oil pump.
Casing valve broke 75off wellheadduring hurricane.
Casing and tubing 200sheared at mudlineduring hurricane-damage repair.
Well blew out during (I/)completion operations.Gas burned for 2 days.
Production platformand equipmentlost.
None.
None.
Platform drilling deckand equipmentdamaged by fire.
I/ Some condensate was discharged as a result of this incident. When the platform is repaired, production is begun, and more reservoir data are obtained, spillage will be estimated.
32

MANUAL EMERGENCY
SHUT-IN VALVE ON
HELICOPTER DECK
SEPARATOR
PLATFORM DECK \
MANUAL EMERGENCY SHUT-INVALVE ON RIG FLOOR
RELIEF VALVE
REGULATOR
3-WAY VALVEQUICK EXHAUST VALVE
PRESSURESENSORSURFAC SAFETY VALVES
HIGH/LOW PRESSURELOW-PRESSURE CONTROL LINES
STRUCTURAL CASING (DRIVE PIPE)
100'+ DEPTHS BELOW OCEAN FLOOR
CONDUCTOR CASING 500'-1000'
MANUAL EMERGENCYSHUT-IN VALVE
AT BOAT LANDING /PRODUCTION CASING JSUBSURFACE SAFETY
VALVE
HIGH/LOW PRESSURE SENSOR
-SURFACE CASING 1500'-4500'
-INTERMEDIATE CASING 8000'- 10,000'
Figure 3. Schematic diagram showing casing program and production safety system of a typical 12,000-foot-deep well, Gulf of Mexico.
Table 7. Causes of 1- to 50-barrel spills on production platforms,
1971-75, Gulf of Mexico Outer Continental Shelf
[Note: Some incidents fall in more than one category, and therefore the total shown here exceeds the total number of production-platform spills shown in table 4. Also, the individual totals for the first three categories shown here are less than the sums of the itemized entries in table 8]
System that failedNumber
of spills
Totalvolume(bbl)
Volume (bbl) per spillMaxi- Mini-
Average
Sump system..........................Other hydrocarbon-handling equipment. Separator system.....................Well and header system...............Flare line system....................Heater treater system................
159139113
855424
627.5695407473188.592.5
9500605649
3.85
505050503010
111111.5
33

SEPARATOR
SAFETY DEVICES
1. SUBSURFACE SAFETY DEVICE2. HIGH/LOW PRESSURE SENSORS3. HIGH/LOW LEVEL SENSORS4. PRESSURE RELIEF VALVES5. FLOW CHECK VALVES6. AUTOMATIC VALVES7. COMBUSTIBLE GAS SENSORSB. MANUAL EMERGENCY SHUTDOWNS
FREE WATER KNOCKOUT
WATER
: OIL THEATER
SHORE
WATER TREATING
Figure 4. Simplified flow diagram for offshore oil and gas production.
34

1000
900
800
700
600
DC DC < 500
400
O 300
200
100
927
Volume of spills
Number of spills
470 471
1971
119
247
103
171
41
1972 1973 1974
PRODUCTION-PLATFORM SPILLS
1975
1000
900
800
700
600
500
400
300
200
100
1971
' «tUU
CL CO
LL
o_ 300toLU
DC
§ 200
LU
^Do 100
J<0 n
373
-
-
224
72\-\^
v^\\N
50
i
223
52
^$$;
150
4 « »-"»
IO-C
27
\\>l
3-1O 1
\>^|
«tuu
300 w_io. toLi-
200 oDCLUCD
100 i
n1972 1973 1974
PIPELINE AND PUMP SPILLS
1975
Figure 5. Number and volume of 1- to 50-barrel spills, by year, 1971-75, for production platforms and for pipelines and pumps, Gulf of Mexico Outer Continental Shelf.
35

Table 8. Causes of 1- to 50-barrel spills on production platforms, 1971-75,
Gulf of Mexico Outer Continental Shelf, grouped according to system that failed
Specific causeNumber Total
of volumespills (bbl)
Volume (bbl) per spill Maxi- Mini mum mum
Average
Sump system
Sump carried under or overfilled........ 58 233 4.02 50 1Sump pump failed........................ 54 192 3.56 30 1High-level control failed............... 22 144.5 6.57 5 1.5Skimmer tank high-level control failed.. 13 42 3.23 10 1
Pump intake clogged..................... 5 32 6.40 25 1Sump system leaked...................... 3 14.5 4.83 10 1.5Miscellaneous........................... 23 72.5 3.15 5 1
Separator system
High-low level control failed........... 29 81 2.79 10 1Dump valve failed....................... 27 118.5 4.39 20 1.5High-low pressure sensor failed......... 19 40.5 2.13 5 1Separation vessel or lines leaked....... 12 30 2.50 4 1
Relief valve failed..................... 8 18 2.25 4 1Inlet valve failed...................... 3 12 4.00 91Miscellaneous........................... 32 151 4.72 50 1
Other hydrocarbon-handling equipment
High-low level control failed........... 62 378 6.10 50 1Dump valve failed....................... 21 93 4.43 12 2Tank or line leaked..................... 9 32 3.56 6 2Relief valve failed..................... 4 10 2.50 3 2
Discharge line ruptured................. 3 14 4.67 10 2Discharge line plugged.................. 2 3 1.50 2 1Tank ruptured........................... 2 8 4.00 53Valve leaked or cut out................. 2 28 14.00 25 3
High-low pressure sensor failed......... 2 14 7.00 95Sight tube loosened..................... 2 29 14.50 20 9Bull plug broke......................... 1 1 1.00 1 1Miscellaneous........................... 34 114 3.35 22 1
36

250
200
150
100
50
207
1
66
49
49
43
110
20
17
34
39
Separator system
Well and header system
Sump system
Other hydrocarbon-handling equipment
95
I
20
30
36
39
1
1
20
10
45
26
11
1971 1972 1973 1974 1975
Figure 6. Principal causes of production-platform spills of 1-50 barrels, by year and number of spills, 1971-75, Gulf of Mexico Outer Continental Shelf.
37

50
40
30
20
10
44
27
1971
29
14
10
1972
27
17
Sump carried under or overfilled
Sump tank high-level control failed
Sump pump failed
1973
15
1974
19
1975
Figure 7. Principal causes of sump-system spills of 1-50 barrels on production platforms, by year and number of spills, 1971-75, Gulf of Mexico Outer Continental Shelf.
38

50
40
30
20
10
48
23
16
Sump system
Separator system
Other hydrocarbon-handling equipment
26
21
1517
11
1971 1972 1973 1974 1975
Figure 8. Number of 1- to 50-barrel spills involving failures of high-low level controls on production platforms, by year, 1971-75, Gulf of Mexico Outer Continental Shelf.
39

400
300
CO
LU DC DC < 200
LU
100
363
99
46
114
104
215
34
43
70
68
1971 1972
Miscellaneous pipeline and pump incidents
Pipeline pump failed
Discharge or transfer line ruptured, or coupling failed
Pipeline ruptures and leaks
219
I
i
15
75
42
87
1973
140
1iI
117
1974
128
11
37
89
1975
Figure 9. Principal causes of pipeline and pump spills of 1-50 barrels, by year and volume of spills, 1971-75, Gulf of Mexico Outer Continental Shelf.
40

Table 9. Causes of
1-
to
50-
barr
el spills from pip
elin
es and
pump
s,
1971-75, Gu
lf of
Me
xico Outer Continental
Shelf
Cause
Numb
er
Tota
lof
volume
spills
(bbl)
Volu
me (bbl)
per
spil
lMaxi-
Mini-
Average
mum
mum
Pipeline leaked.....................
Pipeline ru
ptur
ed..
....
....
....
....
.Di
scha
rge
or tr
ansf
er line ru
ptur
ed
or co
upli
ng failed................
Pipeline pump failed................
Pig
trap
le
aked
....
....
....
....
....
.Hi
gh-l
ow pressure
sensor fa
iled
....
.
Fuel
line le
aked
....
....
....
....
....
Pump ca
paci
ty ex
ceed
ed..
....
....
....
Miscellaneous.......................
63 20 54 42 12 3 2 1 39
303.
516
1
237
211 35 18 3 2
152
4.82
8.05 39 02
2.92
6.00 50 00
3.90
35 32 27 20 10 8 2 2 12
1.5
2 1 1 1 4 1 2 1

Table 10. Frequency of spills among production platforms
Number of spills per platform
1.....2.....3.....
4.....5.....6.....
having at least one 1- to 50-barrel spill,
Gulf of Mexico Outer Continental Shelf
Number of platforms having
spills
1886723
1343
Number of spills per platform
7......8......9......
10......11......12......
Total.
1971-75,
Number of platforms having
spills
4 01
0 01
.... 304
42

70
60
50
w 40
30
20
10
67
22
11
22
12
46
12
14
12
ill Miscellaneous pipeline andLiiij pump incidents
I Pipeline pump failed
I.V.Y.J Discharge or transfer line ruptured. L-i-1 or coupling failed
i Pipeline ruptures and leaks
50
17
13
17
25
1
117
30
11
25
1971 1972 1973 1974 1975
Figure 10. Principal causes of pipeline and pump spills of 1-50 barrels, by year and number of spills, 1971-75, Gulf of Mexico Outer Continental Shelf.
43

3000
2000
1000
900
800
700
600
500
400
300
200
100 90
SO
70
60
50
40
30
20
10
Number of fixed structures at end of year
2001 2079
1800
Number of complexes with one or more producing wells
(est J^^ ____
900 (est.) 930 (est.) Number of major structures
at end of year
J74 Number of structures having production spills during year
85
1970 1971 1972 1973 1974 1975
Figure 11. Comparison, by year, of the number of structures having spills with the total number of fixed and major structures. A major structure is defined as having two or more pieces of production equipment and (or) more than five producible completions.
44
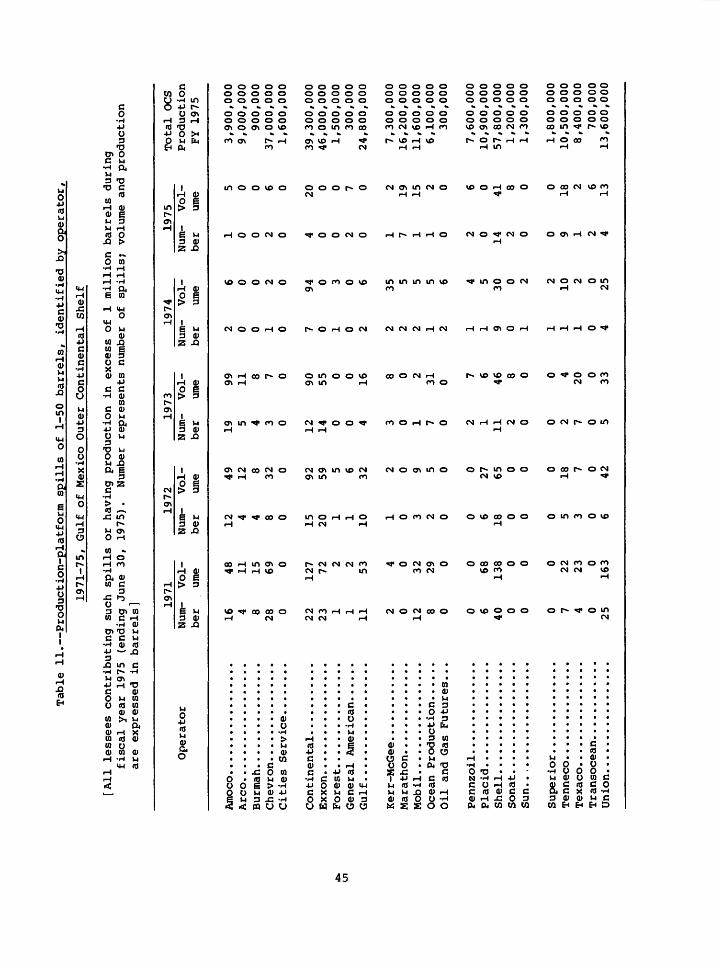
Tabl
e 11. Production-platform
spills of 1-
50 ba
rrel
sf id
enti
fied
by o
perator
,
1971-75,
[All le
ssee
s contributing such spills
fiscal y
ear
1975
(ending
June 30,
are
expr
esse
d in barrels]
1971
Operator
ATnf
irn
A fr^
r\
Chev
ron.
...
....
....
...
Citi
es Se
rvic
e. ...
....
Cont
inen
tal.
...
....
...
Fore
st. ...............
General
American. ..
...
Gulf
....
....
....
....
..
Kerr
-McG
ee. ...........
Mara
thon
. ..
....
....
...
Mobi
l...
....
....
...
...
Ocean
Prod
ucti
on. ..
...
Oil
and
Gas
Futu
res.
..
Shell.................
Sun.
..................
fpo y s\
ff^
Num
ber 16 4 8 28 0 22
231 1
11
2 0 12
8 0 0 6 40 0 0 0 7 4 0
25
Vol
ume 48
11
15
69 0
127 72 2 2
53
4 0 32
29 0 0
68
138 0 0 0 22
23 0
163
Gulf
of
Mexico Outer
Cont
inen
tal
Shel
f
or ha
ving
production in ex
cess
of
1 million barrels
duri
ng
1975
) .
Number represents nu
mber
of spil
ls;
volume an
d production
1972
Num
ber 12 4 4 8 0
15
201 1 10
1 0 3 2 0 0 6 18 0 0 0 5 3 0 6
Vol
ume 49
12
8 32 0
92
59 5 6 32
2 0 9 5 0 0 27
65 0 0 0
18 7 0
42
1973
Num
ber 19 5 4 3 0
12
14 0 0 4 3 0 1 7 0 2 1
11 2 0 0 2 7 0 5
Vol
ume 99 11
8 7 0
90
55 0 0
16 8 0 2 31
0 7 6 46
8 0 0 4 20 0
33
1974
Num
ber 2 0 0 1 0 7 0 1 0 2 2 2 2 1 2 1 1 9 0 1 1 1 1 0 4
Vol
ume
6 0 0 2 0
94 0 3 0 6 35 5 5 5 6 4 5
30 0 2 2
10 2 0
25
1975
Num
ber 1 0 0 2 0 4 0 0 2 0 1 7 1 1 0 2 0 14 2 0 0 9 1 2 4
Vol
ume
5 0 0 6 0
20 0 0 7 0 2
19
15 2 0 6 0 41 8 0 0
18 2 6
13
Total
OCS
Production
FY 19
75
3,90
0,00
0 9,000,000
900,
000
37,000,000
1,600,000
39,300,000
46,000,000
1,50
0,00
0 300,000
24,800,000
7,300,000
16,200,000
11,600,000
6,100,000
300,000
7,600,000
10,900,000
57,800,000
1,200,000
1,300,000
1,800,000
10,500,000
8,400,000
700,
000
13,600,000

2.4
2.0
1.6
1.2
0.8
0.4
Figure 12. Estimated volumes of petroleum hydrocarbons introduced annually into the world's oceans, in millions of metric tons. Numerical breakdown of categories is shown in table 12.
46

Tabl
e 12. Budget o
f petroleum hy
droc
arbo
ns into th
e oc
eans
[Data
from Nat
iona
l Academy
of Sc
ienc
es (1
975)
; LO
T, lo
ad-o
n-to
p]
Input
rate (m
illi
ons
of me
tric
tons an
nual
ly)
Perc
enta
geSo
urce
Tran
spor
tati
on
LOT
tankers. .............
Non-LOT
tankers. .........
Dry
dock
ing.
...
....
....
..Terminal operations. ...
..
Tni^^oi'" n f*f
* \ A An ̂G
Woi
1^ ̂antckK n^oi/^on^c
f"*^nc^a1
** dkf "i
no TT
i ac
Atmospheric
rain
out
I/. ....
Coastal
muni
cipa
l wastes...
Coas
tal,
nonrefining,
Urban
runo
ff. ....
....
....
..River
runo
ff. ..............
SUBT
OTAL
....
....
....
VI n ̂ M i
** n 1
<3 £k AT^ <S
TOTAL...............
Prob
able
0.08-0
0.15-0
0.65
-1
0.2-0
0.00
015-
0 0.4-0
0.12-0
0.02-0
0.2-0
0.4-0
0.1-0
0.2-1
Best
range 3
estimate
.15
0.08
.4
.31
.0
.77
.3
.25
.005
.003
.7
.5
.25
.2
.15
.1
.3
.2
.8
.6
. 3
. 3.5
.3
1.6
5.51
3
.0
.6
6.113
of
total
1.3
34.9 3.3
9.8
4.9
4.9
4.9
26.2
90.2
9.8
100.0
I/
Based
upon
10
percent
retu
rn from th
e at
mosp
here
.