Oil Search Annual Report 2011-ccc7105b-7f11-41ef-a772-953454625959-0
146
2011 ANNUAL REPORT Building future… our
Transcript of Oil Search Annual Report 2011-ccc7105b-7f11-41ef-a772-953454625959-0

2011 ANNUAL REPORT
Building future… our


Oil Search was established in Papua New Guinea (PNG) in 1929. The Company operates all of PNG’s currently producing oil and gas fields.
The Company’s main growth asset is its 29% interest in the PNG LNG Project, a world scale LNG development operated by ExxonMobil. The US$15.7 billion Project is two years into a four year construction schedule, with first LNG sales on target to commence in 2014. The Project will add approximately 18 million barrels of oil equivalent (mmboe) to Oil Search’s production in its first full year of operation.
Oil Search is pursuing additional LNG growth opportunities, both within the PNG LNG Project and offshore in the Gulf of Papua, and has other exploration interests in PNG and the Middle East/North Africa.
At December 2011, the Company’s proven reserves were 330 mmboe, while proven and probable reserves were 553 mmboe. The Company also had 318 mmboe of 2C resources, taking total 2P and 2C reserves and resources to 870 mmboe.
The Company is listed on the Australian Securities Exchange (Share Code: OSH), the PNG POMSOX exchange and has an ADR programme (Share Code: OISHY). The PNG Government is Oil Search’s largest shareholder with a 15% interest.


3

4

Over the five year period to the end of 2011, Oil Search generated a Total Shareholder Return of just over 100%. The 2010 Strategic Review indicated that there is the potential to achieve top quartile performance for at least the next five years by utilising the existing asset base and skills within the Company.
Oil Search’s key strategies to drive this growth are:
• Optimising the performance of the PNG oil fields.
• Supporting ExxonMobil on the delivery of the PNG LNG Project, on time and within budget.
• Establishing further contractable gas reserves in the PNG Highlands, to underwrite an expansion of the PNG LNG Project.
• Discovering gas reserves in the Gulf of Papua to support a standalone LNG development.
• Actively evaluating longer term international growth opportunities.
• Optimising the Company’s financial and capital structure to ensure it has the financial strength to fund both its current obligations as well as its many growth opportunities.
• Ensuring Oil Search maintains its world class safety performance and operates in a sustainable manner, leaving a positive legacy in the areas in which it operates.


7
9 2011 Highlights
10 Report from the Chairman
12 Managing Director’s Report
18 2011 Financial Report
22 PNG LNG Project
28 Gas Growth
32 Production and Exploration
38 2011 Reserves and Resources
40 Licence Interests
42 Oil Search People
44 Sustainability
> A Strategic Sustainability Approach
> Operational Integrity
> Community Development
> Community Health
> Environment
54 Corporate Governance
63 Financial Statements Contents
64 Directors’ Report
92 Financial Statements
136 Shareholder Information
Central Processing Facility, Southern Highlands Province, PNG8

07 08 09 10 11
(m
mbo
e)
8.69.8
8.1 7.76.7
PRODUCTION
6.7mmboeProduction for 2011 was at the upper end of guidance, at 6.7 million barrels of oil equivalent (mmboe) . While lower than in 2010, the result was achieved despite a planned two-week facilities shut down, with natural decline largely offset by successful field work.
07 08 09 10 11
(U
S ce
nts)
88
4 4 4
DIVIDEND PER SHARE
4 US¢Dividend payments for 2011 totalled four US cents per share. This was consistent with 2010 and reflects a balance between funding growth activities, such as the PNG LNG Project, while rewarding shareholders.
07 08 09 10 11
(U
S$/b
bl)
100
7865
80
116
REALISED OIL PRICE
US$116/bblGlobal oil prices rose substantially in 2011, due to an increasing demand for crude. This was reflected in Oil Search’s average realised oil price, which was 45% higher than in 2010 at US$116 per barrel.
07 08 09 10 11
(p
er m
illi
on
hou
rs w
orke
d)
2.042.05
1.16
1.961.85
TOTAL RECORDABLE INCIDENTS
6%Oil Search’s safety performance improved slightly in 2011, with a Total Recordable Incident Frequency Rate of 1.85 per million hours worked. The Company continues to focus on maintaining a downward trend in safety incidents.
2011 HIGHLIGHTS
NET PROFIT AFTER TAX including significant items
US$202.5mNet profit after tax and significant items increased 9% to US$202.5 million. The improvement reflected stronger sales revenue, driven by higher oil prices, as well as good cost control and lower exploration expensed. 07 08 09 10 11
(U
S$ m
illi
on)
313.4
137.9 133.7
185.6 202.5
9

REPORT FROM THE CHAIRMAN
2011 was a year of solid progress. The PNG LNG Project advanced well, healthy cash flows were generated from operations and preparations were made for an extensive, and potentially transformational, future drilling programme. Oil Search enters 2012 in a strong position: the Company has a clear long term growth strategy that will generate value for shareholders and it has the necessary balance sheet strength to deliver this strategy.
Brian Horwood, Chairman
10

ImPROVED PROFIT PERFORmANCE Net profit after tax in 2011 was US$202.5 million, 9% higher than in 2010. Excluding significant items, net profit increased 64% to US$235.7 million. This was a good outcome in light of lower oil production and cost pressures in PNG caused by the inflated local economy. The result was boosted by a sharp increase in global oil prices, as well as prudent cost management and lower exploration expensed.
STABLE DIVIDEND PAymENTSThe Board approved dividend payments for the 2011 year of four US cents per share. This was in line with 2010 dividend payments. When determining the dividend, consideration was given to improved profitability, balanced by the high expenditures currently being incurred from funding the PNG LNG Project and other growth projects. The Board’s present intention is to maintain consistent dividends until the commencement of cash flows from the PNG LNG Project. At this time, dividends will be realigned, based on the sustained level of underlying earnings and future capital requirements.
PNG LNG PROjECT Steady progress was made by the Operator, Esso Highlands Limited, a subsidiary of Exxon Mobil Corporation, in the construction of the PNG LNG Project. In 2011, Oil Search successfully undertook a range of LNG Project-related works for which it is responsible and looks forward to completing these activities in 2012, consistent with the Project schedule.
The Operator has recently confirmed that it expects LNG deliveries to commence in 2014, in line with the target set when the Project was approved over two years ago. It also recently announced an increase in the Project budget, to US$15.7 billion. This is primarily due to foreign exchange fluctuations with other cost components largely unchanged. Based on the current outlook, Oil Search is confident it has adequate funds and loan facilities to meet its financial obligations for the successful completion of the Project.
SAFETy PERFORmANCESafety performance in 2011 was slightly better than in the previous year. This was achieved despite the challenges of undertaking construction for the PNG LNG Project within Oil Search’s operating plant facilities and the employment of a large number of new contractors. The Company’s focus remains on improving safety awareness, conducting intensive safety training, particularly for new employees, and ensuring safe work conditions despite the more difficult operating environment.
BUSINESS GROwTHThe Company is actively pursuing the many growth opportunities identified in the 2010 Strategic Review. If these activities are successful, they have the ability to create significant value over and above the large increase that will arise from the commissioning of the PNG LNG Project in 2014. A key objective is to find more gas in the Highlands of PNG and in the Gulf of Papua, both of which have high prospectivity. In addition, Oil Search is actively exploring for oil within and near the PNG oil fields and in selected countries in the Middle East/North Africa (MENA).
PNG GOVERNmENTDuring 2011, there was considerable political instability within PNG, with the leadership of the country changing in the second half of the year. Neither Oil Search operations nor its employees were adversely affected by these changes, but the Company remains vigilant to ensure that activities are not disrupted in this more uncertain environment. The political situation will likely remain challenging until the national elections are held in mid-2012. We look forward to working with the incoming Government.
EmPLOyEES AND BOARDThe Board would like to acknowledge the efforts made by employees during 2011 and thank them for their contribution. Several senior executives retired during the year, requiring significant planning to ensure their departures were adequately covered.
Of particular note in 2011 was the excellent performance of Oil Search employees and contractors involved in work associated with the PNG LNG Project, with construction in the oil fields completed safely and on schedule despite the very challenging environment.
The directors undertook additional training during 2011, to better equip them to meet the increasing corporate governance requirements arising from the impact of the global financial crisis. I want to thank the directors for the contributions they made to Board and Committee deliberations during the year.
11

MANAGING DIRECTOR’S REPORT
The focus for Oil Search in 2011 was on building for the future. Full scale construction on the PNG LNG Project commenced and work took place on establishing the building blocks for Oil Search’s next phase of expansion. These activities were underpinned by the Company’s highly profitable oil production. The Company has now embarked on the largest drilling programme in its history, designed to evaluate the potential of its assets in the PNG Highlands and the Gulf of Papua, to support LNG growth beyond the PNG LNG Project’s Trains 1 and 2.
Peter Botten, Managing Director
12

PNG LNG PROjECT After more than a year of site preparation and infrastructure development activities, major construction on the PNG LNG Project started in 2011. Building work took place at multiple site locations across the country, from the PNG LNG plant site near Port Moresby, offshore and onshore along the pipeline route, through to the Hides Gas Conditioning Plant and Komo airfield in the Southern Highlands. The Project is now two years into the four year construction schedule. While there were some difficulties early in the year, particularly in the Highlands, they have been resolved and the Project remains on track for a 2014 start-up.
Towards the end of the year, the Operator, Esso Highlands Limited, advised an increase in the capital budget, from US$15.0 billion to US$15.7 billion, primarily reflecting foreign exchange impacts. Pleasingly, other elements of the capital budget are largely unchanged, despite the significant cost pressures facing the LNG industry at present. Oil Search is able to comfortably fund its share of this increase through the existing financing arrangements.
The PNG LNG workforce continued to grow, with more than 14,300 people employed by the Project at the end of 2011, of which over 8,500 are PNG citizens. In line with the Project’s commitments on national content, almost US$1 billion (K2.1 billion) was placed with local contractors and suppliers during the year and training of PNG nationals, in both construction skills and operations and maintenance, is ongoing.
GAS GROwTH During the year, Oil Search continued to work on determining the requirements for a potential expansion of the PNG LNG Project, from two to three LNG trains.
A reassessment of gas reserves within all the PNG LNG Project dedicated fields will occur following development drilling on the Hides gas field (as part of the PNG LNG Project development) and the completion of a comprehensive review of gas deliverability from the oil fields, which will establish the upside potential.
In addition to these PNG LNG field-focused activities, in 2011, a gas resource maturation programme in non-Project, high potential licences in the Highlands was agreed with the Company’s various licence partners. Planned work includes the acquisition of seismic and exploration drilling. As part of the programme, in early 2012 the P’nyang South well was spudded. Results to date from this well have been highly encouraging, with a 184 metre gas column intersected in the primary objective.
In parallel, Oil Search made good progress in 2011 on maturing its Gulf of Papua acreage, with the completion of a major 3D seismic survey. This, together with a study of existing 2D seismic and previous well data, led to the identification of more than 30 potential leads and prospects, in six different play types, reinforcing the Company’s view that the Gulf area has sufficient gas prospectivity to support a standalone LNG project.
OIL PRODUCTION Oil Search’s 2011 production was at the upper end of expectations, at 6.69 mmboe. While 12.7% below 2010 levels, this was a good outcome given the maturity of the fields. Production was impacted by a planned facilities shutdown mid-year. The shutdown was required to allow the first phase of modification work to the facilities to be undertaken, to enable the oil fields to deliver gas to the PNG LNG Project and handle the Project’s liquids production. These activities were safely completed within the scheduled timeframe.
Near field exploration and development drilling was a 2011 success story, with three wells discovering oil within the existing producing field areas. Cash flow is already being generated from one of the three wells, which was brought into production within a few months of drilling, while production from the other two wells will contribute to 2012’s performance.
SAFETy PERFORmANCEThe Company’s primary measure of safety, total recordable incidents per million hours worked, improved slightly in 2011 to 1.85, from 1.96 in 2010. This was achieved despite a large increase in the contractor workforce, many of whom are new to PNG and to Oil Search’s strong safety culture.
Three major safety forums were held during 2011, focused on seeking ways to improve safety performance, resulting in a range of new initiatives being rolled out during the year.
13

DELIVERy OF 2010 STRATEGIC REVIEw INITIATIVESAs reported in last year’s Annual Report, in 2010 Oil Search undertook a comprehensive, bottom-up, strategic review of its business. The review confirmed that Oil Search has the capability to continue to deliver top quartile returns for at least the next five years, based on its existing assets and primary skills.
Eight major medium to long term strategies were defined to achieve superior growth performance. Progress in 2011 towards delivering on these strategies is shown in the table below:
Strategic objective Progress in 2011
1. Optimise the value of the oil and gas operations > Four development/near field appraisal wells (including a gas injector) were drilled, all of which were successful. Two new oil pools were discovered.
> The PL 2 Life Extension Project, designed to extend the life of the offshore crude export facility, commenced.
> Rigorous cost control was successful in limiting cost increases, despite inflationary pressures.
2. Maximise the value from the PNG LNG Project (T1/2)
> Oil Search provided ongoing support to the Operator, Esso Highlands, in areas such as benefits distribution and community affairs.
> The first phase of the Associated Gas (AG) Project, to modify the existing oil field facilities to accommodate PNG LNG Project requirements, was successfully completed.
3. Promote an early decision on a third LNG train (T3)
> Agreement was reached with various licence partners for a seismic and drilling programme in the Highlands, to mature gas resources that may be used for a third train.
4. Accumulate gas resources outside existing PNG LNG Project fields
> An extensive 3D seismic survey was acquired in the Gulf of Papua, with multi-tcf gas prospectivity identified.
5. Ensure Oil Search’s sustainability > A new sustainability corporate governance structure and a corporate sustainability function were established.
> The Oil Search Health Foundation, a not-for-profit charity, was formed.
> Oil Search became a signatory to the United Nations Global Compact.
6. Actively evaluate international growth opportunities
> A Production Sharing Contract over the Taza licence in the Kurdistan Region of Iraq was secured.
7. Optimise the Company’s financial and capital structure
> Progress was made towards refinancing the Company’s corporate debt facility.
8. Align the Company to deliver its corporate objectives
> A workforce capacity review was completed by the newly formed ‘People Development Group’.
MANAGING DIRECTOR’S REPORTCONTINUED
14

Installation of new CALM buoy at the Kumul Terminal, Gulf of Papua, as part of the PL 2 Life Extension project.
OPERATING CONDITIONS IN PNG There is no doubt that PNG LNG is a transformational project for PNG. The development, the largest ever undertaken in the country, has affected many aspects of life in PNG. Inevitably, the country is starting to feel some strains, both physically, in terms of logistics and infrastructure, and economically, with inflation of over 9% in 2011. Recent political events in PNG have challenged the operating environment and investor confidence in the country. It is pleasing to note that, despite this, Oil Search’s operation and activities continued uninterrupted by these events. The forthcoming National election represents an opportunity for the people to endorse a new Government that will have the responsibility to manage and distribute the benefits of resource development across the nation.
Unprecedented Investment ActivityWhile it is the largest, PNG LNG is not the only major project in PNG, with investment at historically high levels in the resources sector. Over the past ten years, Oil Search itself has invested over US$4.7 billion in PNG, with US$1.56 billion spent in 2011, and more than US$2 billion to be spent in 2012. It has contributed, on average, 24% of all company tax paid in PNG over the past five years.
Despite perceptions that it is a risky place in which to operate, Oil Search has achieved top quartile returns from investing primarily in PNG.
15

MANAGING DIRECTOR’S REPORTCONTINUED
Welding on the onshore section of the PNG LNG pipeline.
Fiscal Stability and TransparencyPNG is fortunate to have a stable, sound and sensible hydrocarbons fiscal regime, which is well supported by both Government and Opposition members in PNG. The regime delivers a balanced distribution of benefits between Government and developers, with substantial landowner involvement. Direct and indirect benefits to governments, landowners and developers have been flowing since production started in 1991 and are set to increase markedly once PNG LNG commences production. However, it is clear to all that better and more transparent management of these benefits is essential and the mechanisms for delivering benefits need to be improved.
Oil Search is working closely with various Government departments to assist, where it can, in ensuring future benefits are distributed in an equitable way, with improved transparency. The Company is supportive of the Extractive Industry Transparency Initiative (EITI) and in 2011 instigated a practice of verifying and publishing key payments made to governments and revenues received. The Company is also highly supportive of the creation of a Sovereign Wealth Fund, which it believes will be a major step forward in facilitating the management of benefits and the development of major social infrastructure.
Community RelationshipsOil Search recognises that its ability to operate in often remote and difficult areas is impacted by its relationships with affected communities. The Company’s approach is to be highly inclusive, involving landowners in a range of programmes, such as employment, landowner company business development and training and education opportunities, with landowners seen as partners, particularly in social and community development activities. All Oil Search’s activities are conducted within a framework of transparency and sustainability.
16

Oil Search’s most recent initiative is the formation of the Oil Search Health Foundation, a not-for-profit entity that will oversee an expansion of the Company’s health programmes in PNG. The Health Foundation has been selected as a Principal Recipient for the Global Fund to Fight AIDS, Tuberculosis and Malaria (Global Fund). The Health Foundation will manage over US$68 million over the next five years on behalf of the Global Fund, to deliver programmes for the prevention or alleviation of HIV/AIDS and malaria and the improvement of maternal and child health within PNG. Oil Search is one of only three public corporations globally to have received Principal Recipient status.
Activity by the Foundation will be progressively expanded across the country, with programmes planned in nine provinces in 2012. The Health Foundation will help to achieve benefits delivery in areas where basic health services are not well developed, outside the immediate oil and gas production operating areas.
OUTLOOk FOR 2012 AND BEyONDOil Search is about to embark on one of the most active phases in its history. In addition to the continued construction of the PNG LNG Project, a major drilling campaign has recently commenced, which is expected to continue through 2012 and into 2013.
PNG LNG Project2012 represents the year of peak activity for the PNG LNG Project. By the end of 2012, construction at the LNG plant site should be well advanced, the Komo airfield operational and deliveries of major equipment modules for the Hides Gas Conditioning Plant underway. The offshore pipeline and the section of the onshore pipeline from the coast up to the Kutubu fields are also expected to be completed during the year. Oil Search’s AG and PL 2 Life Extension projects are expected to be finalised, with the oil fields ready to provide commissioning gas by year end.
Gas Resource Definition in PNGAn integrated exploration, appraisal and reserves definition programme is now underway in the PNG Highlands. The key objective of this campaign is to determine the level of resources in and around the PNG LNG fields. The outcome of the first phase of drilling should be known by the end of 2012/early 2013.
In the Gulf of Papua, a number of preliminary targets have been identified and planning for an offshore drilling programme is underway, with the objective of commencing drilling late in the second half of 2012. As Oil Search does not have experience in operating highly complex LNG facilities, farm-in discussions are underway with a number of selected potential partners, all with world class LNG
expertise. The Company has received strong interest from companies wishing to consider this opportunity.
Near Field Oil Drilling OpportunitiesFollowing the success in 2011 in discovering new oil pools within or close to existing producing oil fields, Oil Search is maturing a number of drilling opportunities. While individually small in size, the value-add of near field discoveries is substantial, as they can be tied-in to existing surface facilities and commence generating cash flows within a short period of time. In order to take advantage of these opportunities, the Company intends to increase its drilling capacity, by mobilising an additional rig crew. This will allow full utilisation of Oil Search’s rig fleet and provide flexibility in optimising drilling priorities between oil development and continuing gas appraisal and exploration.
Middle East/North AfricaA highlight of 2011 was the conversion of the option over the Taza Block (formerly K42) in Kurdistan into a full Production Sharing Contract. Seismic acquired in 2010 has identified a significant four-way dip closed structure, on trend with a number of very large oil and gas fields. This structure will be drilled in 2012 and, if successful, has the potential to have a material impact on Oil Search.
ON A PERSONAL NOTE I would like to thank Oil Search staff for their dedication and hard work during 2011. The Company has a highly qualified, multi-skilled and diverse workforce. Despite the considerable pressure that the PNG LNG Project has put onto PNG’s labour markets, Oil Search has maintained excellent retention rates among its citizen workforce. This is in part due to the many skills, training and career development opportunities within Oil Search, as well as the Company’s focus on promoting health, wellbeing and life balance, making Oil Search an employer of choice.
2012 promises to be one of the most active and exciting in Oil Search’s history. The ongoing delivery of PNG LNG construction during 2012 will take the Company a step closer to a transformational change in production and cash flows. The significant drilling programmes taking place over the next 12-18 months have the potential to set the platform for the Company’s next major growth phase, in both oil and gas development. It is a hugely exciting time for us all.
17

2011 FINANCIAL REPORT
Oil Search produced a solid set of financial results during 2011. The base oil business continued to generate substantial cashflows, which were used to fund an active development and exploration/appraisal programme within the oil fields as well as the major PNG LNG Project development. Capital is being managed prudently and the Company is well placed to finance the substantial growth options within its portfolio.
HIGHLIGHTSNet profit after tax and significant items was US$202.5 million in 2011, representing a 9.1% increase on 2010. When adjusted for significant items, the underlying net profit after tax was US$235.7 million, 63.6% higher than the previous year.
The oil price continued to be volatile during 2011. Despite this, Brent traded above US$100 per barrel for most of the year. Oil Search remained unhedged during 2011 and therefore benefited fully from the strength in commodity prices. Offsetting this, the Company was impacted by ongoing cost pressures in PNG and the adverse impact of the strengthening Australian dollar and PNG Kina during 2011.
To mitigate these external factors, Oil Search continued to focus on prudent management of the oil assets and achieved a strong cash operating margin of 81%, consistent with 2010. Total operating cashflow was 11.4% higher than the previous year, at US$386.2 million.
At the end of 2011, Oil Search’s total liquidity position was US$1,294.0 million, comprising the Company’s cash plus its undrawn revolving credit facility of US$246.5 million. Towards the end of the year, the PNG LNG Project Operator, Esso Highlands Limited, advised a US$0.7 billion increase in the PNG LNG Project budget (approximately US$200 million net to Oil Search) resulting from the adverse impact of currency movements on Project costs. The additional cost will be funded in accordance with the PNG LNG Project’s existing finance terms, with 70% funded by the PNG LNG project finance facility and the balance by equity contributions from the Co-Venturers. The Project’s committed US$14 billion finance facility is more than adequate to fully cover the additional debt required. Oil Search’s strong balance sheet means the Company is fully funded for its PNG LNG Project equity commitments and also retains the flexibility and capacity to aggressively execute its other growth options.
Total dividends declared and paid in 2011 were four US cents per share. These payments were funded by a fully underwritten Dividend Reinvestment Plan, which was well supported by shareholders. The Board has indicated that future dividend payments will remain consistant until the completion of the PNG LNG Project, at which time they will be reviewed, taking into account underlying earnings and capital commitments.
REVENUERevenue from operations in 2011 was US$732.9 million, which was 25.6% higher than in 2010. The increase reflected significantly higher realised oil prices, partly offset by a decline in oil sales.
Zlatko Todorcevski, Chief Financial Officer
18

Total oil and gas production in 2011, net to Oil Search, was 6.69 million barrels of oil equivalent (mmboe). This was 12.7% below 2010 levels due to natural decline in the PNG oil fields and a facilities shutdown in the third quarter, for work associated with the PNG LNG Project. After internal usage, oil and gas available for sale for the year was 6.61 mmboe. Actual volumes sold were slightly higher, at 6.63 mmboe, reflecting a small reduction in the year end crude inventory level, to 0.20 million barrels at 31 December 2011.
The average realised oil price for the year was US$116.09 per barrel, 44.8% higher than the price realised in 2010 of US$80.19 per barrel. Oil Search did not undertake any hedging activities during 2011.
Rig and refinery revenue increased, from US$30.7 million to US$37.0 million, reflecting increased rig utilisation rates as well as higher oil product prices.
COSTSOperating costs rose from US$111.8 million in 2010 to US$137.0 million in 2011. The increase reflected a number of factors, including localised inflationary pressures in PNG and the strength of the PNG Kina and the Australian dollar against the US dollar, which adversely affected costs denominated in those currencies. In addition, a number of non-recurring costs were incurred during 2011 on work to deliver better operating reliability and to extend the life of the production facilities. The Company donated US$3.7 million to establish the Oil Search Health Foundation during the year and spent US$10.3 million on business development activities (US$6.2 million in 2010).
Total operating costs on a per barrel equivalent basis were US$20.67 per barrel, compared to US$15.08 per barrel in 2010, reflecting higher costs on a lower production base.
NON-CASH COSTSNon-cash charges, including depreciation, amortisation and site restoration, rose from US$49.9 million in 2010 to US$51.3 million in 2011. The increase reflected the change in mix of production from different fields with varying amortisation rates and higher rig utilisation. On a per barrel of oil equivalent basis, non-cash costs were US$7.74 per barrel.
EXPLORATION AND EVALUATION EXPENSEOil Search spent US$144.6 million on exploration and evaluation activities in 2011.
In line with the successful efforts accounting policy, all costs associated with unsuccessful drilling, seismic work and other support costs related to exploration activity were expensed, resulting in a pre-tax charge of US$60.6 million. This was substantially lower than the 2010 exploration expense due to a lower level of expenditure in 2011 and the prior year write-off of the Korka and Wasuma wells. The major items expensed in 2011 were:
> US$12.7 million related to the unsuccessful coal seam gas drilling programme.
> US$33.7 million related to seismic activities. > US$14.2 million on general and administrative and
geological and geophysical activities.
ImPAIRmENTAn impairment charge of US$33.2 million, taken as a significant item, was recognised for the Shakal licence in the Kurdistan Region of Iraq. Following unsuccessful negotiations to renew the licence, the Shakal licence expired in early 2012, having reached its maximum term.
TAXATION EXPENSEThe effective tax rate on statutory profits was 54%, compared to the 2010 rate of 33%, with the 2010 rate reduced by a once-off deferred tax restatement. The 2011 effective tax rate was above the statutory rate applying to oil earnings in PNG of 50% due to the non-deductibility of exploration expenditure in the Middle East/North Africa.
Excluding the impact of the Shakal write-off, the effective tax rate for 2011 would have been 50%.
CASH FLOwS2011 operating cash flow of US$386.2 million was 11.4% higher than in 2010, primarily due to the impact of higher realised oil prices, offset by lower sales volumes.
In 2011, Oil Search’s net investing cash flow included:
> US$128.5 million on oil operations activities. > US$1,059.3 million on the PNG LNG Project. > US$121.9 million on exploration and evaluation, of
which US$76.5 million was spent in PNG and the balance in the Middle East/North Africa.
The Company’s fully underwritten Dividend Reinvestment Plan remained in operation in 2011, as required under the PNG LNG project finance facility. As a result, no net cash distributions were made to shareholders.
19

LIqUIDITyAt the end of 2011, Oil Search had a net debt position of US$700.1 million. This comprised US$1,047.5 million in cash, of which US$514.1 million was held in escrow to meet future PNG LNG equity commitments (US$720.8 million in 2010), offset by US$1,747.6 million in debt (US$929.7 million in 2010).
The Company also had a balance of US$246.5 million available from its US$435.0 million five year amortising revolving credit facility, established in 2008. No drawdowns have been made from the facility to date.
FINANCIAL OBjECTIVES FOR 2012 AND BEyONDOil Search will continue to focus on maximising returns from its existing oil assets while making the appropriate investment to optimise their future performance.
Additional expenditure on the oil assets is being made to accelerate development opportunities, improve operating reliability and ensure longevity to support the PNG LNG Project for the full project life.
Continued attention will also be maintained on liquidity management, to ensure available funding is optimised for the Company’s PNG LNG Project equity commitments, while retaining the capacity to pursue investment in other growth options. These include maturing LNG expansion and oil development opportunities in PNG and evaluating the Middle East/North Africa portfolio. During 2012, the Company expects to replace the existing revolving credit facility with a facility that better reflects Oil Search’s changing credit profile.
2011 FINANCIAL REPORTCONTINUED
FINANCIAL PERFORmANCE(1) (2)
Year to 31 December 2007 2008 2009 2010 2011% CHANGE
2011/2010
Oil and gas production (mmboe) 9.78 8.60 8.12 7.66 6.69 –13
Oil liftings (mmbbl) 8.71 7.46 6.95 6.45 5.64 –13
Total sales (mmboe) 9.51 8.36 7.93 7.41 6.63 –11
Realised oil price (US$/bbl) 77.78 100.10 65.40 80.19 116.09 +45
Revenue from operations (US$m) 718.8 814.3 512.2 583.6 732.9 +26
Operating costs (US$m) (120.5) (116.3) (102.8) (111.8) (137.0) +23
EBITDAX (US$m) 598.2 698.1 409.4 471.7 595.9 +26
Amortisation and depreciation
(US$m) (135.9) (127.2) (105.4) (49.9) (51.3) +3
Exploration expensed (US$m) (163.3) (91.2) (71.0) (125.0) (60.6) –52
Business development costs (US$m) – – (4.7) (6.2) (10.3) +66
EBIT (US$m) 299.0 479.6 228.2 290.7 473.6 +63
Impairment loss/(reversal) (US$m) (0.1) (91.5) – (15.8) (33.2) +110
Other income/(expense) (US$m) 24.1 132.2 11.6 2.3 (0.5) na
Tax (US$m) (186.0) (206.9) (106.2) (91.6) (237.4) +159
Profit after tax including significant items
(US$m) 137.2 313.4 133.7 185.6 202.5 +9
Significant items (US$m) 3.6 (73.4) (34.1) (41.5) 33.2 na
Profit after tax excluding significant items
(US$m) 140.8 240.0 99.6 144.1 235.7 +64
Diluted earnings per share including significant items
(US¢/share) 12.2 27.8 11.5 14.1 15.3 +9
Dividends per share (US¢/share) 8.0 8.0 4.0 4.0 4.0 –
Operating cash flow (US$m) 326.8 507.4 284.1 346.7 386.2 +11
Net cash/(debt) (US$m) 343.6 534.9 1,288.1 333.9 (700.1) na
Notes:(1) In accordance with IFRS 8 “Accounting Policies Changes in Accounting Estimates and Errors”, prior year comparatives have been restated
where applicable.(2) Totals may not add due to rounding.
20

CASH OPERATING PROFIT mARGIN
81%Profit margins remained stable in 2011, despite inflationary pressures and adverse currency movements. Prudent management of costs remained a key focus, balanced against pursuing near term opportunities and investment in life extension projects in the PNG oil fields.
OPERATING CASH FLOw
US$386mOperating cash flow increased by 11% in 2011, to US$386.2 million. Internally generated funds were sufficient to finance all Oil Search’s non-PNG LNG Project activities.
TOTAL REVENUE
26%Total revenue from operations increased 26% in 2011, reflecting strong oil price realisations, partially offset by lower oil and gas sales.
07 08 09 10 11
(Ye
ar %
)
8683 80 81 81
07 08 09 10 11
(U
S$ m
illi
on)
814719
512584
733
INVESTmENT EXPENDITURE
US$1,568mTotal investment expenditure in 2011 was US$1,568 million, of which 82% was spent on the PNG LNG Project. PNG LNG costs were funded 70% from the PNG LNG project finance facility and 30% from Oil Search’s cash balance.
Exploration & Evaluation
Development
Producing
LIqUIDITy
US$1,294mOil Search’s cash balance at the end of 2011 was US$1,047.5 million, with non-escrowed cash relatively steady at US$474.0 million. Funding available from the corporate debt facility, which remains undrawn, was US$246.5 million. 07 08 09 10 11
(U
S$ m
illi
on)
970
386
1,651 1,5681,294
Available corporate debt
Cash
07 08 09 10 11
(U
S$ m
illi
on)
385451
586
1,3641,568
07 08 09 10 11
(U
S$ m
illi
on)
507
327284
386347
21

PNG LNG PROJECT
The PNG LNG Project is now two years into its four‑year construction schedule and advancing well on all fronts. In December 2011, the Operator, Esso Highlands Limited, a subsidiary of Exxon Mobil Corporation, confirmed that the Project remains on track to achieve first LNG sales in 2014. Apart from the impact of foreign exchange rate fluctuations, the budget remains largely unchanged.
2011 PROjECT ACTIVITIESDuring 2011, much of the preparatory works and infrastructure development approached completion and the focus of activity moved onto full-scale construction.
Early Works and InfrastructureSite preparation and construction of logistics support infrastructure continued during the year. Good progress was made on earthworks at multiple sites across PNG, from the PNG LNG plant site at Port Moresby to the Hides Gas Conditioning Plant (HGCP) site and Komo airfield in the Highlands of PNG. Significant milestones for the Project included the completion of bridges over the Kikori and Mubi Rivers in preparation for the laying of the onshore pipeline and completing more than eight kilometres of the Hides wellpad access road.
LNG Plant SiteMajor construction at the LNG plant site started in 2011, following the completion of site preparation and the handover of the LNG process area to the LNG subcontractor. During the year, the LNG tank concrete foundations were completed and construction began on the outer LNG tank shells and roof. Structural steelwork for both LNG trains also commenced. More than half of the piling of the 2.4 kilometre jetty was in place by the end of the year. Deliveries of major equipment to PNG also commenced in the second half of the year and these items are being progressively mobilised onto the site.
Offshore PipelineConstruction of the offshore pipeline commenced following the mobilisation of the offshore installation vessel to PNG. Activities began both at the Omati River in the Gulf of Papua and at Caution Bay, offshore the LNG plant site. By the end of 2011, some 135 kilometres of the 407 kilometre offshore pipeline had been laid, including preparations at the landfall site at Caution Bay, trenching, shore pull and trench backfilling.
Onshore PipelineConstruction of the onshore pipeline, which commenced in late 2010, continued during the year. Pipelaying commenced at the Kikori landfall and, by the end of 2011, had progressed through the foreland, across the first of four major onshore pipeline river crossings, and to the Gobe area. Welding was completed on 106 kilometres of the onshore pipeline with 75 kilometres buried and backfilled. By the end of the year, all pipeline material had been mobilised to PNG and pre-construction surveys for the entire 292 kilometre onshore pipeline route were completed.
Phil Caldwell, Executive General Manager, PNG LNG
22

PNG LNG PROjECT SCOPE DESCRIPTIONThe PNG LNG Project is a 6.6 million tonne per annum integrated LNG project operated by Esso Highlands Limited, a subsidiary of Exxon Mobil Corporation. Gas will be produced from the Hides, Angore and Juha gas fields and from the associated gas in the Kutubu, Agogo, Moran and Gobe Main oil fields. These contributing fields are located in the Southern Highlands and Western provinces of PNG. Over nine tcf of gas and 200 million barrels of associated liquids are expected to be produced over the 30 year Project life. Sale and Purchase Agreements have been entered into with four Asian LNG buyers for 20 year terms. As gas is produced, hydrocarbon liquids will be removed and the gas will be conditioned at processing plants in the PNG Highlands. It will then be transported through approximately 700 kilometres of pipeline to the LNG plant located some 20 kilometres north-west of Port Moresby. The gas will be liquefied at the LNG plant prior to loading onto ocean going LNG carriers to be shipped to the Project’s customers. The hydrocarbon liquids will be transported through the existing oil export infrastructure, operated by Oil Search.
The total capital cost up to first production is estimated at US$15.7 billion, with LNG deliveries scheduled to commence in 2014.
100km0
JUHA HIDES ANGORE
100 km x 8” condensate line
60 km x 8” liquids line 60 km x 14” gas line
JUHA PRODUCTION FACILITY
250 mmcf/d
HIDES GAS CONDITIONING PLANT 960 mmcf/d
LNG FACILITY 6.6 mmpta
292 km x 32” gas pipeline onshore
407 km x 34” subsea gas pipeline
Existing 270 km x 20” crude oil export line
GOBE MAIN
KUTUBUAGOGO
MORAN
KUMUL TERMINAL
GULF OF PAPUA
PAPUA NEW GUINEA
BISMARCKSEA
PORT MORESBY
Oil field
Gas field
Oil & gas field
Oil pipeline
LNG gas pipeline
PNG LNG plant site near Port Moresby.
PNG LNG onshore pipeline.
23

PNG LNG PROJECTCONTINUED
Associated Gas (AG) Facilities and PL 2 Liquids Export SystemThe AG and PL 2 Life Extension projects are being executed by Oil Search. The AG project involves the installation of major items of equipment at the Central Processing Facility (CPF) at Kutubu and the Gobe Processing Facility (GPF) at Gobe. This will enable the oilfields to provide commissioning and production gas streams to the LNG Project as well as to handle the LNG Project liquids. A major shutdown was completed successfully during the year, during which tie-ins and key equipment installations were conducted. A new control room at the CPF was also constructed and became operational on schedule in January 2012.
The first phase of the offshore programme on the PL 2 Liquids Export System, to ensure its operability for the full LNG Project life, was completed in December. This involved laying a new subsea loading pipeline and the installation of a new Catenary Anchor Leg Mooring (CALM) buoy.
HGCP and Komo AirfieldConsiderable construction activity took place in the Highlands on the HGCP and Komo airfield. Following the completion of site preparation, piling work in the utilities area commenced at the HGCP site while at Komo, the first foundation was installed for the terminal building and significant earthworks are ongoing. Activities at the Komo airfield faced some challenges early in the year, associated with soil conditions and bad weather. The Operator made a number of changes to optimise the scope and construction methodology during the year, which have resulted in a significant improvement in construction productivity.
Other Project ActivitiesThe first of two LNG Project drill rigs arrived in PNG in the second half of 2011 and is in the process of being mobilised to the Hides location in preparation for the commencement of drilling in 2012. The second rig is anticipated to arrive in-country early in 2012.
A contract for the construction of two new LNG carriers was awarded by Mitsui OSK Lines to the Hudong-Zhonghua Shipbuilding Group of China, for use by the Project.
ResourcingThe Port Moresby training college continued to provide a steady flow of citizen workers for the LNG plant site. Towards the end of 2011, a second training college, at Juni in the Highlands, became operational. The Project and its contractors have trained more than 8,000 PNG citizens, primarily for construction and support activities as well as for future production roles. By the end of the
year, more than 14,300 people were employed on Project activities, of which 60% were PNG citizens.
The Project has made a concerted effort to create opportunities for women in PNG. As a result, more than 1,000 people in the workforce are females and 94% of these are PNG citizens.
FinancingDuring 2011, the Project continued to be funded on the agreed 70% debt, 30% equity basis. Approximately US$2.8 billion on a gross basis was drawn down during 2011 from the US$14 billion debt facility to fund 70% of the year’s construction and financing costs. This facility was secured at the outset of the Project and comprises commitments from a mixture of international export credit agencies, commercial banks and ExxonMobil. At the end of the year, Oil Search’s share of total project finance drawdowns was US$1.75 billion (2010: US$930 million).
Equity contributions are being made by each of the participants. As at 31 December 2011, Oil Search’s remaining equity contribution was expected to be approximately US$0.9 billion, to be spent between 2012 and 2014, which will be funded from existing cash and operating cash flows.
In late 2011, the Operator announced a US$0.7 billion increase in the Project costs, primarily related to the adverse impact of foreign exchange fluctuations. The Project’s cost increase has been accommodated from within the existing facility on the agreed debt to equity basis.
Government and Community SupportThe Project continued to enjoy full support from all sides of government and local communities in 2011. However, a number of localised interruptions did occur during the year, as local landowners pursued maximum local participation in Project business development opportunities. All these interruptions were resolved swiftly and had minimal impact on progress. The Project Operator, with assistance from Oil Search, continues to seek to ensure that credible structures are in place and processes implemented for the Government funding of projects that were agreed as part of the State’s original agreements with Project-affected landowners.
During 2011, the PNG Government passed a bill in Parliament to establish a Sovereign Wealth Fund. This will be used to manage the Government’s substantial cash flows that will be generated by the Project when it commences production.
24

OUTLOOk FOR 20122012 is expected to be the peak activity year for the PNG LNG Project. A number of key milestones are targeted, including:
> The completion of the Komo airfield, allowing shipment of a number of major equipment modules to the PNG Highlands.
> Structural steel erection, mechanical construction and placement of major equipment at the HGCP.
> Continuation of construction at the LNG plant site, including the commencement of topside jetty works and tank hydrostatic testing.
> Mechanical completion of the offshore pipeline and the Kopi to Kutubu sections of the onshore pipeline.
> Completion of the AG CPF and GPF modifications and the PL 2 Kumul refurbishment projects, which will mean the oil fields are ready to supply commissioning gas.
> Mobilisation of the second drill rig to PNG and the commencement of development drilling at Hides.
Main: PNG LNG plant site near Port Moresby, PNG, January 2012. Inset: Plant site in January 2011.
25

PNG LNG PROJECTCONTINUED
Hides Gas Conditioning Plant and support infrastructure in the Southern Highlands Province, PNG.
26

The Hides mountain, located in the PNG Highlands, is an elongated ridge running north-west to south-east, rising to over 2,800 metres above sea-level. The shape of the mountain reflects the geological structure, which is a relatively simple anticline persisting from the surface down to the Toro sandstone reservoir some 3,000 metres below. The mountain covers an area of approximately 21 kilometres by 6 kilometres and is covered by Tertiary limestone, which is heavily eroded and often cavernous.
The Hides 1 well was drilled in 1987 by then operator, British Petroleum (BP), and Oil Search. It discovered gas in the Toro sands with no indication of either an oil or water fluid contact. Over 200 metres of gas column was proved by the well. The Toro reservoir is comprised of predominantly clean, quartz sandstones with porosity of between 7% and 10%, but with relatively high permeabilities, of up to 800 mD. On test, Hides 1 flowed at a rate of up to 15.9 mmscf/d with 35 bbl/mmcf of condensate. A Petroleum Development Licence, PDL 1, was applied for and awarded over the discovery.
Hides 2 and 3 were drilled, in 1990 and 1993 respectively, to investigate the vertical extent of the gas column. A sidetrack from Hides 3 extended the column to at least 858 metres, with no sign of a fluid contact. Following the acquisition of additional seismic, the Hides 4 well was drilled in 1997, on the south-east end of the ridge. Hides 4 was a major step-out, nearly 9 kilometres from the nearest Hides well. The well successfully found gas and again significantly extended the gas column. The highest-known to the lowest-known gas is
now 1,240 metres vertically. This is a large column by world standards and there is a chance that it extends considerably deeper, with significant structural closure interpreted below the lowest-known gas. As well as potential deeper gas within the Toro reservoir, there is also a possibility of deeper sands which have been tested in nearby structures.
Hides 1 and 2 have been producing gas for power for the Porgera Gold Mine since 1991. Pressure information gathered from production history demonstrates pressure communication between the Hides 1, 2 and 4 wells. The small decline in pressure observed over time has been used to help constrain estimates of the volume of gas, with Netherland, Sewell Associates (NSA) 2009, estimates of the Hides Toro sand reserves as follows:
GAS-INITIALLy-IN-PLACE (TCF) RECOVERABLE (TCF)
1C 5.8 4.1
2C 7.1 5.3
3C 11.8 8.1
Source: NSA report 2009
In total, ten wells are planned to be drilled on the Hides structure as part of the PNG LNG Project development plan. One of these, the Hides gas-water contact well, will be drilled at a location deep on the structure and is aimed at constraining the vertical hydrocarbon column. Another well will test the north-west extremity of the field. This drilling will provide important results which will add constraint to the reserve estimates of this giant field.
Nogoli Camp
PDL7
PDL1
PDL7
PL1
HIDES
ANGORE
PDL8
PRL11 PRL277PDL8
0 5km
KOMO AIRFIELD
HIDES CONDITIONING PLANT
HIDES GTE FACILITY
NOGOLI CAMP
TARI
Development Licence
Retention Licence
Gas Field
Facility
PL7
PL6
PL4 & 5
Well Pad G
Well Pad F
Well Pad D
Well Pad C
Well Pad B
Well Pad A
Angore 1, 1A (1989)
Hides 1 (1987)
Hides 2 (1990)
Karius 1 (1995)
Hides 3 (1993)
Hides 4 (1998)
6° 00' S
142° 45' E
5° 55' S
142° 50' E 142° 55' E
THE HIDES GAS FIELD
27

GAS GROWTH
One of Oil Search’s key strategic priorities is to grow its gas business in PNG, with LNG considered to be the optimal commercialisation option. Over 2011, Oil Search continued to implement its well‑defined, two‑pronged LNG expansion strategy. In support of these strategic initiatives, major drilling campaigns in the PNG Highlands and offshore PNG were progressed and will commence in 2012. Success in either of these programmes has the potential to have a material impact on the Company’s future value.
The P’nyang South well in Western Province, PNG.
28

LNG EXPANSION STRATEGyA core component of Oil Search’s growth strategy is to expand its PNG gas business. Internal studies have indicated that there is substantial gas potential within the Company’s PNG acreage, which could generate significant future growth for Oil Search. Based on the Company’s current assessments, exporting gas as LNG creates the highest return.
The 2010 Strategic Review highlighted two major growth initiatives, which are being pursued concurrently:
> Establish sufficient gas resources to underwrite the sanction of a third LNG train for the PNG LNG Project at the earliest opportunity.
> Accumulate additional PNG gas resources through an offshore exploration programme, for a standalone LNG project.
PNG LNG PROjECT EXPANSIONDuring 2011, Oil Search undertook extensive planning and strategy work aimed at proving up further gas resources within the existing PNG LNG Project fields and in near-by non-Project licences. The objective of this work is to assess whether there is adequate resource to underpin an expansion of the PNG LNG Project. Oil Search believes that the most economically and commercially viable source of gas for expansion would be from within the existing PNG LNG Project fields, specifically Hides and the associated gas fields. Gas within non-PNG LNG Project, high potential licences in the Highlands could also be considered for inclusion in an expansion, as a commercial structure exists within existing Project agreements that would facilitate the use of non-Project gas in licences owned by PNG LNG Project Co-Venturers.
Due to logistical reasons, development drilling on the Hides field, which was anticipated to start in late 2011, is now expected to commence in mid-2012. The programme includes a well to establish the location of the Hides gas-water contact and a well in the as-yet undefined northern segment. The programme will help define the field’s extent and ultimate potential.
During 2011, Oil Search continued subsurface modelling work to assess the gas upside potential in the oil fields (the associated gas fields). History-matched compositional models were developed for the Kutubu and Moran fields. This work suggests that additional gas reserves may exist compared to initial estimates.
An integrated seismic and drilling programme on non-PNG LNG Project, high potential licences in the Highlands was agreed with licence partners. Activities commenced in early 2011 with a 58 kilometre 2D seismic programme over a possible southern extension of the P’nyang gas field.
The seismic was encouraging, providing support for the existence of a southern extension of the field. P’nyang, located 130 kilometres north-west of Hides and 90 kilometres north-west of the Juha gas field, lies in PRL 3, a licence owned by ExxonMobil affiliates, Oil Search and JX Nippon, all of which are PNG LNG Project Co-Venturers. In 2011, the PRL 3 licence over P’nyang was renewed for a further five years. The field currently has a proven and probable gas resource estimated at 1.5 tcf. The P’nyang South well, spudded in early 2012, has intersected a 184 metre gross gas zone over the Toro to the base of the P’nyang sands, with work currently underway to establish the location of the gas-water contact and the size of the field. The results to date support Oil Search’s view that P’nyang could help to underwrite a Train 3 expansion.
A 150 kilometre 2D seismic programme was also completed in 2011 across three licences in the area east of the Hides field, to assess non-PNG LNG Project gas potential. Activities comprised the acquisition of 55 kilometres of data in PPL 233 and the interpretation of a 96 kilometre seismic programme acquired in 2010 over PRL 11 and PDL 8. This survey confirmed the existence of the Trapia prospect in PRL 11 and provided additional information on the Huria (PDL 8) and Tagari (PPL 233) prospects. During the year, the PRL 11 Joint Venture (ExxonMobil and Oil Search) agreed to drill the Trapia prospect, located approximately 30 kilometres east of Hides. Site selection was completed and site construction work was substantially progressed through the second half of 2011.The well is expected to commence drilling in the first half of 2012, following the conclusion of P’nyang South.
A preliminary view of resources established by the early Hides drilling, P’nyang South and Trapia wells and within the associated gas fields should be available in late 2012/early 2013, subject to the timing of completion of the wells.
29

GAS GROWTHCONTINUED
GULF OF PAPUA AREA LNGOil Search acquired a material licence portfolio offshore and onshore in the Gulf of Papua in 2010, based on a view that, apart from the Highlands, the Gulf Basin is the most prospective area in PNG for gas. The Company’s strategy is to de-risk the acreage through the acquisition of high quality seismic and then introduce a strategic partner, to share the exploration and appraisal drilling risk.
In line with this strategy, in 2011, a major 3D offshore seismic programme comprising more than 6,300 kilometres over four licences and a 2D onshore seismic programme of 95 kilometres over two licences, was completed. Initial interpretation of the seismic has confirmed Oil Search’s view that there are several different play types in the Gulf and material gas and liquids potential has been identified. Several prospects are ready to drill and an extensive leads and prospects portfolio has been built, which will be further matured in 2012.
If drilling is successful, the offshore area has the potential to support the development of a standalone LNG project, independent from the PNG LNG Project.
A multi-well offshore drilling programme is now being planned. Preliminary drill targets have been identified and site survey, planning and procurement work will take place in 2012, with the objective of commencing drilling late in the second half of 2012, during the good weather window.
The Company is currently seeking a strategic partner with expertise in developing major LNG projects and with similar development aspirations. Initial discussions were held in 2011 with a number of international companies, which have expressed strong interest in working with Oil Search to assess and develop the Gulf opportunity. Towards the end of 2011, a data room was established and a competitive transaction process commenced. The Company is targeting an equity position after farm-down of approximately 30–35%, post State participation.
Interpretation of the 2011 3D seismic, highlighting the Flinders prospect.
PASCA REEF
FLINDERS FAN
30

Asia Pacific LNG demand strengthened substantially over 2011. This was primarily due to the tragic earthquake, tsunami and subsequent damage to the Fukushima nuclear plant in Japan in March 2011. The closure of most of Japan’s nuclear power facilities translated into substantially increased short term demand for LNG in Japan. The consequent heightened concerns regarding the use of nuclear power, both in Japan and elsewhere around the world, is expected to have longer term demand ramifications for LNG.
Demand growth in the region is anticipated to remain strong through to the end of the decade and beyond, due to increased demand from Japan, China and India and a range of new LNG buyers. In addition, the need to replace the many contracts that reach full term over the period to 2020 will enhance demand from many of the traditional LNG buyers in the region.
There is likely to be increased supply competition within the Asia Pacific markets over the next decade,
from proposed Australian projects, potential diversions from Qatar and possible North American LNG export and East Africa/Mediterranean projects. However, demand is predicted to grow at a similar or faster pace. In addition, not all proposed projects will proceed and it is far from certain that, having established a high level of self-sufficiency, the US will allow large scale LNG exports.
Oil Search continues to believe that a PNG LNG expansion would be in a very competitive position to capture markets. A third train would have strong economics and relatively small volumes are required to underpin an expansion compared to new projects.
For the Gulf LNG opportunity, the location, proximity to markets, relatively shallow water depths and potential liquids content would provide a competitive cost base and favourable economics to position it as a competitive greenfields development.
ASIA PACIFIC LNG mARkET OUTLOOk
100 200 300 400
500 600
2007 2009 2011 2013 2015 2017 2019 2021 2023 2025
Global LNG supply/demand outlook (mmtpa)
Speculative Projects
Possible Projects
Probable Projects
Spot Cargoes
Contracted LNG
Global Demand
Source: Wood Mackenzie, February 2012
31

PRODUCTION & EXPLORATION
Oil Search’s production in 2011 was 6.69 mmboe, at the upper end of the 2011 target of 6.2 – 6.7 mmboe. Underlying natural decline was substantially offset by field optimisation and successful drilling, which delivered highly profitable incremental production. However, total volumes were 12.7% lower than in 2010, impacted by a scheduled shutdown of the production facilities to undertake essential modifications required for the PNG LNG Project.
FIELD ACTIVITIES IN 2011
KutubuThe 2010 Strategic Review highlighted that, despite the maturity of Oil Search’s producing oil fields, opportunities remain to add material reserves and production at relatively low cost, thereby adding significant value. During 2011, Oil Search continued to mature these opportunities at Kutubu. The Company undertook a range of activities, including the optimisation of existing wells and facilities as well as an increased level of appraisal and development drilling. The programme was successful in providing incremental production, which significantly mitigated the underlying decline, and proved the potential for further development of new oil pools.
Over the year, revised gas injection strategies in the Hedinia Digimu reservoir resulted in a three-fold increase in production rates from the IDD 4 well, while the conversion of the UDT 6 well at Usano from a shut-in gas injector to producer also delivered incremental production. At Agogo, production testing of the Iagifu reservoir in the ADD 5 well successfully flowed oil, proving the potential for further development of this reservoir in the future.
Four wells, including one gas injector, were drilled in the Kutubu fields in 2011, all of which were successful:
> At Usano, the UDT 13 well was drilled and completed as a gas injector to support production in the Usano East block. This resulted in improved production rates from a key production well, UDT 11.
> At Kutubu, an infill well, IDT 25, was drilled in the Main Block Toro reservoir. The well encountered oil in the primary Toro and Iagifu objectives. The well was then deepened to an exploration target in the Koi Iange reservoir, which had not been tested before in the field area. Indications of hydrocarbons were observed from drilling and logging data but on test, the Koi Iange did not contain productive hydrocarbons. A completion will be installed across the Toro and Iagifu reservoirs for production in 2012.
> The Hedinia 10 well was drilled in the Hedinia area, on one of the prospects identified in the recent near field exploration review. The well, targeting the Toro reservoir in a forelimb structure analogous to that discovered by ADT 2 ST3 at Agogo in late 2009, encountered oil in a near-horizontal sidetrack, successfully proving the structural model. The well is now on production at rates in excess of 1,000 bopd. The potential for further development of this new pool will be assessed following analysis of production data from the well and post-drill mapping.
Richard Robinson, Executive General Manager, Operations
32

> The Agogo 6 well was drilled to appraise the Toro reservoir in the Agogo forelimb. Good indications of hydrocarbons were observed from drilling and logging data. Shortly after the end of the year, the well was successfully side-tracked to optimise the location within the reservoir. Agogo 6 was completed as an oil producer and is flowing at rates in excess of 1,500 bopd.
A two-week shutdown of the Central Processing Facility (CPF) and Agogo Processing Facility (APF) was undertaken in August, to complete a large number of modifications required for the PNG LNG Project. The shutdown was completed safely and slightly ahead of the scheduled duration.
MoranActivities in the Moran field focused on optimising the field’s gas injection strategy, with targeted pressure support being provided to specific reservoirs. This, together with a strong performance from a number of the key wells in the field, helped to slow the field’s natural decline. However, total production from Moran was, like Kutubu, affected by the scheduled shutdown at the CPF and APF.
Maintaining sufficient gas injection to the Moran field is a critical part of the long term oil depletion plan. During 2011, work was undertaken in a number of areas at the APF to improve the longevity and efficiency of the gas compression and injection facilities.
During the year, production from the Moran 15 well, which was drilled in 2010, was monitored in order to assess the potential for further development in this area. An important component of this assessment is gaining an understanding of the potential of the Toro A and Toro C reservoirs. The testing and commissioning of these zones is scheduled to occur in 2012.
SE ManandaProduction from the SE Mananda field in 2011 was 42% lower than in 2010. This reflected both the shut down at the APF for PNG LNG Project work and natural field decline. Production was also impacted during the year by down-hole and surface restrictions caused by hydrate and wax build-up. This was resolved by improvements to chemical injection capabilities, though the provision of sustained chemical injection at this remote site is challenging during the wet season.
Agogo 6 well, in Southern Highlands Province, PNG.
33

PRODUCTION & EXPLORATIONCONTINUED
2011 PRODUCTION SUmmARy(1)(2)
yEAR TO 31 DECEmBER 2010 2011 % CHANGE
OIL PRODUCTION
GROSSDAILy
PRODUCTION(BOPD)
NET TOOSH
(mmBBLS)
GROSSDAILy
PRODUCTION(BOPD)
NET TOOSH
(mmBBLS)
GROSSDAILy
PRODUCTIONNET TO
OSH
Kutubu 16,364 3.587 13,816 3.028 –16 –16
Moran 14,570 2.633 12,708 2.296 –13 –13
Gobe Main 1,608 0.059 1,128 0.041 –30 –30
SE Gobe 2,729 0.255 2,230 0.208 –18 –18
SE Mananda 378 0.100 217 0.057 –42 –42
Total PNG Oil 35,649 6.632 30,100 5.631 –16 –15
Hides Liquids 366 0.134 356 0.130 –3 –3
Total Oil & Condensate 36,015 6.766 30,456 5.761 –15 –15
GAS PRODUCTION mmSCF/D mmSCF/D mmSCF/D mmSCF
Hides Gas Production 14.65 5,348 15.24 5,562 +4 +4
TOTAL OIL AND GAS PRODUCTION BOEPD mmBOE BOEPD mmBOE
Total production 38,457 7.657 32,995 6.688 –14 –13
NOTES: (1) Prior period comparatives updated for subsequent changes.(2) Numbers may not add due to rounding.
GobeDuring 2011, production from both the SE Gobe and Gobe Main fields fell, by 18% and 30% respectively. This reflected natural field decline and the shut-in of a number of wells while workovers were undertaken.
At SE Gobe, workovers took place in the SEG 8 and SEG 1 ST1 wells. Despite some mechanical difficulties in the SEG 8 well, both workovers were completed and are anticipated to enhance production in 2012. At SEG 1 ST1, a full recompletion was undertaken which has enabled production to be reinstated at the well after being shut-in for three years.
In Gobe Main, production was adversely impacted by the failure of the GM 2 ST1 well. A full workover was undertaken on the well which has allowed production to resume.
HidesAt Hides, gas production for the Hides Gas to Electricity Project was slightly higher than in 2010. This reflected good uptime availability at the plant and continued strong offtake from the Porgera Gold Mine.
Hydraulic Workover Unit undertaking operations at Gobe, PNG Highlands.
34

0 2km
Digimu
Koi-Iange
Agogo 6 is structurally similar in style to Hedinia 10
Iagifu
Toro
ForelimbFootwall
Deeper Target:Koi-Iange
Main FieldInfill Targets
SSW NNE
2000m
1000m
0m
-1000m
-2000m
-3000m
-4000m
-5000m
Hedinia 10 IDT 25
IN AND NEAR-FIELD OPPORTUNITIES
As part of the 2010 Strategic Review, Oil Search undertook a major study of the remaining potential within and close to the Company’s producing oil fields. The work involved integrating existing seismic, production and drilling data into new geological models. This led to the development of a number of new, and to date largely unexplored, play types. Within these plays, more than 25 leads and prospects were identified.
The plays discovered or appraised in recent wells include the following:
> Forelimb/Footwall structures: Forelimb targets are not visible on seismic data so require a high degree of skill and expertise to identify. The first well in the area to successfully test the forelimb play was the ADT 2 ST3 well, which discovered oil in the Digimu reservoir of the Agogo forelimb in late 2009. Following this success, the structural model for the Hedinia forelimb was rebuilt and in 2011, the Hedinia 10 well was drilled into an ADT 2 ST3 ‘lookalike’ structure. This well was successful, while the recent Agogo 6 appraisal well has also confirmed hydrocarbons in the Toro reservoir of the Agogo forelimb. In addition to the forelimb, a range of footwall targets have been identified at Hedinia, Moran and Mananda.
> Koi Iange: This deeper reservoir potentially underlies all Oil Search’s producing oil reservoirs. The Koi Iange sandstone was penetrated by the IDT 25 well in 2011, which encountered hydrocarbons shows. While the Koi Iange in IDT 25 does not contain productive hydrocarbons, the results of this well are currently being evaluated.
> New segments: Based on detailed remapping and seismic acquired in 2011, a number of potential new segments and extensions of existing fields have been found, including at SE Mananda and to the north of the Agogo field.
Over the next two–three years, these near-field opportunities will be matured further and, where justified, wells will be drilled. The wells will be higher risk than Oil Search’s historical development drilling, given the largely untested reservoir properties and the geological complexity. However, if successful, the prospects have the potential to add significantly to Oil Search’s oil reserves and, given the proximity to existing well pads and pipelines, can be brought into production quickly and at low cost, hence generating high returns on the Company’s invested capital.
Structural cross-section across Kutubu
35

PRODUCTION & EXPLORATIONCONTINUED
PRODUCTION OUTLOOk FOR 2012Production in 2012 is expected to be in a similar range to 2011, of 6.2 – 6.7 mmboe. Recent exploration, appraisal and development drilling within the oil fields is expected to largely offset natural field decline. However, output will be impacted by a further 16 day shutdown of the CPF and APF in the first quarter of 2012 and two shorter shutdowns of the Gobe Processing Facility (GPF) in the second and fourth quarters of 2012, for work related to the PNG LNG Project. Present forecasts indicate that production is likely to remain largely flat into 2013, assuming planned development activities are successful.
Specific field activities planned in 2012 include the following:
> Kutubu: Workover operations will be undertaken in a number of wells at Kutubu and Agogo, to enhance production. In addition, several in-field and near-field locations are currently being assessed for drilling in 2012, including potential wells at Kutubu, Usano and Agogo.
Over 125 metres of core were acquired from the Toro reservoirs in both the UDT 13 and IDT 25 wells. This is undergoing detailed analysis and the data will be used to calibrate, update and improve the Kutubu reservoir models.
> Moran: In combination with the new core from the Kutubu field, existing core from the Moran 4x well is currently undergoing detailed analysis which will be used in an ongoing programme to calibrate, update and improve the Moran reservoir model. This model is already being used to assess the potential for new in-field well locations and it is likely that one of these will be drilled in 2012.
> Gobe: During 2012, field operations in both SE Gobe and Gobe Main will be focused on minimising natural decline from these mature fields through the optimisation of existing well and surface facility performance.
Control Room, Central Processing Facility, Kutubu, PNG.
36

mANANDA 5 DISCOVERyIn late 2010, the Mananda 5 well, located in PPL 219, approximately 18 kilometres north-west of the SE Mananda oil field, discovered hydrocarbons. A comprehensive testing programme took place in early 2011 and four zones in the Toro and Imburu flowed oil at rates of between 500 – 1,200 bopd with a gas:oil ratio of between 600 – 1,200 scf/bbl. A longer flow test over the upper Toro A zone flowed oil at sustained rates of 1,000 – 1,200 bopd and at rates of up to 1,900 bopd on a larger choke size.
During 2011, work took place to determine the optimal development plan for the discovery. These studies indicated that further information to define the size and shape of the structure was required. Consequently, a 90 kilometre seismic programme commenced in December 2011, designed to constrain the extent of the Mananda field. The seismic also covers other exploration leads near the SE Mananda field.
It is anticipated that processing and interpretation of the seismic will be complete by mid-2012, at which stage further drilling activity will be evaluated.
mIDDLE EAST AND NORTH AFRICA (mENA) ACTIVITIES2011 saw considerable civil unrest in several of the areas in which Oil Search operates in the MENA region. As a result, activity levels were relatively low. 2012 will be a key year for the Company’s MENA assets, with potentially material wells being drilled in both Kurdistan and Tunisia. Oil Search believes that the MENA region offers good opportunities for longer term growth outside PNG.
KurdistanFollowing the aquisition of 232 kilometres of 2D seismic in 2010, which identified a significant four-way dip closed structure, in 2011, Oil Search applied for, and was awarded, a Production Sharing Contract (PSC) for the Taza exploration block (formerly K42). The 511 square kilometre block is located in a prolific petroleum province and lies adjacent to the Pulkhana block to the south-west and the Kormor block to the north-east, both of which contain large oil and gas discoveries. The area is underexplored, yet highly prospective, with a technical success rate for wells drilled in the last five years of over 50%.
The commitment under the PSC is to drill an exploration well with drilling expected to commence in mid-2012. If successful, Taza has the potential to be a material resource for Oil Search.
Since the award, Oil Search has increased its presence and operations in Kurdistan and will open an office in Erbil in 2012, adding to its residence in the eastern city of Sulaymaniyah.
Following unsuccessful negotiations to extend the term of Oil Search’s other block in Kurdistan, the Shakal Block, the licence expired in early 2012. This resulted in an impairment charge associated with costs previously capitalised in relation to the block of US$33.2 million in the 2011 results.
TunisiaDue to the political unrest in Tunisia, little work took place on the ground in Oil Search’s two Tunisian blocks, Tajerouine and Le Kef, for much of 2011. Instead, the focus of activities was on the processing and interpretation of the 591 kilometres of 2D seismic acquired over Tajerouine in late 2010. A number of viable prospects were identified and further seismic over the preferred prospect in the Tajerouine block was shot late in 2011. The seismic has been used to refine a well location and preparations to drill a well in the second half of 2011 are now underway. The Tajerouine prospect has potential for material volumes of oil, while there is also a deeper gas target. Tunisia has generous fiscal terms such that even a modest discovery may be commercially attractive.
YemenOil Search’s Yemen licences have been in force majeure since mid-2011 due to the ‘Arab Spring’ uprising. The Company’s local Yemeni staff has maintained a presence in the Yemen office through the year despite difficult and distressing times. The political situation in Yemen is being closely monitored, to assess when it may be possible to resume field operations.
37

2011 RESERVES AND RESOURCES
As at 31 December 2011, the Company had 1P reserves of 330 million barrels of oil equivalent (mmboe) and 2P reserves of 553 mmboe. The Company also had 318 mmboe of contingent resources, taking the Company’s total 2P reserves plus 2C resources to 870 mmboe. Of these reserves, 505 mmboe is associated with the Company’s share of the PNG LNG Project.
2011 RESERVES Oil Search utilises a reserves audit rotation schedule, where each field is required to be audited at least once every three years. In 2011, no audits were undertaken, for the following reasons:
> Underlying oil field performance during 2011 was in line with expectations. Therefore, it is unlikely that there have been any significant changes to the previously audited reserve estimates.
> While a number of successful wells were drilled within the oil fields during the year, including Hedinia 10, IDT 25 and Agogo 6, Oil Search believes it is premature to estimate the extent of any reserve additions until production data has been obtained and evaluated.
> A major reserves booking was made at the end of 2009, following the sanction of the PNG LNG Project. There have been no changes to these gas reserve estimates since that time.
2011 ANNUAL RESERVES STATEmENT
Proven Reserves
LICENCE/FIELDEND 2010
RESERVES PRODUCTION
DISCOVERIES/EXTENSIONS/
REVISIONSACqUISITIONS/DIVESTmENTS
END 2011RESERVES
PDL 2 – Kutubu 12.7 3.0 – – 9.6
PDL 2 – SE Mananda 0.2 0.1 – – 0.1
PDL 2/5/6 – Moran Unit 11.4 2.3 – – 9.1
PDL 4 – Gobe Main 0.2 0.0 – – 0.1
PDL 3/4 – SE Gobe 0.5 0.2 – – 0.3
PDL 1 – Hides 11.3 1.1 – – 10.3
PNG LNG Project 300.6 – – – 300.6
Total 336.8 6.7 – – 330.1
Proven & Probable Reserves
LICENCE/FIELDEND 2010
RESERVES PRODUCTION
DISCOVERIES/EXTENSIONS/
REVISIONSACqUISITIONS/DIVESTmENTS
END 2011RESERVES
PDL 2 – Kutubu 19.4 3.0 – – 16.4
PDL 2 – SE Mananda 0.6 0.1 – – 0.5
PDL 2/5/6 – Moran Unit 21.5 2.3 – – 19.2
PDL 4 – Gobe Main 0.3 0.0 – – 0.2
PDL 3/4 – SE Gobe 0.8 0.2 – – 0.6
PDL 1 – Hides 11.3 1.1 – – 10.3
PNG LNG Project 505.4 – – – 505.4
Total 559.3 6.7 – – 552.6
38
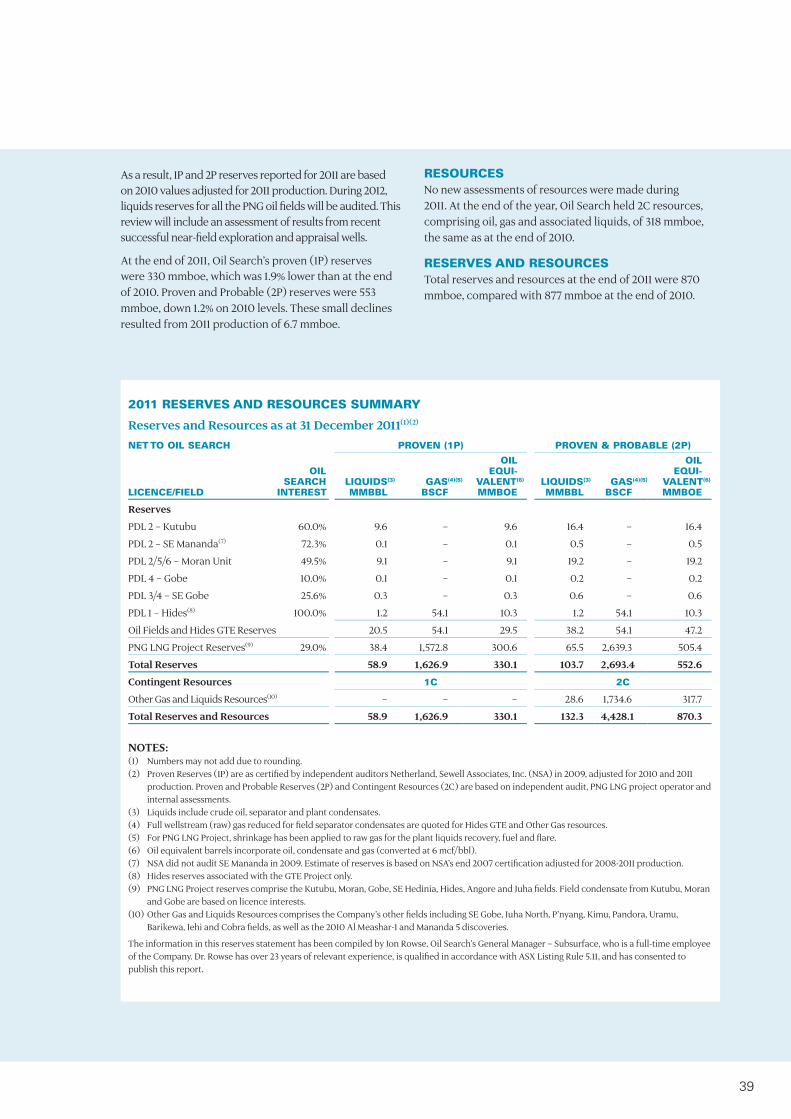
As a result, 1P and 2P reserves reported for 2011 are based on 2010 values adjusted for 2011 production. During 2012, liquids reserves for all the PNG oil fields will be audited. This review will include an assessment of results from recent successful near-field exploration and appraisal wells.
At the end of 2011, Oil Search’s proven (1P) reserves were 330 mmboe, which was 1.9% lower than at the end of 2010. Proven and Probable (2P) reserves were 553 mmboe, down 1.2% on 2010 levels. These small declines resulted from 2011 production of 6.7 mmboe.
RESOURCESNo new assessments of resources were made during 2011. At the end of the year, Oil Search held 2C resources, comprising oil, gas and associated liquids, of 318 mmboe, the same as at the end of 2010.
RESERVES AND RESOURCESTotal reserves and resources at the end of 2011 were 870 mmboe, compared with 877 mmboe at the end of 2010.
2011 RESERVES AND RESOURCES SUmmARy
Reserves and Resources as at 31 December 2011(1)(2)
NET TO OIL SEARCH PROVEN (1P) PROVEN & PROBABLE (2P)
LICENCE/FIELD
OILSEARCH
INTERESTLIqUIDS(3)
mmBBLGAS(4)(5)
BSCF
OILEqUI-
VALENT(6)
mmBOELIqUIDS(3)
mmBBLGAS(4)(5)
BSCF
OILEqUI-
VALENT(6)
mmBOE
Reserves
PDL 2 – Kutubu 60.0% 9.6 – 9.6 16.4 – 16.4
PDL 2 – SE Mananda(7) 72.3% 0.1 – 0.1 0.5 – 0.5
PDL 2/5/6 – Moran Unit 49.5% 9.1 – 9.1 19.2 – 19.2
PDL 4 – Gobe 10.0% 0.1 – 0.1 0.2 – 0.2
PDL 3/4 – SE Gobe 25.6% 0.3 – 0.3 0.6 – 0.6
PDL 1 – Hides(8) 100.0% 1.2 54.1 10.3 1.2 54.1 10.3
Oil Fields and Hides GTE Reserves 20.5 54.1 29.5 38.2 54.1 47.2
PNG LNG Project Reserves(9) 29.0% 38.4 1,572.8 300.6 65.5 2,639.3 505.4
Total Reserves 58.9 1,626.9 330.1 103.7 2,693.4 552.6
Contingent Resources 1C 2C
Other Gas and Liquids Resources(10) – – – 28.6 1,734.6 317.7
Total Reserves and Resources 58.9 1,626.9 330.1 132.3 4,428.1 870.3
NOTES:(1) Numbers may not add due to rounding.(2) Proven Reserves (1P) are as certified by independent auditors Netherland, Sewell Associates, Inc. (NSA) in 2009, adjusted for 2010 and 2011
production. Proven and Probable Reserves (2P) and Contingent Resources (2C) are based on independent audit, PNG LNG project operator and internal assessments.
(3) Liquids include crude oil, separator and plant condensates.(4) Full wellstream (raw) gas reduced for field separator condensates are quoted for Hides GTE and Other Gas resources.(5) For PNG LNG Project, shrinkage has been applied to raw gas for the plant liquids recovery, fuel and flare.(6) Oil equivalent barrels incorporate oil, condensate and gas (converted at 6 mcf/bbl).(7) NSA did not audit SE Mananda in 2009. Estimate of reserves is based on NSA’s end 2007 certification adjusted for 2008-2011 production.(8) Hides reserves associated with the GTE Project only.(9) PNG LNG Project reserves comprise the Kutubu, Moran, Gobe, SE Hedinia, Hides, Angore and Juha fields. Field condensate from Kutubu, Moran
and Gobe are based on licence interests.(10) Other Gas and Liquids Resources comprises the Company’s other fields including SE Gobe, Juha North, P’nyang, Kimu, Pandora, Uramu,
Barikewa, Iehi and Cobra fields, as well as the 2010 Al Meashar-1 and Mananda 5 discoveries.
The information in this reserves statement has been compiled by Jon Rowse, Oil Search’s General Manager – Subsurface, who is a full-time employee of the Company. Dr. Rowse has over 23 years of relevant experience, is qualified in accordance with ASX Listing Rule 5.11, and has consented to publish this report.
39

BLOCK 3
BLOCK 7
TAZA (K42)TA
LE KEF
TAJEROUINERO
TUNIS OFFICE
SULAYMANIYAH OFFICE
DUBAI OFFICE
SANA’AOFFICE
YEMEN
IRAQTUNISIA
1000km0
GULF OF GUINEA INDIAN OCEAN
MEDITERRANEAN SEA
CASPIANSEA
GULF OF ADEN
RED
SEA
PERSIAN GULF
ATLANTIC OCEAN
Oil Search operated licence
Oil Search interest in licence
Petroleum Development Licence
Petroleum Retention Licence
Applications
Oil field
Gas field
Oil & gas field
Prospect
Oil pipeline
PNG LNG gas pipeline
Oil Search operated licence
Oil Search interest in licence
Petroleum Development Licence
Petroleum Retention Licence
Applications
Gas field
Oil & gas field
Gas Prospect
Oil pipeline
PNG LNG Gas pipeline
LICENCE INTERESTS
mENA LICENCE INTERESTS
PNG LICENCE INTERESTS
PRL 9
339
339
339
PPL 339
PPL 339
338
338
338
PPL 338
PPL 312
PPL 276
PPL 244
APPL 385
PPL 234
100km0
FLINDERS
TRAPIA
MANANDA 5
SE MANANDA
MORAN
PANDORA
URAMU
BARIKEWA
P’NYANG
JUHA
HIDES
ANGORE
KIMU
COBRAIEHI
SE GOBE
GOBE MAIN
KUTUBUAGOGO
KUMUL TERMINAL
GULF OF PAPUA
PAPUA NEW GUINEA
BISMARCKSEA
PORT MORESBY OFFICE
PNG LNG FACILITY
PPL 240
233
260
PPL 233
219
APPL 386
PRL 11
PRL14
PRL 10
PRL 8
PRL 3
PRL 2
PRL 1
PDL 7
PDL 9
PDL 8 PDL 6
PDL 5
PDL 4
PDL 3
PDL 2
PDL 1
PPL 239
PPL 260
240
40

LICENCE INTERESTS As At 29 FebruAry 2012
LICENCE FIELD/PROjECT OIL SEARCH INTEREST % OPERATOR
PNG Petroleum Development Licences (PDL)PDL 1 Hides 16.66 ExxonMobilPDL 2 Kutubu, Moran 60.05 Oil SearchPDL 2 – SE Mananda JV SE Mananda 72,27 Oil SearchPDL 3 SE Gobe 36.36 SantosPDL 4 Gobe Main, SE Gobe 10.00 Oil SearchPDL 5 Moran 40.69 ExxonMobilPDL 6 Moran 71.07 Oil SearchSE Gobe Unit (PDL 3/PDL 4) 25.55 Oil SearchMoran Unit (PDL 2/PDL 5/PDL 6) 49.51 Oil SearchHides Gas to Electricity Project (PDL 1) 100.00 Oil SearchPDL 7 South Hides 40.69 ExxonMobilPDL 8 Angore 40.69 ExxonMobilPDL 9 Juha 24.42 ExxonMobilPNG LNG Project PNG LNG Project 29.00 ExxonMobilPNG Pipeline Licences (PL)PL 1 Hides 100.00 Oil SearchPL 2 Kutubu 60.05 Oil SearchPL 3 Gobe 17.78 Oil SearchPL 4 PNG LNG Project 29.00 ExxonMobilPL 5 PNG LNG Project 29.00 ExxonMobilPL 6 PNG LNG Project 29.00 ExxonMobilPL 7 PNG LNG Project 29.00 ExxonMobilPL 8 PNG LNG Project 29.00 ExxonMobilPNG Petroleum Processing Facility LicencePPFL 2 PNG LNG Project 29.00 ExxonMobilPNG Petroleum Retention Licences (PRL)PRL 1 Pandora 24.09 TalismanPRL 2(1) 31.51 ExxonMobilPRL 3(2) P’nyang 38.51 ExxonMobilPRL 8 Kimu 60.71 Oil SearchPRL 9 Barikewa 45.11 Oil Search PRL 10 Uramu 59.55 Oil SearchPRL 11 52.50 Exxon MobilPRL 14 Cobra, Iehi, Bilip 62.56 Oil SearchPNG Petroleum Prospecting Licences (PPL)PPL 219 71.25 Oil SearchPPL 233 52.50 ExxonMobilPPL 234 80.00 Oil SearchPPL 239 20.00 Talisman PPL 240 100.00 Oil SearchPPL 244 80.00 Oil Search PPL 260 50.00 Oil SearchPPL 276 30.00(3) Rockwell EnergyPPL 312 30.00 Oil Search PPL 338 30.00(3) Kina Petroleum PPL 339 30.00(3) Kina Petroleum YemenBlock 3 40.00(4) Oil SearchBlock 7 34.00 Oil SearchIraqTaza (K42) 60.00(5) Oil SearchTunisiaLe Kef 50.00 PrimoilTajerouine 100.00 Oil Search
(1) Licence extension applied for.(2) Extension offer accepted. Awaiting extension document from Government. (3) Subject to completing assignment documents.(4) Licence sold March 2012. (5) 75% paying interest.
41

Oil Search is committed to providing a safe workplace which encourages accountability and diversity. The Company’s major focus areas are the development of its people, building capability, encouraging diversity and providing assurance of skills and competence across the workforce.
A number of steps were taken in 2011 to ensure that the Company’s people have the capability to deliver Oil Search’s short and long term strategy and business objectives.
CREATING A PEOPLE DEVELOPmENT GROUPOne of Oil Search’s key priorities is to develop its people. In 2011, a People Development Group, comprising the Managing Director and all Executive General Managers, was established. The group meets regularly to discuss progress against agreed ‘people actions’, with a particular focus on identifying and planning the development of the top talent within Oil Search.
Graduates are vital to the Company’s long term people development aspiration and Oil Search has a long history of supporting graduates within PNG. In 2011, Oil Search employed eight graduates, who will commence a graduate development programme in 2012. Oil Search also has apprentice programmes within the Production and Maintenance areas. In 2011, a fourth year Production apprentice, Raymond Amos, won the PNG Apprentice of the Year Award, a national PNG initiative that aims to recognise apprentices who can demonstrate specialist knowledge in their chosen field, as well as broader awareness of other national issues.
AN INTEGRATED APPROACH TO CAREER DEVELOPmENT PLANNINGSince September 2011, approximately 150 employees have been selected for targeted career development. Approximately 25 of these employees have been selected to participate in a formal mentoring programme, which provides an opportunity to discuss personal and work challenges outside the pressures often inherent within the manager-subordinate relationship.
DIVERSITyOil Search has a long-standing commitment to valuing diversity across the business. Within the PNG operations, emphasis is placed on the development and retention of both male and female PNG citizen employees. Despite a skilled labour market shortage in PNG due to the resources boom, male turnover has remained steady at approximately 6% while female PNG citizen turnover has dropped from 11% in 2009 to 2% in 2011. The number of women in senior management has increased from 6% in 2010 to 10% in 2011, while the number of PNG nationals in senior management positions has held steady at approximately 22%.
COmPETENCy ASSURANCE AND SkILLS DEVELOPmENT2011 saw a great deal of work taking place across a number of key departments in the field, Port Moresby and Sydney to ensure that the workforce is equipped with both the role-specific and management skills required to perform their job. During 2012, this work will be consolidated into a single Competency Assurance Management System and integrated with the recently implemented Learning Management System.
In 2011, the Company continued to deliver the ‘Leading the Oil Search Way’ programme, with an additional 80 supervisors completing a revised version of the programme, which focuses on supervisory skills and how to apply them in the context of Oil Search’s culture and people processes.
In order to assist employees to develop a better understanding of their personal finances and how to optimise the value of their remuneration package, Oil Search implemented a Financial Education Programme for PNG employees in 2011. Presented by experts sourced from the University of PNG and other external institutions, the programme covers topics fundamental to an understanding of the remuneration and benefits package, taxation, shares and superannuation.
During 2012, the Company will continue to implement these initiatives within Oil Search.
SAFETy PERFORmANCE IN 2011 Oil Search values its strong safety reputation and recognises that, as an oil and gas producer in remote locations, it operates within a high risk environment. Through effective leadership, commitment, behaviour and safe systems of work, the Company is committed to incident-free operations and the protection of its staff and its assets.
OIL SEARCH PEOPLE
42
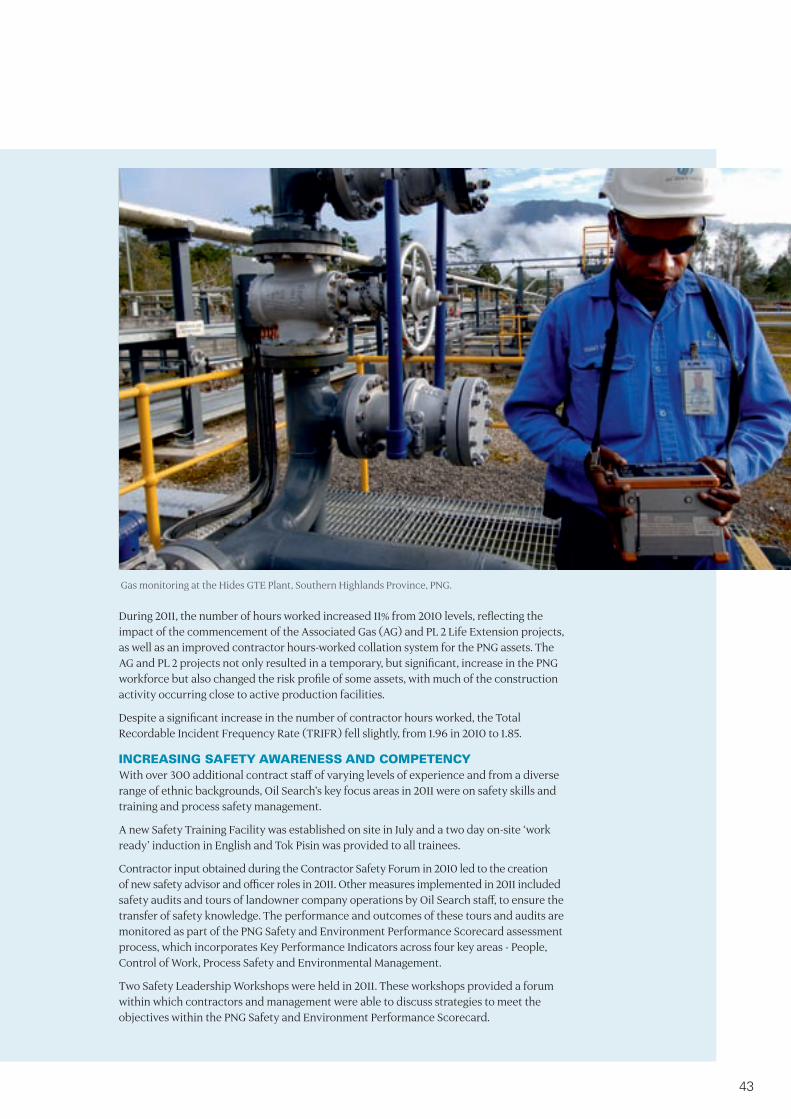
During 2011, the number of hours worked increased 11% from 2010 levels, reflecting the impact of the commencement of the Associated Gas (AG) and PL 2 Life Extension projects, as well as an improved contractor hours-worked collation system for the PNG assets. The AG and PL 2 projects not only resulted in a temporary, but significant, increase in the PNG workforce but also changed the risk profile of some assets, with much of the construction activity occurring close to active production facilities.
Despite a significant increase in the number of contractor hours worked, the Total Recordable Incident Frequency Rate (TRIFR) fell slightly, from 1.96 in 2010 to 1.85.
INCREASING SAFETy AwARENESS AND COmPETENCyWith over 300 additional contract staff of varying levels of experience and from a diverse range of ethnic backgrounds, Oil Search’s key focus areas in 2011 were on safety skills and training and process safety management.
A new Safety Training Facility was established on site in July and a two day on-site ‘work ready’ induction in English and Tok Pisin was provided to all trainees.
Contractor input obtained during the Contractor Safety Forum in 2010 led to the creation of new safety advisor and officer roles in 2011. Other measures implemented in 2011 included safety audits and tours of landowner company operations by Oil Search staff, to ensure the transfer of safety knowledge. The performance and outcomes of these tours and audits are monitored as part of the PNG Safety and Environment Performance Scorecard assessment process, which incorporates Key Performance Indicators across four key areas - People, Control of Work, Process Safety and Environmental Management.
Two Safety Leadership Workshops were held in 2011. These workshops provided a forum within which contractors and management were able to discuss strategies to meet the objectives within the PNG Safety and Environment Performance Scorecard.
Gas monitoring at the Hides GTE Plant, Southern Highlands Province, PNG.
43

SUSTAINABILITY
Oil Search has a long‑standing commitment to operating sustainably and acknowledges the importance of sustainable development to the preservation and growth of its business. The Company’s core values and business practices demonstrate this commitment. Oil Search seeks to be a leader in delivering sustainable operations, driven by integrity, innovation and partnership with governments and the communities with which it works. In doing so, it aims to contribute positively to the growth and development of local communities.
Local boy from Ai’io village, Southern Highlands Province, PNG.
44
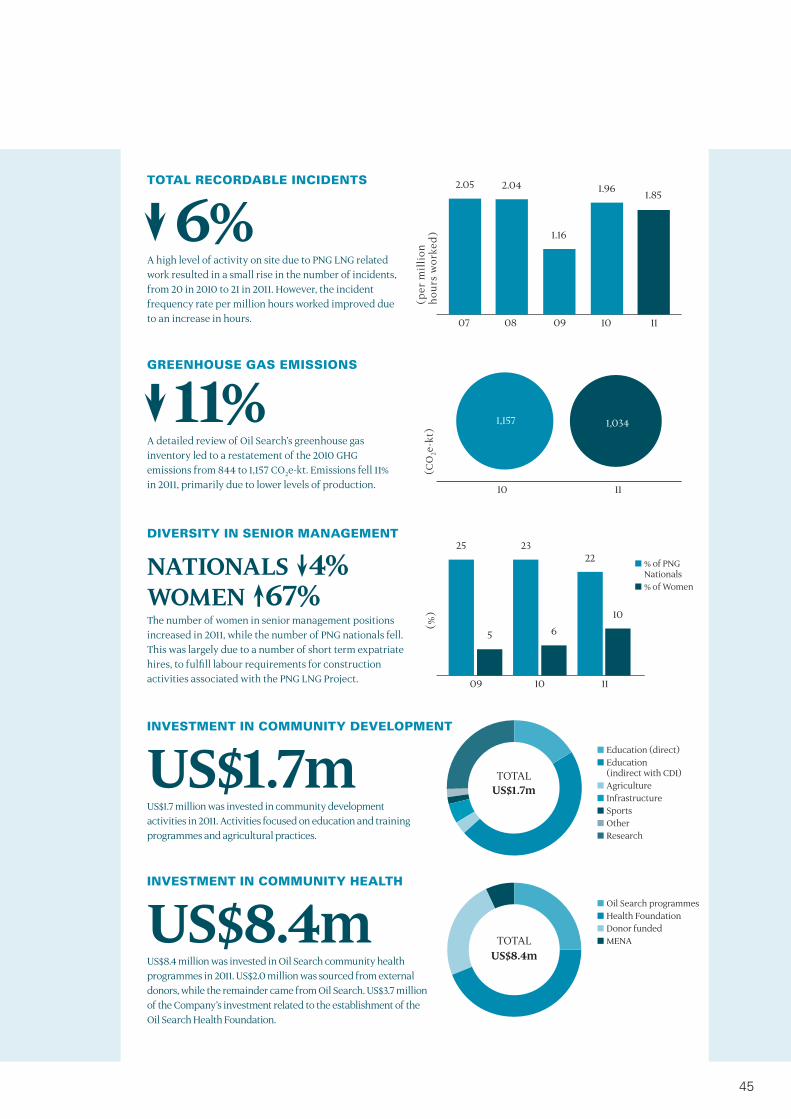
07 08 09 10 11
(p
er m
illi
on
hou
rs w
orke
d)
2.042.05
1.16
1.96 1.85TOTAL RECORDABLE INCIDENTS
6%A high level of activity on site due to PNG LNG related work resulted in a small rise in the number of incidents, from 20 in 2010 to 21 in 2011. However, the incident frequency rate per million hours worked improved due to an increase in hours.
10 11
(C
O2e
-kt)
1,0341,157
GREENHOUSE GAS EmISSIONS
11%A detailed review of Oil Search’s greenhouse gas inventory led to a restatement of the 2010 GHG emissions from 844 to 1,157 CO2e-kt. Emissions fell 11% in 2011, primarily due to lower levels of production.
INVESTmENT IN COmmUNITy DEVELOPmENT
US$1.7mUS$1.7 million was invested in community development activities in 2011. Activities focused on education and training programmes and agricultural practices.
Education (direct) Education
(indirect with CDI) Agriculture Infrastructure Sports Other Research
TOTALUS$1.7m
INVESTmENT IN COmmUNITy HEALTH
US$8.4mUS$8.4 million was invested in Oil Search community health programmes in 2011. US$2.0 million was sourced from external donors, while the remainder came from Oil Search. US$3.7 million of the Company’s investment related to the establishment of the Oil Search Health Foundation.
Oil Search programmes Health Foundation Donor funded MENA TOTAL
US$8.4m
09 10 11
(%
)
5
25 23
6
22
10
DIVERSITy IN SENIOR mANAGEmENT
NATIONALS 4% WOMEN 67% The number of women in senior management positions increased in 2011, while the number of PNG nationals fell. This was largely due to a number of short term expatriate hires, to fulfill labour requirements for construction activities associated with the PNG LNG Project.
% of PNG Nationals
% of Women
45

SUSTAINABILITYA strAteGIC sustAINAbILIty APPrOACH
The 2010 Strategic Review identified the importance of maintaining a sustainable approach for Oil Search’s operations. During 2011, emphasis was placed on identifying what is needed to optimise the Company’s sustainability performance, leveraging off current strengths. Key aspects of this were the formation of a sustainability governance structure, the establishment of a corporate sustainability function to drive sustainability performance and the development of a sustainability strategy. These changes will assist drive progress in Oil Search’s key sustainability priority areas, which include:
> Transparency and Efficiency. > Wealth and Benefits Distribution. > Stakeholder Management. > Community Development. > Community Health. > Environment.
ImPROVED SySTEmS AND CONTROLThe Company established a more formalised sustainability governance structure during 2011. This involved amending the Board charter to ensure appropriate Board visibility and oversight of sustainability and the creation of three new supporting sustainability groups.
An external review of the Company’s sustainability data management systems during the year identified a number of areas for improvement. Recommendations from this review have been incorporated into the sustainability strategy and will be progressively addressed during 2012.
Preparations continued for implementation of an enhanced integrated incident management system in 2012. The enhancements will enable more effective trend analysis and incident investigation, more consistent reporting and will assist in prioritising expenditure on Health, Safety, Environment and Security improvements.
In addition, a number of policies and procedures relating to key sustainability topics were reviewed or created during the year. This included the formulation of a Diversity Policy, work on developing a Sustainability Policy, as well as a review of the Code of Conduct and drafting of a Fraud and Corruption Prevention Framework.
EXTERNAL PARTICIPATION AND COmmUNICATION
In 2011, Oil Search joined over 8,700 other corporate participants worldwide to become a signatory to the UN Global Compact (UNGC).
UNGC is an international initiative for businesses committed to aligning their operations and strategies with ten universally accepted principles in the areas of human rights, labour, environment and anti-corruption. This will provide the Company with an internationally recognised framework to guide the integration of sustainability into core activities and the opportunity to utilise various participant forums to demonstrate and further develop the Company’s sustainability credentials.
kEy SUSTAINABILITy OBjECTIVES FOR 2012
1. Reach internal agreement on sustainability priorities and positions and set short, medium and long term objectives to drive change.
2. Establish an effective management framework to leverage existing strengths and address gaps and to ensure coordination, credibility and reliability of performance.
3. Build internal understanding and alignment with the Company’s commitment to sustainability.
4. Increase external sustainability credibility and the profile of Oil Search’s organisational capability and performance in sustainability.
5. Progressively introduce and enhance the adoption of benchmark activities.
See www.oilsearch.com/sustainability/sustainability-reporting.html to view all Oil Search’s 2011 sustainability reports.
46

SUSTAINABILITYOPerAtIONAL INteGrIty
The 2010 Strategic Review identified benefits management and ensuring adequate government structures within PNG as organisational priorities. This is of particular importance given the magnitude and longevity of the PNG LNG Project benefit streams.
Despite political instability in PNG during the year, Oil Search continued to work with the Government and bureaucracy on delivery of improved performance in these areas.
COmBATTING CORRUPTIONAnti-corruption measures are being targeted by the Company on three levels:
> Internal corruption prevention measures. > Oil Search’s own public disclosures. > Disclosures at the country-wide or industry-wide level.
During 2011, the Company’s Code of Conduct and related policies were reviewed, within the context of internal and external fraud and corruption obligations and leading industry practice. This review has led to the development of a Fraud and Corruption Prevention Framework, designed to address holistically fraud and corruption prevention. This framework will be implemented in 2012.
INCREASING PAymENT DISCLOSURES Transparency is a powerful tool in combatting corruption, particularly for extractive industries in developing countries, where payments are of a size that could impact government behaviour.
Oil Search strongly supports the Extractive Industries Transparency Initiative (EITI), a global coalition of
governments, institutions and companies aimed at strengthening governance by improving transparency and accountability in the extractive sector. During 2011, the Company actively supported the PNG Government’s investigations into the applicability of adopting EITI in PNG.
Efforts continued during the year to expand both the Company’s disclosures and the disclosures of the extractive industries in PNG more broadly. A reporting template, suitable for use under EITI, was developed. Details of Oil Search’s key government payments are contained in the 2011 Sustainability Data Book and the Oil Search Benefits Payment Report, due to be published in mid-2012.
DEVELOPING EFFECTIVE BENEFIT DELIVERy VEHICLES
Transparent benefit delivery mechanisms are critical in ensuring that the benefits from operational licence agreements are appropriately distributed. A review of various benefit streams identified the Oil Memorandum of Agreement and the Infrastructure Development Grants as being priorities for effective benefit delivery because of their potential size.
Oil Search’s involvement in the PNG Government’s Expenditure Implementation Committee (EIC) in 2011 provided the Company with the opportunity to be a part of the decision making process on benefits delivery. Drawing on Oil Search’s experience in PNG, the Company’s formal contribution to this process included the preparation of detailed public-private partnership infrastructure project delivery vehicle proposals.
Wellhead and production manifold, Kutubu, PNG.
47

SUSTAINABILITYCOMMuNIty DeVeLOPMeNt
The goal of Oil Search’s community development approach is to generate mutual benefit and value for both the Company and the community. Over the last three years, Oil Search’s community development focus has been on education and training, agriculture, health and sports development.
The Company’s community development activities cover three main areas:
> Direct programmes and initiatives. > Partnering with community groups and/or non-
government organisations. > Funds administered on behalf of the PNG Government.
DIRECT PROGRAmmES AND INITIATIVESOil Search’s direct programmes and initiatives are based on the concept that, with access to a quality education and the knowledge and skills to generate a source of income, communities are better equipped to adapt and provide for themselves in to the future.
Creating Agricultural-based Social Enterprise Led by Oil Search Business Development Officers, five agricultural-based co-operatives were created in 2011.
The key objectives of these co-operatives are to:
> Equip community members with the skills and knowledge to be able to generate a reliable income source and financial independence beyond the life of the oil projects.
> Improve nutrition and food security by providing access to training in new farming techniques, introducing new and more resilient crop options (i.e. rice, drought resistant yam) and alternative protein sources (chickens and fish farming).
Women have been targeted for this activity as it provides them with a less labour intensive food source, freeing them to spend time in other revenue producing activities or to continue their education.
Oil Search’s business development team assisted by providing advice on the co-operative structure and management and simple book-keeping, as well as providing training to local leaders on fish farming techniques and production of food stock from existing sources (e.g. sweet potatoes and the chaff produced from rice milling).
Sponsorship for Further EducationIn 2011, 21 new students entered the Oil Search Education Sponsorship Programme. At the end of the year, 14 sponsored students successfully completed their chosen courses and graduated from a number of tertiary education institutions in PNG.
PARTNERING wITH COmmUNITy GROUPS AND NGOSOil Search is able to enhance the impact of its activities by collaborating with NGOs and local community groups to achieve social development outcomes. By working with NGOs, the Company can leverage expertise and reach, while involving community groups greatly increases ownership and the likelihood that benefits will be maximised.
Working with the CDI Foundation In conjunction with the CDI Foundation, Oil Search contributed to the provision of a number of training programmes in 2011, including:
> Diploma in Education Primary In-Service training for those teachers insufficiently qualified to continue teaching after a change in teaching requirements.
> Agricultural practices development including rice farming, harvesting and milling, coffee nursery, transplanting and pruning, vegetable production, fish pond construction and farming.
> Community health including maternal child health programmes, immunisation, nutrition and cold chain management for medical supplies.
Community Area Planning ProgrammeThe Community Area Planning (CAP) programme aims to combine contributions of materials and funding not available locally, with community in-kind support, such as labour and land. In 2011, the CAP projects completed included six water catchment projects and the refurbishment and/or construction of nine churches in the project impact area. Oil Search’s main contributions consisted of materials such as cement, other building materials and skilled trade assistants.
Community Donations ProgrammeDonations of US$24,592 were provided to local institutions to improve their effectiveness. This money was spent on school stationery, desks, sports equipment, sewing machines and wheelbarrows.
48
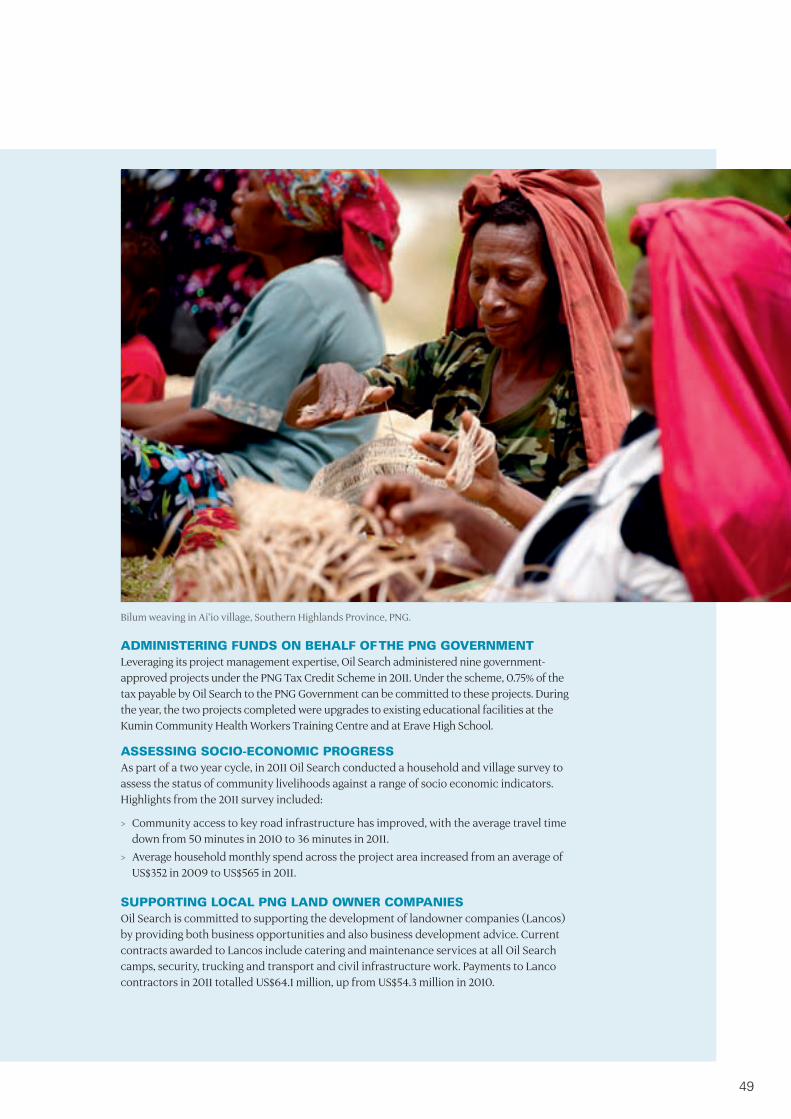
ADmINISTERING FUNDS ON BEHALF OF THE PNG GOVERNmENTLeveraging its project management expertise, Oil Search administered nine government-approved projects under the PNG Tax Credit Scheme in 2011. Under the scheme, 0.75% of the tax payable by Oil Search to the PNG Government can be committed to these projects. During the year, the two projects completed were upgrades to existing educational facilities at the Kumin Community Health Workers Training Centre and at Erave High School.
ASSESSING SOCIO-ECONOmIC PROGRESSAs part of a two year cycle, in 2011 Oil Search conducted a household and village survey to assess the status of community livelihoods against a range of socio economic indicators. Highlights from the 2011 survey included:
> Community access to key road infrastructure has improved, with the average travel time down from 50 minutes in 2010 to 36 minutes in 2011.
> Average household monthly spend across the project area increased from an average of US$352 in 2009 to US$565 in 2011.
SUPPORTING LOCAL PNG LAND OwNER COmPANIES Oil Search is committed to supporting the development of landowner companies (Lancos) by providing both business opportunities and also business development advice. Current contracts awarded to Lancos include catering and maintenance services at all Oil Search camps, security, trucking and transport and civil infrastructure work. Payments to Lanco contractors in 2011 totalled US$64.1 million, up from US$54.3 million in 2010.
Bilum weaving in Ai’io village, Southern Highlands Province, PNG.
49

“ Our commitment is driven by a strong sense of responsibility and a desire to play a role in the long term development and wellbeing of the people of PNG” – Peter Botten, Managing Director
With a well-established presence in PNG, Oil Search has a long history of delivering public health programmes in the country. In addition to the benefit this has directly on the families and members of the Company’s workforce, improving public health leads to a more productive and stable society within which to operate. Oil Search is taking an active role in the long term development and wellbeing of the people of PNG and initiating sustainable change.
OIL SEARCH HEALTH FOUNDATION ESTABLISHEDIn 2011, Oil Search established the Oil Search Health Foundation, a not-for-profit charitable trust whose trustee, Oil Search Health Foundation Limited, is a wholly owned subsidiary of Oil Search Limited. The establishment of the Oil Search Health Foundation represents a significant step forward in progressing one of the Company’s sustainability priority areas and strategic plan deliverables for 2011.
SUSTAINABILITYCOMMuNIty HeALtH
Medical examination at Iagifu Ridge Clinic, Southern Highlands Province, PNG
50
As a result, the Company’s investment in community health increased sharply, from US$1.6 million in 2010 to US$5.8 million in 2011. A large part of this increase comprised the first Oil Search donation to the Oil Search Health Foundation of US$3.7 million.
The Foundation will be responsible for working with the PNG Government, non-government and donor partners in designing and implementing public health initiatives. These include clinical services, community health campaigns, staff education, mentoring and support programmes and research and development. With a robust organisational structure in place and a detailed monitoring and evaluation framework established, the Foundation will be a fully transparent entity. It will enable Oil Search and donor partners to direct funds and resources to achieve a range of community health objectives across PNG.
A notable achievement for the Foundation in 2011 was being nominated as a Principal Recipient for Round 10 (HIV) and Round 8 (Malaria) grants from the Global Fund to Fight AIDS, Tuberculosis and Malaria (Global Fund). This role involves administering in excess of US$68 million on programmes within PNG over the next five years. Oil Search is one of only a few private sector companies globally to be granted Principal Recipient status. This has established the Foundation as a credible recipient of international donor funds and is also a tribute to Oil Search’s past success in delivering effective public health outcomes.
COmmUNITy HEALTH PROGRAmmE EXPANDEDPrimary responsibility for the management and delivery of Oil Search’s core public health programmes in HIV, malaria and child health now rests with the Foundation. While historically Oil Search has conducted its community health programmes only within its project areas, the Foundation will expand its presence into many new provinces.
CONTINUING THE E mPHASIS ON HIVOil Search conducted 5,129 HIV tests in 2011, an increase of 18% from 2010. There was a slight increase in tests found positive for HIV, from 0.7% to 0.9%. This, together with a small decrease in the percentage of patients with HIV remaining on treatment 12 months later, highlights the importance of scaling up HIV testing in the community. There have been improvements in preventing mother-to-child-transmission, with the percentage of mothers receiving treatment increasing from 33% in 2010 to 100% in 2011. Consequently, no infants who were part of this programme were diagnosed as HIV positive in either 2010 or 2011.
PROGRESSING TO A COmmUNITy BASED mALARIAL APPROACHTo increase malaria medicine accessibility, Oil Search has gradually moved from a clinic-focussed approach to one that is more community based. This primarily involved expanding the ‘Marasin Stoa Kipa’ (MSK) Programme (Medicine Store Keeper). In this programme, Oil Search is partnering with the Evangelical Church of PNG health service to run the programme and develop ways to increase and strengthen the quality of the service delivered. Despite considerable population movement in the Highlands area due to work opportunities, during 2011 there were only small malaria outbreaks across the areas which were serviced by the MSK programme. The annual malaria incidence per 1,000 people in the project area fell from 315 in 2010 to 120 in 2011, while the percentage of malaria rapid diagnostic tests proving positive declined from 42.8% to 21.8%.
INCREASING ENGAGEmENT ON mATERNAL AND CHILD HEALTHMaternal and child health outcomes across all indicators improved in 2011 within the project area. Women accessing health facilities for maternal healthcare increased from 384 in 2010 to 1,300 in 2011. This trend demonstrates increased engagement with the community and the strengthening of health workers’ capacity and the health system. The focus on training, improvements in vaccine supply and logistics, outreach activities, quality assurance measures and monitoring resulted in immunisation coverage increasing by 25% in 12 months.
APPLyING THE SAmE PRINCIPLES IN mENAAlthough on a much smaller scale, the Company’s approach to community development and health in the Kurdistan Region of Iraq, Yemen and Tunisia is managed in a similar manner, but appropriate to the local context. Considerable civil upheaval in both Yemen and Tunisia in 2011 slowed Oil Search’s community development investment into these countries and in some instances the presence was reduced.
51

SUSTAINABILITYeNVIrONMeNt
Beaver Falls, Southern Highlands Province, PNG.
52
Oil Search operates in a diverse range of environments, including tropical, desert and marine. With the majority of its operations in PNG, one of the most pristine and biologically diverse regions in the world, the Company has both the opportunity and moral obligation to demonstrate leading environmental management practices. All necessary steps are undertaken to ensure environmental issues are considered prior to, and during various stages of operations.
ENVIRONmENTAL mANAGEmENT SySTEmS AND PERFORmANCEAn environmental management system (EMS) compliant with ISO 14001 is in place in all the Company’s major areas of operation in PNG. This ensures a consistent and robust approach to managing environmental risks and demonstrates Oil Search’s commitment to continuous performance improvement. The EMS applies to all stages of operations, from drilling through to decommissioning.
In December 2011, Oil Search’s environmental management system was recertified against the requirements of ISO 14001. Priority was placed on remedying areas identified for improvement to ensure certification is maintained. Progress on this action plan is regularly monitored by senior management. Key Performance Indicators relating to ISO 14001 performance improvement have been identified for all field based operations teams and management for 2012.
After dropping by 50% from 2009 to 2010, the total number of environmental incidents rose slightly in 2011. This can be attributed to an improved reporting culture and an increase in construction activity on site related to the PNG LNG-associated projects. All incidents were classified as having a minor impact on the environment and there were no incidents of a size reportable to the Department of Petroleum and Energy.
CONSOLIDATING GREENHOUSE GAS PERFORmANCE Oil Search is committed to reducing its greenhouse gas (GHG) emissions.
A review of the Company’s GHG inventory collation and reporting process identified errors in the 2010 inventory, leading to a restatement of the 2010 data from 844 CO2e–kt to 1,157 CO2e–kt. The majority of this restatement related to the inclusion of some sources which had been originally incorrectly excluded and the application of a set of consistent and up-to-date emission factors. Detailed procedures for the compilation of the inventory have been drafted, to ensure consistency in the process going forward.
In 2012, the Company intends to focus on improving its data management systems to enable the development of credible baseline data. A carbon management strategy is planned to be delivered in alignment with the commencement of LNG sales in 2014.
During 2011, a target to reduce GHG emissions intensity across the Company’s operations was set.
More information can be found at www.oilsearch.com/sustainability/sustainability-reporting.html
CLEAN DEVELOPmENT mECHANISm PROjECT PROPOSAL SUBmITTEDDuring 2011, investigations into potential emission reduction projects eligible for carbon credits under the Clean Development Mechanism (CDM) were conducted and a submission to the United Nations Framework Convention for Climate Change (UNFCCC) was made. The project comprises several initiatives to minimise flaring and venting of associated gas within the oil production operations and will involve the Central Processing Facility, Kutubu refinery and Gobe Processing Facility. The project has an estimated potential annual reduction of 64,000 CO2e–t. However, the skills and technology developed by this project will be transferrable across PNG and therefore may result in an even larger benefit. If the UNFCCC application is successful, the project will proceed on a schedule with the defined Certified Emission Reduction (CER) crediting period, which commences shortly after first LNG sales.
mONITORING wATER CONSUmPTION AND wASTEA review of the Company’s waste tracking, reporting and storage processes for hazardous and chemical waste commenced in 2011. This is a priority due to the difficulty involved in sourcing appropriate locations locally to treat the waste and limited appropriately licenced contractors to transport this waste. Investigations are being undertaken for the disposal and removal of chemicals in line with the “Basel Convention on the Control of Trans-boundary Movements of Hazardous Wastes and their Disposal”.
53

CORPORATE GOVERNANCE
A commitment to strong corporate governance is embedded in all activities undertaken by Oil Search. The Company believes that adopting high standards of corporate governance is essential for long term, sustainable performance. Oil Search fosters a culture that respects ethical behaviour, integrity, transparency and diversity.
COmmITmENT TO GOOD GOVERNANCEIt is understood that the corporate governance model of a company will need to change over time as the company itself changes and that no single model will fit the needs of all companies. Therefore, Oil Search’s governance approach is structured to address its current business and the expectations of stakeholders in the context of the overall development of governance standards.
Oil Search endeavours to observe the spirit of good corporate governance by those means which are most appropriate to its business.
Oil Search firmly believes that the more transparent it is about its governance practices, the better placed investors will be to make informed investment decisions.
Oil Search has reported against the ASX Corporate Governance Council’s Corporate Governance Principles and Recommendations (the “CGC Recommendations”) each year since their first release in 2004. In 2010, a number of significant amendments were made to the CGC Recommendations which apply to Oil Search from 1 January 2011. This report incorporates reporting against the revised CGC Recommendations.
ASX CORPORATE GOVERNANCE PRINCIPLES AND RECOmmENDATIONSOil Search believes it followed all the CGC Recommendations during the twelve months ended 31 December 2011.
In reporting against the CGC Recommendations for 2011, Oil Search:
> Addresses the CGC Recommendations consecutively. > Includes cross references to information not included
in the corporate governance statement, but located elsewhere in the 2011 Annual Report or on the Company’s website.
LAy SOLID FOUNDATIONS FOR mANAGEmENT AND OVERSIGHTOil Search’s internal systems and procedures are designed to enable the Board to provide strategic guidance for the Company and effective management oversight.
Oil Search has formalised and defined the functions reserved for Board and those delegated to management in a formal Board Charter. This charter defines Board duties to facilitate accountability to the Company and its shareholders. (Recommendations 1.1 and 1.3)
The Board and the Managing Director review the performance of senior executives on a regular basis.
The Managing Director usually conducts an annual performance review with senior executives. The performance of each senior executive during the year is assessed, having regard to a variety of individual and corporate key performance indicators and stretch targets. The Board also assesses the performance of the Managing Director. The Chairman meets with the Managing Director and gives him feedback on that assessment. (Recommendation 1.2)
Performance evaluations for all senior executives were carried out in the reporting period, in accordance with the process disclosed in the above paragraph. The Company also expects that during 2012 performance evaluations for all senior executives will be carried out in accordance with that process. (Recommendation 1.2 and 1.3)
Copies of the Board Charter and the Charters for each of the three Board Committees are on Oil Search’s website in the corporate governance section. (Recommendation 1.3)
STRUCTURE THE BOARD TO ADD VALUEOil Search recognises that an effective Board facilitates the efficient discharge of the duties imposed by law on directors and adds value in the context of Oil Search’s strategic objectives. Accordingly, Oil Search has structured its Board so that it:
> Has a proper understanding of, and the competencies to deal with, the current and emerging issues in Oil Search’s business.
> Exercises independent judgement. > Encourages enhanced performance of the Company. > Effectively reviews and challenges management’s
performance.
54

1. BF HORWOOD CHAIRMAN2. PR BOTTEN3. G AOPI4. JL STITT5. R IGARA6. KG CONSTANTINOU7. ZE SWITKOWSKI8. AJ KANTSLER9. MDE KRIEWALDT
1.
4.
7.
2.
5.
8.
3.
6.
9.
55

CORPORATE GOVERNANCE CONTINUED
During 2011:
> At all times, a majority of Oil Search’s directors were independent, as assessed in accordance with the Board Charter and the CGC Recommendations, and met regularly without management present. (Recommendation 2.1)
> The Chairman, Brian Horwood, was an independent director. (Recommendation 2.2)
> The roles of Chairman and Managing Director were not performed by the same individual. (Recommendation 2.3)
The Board has a Remuneration and Nominations Committee compromising four independent directors. The members of the Remuneration and Nominations Committee and their attendance at meetings of the Committee during 2011 are detailed in the Directors’ Report. (Recommendations 2.4 and 2.6)
The responsibilities of the Remuneration and Nominations Committee include the identification of suitable candidates for appointment to the Board, in the event of a need to recruit a new director. (Recommendation 2.4)
The Company believes that its Board should consist of directors bringing an appropriately diverse mix of skills and experiences that are compatible with the Company’s operating activities, geographic focus and strategic direction. In particular, the overall mix of directors’ skills should cover the industry and countries in which Oil Search operates and address accounting, finance and legal matters. The Board has developed a skills matrix that records the mix of skills, experience and technical capabilities of existing directors and assists in identifying any deficiencies compared to the overall targeted mix of capabilities that have been defined for the Board. This gap analysis is used to support the process of preparing the recruitment brief given to the recruitment firm or firms selected to search for a prospective new director when a Board vacancy arises. (Recommendation 2.6)
The Oil Search Board operates a formal annual review process for the Board and individual directors. The process involves each director completing a detailed questionnaire covering the performance of the Board as a whole, the performance of the three Board Committees, the individual director’s own performance and the performance of the Chairman. The Chairman then meets with each director to review their responses to the questionnaire and to give the director the Chairman’s own views on how the director has performed during the year. This formal annual review process was completed in 2011. (Recommendation 2.6)
A more detailed explanation of Oil Search’s annual review process for the Board and individual directors is available on Oil Search’s website in the corporate governance section. (Recommendation 2.5)
New directors participate in an induction programme to assist them in understanding Oil Search’s strategic objectives, values and culture, financial performance, operations and risk management systems. The induction process also covers relevant administrative and procedural arrangements to promote the effective functioning of the Board. A programme of continuing education is offered to all directors, including the practice of inviting external industry and subject specialists to present to the Board on matters of general relevance to the Company.
The skills, experience and relevant expertise of each director in office at the date of the Annual Report is detailed in the Directors’ Report. Prior to their appointment to the Board, directors are required to provide the Chairman with details of their other commitments to make sure that, following their appointment, directors will have sufficient time to carry out their Oil Search duties. (Recommendation 2.6)
Each Oil Search director (other than the Managing Director, Peter Botten and Executive Director, Gerea Aopi) is considered by the Board to be an independent director. The independence of directors is assessed regularly. For the avoidance of doubt, only non-executive directors (that is, directors who are not members of management) can be considered independent. The Board takes account of all circumstances relevant to a director in determining whether the director is free from any external interest or any business or other relationship which could, or could reasonably be perceived to materially interfere with the director’s ability to act in the best interests of the Company. In determining materiality, the Board has regard, among other things, to the matters detailed in paragraph 3.3 of the Board Charter. (Recommendations 2.1 and 2.6)
There is a procedure in place for directors to take independent professional advice. In particular, a director may obtain independent professional advice if this is reasonably required to assist the director in the proper exercise of the powers and discharge of the duties of a director of the Company. The costs of such independent professional advice are borne by the Company, provided that before engaging the independent professional adviser, the director obtains the approval of the Chairman, or, if the director is the Chairman, the approval of a majority of the non-executive directors of the Company. (Recommendation 2.6)
56

The period of office held by each director in office at the date of the 2011 Annual Report is specified in the Directors’ Report. (Recommendation 2.6)
Oil Search’s Constitution and the Charter of the Remuneration and Nominations Committee are available on Oil Search’s website in the corporate governance section. In addition, the selection and appointment policy and process for the selection and appointment of new directors is disclosed in the same section. (Recommendation 2.6)
PROmOTE ETHICAL AND RESPONSIBLE DECISION mAkINGOil Search actively promotes ethical and responsible decision making.
Oil Search has a Code of Conduct which is supported by a training module and periodic monitoring of compliance. Among matters addressed, the Code of Conduct details the Company’s requirements regarding monetary payments and gifts offered by third parties to Oil Search personnel. (Recommendation 3.1)
Oil Search is committed to promoting diversity across the Company at all levels, including at board level. In particular, as a PNG company, Oil Search is focused on training and developing its PNG citizen employees so that they are equipped to assume leadership positions across the Company. In 2011, the Board approved a Diversity Policy for the Company that reflects this commitment and includes the requirement for setting and reporting on measurable objectives for increasing diversity, including the representation of PNG citizens and women in leadership roles. (Recommendation 3.2)
The Company’s objectives for 2012 in support of the implementation of the Diversity Policy are set out on page 61 of the 2011 Annual Report. (Recommendation 3.3)
Key measures of diversity across the Oil Search organisation, including the proportion of women employees in total, women in senior management positions and women on the Board are summarised on page 61 of the 2011 Annual Report and set out in more detail in the 2011 Sustainability Report. (Recommendation 3.4)
The Code of Conduct and the Diversity Policy are available on Oil Search’s website in the corporate governance section. (Recommendation 3.5)
SAFEGUARD INTEGRITy IN FINANCIAL REPORTINGOil Search recognises the importance of being able to independently verify and safeguard the integrity of the Company’s financial reporting and has a structure in place to achieve this. This structure includes:
> Review and consideration of the financial statements by the Audit Committee.
> A process to ensure the independence and competence of the Company’s external auditors.
The Board has an Audit Committee. (Recommendation 4.1)
At all times during 2011 the Audit Committee consisted of:
> Non-executive directors only. > Independent directors only. > An independent chairman who was not chairman of
the Board. > Four members. (Recommendation 4.2)
The Audit Committee has a formal charter that details its role and responsibilities, composition, structure and membership requirements. (Recommendations 4.3 and 4.4)
The members of the Audit Committee, their qualifications and their attendance at meetings of the Committee held during 2011, are detailed in the Directors’ Report. (Recommendation 4.4)
The number of meetings of the Audit Committee held during 2011 is detailed in the Directors’ Report. (Recommendation 4.4)
The external auditors attended all Audit Committee meetings in 2011. The external auditors held discussions at each meeting with the Committee members and without management present. Oil Search’s policy is to appoint an internationally recognised, external audit firm with expertise in the resources sector. Deloitte Touche Tohmatsu initially was appointed the Company’s auditor in May 2002. The Audit Committee reviews the performance of the external auditor and the rotational plan for external audit partners. The Committee recommends the tendering and selection of the external auditor to the Board. The external audit was tendered in March 2009 to a range of qualified international audit firms, with Deloitte Touche Tohmatsu successful in re-securing the role. The re-appointment of Deloitte Touche Tohmatsu was approved at the 2011 Annual Meeting.
Deloitte Touche Tohmatsu’s professional requirements mandate that each lead audit partner rotates from his or her client after five years of service. That policy is followed for the Oil Search assignment and a partner rotation occurred 2011. (Recommendation 4.4)
57

CORPORATE GOVERNANCE CONTINUED
Internal auditing processes are carried out by Oil Search’s Assurance and Compliance function, with assistance from external consulting firms as required.
The Audit Committee Charter is available on Oil Search’s website in the corporate governance section. (Recommendation 4.4)
mAkE TImELy AND BALANCED DISCLOSUREOil Search promotes timely and balanced disclosure of all material matters concerning the Company. Oil Search has mechanisms designed to ensure compliance with the ASX Listing Rule requirements, such that:
> All investors have equal and timely access to material information concerning the Company, including its financial position, performance, ownership and governance.
> Company announcements are factual and presented in a clear and balanced way, including disclosure of both positive and negative information.
Oil Search has written policies designed to ensure compliance with ASX Listing Rule disclosure requirements and to ensure accountability at a senior manager level for that compliance. (Recommendation 5.1)
Although not required by the PNG regulatory framework, but reflecting its commitment to maintaining good governance practice, Oil Search elects to include a Remuneration Report within the Directors’ Report. The 2011 Remuneration Report complies with section 300A of the Australian Corporations Act 2001(Cth) and has been audited by Deloitte Touche Tohmatsu.
Oil Search’s Public Disclosure and External Communications Policy is available on Oil Search’s website in the corporate governance section. (Recommendation 5.2)
RESPECT THE RIGHTS OF SHAREHOLDERSOil Search aims to empower its shareholders by:
> Communicating effectively with them. > Giving them ready access to balanced and
understandable information about the Company and corporate proposals.
> Making it easier for them to participate in general meetings.
Oil Search has a Communication Standard designed to promote effective communication with shareholders and to encourage their participation at general meetings. (Recommendation 6.1)
As a company incorporated in Papua New Guinea, Oil Search’s Annual Meeting is held in Port Moresby. The meeting is webcast to shareholders outside Papua New Guinea. Oil Search’s Constitution requires the Chairman of the Annual Meeting to allow a reasonable time for shareholders at the meeting to question, discuss and comment on the management of the Company. A representative of the external auditor attends Oil Search’s Annual Meeting. The representative is available at the meeting to answer shareholder questions about the audit and the Auditor’s Report.
When the Company holds major investor briefings such as the half and full year results presentations, electronic facilities such as webcasting and teleconferencing are utilised to facilitate wide participation.
The Oil Search website is regularly updated to give all shareholders ready access to balanced and easy to understand information about the Company and its business activities.
Oil Search liaises closely with a range of relevant institutions, including the Australian Shareholders Association. Shareholder queries are answered promptly, comprehensively and courteously.
Oil Search’s Public Disclosure and External Communications Policy is available on Oil Search’s website in the corporate governance section. Oil Search’s website details how investors may contact the Company’s investor relations team. In addition, the website contains contact details for the Company’s external share registry, including a general enquiry line, fax number and email details. (Recommendation 6.2)
RECOGNISE AND mANAGE RISkOil Search recognises that risk management is a fundamental component of managing the oil and gas business and the Company has in place an extensive system of risk oversight, management, reporting and internal control and compliance monitoring.
Oil Search conducts annual reviews of its risk management policies and standards. These reviews cover the process for reporting on the identification, assessment and management of material business risks, including Board and committee reviews of material business risks reports prepared by management.
Oil Search has policies and standards in place covering the oversight and management of material business risks encountered within the oil and gas environment. These policies and standards are based upon management of the hazards and exposures inherent in Oil Search’s business activities.
58

Oil Search’s risk profile incorporates the following areas of exposure:
> Strategic and business > Asset and operations management > Governance > Financial > Information technology > External factors > Health, safety and security > Environmental > Human resources
Oil Search has developed standards and management processes in support of the policies covering each of these areas. Oil Search’s website contains a summary of these documents. (Recommendation 7.1)
The Board requires management to design and implement a risk management and internal control system to manage the Company’s material business risks. During 2011, management regularly reported to the Board on those material business risks. (Recommendations 7.2 and Recommendation 7.4)
In developing its risk management systems, Oil Search has considered its legal obligations and its responsibilities to various interest groups. Oil Search recognises that many groups, including shareholders, employees, customers, suppliers, creditors, consumers, landowners, government authorities and the broader community, both locally and internationally, have a legitimate interest in the Company’s risk management policies and procedures. Oil Search takes account of the potential impacts on and consequences for all stakeholders when assessing risk exposures.
Oil Search’s risk management framework is based on the International Standard for Risk Management (ISO31000). Aspects of other internationally developed risk frameworks, such as the “Enterprise Risk Management Model” developed by the Committee of Sponsoring Organisations of the Treadway Commission, have been incorporated as appropriate.
Oil Search has identified its material business risks and actively manages those risks. All material business risks that arise in the course of the Company’s activities have clearly defined management ownership and accountability for reporting to the Board.
The Board is responsible for reviewing the Company’s policies on risk oversight and management. In doing so, the Board satisfies itself that management has developed and implemented a sound system of risk management and internal control.
Oil Search has a Finance and Risk Management Committee responsible for monitoring the risk management system. While the Finance and Risk Management Committee assists the Board to fulfil its risk oversight obligations, ultimate responsibility for risk oversight and risk management rests with the full Board.
Minutes of all Board committee meetings are reviewed by the full Board. The Chairman of the Board attends committee meetings as an ex officio member. Board members are also invited to attend senior management meetings to observe the risk management process in action. The members of the Finance and Risk Committee, their qualifications and attendance at meetings of the Committee during 2011, are detailed in the Directors’ Report.
Oil Search has a full time Assurance and Compliance Manager with responsibility for managing the internal audit function. As part of their duties, the Assurance and Compliance Manager provides independent assurance on the adequacy and effectiveness of the Company’s risk management framework and the completeness and accuracy of risk reporting by management. The Assurance and Compliance Manager conducts annual risk reviews based on a plan agreed with management and the Audit Committee and the Finance and Risk Committee. The Assurance and Compliance Manager has access to all members of the management team and the right to seek information and explanations from any staff member or contractor.
The Assurance and Compliance Manager is independent of the external auditor and meets privately with the Chairman of the Audit Committee. The Assurance and Compliance Manager is also invited to attend and report to Audit Committee meetings. The Audit Committee reviews the performance of the Assurance and Compliance Manager and approves their appointment and termination.
The Managing Director and Chief Financial Officer are both required to state in writing to the Board that the integrity of the Company’s financial statements is based on a sound system of risk management, as well as internal compliance and control, which implements the Board’s policies. In addition, senior managers are required to confirm to the Managing Director and to the Chief Financial Officer in writing that key company policies and standards have been operating effectively throughout the year, including the operation of risk management processes, mitigation opportunities and contingency plans. The Managing Director and Chief Financial Officer provided an unqualified statement regarding risk management and internal compliance and control systems to the Board for 2011.
59

CORPORATE GOVERNANCE CONTINUED
The Board requires the Managing Director and the Chief Financial Officer to provide a declaration that is consistent with section 295A of the Australian Corporations Act 2001 (Cth). The Board received this declaration from the Managing Director and the Chief Financial Officer in 2011. In addition, as noted above, the Board also received reports from management during 2011 regarding the management of material business risks. (Recommendations 7.3 and Recommendation 7.4)
A summary of the Company’s policies on risk oversight and management is available on Oil Search’s website in the corporate governance section. (Recommendation 7.4)
REmUNERATE FAIRLy AND RESPONSIBLyOil Search’s policy is to ensure that the level and composition of remuneration for all employees is competitive and reasonable and that the relationship between remuneration and corporate and individual performance is clearly defined.
Oil Search has established a Remuneration and Nominations Committee. (Recommendation 8.1)
At all times during 2011, the Remuneration and Nominations Committee consisted of:
> Independent directors only. > An independent chairman. > At least four members. (Recommendation 8.2)
Oil Search clearly distinguishes the structure of non-executive director remuneration from that of executive director and senior executive remuneration. Oil Search’s policy in relation to remuneration is detailed in the Remuneration Report. (Recommendation 8.3)
The payment of any equity-based remuneration is made in accordance with plans approved by shareholders. Oil Search has a Long Term Incentive Plan that allows the Board the flexibility to grant employees Performance Rights, Share Appreciation Rights, Share Options and Restricted Shares. Non-executive directors do not participate in these plans.
Within the aggregate amount approved by shareholders, the fees of the Chairman and non-executive directors are set at levels in line with the responsibilities of those directors and the time spent by those directors in discharging their duties. In setting fees, regard is also given to the level of fees paid to directors of similar companies. Non executive directors are not currently entitled to retirement benefits. (Recommendations 8.3 and 8.4)
Remuneration packages of senior executives include both short term and long term performance based components. Rights granted under the Performance Rights Plan to senior executives are linked to the long term return to shareholders from investing in Oil Search. Performance Rights only vest following satisfaction of performance hurdles that are designed to maximise shareholder wealth. Further details of the terms and conditions of short term and long term incentive plans are set out in the Remuneration Report.
The members of the Remuneration and Nominations Committee, their qualifications and attendance at meetings of the Committee during 2011 are detailed in the Directors’ Report. (Recommendation 8.4)
The Remuneration and Nominations Committee’s charter is available on Oil Search’s website in the corporate governance section. (Recommendation 8.4)
Oil Search’s Share Trading Policy expressly prohibits employees entering into transactions in financial products which limit the economic risk of participating in unvested entitlements under equity-based remuneration schemes. The Share Trading Policy is available on Oil Search’s website in the corporate governance section. (Recommendation 8.4)
DIVERSITyOil Search is committed to promoting diversity across the Company, in recognition that an engaged and diverse workforce will contribute to improved operating performance and achievement of strategic objectives.
During 2011, the Company adopted a new Diversity Policy which outlines our key commitments including matters relating to recruitment, promotion and retention, and addressing barriers to the merit-based advancement of women and PNG citizens within the Company.
As a PNG company, Oil Search is focused particularly on training and developing its PNG citizen employees so that they are equipped to assume leadership positions across the Company.
The Company has established measurable objectives to increase the diversity mix of both the workforce and the Board.
60
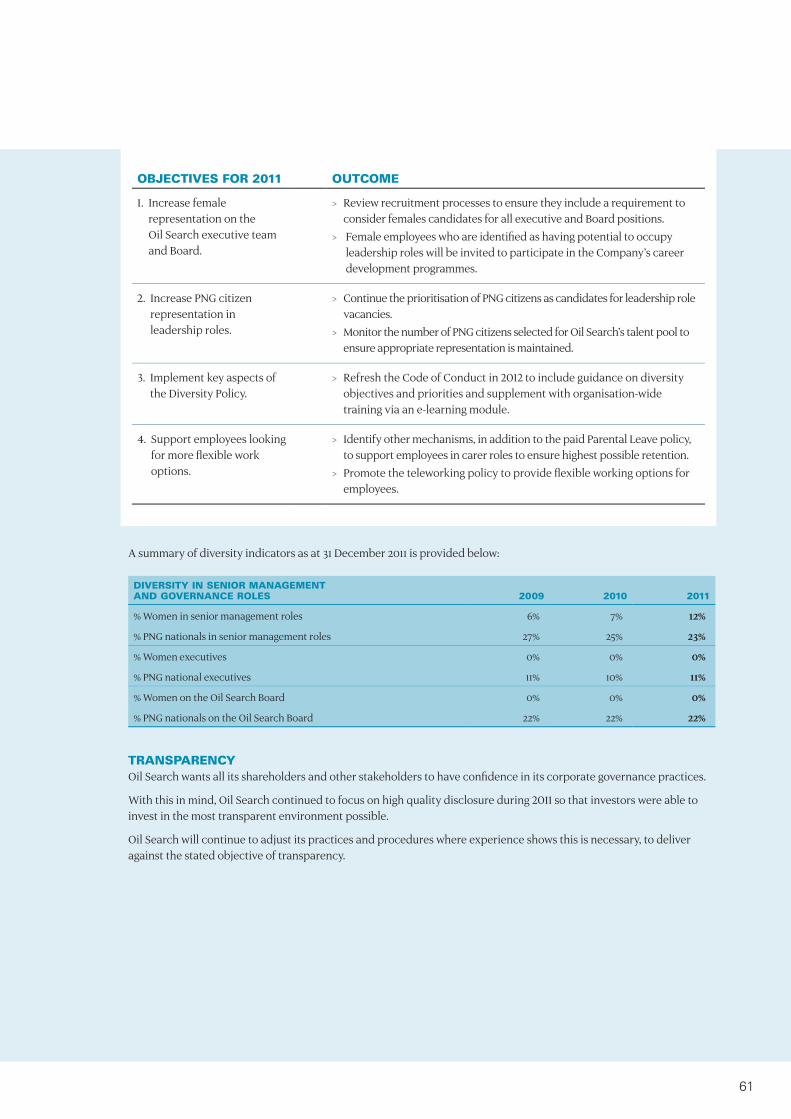
A summary of diversity indicators as at 31 December 2011 is provided below:
DIVERSITy IN SENIOR mANAGEmENT AND GOVERNANCE ROLES 2009 2010 2011
% Women in senior management roles 6% 7% 12%
% PNG nationals in senior management roles 27% 25% 23%
% Women executives 0% 0% 0%
% PNG national executives 11% 10% 11%
% Women on the Oil Search Board 0% 0% 0%
% PNG nationals on the Oil Search Board 22% 22% 22%
TRANSPARENCyOil Search wants all its shareholders and other stakeholders to have confidence in its corporate governance practices.
With this in mind, Oil Search continued to focus on high quality disclosure during 2011 so that investors were able to invest in the most transparent environment possible.
Oil Search will continue to adjust its practices and procedures where experience shows this is necessary, to deliver against the stated objective of transparency.
OBjECTIVES FOR 2011 OUTCOmE
1. Increase female representation on the Oil Search executive team and Board.
> Review recruitment processes to ensure they include a requirement to consider females candidates for all executive and Board positions.
> Female employees who are identified as having potential to occupy leadership roles will be invited to participate in the Company’s career development programmes.
2. Increase PNG citizen representation in leadership roles.
> Continue the prioritisation of PNG citizens as candidates for leadership role vacancies.
> Monitor the number of PNG citizens selected for Oil Search’s talent pool to ensure appropriate representation is maintained.
3. Implement key aspects of the Diversity Policy.
> Refresh the Code of Conduct in 2012 to include guidance on diversity objectives and priorities and supplement with organisation-wide training via an e-learning module.
4. Support employees looking for more flexible work options.
> Identify other mechanisms, in addition to the paid Parental Leave policy, to support employees in carer roles to ensure highest possible retention.
> Promote the teleworking policy to provide flexible working options for employees.
61

62

financial statements contentsfoR tHe financial YeaR enDeD 31 DecemBeR 2011
Page
Directors’ report 64
Auditor’s independence declaration 91
Statements of comprehensive income 92
Statements of financial position 93
Statements of cash flows 94
Statements of changes in equity 95
Notes to the financial statements
1 Summary of significant accounting policies 97
2 Revenue from operations 103
3 Other expenses 103
4 Significant items 103
5 Net financing costs 104
6 Income tax 104
7 Earnings per share 105
8 Dividends paid or proposed 105
9 Receivables 106
10 Inventories 106
11 Other assets 106
12 Exploration and evaluation assets 107
13 Oil and gas assets 107
14 Other property, plant and equipment 108
15 Non-current investments 108
16 Deferred tax assets 109
17 Payables 109
18 Provisions 109
19 Loans and borrowings 110
20 Deferred tax liabilities 111
21 Share capital and reserves 112
22 Statement of cash flows 114
23 Interests in jointly controlled operations 115
24 Segment reporting 117
25 Employee entitlements and superannuation commitments 118
26 Key management personnel remuneration 123
27 Auditor’s remuneration 124
28 Related party transactions 125
29 Leases 126
30 Contingent liabilities 126
31 Group entities 126
32 Financial instruments 127
Directors’ declaration 133
Independent Auditor’s report 134
63

DiRectoRs’ RepoRt foR tHe financial YeaR enDeD 31 DecemBeR 2011
The directors submit their report for the financial year ended 31 December 2011.
DIRECTORSThe names, details and shareholdings of the directors of the company in office during or since the end of the financial year are:
Mr BF Horwood, B.CoMM., F.A.I.C.d., F.C.P.A. (CHAIrMAn), non-ExECutIvE, 70 yearsMr Horwood was appointed a director on 28 May 2004 and Chairman of Oil Search on 1 June 2004. Prior to joining Oil Search, Mr Horwood had 35 years experience with the Rio Tinto Group, having held executive positions in Australia, the United Kingdom and Papua New Guinea. Most recently, Mr Horwood was Managing Director, Rio Tinto-Australia. Mr Horwood was previously the Chairman of Energy Resources of Australia Limited and Coal and Allied Industries Limited. He has been a member of the Business Council of Australia and a director of the Minerals Council of Australia. Ordinary shares, fully paid: 12,500; Options: nil
Mr Pr BottEn, CBE, B.SC. ArSM, (MAnAgIng dIrECtor), ExECutIvE, 57 yearsMr Botten was appointed Managing Director on 28 October 1994, having previously filled both exploration and general manager roles in the company since joining in 1992. He has extensive worldwide experience in the oil and gas business, previously holding various senior technical and managerial positions in a number of listed and government owned organisations. Mr Botten is immediate past President of the Papua New Guinea Chamber of Mines and Petroleum and is on the Executive Committee of the Australia PNG Business Council. He is also a Director of Business for Millenium Development. He was awarded Commander of the Order of the British Empire (CBE) in the 2008 Queen’s Birthday Honours List for services to commerce and the mining and petroleum industry in Papua New Guinea. Ordinary shares, fully paid: 1,801,599; Options: nil; Performance Rights: 1,116,700; Restricted shares: 206,969
Mr g AoPI, CBE, ExECutIvE, 57 yearsMr Aopi joined the Board as an Executive Director on 18 May 2006 and presently holds the position of Executive General Manager External & Government Affairs and Sustainability. Mr Aopi has substantial public service and business experience in Papua New Guinea, having had a long and distinguished career in government, filling a number of important positions, including Secretary for Finance and Planning and Managing Director of Telikom PNG Ltd. He is presently Chairman of Telikom PNG Ltd and was the Chairman of Independent Public Business Corporation (IPBC). Mr Aopi is a Director of Steamships Trading, Bank of South Pacific and a number of other private sector and charitable organisations in Papua New Guinea. Ordinary shares, fully paid: 183,692; Options: nil; Performance Rights: 270,272; Restricted shares: 151,832
Mr Kg ConStAntInou, oBE, non-ExECutIvE, 54 yearsMr Constantinou joined the Board on 16 April 2002. Mr Constantinou is a prominent business figure in Papua New Guinea, holding a number of high level public sector and private sector appointments. He is a director of various private companies, including Airways Hotel & Apartments Limited, Lamana Hotel Limited, Heritage Park Hotel and Gazelle International Hotel. Mr Constantinou also holds board positions with two listed companies. He is Chairman of Bank South Pacific Limited and director of Airlines of PNG Limited. Mr Constantinou is Deputy President of the Employers Federation of Papua New Guinea, Honorary Consul for Greece in Papua New Guinea and Trade Commissioner of Solomon Islands to Papua New Guinea. Ordinary shares, fully paid: nil; Options: nil
Mr r IgArA, CMg, B.ECon., grAd.dIP. (Intl. lAw), MBA, M.A.I.C.d., PngId, non-ExECutIvE, 58 yearsMr Igara joined the Board on 16 April 2002. At that time he was one of Papua New Guinea’s most highly placed civil servants and he has extensive experience in the public sector, in international relations and multilateral development and financial matters. He served as a diplomat in Suva and Canberra and as the Secretary to the Department of Trade & Industry. He was formerly Chief Secretary to Government in Papua New Guinea, Acting Secretary for Treasury and Chairman of Mineral Resources Development Company Limited. Mr Igara was an independent director of Orogen Minerals and a member of the board of the Bank of PNG. He has also held Chairmanships of other Boards of statutory bodies, including the PNG Investment Promotion Authority. He was the founding Chief Executive Officer of PNG Sustainable Development Programme Ltd (PNGSDP Ltd), a company which has a 52% interest in Ok Tedi Mining Ltd, and Executive Director (Strategic Investments Group) within PNGSDP Ltd. Mr Igara currently manages his family business and undertakes public policy, management and investment advisory services. He also serves on the board of Innovative Agro Industry Ltd as well as the boards of several community and not-for-profit organisations in Papau New Guinea and the Pacific. Ordinary shares, fully paid: 10,000; Options: nil
64

Mr MdE KrIEwAldt, B.A., llB. (HonS), F.A.I.C.d., non-ExECutIvE, 62 yearsMr Kriewaldt joined the Board on 16 April 2002. Mr Kriewaldt is a director of BrisConnections and ImpediMed Limited. He is Chairman of Opera Queensland and immediate past President of the Queensland division of the Institute of Company Directors. He has previously served as a director of Macarthur Coal Limited, Suncorp Metway Limited, Campbell Brothers Limited, GWA International Limited, Peptech Limited and Orogen Minerals Limited and as Chairman of Suncorp Insurance and Finance, Infratil Australia Limited, Hooker Corporation Limited and Airtrain Citylink Ltd. Ordinary shares, fully paid: 14,590; Options: nil
dr AJ KAntSlEr, B.SC (HonS), PH.d, g.A.I.C.d., FtSE, non-ExECutIvE, 61 years Dr Kantsler joined the Board on 19 July 2010. Until his retirement in mid 2010, Dr Kantsler worked with Woodside Petroleum for 15 years, where he was most recently the Executive Vice President Health, Safety and Security. Prior to this, Dr Kantsler was Woodside Petroleum’s Executive Vice-President Exploration & New Ventures from 1996 to 2009. Before joining Woodside Petroleum, Dr Kantsler had extensive experience with the Shell Group of companies working in various exploration roles in Australia and internationally. Dr Kantsler has been a Councillor and Director of the Australian Petroleum Production and Exploration Association (APPEA) for 15 years where, as well as being Chairman of several APPEA committees, he was Chairman from 2000 to 2002. In 2005, Dr Kantsler was awarded the APPEA Reg Sprigg Medal for his outstanding contribution to the oil and gas industry in Australia. Dr Kantsler was also a founding member of the Australian Government’s Council for Australian Arab Relations (CAAR) where he served for two terms. He is a Director of Savcor Group Limited and Forte Consolidated Limited. Ordinary shares, fully paid: 7,025; Options: nil
Mr Jl StItt, M.A. (HonS), F.A.I.C.d., non-ExECutIvE, 68 yearsMr Stitt joined the Board on 2 April 1998. He has extensive experience in the international oil and gas business, having worked for 33 years with the Royal Dutch/Shell Group of companies including inter alia being responsible for Shell’s worldwide procurement, Director of Finance for Shell Australia, and President and CEO of Shell Japan. Mr Stitt is a former director of Woodside Petroleum Limited, Mitsubishi Chemicals K.K. and Showa Shell Sekiyu K.K. Ordinary shares, fully paid: 42,190; Options: nil
dr ZE SwItKowSKI, B.SC (HonS), PHd, F.A.I.C.d., FtSE, non-ExECutIvE, 63 years Dr Switkowski joined the Board on 22 November 2010. Dr Switkowski’s career highlights include serving as Chief Executive Officer and Managing Director of Telstra, Chief Executive Officer of Optus and Chairman and Managing Director of Kodak (Australasia). Dr Switkowski currently serves as a Director of Tabcorp Limited and Lynas Corporation Limited and is Chairman of Suncorp Metway Limited and Opera Australia. He is also Chancellor of the Royal Melbourne Institute of Technology (RMIT University). Dr Switkowski is former Chairman of the Australian Nuclear Science and Technology Organisation. He holds an honours degree in science and a PhD in nuclear physics from the University of Melbourne and is a Fellow of the Australian Institute of Company Directors. Ordinary shares, fully paid: 100,000; Options: nil
GROUP SECRETARYMr Sw gArdInEr, B.EC. (HonS), ASA, 53 yearsMr Gardiner joined Oil Search Limited in 2004, after a twenty year career in finance at two of Australia’s largest multinational construction materials companies and a major Australian telecoms company. Mr Gardiner’s roles at Oil Search have covered senior corporate finance responsibilities, including Acting Chief Financial Officer. In April 2011, Mr Gardiner was appointed to the role of Executive General Manager, Corporate Sustainability and Services. He is also the Group Secretary of Oil Search, a role he has held since May 2009. Ordinary shares, fully paid: 150,995; Options: nil; Performance Rights: 150,300; restricted shares: nil
65

RESULTS AND REVIEW OF OPERATIONSFInAnCIAlThe consolidated entity delivered a net profit of US$202.5 million (2010: US$185.6 million) for the year, after providing for income tax of US$237.4 million (2010: US$91.6 million).
oPErAtIonS2011 revenue from operations was US$732.9 million (2010: US$583.6 million), with crude oil sales contributing US$654.3 million (2010: US$517.3 million). The 26.5% crude revenue increase on the prior year was driven by a 44.8% increase in realised oil prices from US$80.19/bbl in 2010 to US$116.09/bbl in 2011, offset by a 12.6% decrease in oil sales volumes to 5,636,000 barrels. The Company did not establish any oil hedges during the period and remained unhedged to oil price movements.
Net cash from operating activities increased to US$386.2 million in 2011, compared to US$346.7 million in 2010.
Amortisation and depreciation charges increased by US$1.4 million, from US$49.9 million to US$51.3 million, due to a less favourable mix of production from fields with higher amortisation rates and higher rig utilisation.
Exploration, development and production costs expensed during 2011 totalled US$60.6 million, compared to US$125.0 million, due to the write off of two unsuccessful wells in the prior year. The US$60.6 million expensed included US$32.5 million related to seismic activities in PNG, US$12.0 million of current and past costs in relation to the coal seam gas drilling programme and US$9.0 million related to exploration activities in the Middle East. Exploration and evaluation expenditure during the year, was US$144.6 million (2010: US$176.0 million), development expenditure was US$1,286.5 million (2010: US$1,139.1 million) and production expenditure was US$129.4 million (2010: US$41.9 million).
Total oil and gas production, net to the Company, was 6.69 million barrels of oil equivalent (mmboe) in 2011 compared with 7.66 mmboe in 2010, with the 12.7% year-on-year reduction reflecting a facility shutdown and underlying field decline, partially offset by contributions from development drilling and well workover campaigns.
In 2011 good progress was made on the PNG LNG Project. Apart from the impact of foreign exchange fluctuations, the Project budget is largely unchanged. The revised cost of US$15.7 billion (US$15.0 billion previously) will be funded in accordance with the Project’s existing financing terms. The Project’s US$14.0 billion finance facility fully covers the 70% debt funded portion of the incremental cost increase. The remaining 30% will be funded by equity contributions from the Project co-venturers. Site preparation and infrastructure development activities continued, while the Project also moved into the heavy construction phase during the year.
Several key construction milestones were celebrated in 2011, including:
> A ground breaking ceremony for the handover of the LNG process area to the subcontractor for construction of the LNG trains. > The pouring of the first concrete foundations for the Train 1 process area/pipe rack and the commencement of pile driving
for the LNG plant marine jetty. > Commencement of welding, trenching and lowering of the 292 kilometre onshore pipeline. > Commencement of the offshore pipelay. > Further progress on earthworks at the Komo airfield and Hides Gas Conditioning Plant. > Arrival of the first foundation piles at the Hides Gas Conditioning Plant Site and commencement of welding. > Ongoing mobilisation to site of the first of the development drilling rigs.
Significant progress was made on the Oil Search-operated PL 2 Life Extension Project. The new CALM buoy was received on site in October and installed along with the subsea pipeline. This new facility will be commissioned in 2012. In addition, a rejuvenation programme commenced on the Kumul Marine Terminal.
At 31 December 2011 the Company had cash and cash equivalent holdings of US$1,047.5 million (2010: US$1,263.6 million), including US$9.8 million (2010: US$4.8 million) held in joint venture accounts, and debt of US$1,747.6 million (2010: US$929.7 million).
DiRectoRs’ RepoRt foR tHe financial YeaR enDeD 31 DecemBeR 2011
66

DIVIDENDSSubsequent to balance date, the directors approved the payment of a final unfranked dividend of US 2 cents per ordinary share (2010: US 2 cents final dividend), to ordinary shareholders in respect of the financial year ended 31 December 2011. The due date for payment is 10 April 2012 to all holders of ordinary shares on the Register of Members on 15 March 2012. The Company’s dividend reinvestment plan will remain in operation for the final dividend. Dividends paid and declared during the year are recorded in note 8 to the financial statements.
PRINCIPAL ACTIVITIESThe principal activity of the Oil Search Group is the exploration for oil and gas fields and the development and production of such fields. This is carried out as both the operator of producing and exploration joint ventures and as a non-operator participant in exploration and production joint ventures.
SIGNIFICANT CHANGES IN THE STATE OF AFFAIRSDuring the year, there were no significant changes in the nature of the activities or the state of affairs of the Group other than that referred to in the financial statements and notes thereto.
COMMITTEES OF THE BOARD During the year ended 31 December 2011 the Company had an Audit Committee, a Remuneration and Nominations Committee, and a Finance and Risk Committee. Members comprising the committees of the Board during the year were:
Audit: Mr MDE Kriewaldt (Chairman), Mr R Igara, Dr AJ Kantsler and Mr JL Stitt. Mr BF Horwood is an ex officio attendee.
Remuneration and Nominations: Dr ZE Switkowski1 (Chairman), Mr BF Horwood2, Mr KG Constantinou, Mr R Igara, and Mr JL Stitt.
Finance and Risk: Dr AJ Kantsler3 (Chairman), Mr G Aopi, Mr KG Constantinou, Mr MDE Kriewaldt, and Dr ZE Switkowski. Mr BF Horwood4 is an ex officio attendee.
(1) Dr ZE Switkowski became Chairman of the Remuneration and Nominations Committee from 12 May 2011.(2) Mr BF Horwood was acting Chairman of the Remuneration and Nominations Committee for the period 15 October 2009 to 12 May 2011.(3) Dr AJ Kantsler became Chairman of the Finance and Risk Committee from 16 February 2011.(4) Mr BF Horwood was acting Chairman of the Finance and Risk Committee for the period 20 September 2010 to 16 February 2011.
ATTENDANCES AT DIRECTORS’ AND COMMITTEE MEETINGSThe number of meetings of directors (including meetings of committees of directors) held during the year and the number of meetings attended by each director, were as follows:
MEETINGS OF COMMITTEES
DIRECTORS DIRECTORS’
MEETINGS AUDIT(1)REMUNERATION
AND NOMINATIONS FINANCE AND RISk(1)
Number of meetings held 7 4 4 4
Number of meetings attended
BF Horwood 7 4(2) 4 4(2)
PR Botten(1) 7 – – –
G Aopi 7 NA NA 4
KG Constantinou 7 NA 4 4
R Igara 7 4 4 –
MDE Kriewaldt 6 4 NA 3
JL Stitt 7 4 4 NA
AJ Kantsler 7 4 NA 4
ZE Switkowski 7 NA 4 3
(1) The Managing Director and Chief Financial Officer attend meetings at the request of the Committee.(2) Mr Horwood is ex-officio attendee at the Audit Committee and Finance and Risk Committee. Note: Other members of the Board have attended various Committee meetings during the year. These attendances are not included in the above table.
67

DiRectoRs’ RepoRt foR tHe financial YeaR enDeD 31 DecemBeR 2011
ENVIRONMENTAL DISCLOSUREThe economic entity complies with all environmental laws and regulations and operates at the highest industry standard for environmental compliance. The economic entity has provided for costs associated with the restoration of sites that will be incurred at the conclusion of the economic life of the producing assets in which it holds a participating interest.
CORPORATE INFORMATIONOil Search Limited is a company limited by shares and is incorporated and domiciled in Papua New Guinea. The economic entity had 1,125 employees as at 31 December 2011 (2010: 1,050). Oil Search Limited is listed on the Australian Securities Exchange and PNG Stock Exchange.
SHARE BASED PAYMENT TRANSACTIONSThere were 1,498,560 share appreciation rights (2010: 1,554,200) granted under the Employee Share Appreciation Rights Plan. There were 1,696,500 performance rights (2010: 1,997,400) granted under the Performance Rights Plan, and 443,289 restricted shares (2010: 751,857) granted under the Restricted Share Plan during the year.
As at 31 December 2011, there are 1,659,552 options (2010: 3,032,304), 2,918,020 share appreciation rights (2010: 1,542,800), 5,735,932 performance rights (2010: 6,183,991), and 1,657,365 restricted shares (2010: 1,915,386) granted over ordinary shares exercisable at various dates in the future, subject to meeting applicable performance hurdles, and at varying exercise prices (refer to note 25 for further details).
DIRECTORS’ AND OTHER OFFICERS’ REMUNERATIONThe Remuneration Committee of the Board is responsible for reviewing compensation for the directors and staff and recommending compensation levels to the Board. The Committee assesses the appropriateness of the nature and amount of emoluments on a periodic basis with reference to relevant employment market conditions, with the overall benefit of maximising shareholder value by the retention of high quality personnel. To achieve this objective the Board links a component of executive director and other staff emoluments to the company’s financial and operational performance.
Details of the amount, in US dollars, of each element of the emoluments for the financial year for directors and executives of the company are disclosed in note 26 to the financial statements.
68
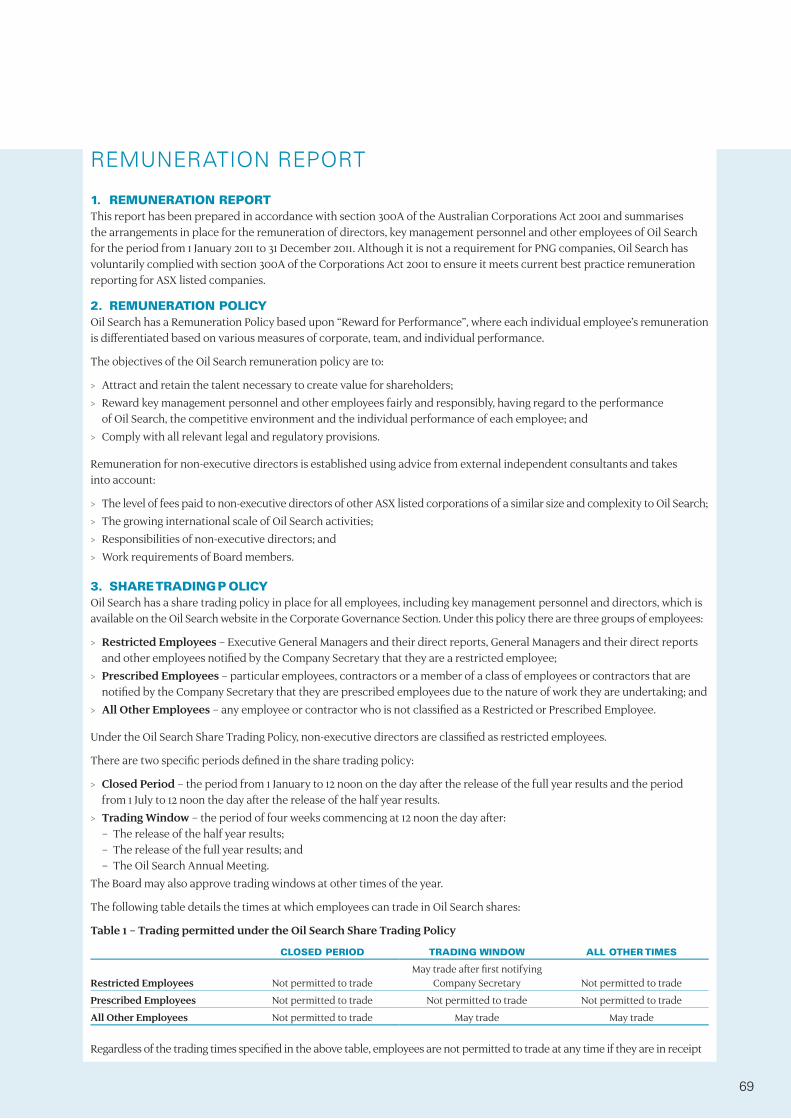
RemuneRation RepoRt
1. REMUNERATION REPORT This report has been prepared in accordance with section 300A of the Australian Corporations Act 2001 and summarises the arrangements in place for the remuneration of directors, key management personnel and other employees of Oil Search for the period from 1 January 2011 to 31 December 2011. Although it is not a requirement for PNG companies, Oil Search has voluntarily complied with section 300A of the Corporations Act 2001 to ensure it meets current best practice remuneration reporting for ASX listed companies.
2. REMUNERATION POLICY Oil Search has a Remuneration Policy based upon “Reward for Performance”, where each individual employee’s remuneration is differentiated based on various measures of corporate, team, and individual performance.
The objectives of the Oil Search remuneration policy are to:
> Attract and retain the talent necessary to create value for shareholders; > Reward key management personnel and other employees fairly and responsibly, having regard to the performance
of Oil Search, the competitive environment and the individual performance of each employee; and > Comply with all relevant legal and regulatory provisions.
Remuneration for non-executive directors is established using advice from external independent consultants and takes into account:
> The level of fees paid to non-executive directors of other ASX listed corporations of a similar size and complexity to Oil Search; > The growing international scale of Oil Search activities; > Responsibilities of non-executive directors; and > Work requirements of Board members.
3. SHARE TRADING P OLICYOil Search has a share trading policy in place for all employees, including key management personnel and directors, which is available on the Oil Search website in the Corporate Governance Section. Under this policy there are three groups of employees:
> Restricted Employees – Executive General Managers and their direct reports, General Managers and their direct reports and other employees notified by the Company Secretary that they are a restricted employee;
> Prescribed Employees – particular employees, contractors or a member of a class of employees or contractors that are notified by the Company Secretary that they are prescribed employees due to the nature of work they are undertaking; and
> All Other Employees – any employee or contractor who is not classified as a Restricted or Prescribed Employee.
Under the Oil Search Share Trading Policy, non-executive directors are classified as restricted employees.
There are two specific periods defined in the share trading policy:
> Closed Period – the period from 1 January to 12 noon on the day after the release of the full year results and the period from 1 July to 12 noon the day after the release of the half year results.
> Trading Window – the period of four weeks commencing at 12 noon the day after: – The release of the half year results; – The release of the full year results; and – The Oil Search Annual Meeting.The Board may also approve trading windows at other times of the year.
The following table details the times at which employees can trade in Oil Search shares:
Table 1 – Trading permitted under the Oil Search Share Trading Policy
CLOSED PERIOD TRADING WINDOW ALL OTHER TIMES
Restricted Employees Not permitted to tradeMay trade after first notifying
Company Secretary Not permitted to trade
Prescribed Employees Not permitted to trade Not permitted to trade Not permitted to trade
All Other Employees Not permitted to trade May trade May trade
Regardless of the trading times specified in the above table, employees are not permitted to trade at any time if they are in receipt
69
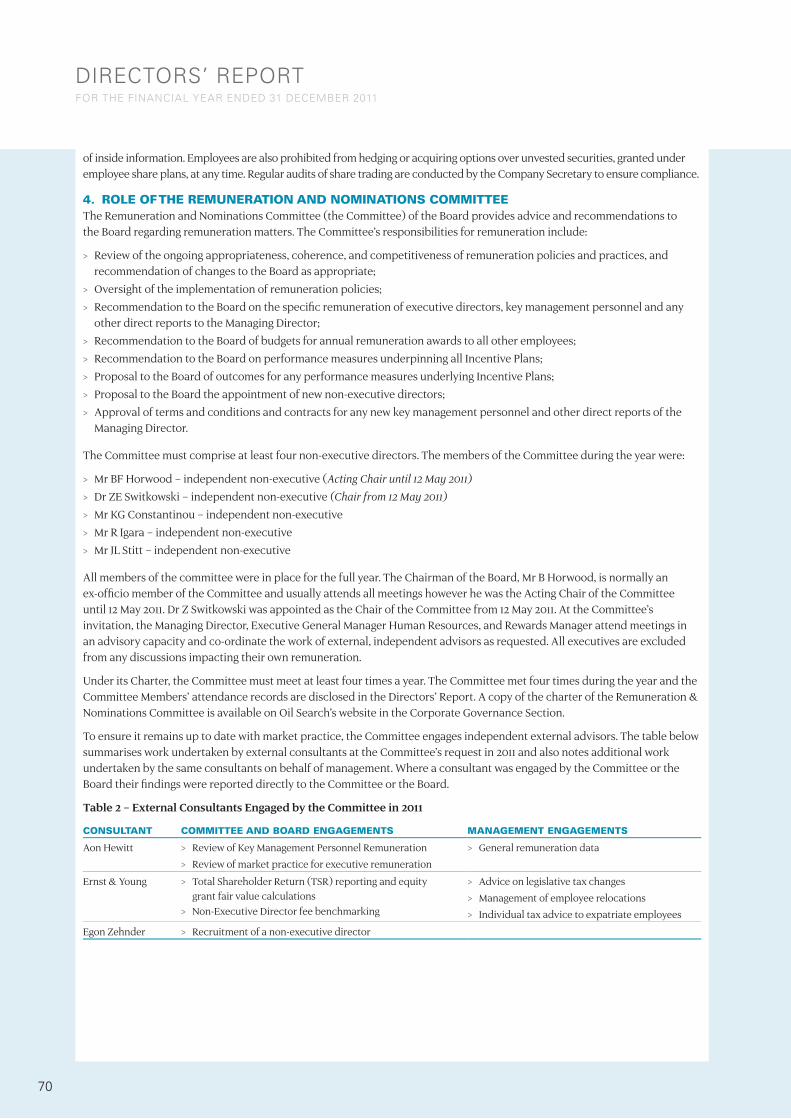
of inside information. Employees are also prohibited from hedging or acquiring options over unvested securities, granted under employee share plans, at any time. Regular audits of share trading are conducted by the Company Secretary to ensure compliance.
4. ROLE OF THE REMUNERATION AND NOMINATIONS COMMITTEE The Remuneration and Nominations Committee (the Committee) of the Board provides advice and recommendations to the Board regarding remuneration matters. The Committee’s responsibilities for remuneration include:
> Review of the ongoing appropriateness, coherence, and competitiveness of remuneration policies and practices, and recommendation of changes to the Board as appropriate;
> Oversight of the implementation of remuneration policies; > Recommendation to the Board on the specific remuneration of executive directors, key management personnel and any
other direct reports to the Managing Director; > Recommendation to the Board of budgets for annual remuneration awards to all other employees; > Recommendation to the Board on performance measures underpinning all Incentive Plans; > Proposal to the Board of outcomes for any performance measures underlying Incentive Plans; > Proposal to the Board the appointment of new non-executive directors; > Approval of terms and conditions and contracts for any new key management personnel and other direct reports of the
Managing Director.
The Committee must comprise at least four non-executive directors. The members of the Committee during the year were:
> Mr BF Horwood – independent non-executive (Acting Chair until 12 May 2011) > Dr ZE Switkowski – independent non-executive (Chair from 12 May 2011) > Mr KG Constantinou – independent non-executive > Mr R Igara – independent non-executive > Mr JL Stitt – independent non-executive
All members of the committee were in place for the full year. The Chairman of the Board, Mr B Horwood, is normally an ex-officio member of the Committee and usually attends all meetings however he was the Acting Chair of the Committee until 12 May 2011. Dr Z Switkowski was appointed as the Chair of the Committee from 12 May 2011. At the Committee’s invitation, the Managing Director, Executive General Manager Human Resources, and Rewards Manager attend meetings in an advisory capacity and co-ordinate the work of external, independent advisors as requested. All executives are excluded from any discussions impacting their own remuneration.
Under its Charter, the Committee must meet at least four times a year. The Committee met four times during the year and the Committee Members’ attendance records are disclosed in the Directors’ Report. A copy of the charter of the Remuneration & Nominations Committee is available on Oil Search’s website in the Corporate Governance Section.
To ensure it remains up to date with market practice, the Committee engages independent external advisors. The table below summarises work undertaken by external consultants at the Committee’s request in 2011 and also notes additional work undertaken by the same consultants on behalf of management. Where a consultant was engaged by the Committee or the Board their findings were reported directly to the Committee or the Board.
Table 2 – External Consultants Engaged by the Committee in 2011
CONSULTANT COMMITTEE AND BOARD ENGAGEMENTS MANAGEMENT ENGAGEMENTS
Aon Hewitt > Review of Key Management Personnel Remuneration
> Review of market practice for executive remuneration
> General remuneration data
Ernst & Young > Total Shareholder Return (TSR) reporting and equity grant fair value calculations
> Non-Executive Director fee benchmarking
> Advice on legislative tax changes
> Management of employee relocations
> Individual tax advice to expatriate employees
Egon Zehnder > Recruitment of a non-executive director
DiRectoRs’ RepoRt foR tHe financial YeaR enDeD 31 DecemBeR 2011
70

5. REMUNERATION STRUCTURE Oil Search’s remuneration structure comprises four elements:
> Total Fixed Remuneration (TFR); > Short-Term Incentive (STI); > Long-Term Incentive (LTI); and > Occasional Retention Awards of Restricted Shares for key/critical staff.
The mix of remuneration elements for individual employees is dependent on their level and role within Oil Search, with the proportion of “at risk” remuneration (STI and LTI elements) increasing with greater seniority.
totAl FIxEd rEMunErAtIon (tFr) The ranges of TFR payable for all Company positions in the organisation, including those for key management personnel are 80% – 120% of competitive benchmarks. An independent external remuneration consultant engaged by the Committee provides competitive benchmarks for key management personnel. For other roles in the organisation, remuneration information is derived from annual job matching surveys conducted by independent third parties.
An annual TFR review budget, agreed by the Board each year, is used to adjust TFRs paid to individuals to ensure that their fixed remuneration remains competitive for their specific skills, competence, and value to the Company.
SHort-tErM InCEntIvE (StI) Each employee has the opportunity to earn an annual STI which is based on a percentage of his or her TFR. The STI percentage increases with seniority to ensure a higher proportion of remuneration is “at risk” for our senior employees. The actual STI earned by an employee will be based on a mix of achievement against specific company performance hurdles and his or her individual performance.
At the start of each year, the Board determines the hurdles and target levels of performance required to earn an annual STI. The hurdles are derived presently from:
> Corporate performance against operational metrics which include: safety; production; costs; increases in hydrocarbon reserves under development; and
> Transformational metrics which include: acquisition of new hydrocarbon resources and progress towards commercialisation of 3C gas reserves.
The size of any STI is thus directly related to corporate performance through a range of key measures that affect Shareholder Value.
At the end of the year, the Board approves an overall STI pool based on the level of achievement against the hurdles that were determined at the start of the year. The STI pool is then distributed to employees, taking into account:
> The contribution of the employee’s division to the achievement of the organisational objectives; and > The individual performance of the employee.
Employees have the ability to earn between 0% and 200% of their STI opportunity. However the target levels of performance set by the Board are challenging and payment of 100% of STI opportunity to an employee requires exceptional corporate and individual performance. Over the five years the STI programme has been in operation, the overall level of STI paid to employees has been:
Table 3 – STI Awards to Employees
STI POTENTIAL RANGE 2007 2008 2009 2010 2011
0% to 200% of STI Opportunity 65.6% 85.9% 84.6% 61.4% 28.5%
71

long-tErM InCEntIvE (ltI) Provided that they have demonstrated an acceptable level of personal performance, each employee also has the opportunity to participate in the Oil Search Long Term Incentive Plan (LTIP). Following changes to Australian taxation legislation with respect to employee share plans the existing Oil Search LTI programmes were reviewed in 2010.
As a result of the review, the existing Employee Share Option Plan (ESOP), Performance Rights Plan (PRP) and Restricted Share Plan (RSP) were combined under the Oil Search Long Term Incentive Plan (LTIP). The Oil Search LTIP allows the Board the flexibility to grant employees:
> Performance Rights; > Share Appreciation Rights; > Share Options; and > Restricted Shares.
Under the LTIP, allocations of Performance Rights and Share Options operate in the same manner as existing allocations, except for the automatic exercise on vesting of grants under the LTIP. This removes the existing two year period employees have to exercise vested options and rights. From 2010, grants of Share Options were replaced with grants of Share Appreciation Rights.
SHArE APPrECIAtIon rIgHtSShare Appreciation Rights (SAR) operate in much the same way as Share Options, with an employee only receiving a benefit if the Oil Search share price increases over the vesting period. However instead of an employee exercising a Share Option equal to the market value at the time they were granted, upon vesting the gain in share price is converted back to a number of shares, which are then granted to the employee.
As an example, the 2011 grant of SAR was 1,680 per participant and the Vesting Price (equivalent to the Exercise price of a Share Option) was $6.98. Assuming the Oil Search share price increased to $9.20 at vesting, the employee would be granted 405 shares based on the following formula:
Number of Rights X (Price on Vesting – Vesting Price)
Price on Vesting
1,680 X ($9.20 – $6.98)=
$3,729.60= 405 shares
$9.20 $9.20
As can be seen from the above calculation, the benefit of 405 shares is equivalent in value to the $3,729.60 in benefit the employee would receive by exercising 1,680 Share Options at an exercise price of $6.98, given a market price of $9.20.
SAR are automatically exercised on vesting, which is dependent on the Oil Search share price increasing over the 3 year vesting period. Accordingly, if the share price does not increase, then the SAR will automatically lapse on the vesting date. As a result, the employee only benefits from a grant of SAR if the Oil Search share price increases over the three year vesting period, so this form of LTI is directly related to increasing Shareholder Value.
EMPloyEE SHArE oPtIon PlAnAwards under the Employee Share Option Plan (ESOP) are structured as options to acquire ordinary shares in the Company after a 3 year vesting period, at a price equal to the market value of the shares on the date the option is granted.
The Board determines the appropriate size of each award under the ESOP and all eligible employees receive the same number of options. The initial awards under the ESOP were made following the 2004 Annual General Meeting, with the last allocation in 2009. The employee benefits from an ESOP grant only if the value of Oil Search shares increases over the five year life of the option, so this form of LTI is directly related to Shareholder Value. The ESOP encourages employees to associate themselves with increasing Shareholder Value.
DiRectoRs’ RepoRt foR tHe financial YeaR enDeD 31 DecemBeR 2011
72
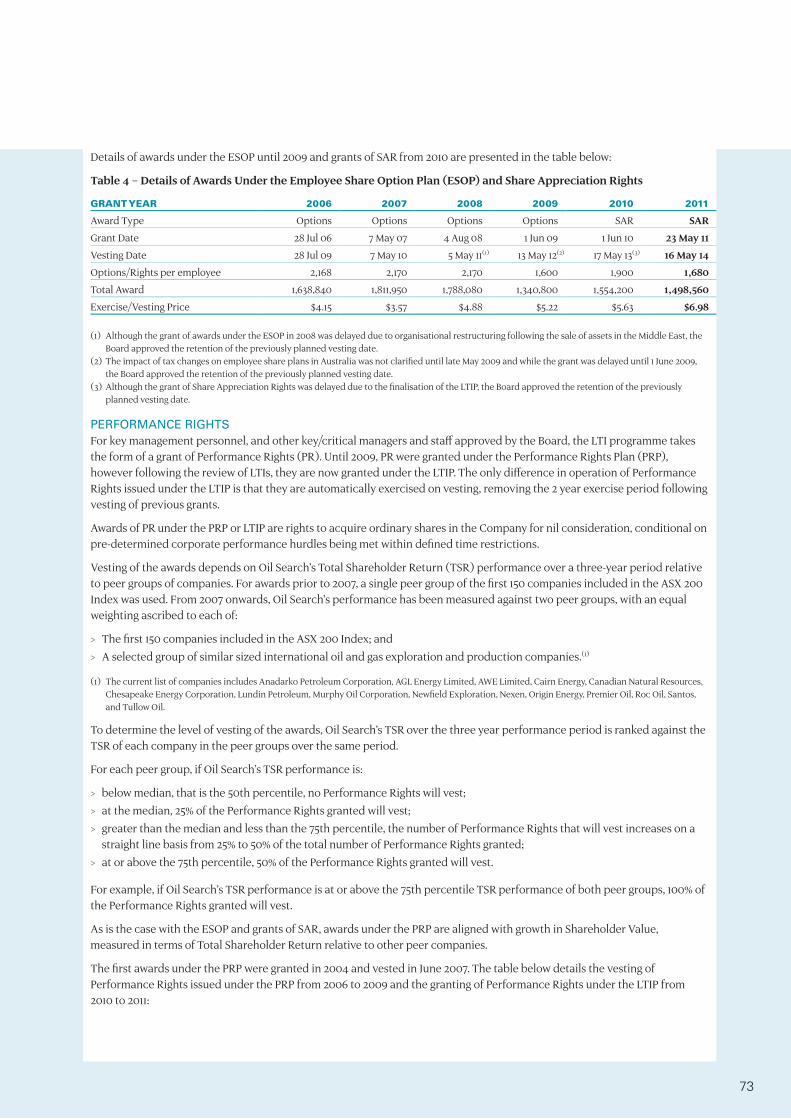
Details of awards under the ESOP until 2009 and grants of SAR from 2010 are presented in the table below:
Table 4 – Details of Awards Under the Employee Share Option Plan (ESOP) and Share Appreciation Rights
GRANT YEAR 2006 2007 2008 2009 2010 2011
Award Type Options Options Options Options SAR SAR
Grant Date 28 Jul 06 7 May 07 4 Aug 08 1 Jun 09 1 Jun 10 23 May 11
Vesting Date 28 Jul 09 7 May 10 5 May 11(1) 13 May 12(2) 17 May 13(3) 16 May 14
Options/Rights per employee 2,168 2,170 2,170 1,600 1,900 1,680
Total Award 1,638,840 1,811,950 1,788,080 1,340,800 1,554,200 1,498,560
Exercise/Vesting Price $4.15 $3.57 $4.88 $5.22 $5.63 $6.98
(1) Although the grant of awards under the ESOP in 2008 was delayed due to organisational restructuring following the sale of assets in the Middle East, the Board approved the retention of the previously planned vesting date.
(2) The impact of tax changes on employee share plans in Australia was not clarified until late May 2009 and while the grant was delayed until 1 June 2009, the Board approved the retention of the previously planned vesting date.
(3) Although the grant of Share Appreciation Rights was delayed due to the finalisation of the LTIP, the Board approved the retention of the previously planned vesting date.
PErForMAnCE rIgHtSFor key management personnel, and other key/critical managers and staff approved by the Board, the LTI programme takes the form of a grant of Performance Rights (PR). Until 2009, PR were granted under the Performance Rights Plan (PRP), however following the review of LTIs, they are now granted under the LTIP. The only difference in operation of Performance Rights issued under the LTIP is that they are automatically exercised on vesting, removing the 2 year exercise period following vesting of previous grants.
Awards of PR under the PRP or LTIP are rights to acquire ordinary shares in the Company for nil consideration, conditional on pre-determined corporate performance hurdles being met within defined time restrictions.
Vesting of the awards depends on Oil Search’s Total Shareholder Return (TSR) performance over a three-year period relative to peer groups of companies. For awards prior to 2007, a single peer group of the first 150 companies included in the ASX 200 Index was used. From 2007 onwards, Oil Search’s performance has been measured against two peer groups, with an equal weighting ascribed to each of:
> The first 150 companies included in the ASX 200 Index; and > A selected group of similar sized international oil and gas exploration and production companies.(1)
(1) The current list of companies includes Anadarko Petroleum Corporation, AGL Energy Limited, AWE Limited, Cairn Energy, Canadian Natural Resources, Chesapeake Energy Corporation, Lundin Petroleum, Murphy Oil Corporation, Newfield Exploration, Nexen, Origin Energy, Premier Oil, Roc Oil, Santos, and Tullow Oil.
To determine the level of vesting of the awards, Oil Search’s TSR over the three year performance period is ranked against the TSR of each company in the peer groups over the same period.
For each peer group, if Oil Search’s TSR performance is:
> below median, that is the 50th percentile, no Performance Rights will vest; > at the median, 25% of the Performance Rights granted will vest; > greater than the median and less than the 75th percentile, the number of Performance Rights that will vest increases on a
straight line basis from 25% to 50% of the total number of Performance Rights granted; > at or above the 75th percentile, 50% of the Performance Rights granted will vest.
For example, if Oil Search’s TSR performance is at or above the 75th percentile TSR performance of both peer groups, 100% of the Performance Rights granted will vest.
As is the case with the ESOP and grants of SAR, awards under the PRP are aligned with growth in Shareholder Value, measured in terms of Total Shareholder Return relative to other peer companies.
The first awards under the PRP were granted in 2004 and vested in June 2007. The table below details the vesting of Performance Rights issued under the PRP from 2006 to 2009 and the granting of Performance Rights under the LTIP from 2010 to 2011:
73

DiRectoRs’ RepoRt foR tHe financial YeaR enDeD 31 DecemBeR 2011
Table 5 – Details of Awards of Performance Rights
GRANT YEAR 2006 2007 2008 2009(2) 2010 2011
Measurement Period1 Jan 06 to31 Dec 08
1 Jan 07 to31 Dec 09
1 Jan 08 to31 Dec 10
1 Jan 09 to31 Dec 11
1 Jan 10 to31 Dec 12
1 Jan 11 to31 Dec 13
Total Rights Granted 2,736,955 2,783,746 2,437,300 1,774,895 1,997,400 1,696,500
Oil Search TSR (3 year)(1) 39% 91% 53% 44%
Percentile Rank (ASX 150) 91.3% 96.0% 96.5% 68.3%
Vesting 100.0% 50.0% 50.0% 43.3% May 2013 May 2014
Percentile Rank (Int’l Group) 87.5% 94.1% 53.3%
Vesting 50.0% 50.0% 28.3% May 2013 May 2014
Total Vesting 100.0% 100.0% 100.0% 71.6% May 2013 May 2014
(1) As per the PRP Rules, the TSR has been calculated by an independent external consultant and is based on share price increases and dividends paid on the shares over the measurement period. In calculating the TSR it is assumed dividends are reinvested to purchase additional shares of the Company at the closing price applicable on the ex-dividend date.
(2) While the 2009 Performance Rights will not vest until 13 May 2012, Oil Search relative TSR for the period 1 January 2009 to 31 December 2011 is available.
long tErM InCEntIvE PlAn rulESUnder the ESOP or PRP the following rules apply to all grants:
> If a participant ceases employment, the participant will be entitled to exercise vested Performance Rights or Share Options within 90 days after employment ceases, or such longer period as the Board may determine (except in the case of a participant’s death when personal representatives of the participant may exercise vested Performance Rights up to 12 months from the date of death).
> If a participant dies or ceases employment, all unvested Performance Rights or Share Options lapse unless the Board determines otherwise.
> Any vested Performance Rights or Share Options that remain unexercised lapse on the fifth anniversary of the date of grant.
Any vested Share Options granted under the ESOP or vested Performance Rights granted under the PRP that remain unexercised lapse on the fifth anniversary of their grant date. Under the LTIP, all grants are automatically exercised on vesting, so there will never be any vested grants that have not been exercised.
In line with the existing ESOP and PRP, if a participant dies or ceases employment, all unvested Performance Rights, Share Appreciation Rights or Share Options lapse unless the Board determines otherwise.
All of the plan rules for the PRP, ESOP and LTIP allow the Company to use newly issued or existing shares (for example, through purchase on market) to satisfy awards.
All grants of PR, Share Options or SAR do not attract any right to dividends or voting.
rEtEntIon AwArdS oF rEStrICtEd SHArES In order to assist the Company in retaining key executives and other employees, the Company may issue them with Restricted Shares. Until 30 May 2010, grants were made under the Restricted Shares Plan (RSP), with all grants from 1 June 2010 being made under the LTIP. Restricted Shares issued under the RSP or LTIP only vest after the employee has completed a specified period of future service with the Company.
Awards are structured as grants of restricted shares for nil consideration. Restricted Shares are held on behalf of participants in trust, subject to disposal restrictions and forfeiture conditions, until released under the terms of the Plan.
The number of Restricted Shares to be granted to the participant is the number of ordinary shares that can be acquired on market with reference to a specific percentage of the participant’s total fixed remuneration (TFR) determined at the time of the grant.
Awards by way of retention under the Restricted Share Plan will only be made where the Board determines that a significant retention risk exists.
The vesting of Restricted Shares is subject to continued employment only and as such no additional performance conditions apply. Unless the Board otherwise determines, unvested Restricted Shares will be forfeited when a participant ceases employment before the vesting date.
74

Restricted Shares are held in trust prior to them vesting and will be released from the trust upon vesting. Whilst the Restricted Shares are held in trust, the Restricted Shares will be subject to disposal restrictions and forfeiture conditions. Restricted Shares held in trust (whether vested or not) will be forfeited by participants who are considered by the Board to have acted fraudulently or dishonestly. Once a participant’s Restricted Shares have vested, disposal restrictions and forfeiture conditions will cease and the Restricted Shares will be released from the trust.
Restricted Shares do not attract any right to voting and do not attract any right to dividends.
The RSP and LTIP rules allow the Company to use newly issued or existing shares (for example through purchase on market) to satisfy awards under the Plan.
There were grants of Restricted Shares to the Executive General Manager Human Resources in 2008 and the Chief Financial Officer in 2009 as part of their recruitment arrangements. The balance of these grants vested during 2011.
Png rEtEntIon ProgrAMMEThe PNG LNG Project will significantly change the employment landscape in Papua New Guinea, with the project operator and its contractors looking to hire employees who have similar, if not identical skills to our local workforce. Given the scarcity of experienced local employees in the oil and gas industry in PNG, the retention of our key PNG Citizen employees will be a major factor in ensuring the ongoing viability of our oil operations business.
In order to minimise the risk of losing key/critical employees, a number of initiatives were implemented during 2009. One of the initiatives was the creation of a retention programme specifically designed for our PNG Citizen employees. The PNG Retention Programme was implemented in June 2009 to coincide with the commencement of early works activities of the PNG LNG Project.
All permanent employees were eligible to participate in the PNG Retention Programme, with any benefit earned under the programme being realised in June 2013. The level of participation for employees was dependent on:
> The criticality of the employee’s role; > The employee’s performance and potential; and > The employee’s engagement, values and attitude.
For those employees participating at the highest level, their notice period they are required to give to Oil Search on resignation was significantly increased for the duration of the programme.
Further reviews of participation in the PNG Retention Programme were conducted in 2010 and 2011. For those employees that had joined Oil Search since the first grant under the Programme, their benefit will be realised in July 2014. For existing participants, any increase in benefit will be realised in June 2013, in line with their original award.
The retention of our PNG Citizen employees will continue to be reviewed on a regular basis during the PNG LNG Project.
dEFErrEd StIThe 50% deferred portion of an executive’s STI (see section 6 below) is awarded as Restricted Shares under the LTIP. Any dividends payable on Restricted Shares issued as the deferred component of an executive’s STI award are paid to the executive.
6. REMUNERATION OF kEY MANAGEMENT PERSONNEL For this group, and other senior executives, remuneration is benchmarked against that of similar roles in a primary reference group of some 40 ASX companies of similar size to Oil Search in terms of Enterprise Value, Total Assets, Gross Revenue, and Net Profit after Tax. A smaller and secondary reference group of international energy and mining companies is used to assess whether any particular positions should be treated exceptionally.
totAl FIxEd rEMunErAtIon TFR, which includes Company superannuation contributions and other remunerative benefits, is targeted within the range of the median and the 62.5 percentile of the reference group, depending on the international marketability and mobility of the executive concerned. Executives may choose to salary package items such as motor vehicles or superannuation contributions. However any costs arising from Fringe Benefits Tax (FBT) or any other tax are borne by the executive.
At rISK rEMunErAtIon & rElAtIonSHIP to CoMPAny PErForMAnCE As noted above in section 5, Oil Search executives are eligible to receive a STI and participate in a LTI programme which is considered “at risk” remuneration, since any payment is dependent on performance. As explained in section 5 above, the Board’s objective is that the size of these incentives should be related to how successful Oil Search is in creating Shareholder Value, whilst also being competitively positioned against benchmarks based on the reference groups of companies mentioned above.
75

Accordingly, the size of the STI is directly related to corporate performance against a range of key measures that impact shareholder value, namely operational metrics on safety, production, costs, increases in hydrocarbon reserves under development, and transformational metrics on acquisition of new hydrocarbon resources and achievement of tangible value adding milestones towards commercialisation of significant gas volumes.
Similarly, the proportion of Performance Rights grants which vest are directly related to Oil Search’s Total Shareholder Return relative to peer groups of companies.
SHort tErM InCEntIvE The STI is an incentive opportunity of between 0%-160% of a senior executive’s TFR (0%-200% for the Managing Director), where 80% (100% for the Managing Director) would be awarded for achieving exceptional corporate and individual performance. It is awarded in March each year for performance in the previous calendar year. Performance significantly beyond expectations could be rewarded by STI’s up to a maximum of 160% of TFR (200% of TFR for the Managing Director) but such awards would be unusual. Awards since the commencement of the scheme for performance year 2007 have averaged 51.2% of TFR for executives and 64.9% for the Managing Director.
In line with our Remuneration Structure, at the end of the year the Board approves an overall STI pool for executives based on the level of achievement against the hurdles that were determined at the start of the year. This pool is distributed to individual senior executives based on their individual performance.
For all senior executives, 50% of their STI award is paid in cash and the other 50% is converted to Restricted Shares under the LTIP. The Restricted Shares are held in Trust on behalf of the employee and vest on 31 December of the following year, providing the executive remains employed with Oil Search. Any dividends payable on Restricted Shares issued as the deferred component of an executive’s STI award are paid to the executive.
Since the introduction of this scheme for performance in calendar year 2007, the Senior Executive STI has resulted in the following outcomes:
Table 6 – Senior Executive STI
STI RANGE 2007 2008 2009 2010 2011
Managing Director 0 – 200% of TFR 50.0% 100.0% 84.6% 61.4% 28.5%
Senior Executives 0 – 160% of TFR 44.0% 68.7% 71.4% 49.1% 22.8%
long tErM InCEntIvE (ltI) – PErForMAnCE rIgHtS Presently, the number of Performance Rights granted for the Managing Director and other senior executives is based on the following formula:
X% of TFR
Oil Search Share Price
where X is 90% for the Managing Director and 60% for other senior executives, and “Oil Search Share Price” is based on the 20 day Volume Weighted Average Price of Oil Search shares for the 20 trading days following the release of annual results in the year of award.
The grants and vesting level of performance rights over the past five years for current key management personnel is as follows:
DiRectoRs’ RepoRt foR tHe financial YeaR enDeD 31 DecemBeR 2011
76
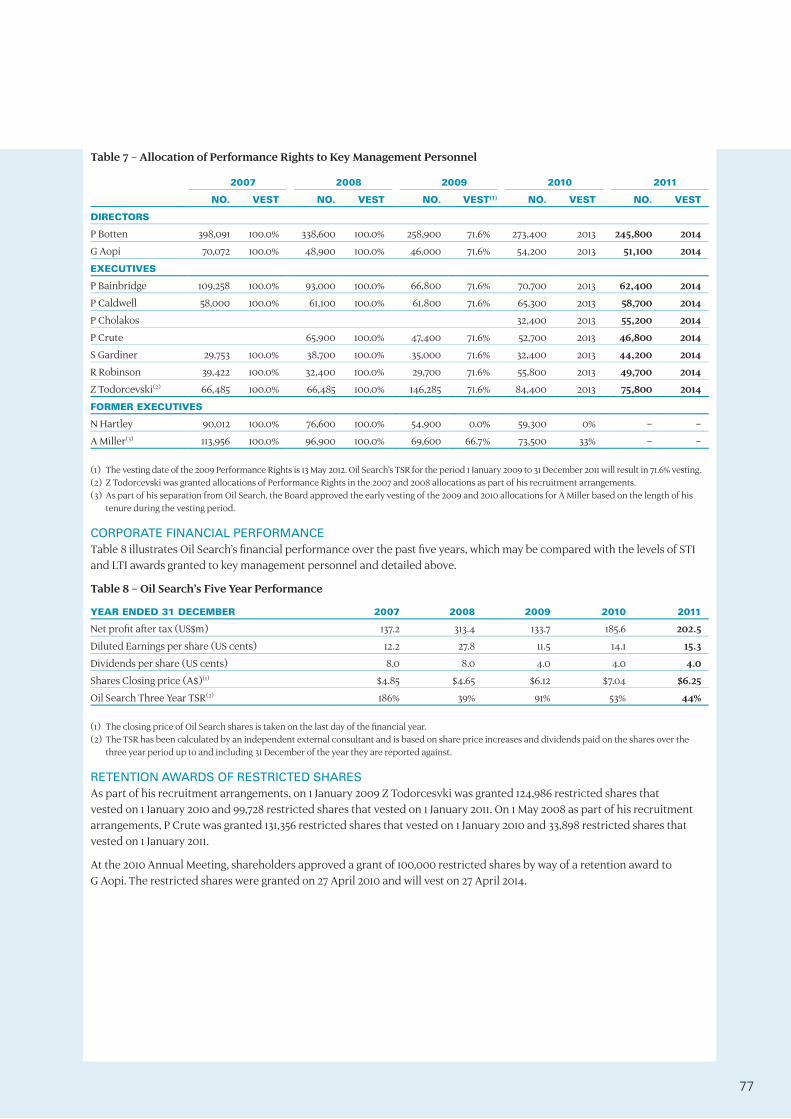
Table 7 – Allocation of Performance Rights to Key Management Personnel
2007 2008 2009 2010 2011
NO. VEST NO. VEST NO. VEST(1) NO. VEST NO. VEST
DIRECTORS
P Botten 398,091 100.0% 338,600 100.0% 258,900 71.6% 273,400 2013 245,800 2014
G Aopi 70,072 100.0% 48,900 100.0% 46,000 71.6% 54,200 2013 51,100 2014
ExECUTIVES
P Bainbridge 109,258 100.0% 93,000 100.0% 66,800 71.6% 70,700 2013 62,400 2014
P Caldwell 58,000 100.0% 61,100 100.0% 61,800 71.6% 65,300 2013 58,700 2014
P Cholakos 32,400 2013 55,200 2014
P Crute 65,900 100.0% 47,400 71.6% 52,700 2013 46,800 2014
S Gardiner 29,753 100.0% 38,700 100.0% 35,000 71.6% 32,400 2013 44,200 2014
R Robinson 39,422 100.0% 32,400 100.0% 29,700 71.6% 55,800 2013 49,700 2014
Z Todorcevski(2) 66,485 100.0% 66,485 100.0% 146,285 71.6% 84,400 2013 75,800 2014
FORMER ExECUTIVES
N Hartley 90,012 100.0% 76,600 100.0% 54,900 0.0% 59,300 0% – –
A Miller(3) 113,956 100.0% 96,900 100.0% 69,600 66.7% 73,500 33% – –
(1) The vesting date of the 2009 Performance Rights is 13 May 2012. Oil Search’s TSR for the period 1 January 2009 to 31 December 2011 will result in 71.6% vesting.(2) Z Todorcevski was granted allocations of Performance Rights in the 2007 and 2008 allocations as part of his recruitment arrangements.(3) As part of his separation from Oil Search, the Board approved the early vesting of the 2009 and 2010 allocations for A Miller based on the length of his
tenure during the vesting period.
CorPorAtE FInAnCIAl PErForMAnCE Table 8 illustrates Oil Search’s financial performance over the past five years, which may be compared with the levels of STI and LTI awards granted to key management personnel and detailed above.
Table 8 – Oil Search’s Five Year Performance
YEAR ENDED 31 DECEMBER 2007 2008 2009 2010 2011
Net profit after tax (US$m) 137.2 313.4 133.7 185.6 202.5
Diluted Earnings per share (US cents) 12.2 27.8 11.5 14.1 15.3
Dividends per share (US cents) 8.0 8.0 4.0 4.0 4.0
Shares Closing price (A$)(1) $4.85 $4.65 $6.12 $7.04 $6.25
Oil Search Three Year TSR(2) 186% 39% 91% 53% 44%
(1) The closing price of Oil Search shares is taken on the last day of the financial year. (2) The TSR has been calculated by an independent external consultant and is based on share price increases and dividends paid on the shares over the
three year period up to and including 31 December of the year they are reported against.
rEtEntIon AwArdS oF rEStrICtEd SHArES As part of his recruitment arrangements, on 1 January 2009 Z Todorcesvki was granted 124,986 restricted shares that vested on 1 January 2010 and 99,728 restricted shares that vested on 1 January 2011. On 1 May 2008 as part of his recruitment arrangements, P Crute was granted 131,356 restricted shares that vested on 1 January 2010 and 33,898 restricted shares that vested on 1 January 2011.
At the 2010 Annual Meeting, shareholders approved a grant of 100,000 restricted shares by way of a retention award to G Aopi. The restricted shares were granted on 27 April 2010 and will vest on 27 April 2014.
77
DiRectoRs’ RepoRt foR tHe financial YeaR enDeD 31 DecemBeR 2011
7. REMUNERATION DETAILS FOR kEY MANAGEMENT PERSONNEL For this section of the report, key management personnel excludes non-executive directors, whose remuneration is disclosed in Section 10. The key management personnel for the purposes of this section are the following employees:
Mr Peter Botten CBE – Managing Director Incumbent for the full year As the Managing Director, Peter has the overall responsibility for effectively managing Oil Search and achieving the corporate objectives. He is also responsible for ensuring that strategies agreed with the Board are implemented.
Mr Gerea Aopi CBE – Executive General Manager External Affairs and Sustainability and Executive Director Incumbent for the full year Gerea is responsible for External Affairs in PNG. He is also charged with strategy development and enactment of our Community Affairs and social programmes within the Company. Gerea plays an important role in the interface between the Company and major shareholders in PNG.
In addition, Gerea has the additional responsibility of leading the company’s broad Sustainability strategies within PNG.
Mr Philip Bainbridge – Executive General Manager Gas Commercialisation and PNG Growth Incumbent for the full year Philip is responsible for managing Oil Search’s organic growth via Gas Business Development and Exploration within PNG and optimising our exploration assets in MENA. Philip was appointed to this role on 1 June 2010, prior to which he was the Executive General Manager PNG LNG.
Mr Philip Caldwell – Executive General Manager PNG LNG Incumbent for the full year Philip is the person responsible for managing Oil Search’s participation in the PNG LNG Project and works closely with the other Joint Venture partners to ensure the success of the project. Philip was appointed to this role on 1 June 2010, prior to which he was the Executive General Manager Oil Operations.
Mr Paul Cholakos – Executive General Manager Project Development Incumbent for the full year Paul has responsibility for the delivery and management of Oil Search projects in PNG, with a specific focus on those associated with the PNG LNG Project. He is also responsible for the management of the corporate project function.
Mr Paul Crute – Executive General Manager Human Resources Incumbent for the full year Paul is responsible for establishing and aligning people management strategies, processes and systems to ensure that Oil Search attracts, develops, retains and rewards the right people with the right skills at the right time in order to achieve the strategic objectives of the organisation.
Mr Stephen Gardiner – EGM Sustainability, Corporate Services & Group Secretary Incumbent for the full year In his role, Stephen is responsible for the Information and Communications Technology and Contracts & Procurement functions of Oil Search as well as all Group Secretarial matters. Stephen also assumed control of the Corporate Sustainability function following the retirement of Nigel Hartley.
Mr Nigel Hartley – Executive General Manager Sustainability Retired 1 July 2011 Prior to his departure, Nigel was responsible for developing and implementing the Corporate Sustainability function. Prior to this, Nigel was the executive responsible for arranging the significant financing required for Oil Search to participate in the PNG LNG project.
Mr Austin Miller – Executive General Manager Commercial, International New Ventures, Mergers and Acquisitions Departed 28 February 2011 Prior to his departure, Austin’s role was to lead the commercial aspects of Oil Search’s business including initiating corporate and asset related mergers and acquisitions and any new ventures outside of PNG.
Mr Richard Robinson – Executive General Manager PNG Operations Incumbent for the full year Richard is responsible for Oil Search’s operations in PNG including HSES, Oil and Gas production, Drilling, Subsurface and Logistics. Richard was appointed to this role on 1 June 2010.
78

Mr Zlatko Todorcevski – Executive General Manager Finance and Treasury – Chief Financial Officer Incumbent for the full year Zlatko’s role is to manage corporate finance, treasury and audit functions for the company. He is also responsible for planning, performance and cash flow management ensuring appropriate processes and reporting to management and the Board.
The remuneration philosophy outlined above is applied consistently to the Company’s key management personnel. The following table shows the remuneration breakdown for current key management personnel.
Table 9 – Current Key Management Personnel Remuneration Mix
DIRECTORS TFR STI LTI ”AT RISk”
Managing Director 34.5% 34.5% 31.0% 65.5%
EGM External Affairs and Sustainability 41.7% 33.3% 25.0% 58.3%
ExECUTIVES
EGM Gas Commercialisation and PNG Growth 41.7% 33.3% 25.0% 58.3%
EGM PNG LNG 41.7% 33.3% 25.0% 58.3%
EGM Project Development 41.7% 33.3% 25.0% 58.3%
EGM Human Resources 41.7% 33.3% 25.0% 58.3%
EGM Sustainability, Corporate Services & Group Secretary 41.7% 33.3% 25.0% 58.3%
EGM PNG Operations 41.7% 33.3% 25.0% 58.3%
EGM Finance and Treasury – CFO 41.7% 33.3% 25.0% 58.3%
FORMER ExECUTIVES(1)
EGM Sustainability 46.5% 37.2% 16.3% 53.5%
EGM Commercial, International New Ventures, Mergers and Acquisitions 46.5% 37.2% 16.3% 53.5%
(1) The remuneration breakdown for the former executives is based on their 2010 remuneration.
The remuneration mix outlined above is determined by the application of the Oil Search Remuneration Strategy, assuming STI awards at 100% of opportunity (80% of TFR for Senior Executives and 100% of TFR for the Managing Director). Percentages shown in the later section on Executive Remuneration reflect actual incentives paid as a percentage of TFR, which includes movements in leave balances, non monetary benefits and share based payments calculated in accordance with IFRS 2.
The following table is in US Dollars and for all remuneration reporting where stated in US Dollars, the following exchange rates have been used:
ExCHANGE RATE 2010 2011
AUD/USD 0.9187 1.0318
PGK/USD 0.3833 0.4248
79
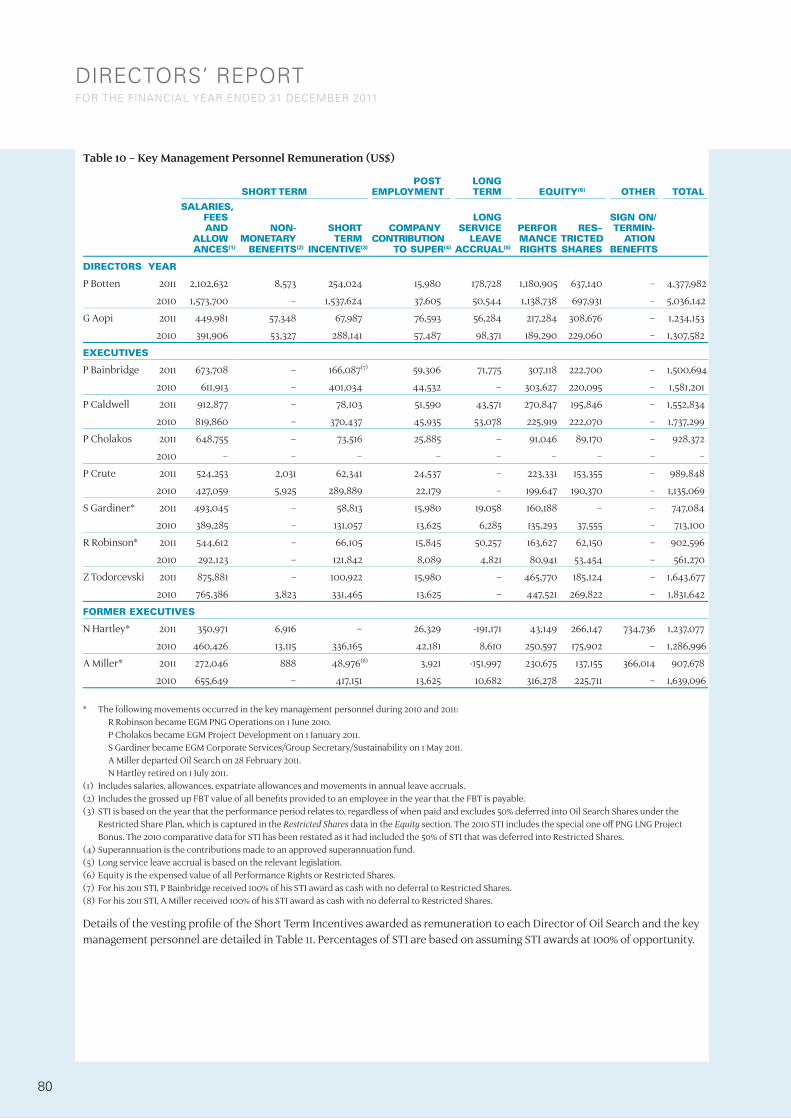
Table 10 – Key Management Personnel Remuneration (US$)
SHORT TERMPOST
EMPLOYMENTLONGTERM EqUITY(6) OTHER TOTAL
SALARIES,FEESAND
ALLOWANCES(1)
NON-MONETARY
BENEFITS(2)
SHORTTERM
INCENTIVE(3)
COMPANYCONTRIBUTION
TO SUPER(4)
LONGSERVICE
LEAVEACCRUAL(5)
PERFORMANCERIGHTS
RES–TRICTEDSHARES
SIGN ON/TERMIN-
ATIONBENEFITS
DIRECTORS YEAR
P Botten 2011 2,102,632 8,573 254,024 15,980 178,728 1,180,905 637,140 – 4,377,982
2010 1,573,700 – 1,537,624 37,605 50,544 1,138,738 697,931 – 5,036,142
G Aopi 2011 449,981 57,348 67,987 76,593 56,284 217,284 308,676 – 1,234,153
2010 391,906 53,327 288,141 57,487 98,371 189,290 229,060 – 1,307,582
ExECUTIVES
P Bainbridge 2011 673,708 – 166,087(7) 59,306 71,775 307,118 222,700 – 1,500,694
2010 611,913 – 401,034 44,532 – 303,627 220,095 – 1,581,201
P Caldwell 2011 912,877 – 78,103 51,590 43,571 270,847 195,846 – 1,552,834
2010 819,860 – 370,437 45,935 53,078 225,919 222,070 – 1,737,299
P Cholakos 2011 648,755 – 73,516 25,885 – 91,046 89,170 – 928,372
2010 – – – – – – – – –
P Crute 2011 524,253 2,031 62,341 24,537 – 223,331 153,355 – 989,848
2010 427,059 5,925 289,889 22,179 – 199,647 190,370 – 1,135,069
S Gardiner* 2011 493,045 – 58,813 15,980 19,058 160,188 – – 747,084
2010 389,285 – 131,057 13,625 6,285 135,293 37,555 – 713,100
R Robinson* 2011 544,612 – 66,105 15,845 50,257 163,627 62,150 – 902,596
2010 292,123 – 121,842 8,089 4,821 80,941 53,454 – 561,270
Z Todorcevski 2011 875,881 – 100,922 15,980 – 465,770 185,124 – 1,643,677
2010 765,386 3,823 331,465 13,625 – 447,521 269,822 – 1,831,642
FORMER ExECUTIVES
N Hartley* 2011 350,971 6,916 – 26,329 -191,171 43,149 266,147 734,736 1,237,077
2010 460,426 13,115 336,165 42,181 8,610 250,597 175,902 – 1,286,996
A Miller* 2011 272,046 888 48,976(8) 3,921 -151,997 230,675 137,155 366,014 907,678
2010 655,649 – 417,151 13,625 10,682 316,278 225,711 – 1,639,096
* The following movements occurred in the key management personnel during 2010 and 2011: R Robinson became EGM PNG Operations on 1 June 2010. P Cholakos became EGM Project Development on 1 January 2011. S Gardiner became EGM Corporate Services/Group Secretary/Sustainability on 1 May 2011. A Miller departed Oil Search on 28 February 2011. N Hartley retired on 1 July 2011.(1) Includes salaries, allowances, expatriate allowances and movements in annual leave accruals.(2) Includes the grossed up FBT value of all benefits provided to an employee in the year that the FBT is payable.(3) STI is based on the year that the performance period relates to, regardless of when paid and excludes 50% deferred into Oil Search Shares under the
Restricted Share Plan, which is captured in the Restricted Shares data in the Equity section. The 2010 STI includes the special one off PNG LNG Project Bonus. The 2010 comparative data for STI has been restated as it had included the 50% of STI that was deferred into Restricted Shares.
(4) Superannuation is the contributions made to an approved superannuation fund.(5) Long service leave accrual is based on the relevant legislation.(6) Equity is the expensed value of all Performance Rights or Restricted Shares.(7) For his 2011 STI, P Bainbridge received 100% of his STI award as cash with no deferral to Restricted Shares.(8) For his 2011 STI, A Miller received 100% of his STI award as cash with no deferral to Restricted Shares.
Details of the vesting profile of the Short Term Incentives awarded as remuneration to each Director of Oil Search and the key management personnel are detailed in Table 11. Percentages of STI are based on assuming STI awards at 100% of opportunity.
DiRectoRs’ RepoRt foR tHe financial YeaR enDeD 31 DecemBeR 2011
80

Table 11 – Analysis of STI Included in Remuneration
DIRECTORSINCLUDED IN
REMUNERATION US$(1) % VESTED IN YEAR % FORFEITED IN YEAR
Managing Director $508,048 28.5% 71.5%
EGM External Affairs and Sustainability $135,974 28.5% 71.5%
ExECUTIVES
EGM Gas Commercialisation and PNG Growth $166,086 28.5% 71.5%
EGM PNG LNG $156,206 28.5% 71.5%
EGM Project Development $147,032 28.5% 71.5%
EGM Human Resources $124,682 28.5% 71.5%
EGM Sustainability, Corporate Services & Group Secretary $117,626 28.5% 71.5%
EGM PNG Operations $132,210 28.5% 71.5%
EGM Finance and Treasury – CFO $201,844 28.5% 71.5%
FORMER ExECUTIVES
EGM Sustainability – – 100.0%
EGM Commercial, International New Ventures, Mergers and Acquisitions(2) $48,976 8.3% 91.7%
(1) The value includes 50% of the STI award paid as cash (as reported in Table 10) as well as the 50% to be deferred via the allocation of Restricted Shares, that will vest on 1 January 2014.
(2) The actual STI Award was based on the tenure during the year, with the percentage vested/forfeited based on the opportunity for the full year.
8. kEY TERMS OF EMPLOYMENT CONTRACTS FOR kEY MANAGEMENT PERSONNEL Table 12 identifies the contractual provisions for current key management personnel. All employees at Oil Search have no contractual entitlement to future increases in remuneration or entitlement to receive any incentives, whether Short Term or Long Term.
Remuneration for all employees is reviewed via an annual process across the organisation. Remuneration for the Managing Director and the key management personnel is reviewed by the Remuneration and Nominations Committee, which then recommends to the Board:
> Budgets for TFR increases for the coming year; > STI payments for the previous year; > STI targets for the coming year; and > LTI participation in the coming year.
For all other employees, the Managing Director approves recommendations from senior managers across the organisation, within budgets approved by the Board.
81

Table 12 – Contractual Provisions for Specified Executives
NAME AND JOB TITLEEMPLOYINGCOMPANY
CONTRACTDURATION
NOTICEPERIODCOMPANY
NOTICEPERIODEMPLOYEE
TERMINATIONPROVISION
DIRECTORS
P BottenManaging Director
POSL Ongoing 6 months 6 months 18 months TFR
G AopiEGM External Affairs and Sustainability
OSPNG Ongoing 1 month 1 month 4 weeks per year of service (minimum 8, maximum of 52 weeks) of TFR
ExECUTIVES
P BainbridgeEGM Gas Commercialisa-tion and PNG Growth
POSL Ongoing 6 months 6 months 4 weeks per year of service (minimum 8, maximum of 52 weeks) of TFR
P CaldwellEGM PNG LNG
OSPNG Ongoing 6 months 6 months 4 weeks per year of service (minimum 8, maximum of 52 weeks) of TFR
P CholakosEGM Project Development
POSL Ongoing 6 months 6 months 4 weeks per year of service (minimum 8, maximum of 52 weeks) of TFR
P CruteEGM Human Resources
POSL Ongoing 6 months 6 months 4 weeks per year of service (minimum 8, maximum of 52 weeks) of TFR
S GardinerEGM Sustainability, Corporate Services & Group Secretary
POSL Ongoing 6 months 6 months 4 weeks per year of service (minimum 8, maximum of 52 weeks) of TFR
R RobinsonEGM PNG Operations
POSL Ongoing 6 months 6 months 4 weeks per year of service (minimum 8, maximum of 52 weeks) of TFR
Z TodorcevskiEGM Finance and Treasury – CFO
POSL Ongoing 6 months 6 months 4 weeks per year of service (minimum 8, maximum of 52 weeks) of TFR
FORMER ExECUTIVES
N HartleyEGM Sustainability
POSL Ongoing 6 months 6 months 6 months + 1 month per year of service (a maximum of 12 months in total) of TFR
A MillerEGM Commercial, International New Ventures, Mergers and Acquisitions
POSL Ongoing 6 months 6 months 1 month per year of service (to a maximum of 12 months) of TFR
9. EqUITY INSTRUMENTSAll Rights in the following tables refer to Performance Rights or Restricted Shares issued in accordance with the Performance Rights Plan or Long Term Incentive Plan. The structure of the Rights is detailed in section 5 on Remuneration Structure.
rIgHtS ovEr EquIty InStruMEntS grAntEd AS rEMunErAtIon Details of Performance Rights over ordinary shares in the Company that were granted as remuneration to each key manager during the reporting period and details of Performance Rights that vested during the reporting period are as follows:
DiRectoRs’ RepoRt foR tHe financial YeaR enDeD 31 DecemBeR 2011
82

Table 13 – Details of Performance Rights Granted
NUMBER OFRIGHTS
GRANTEDDURING 2011
GRANTDATE
FAIR VALUEPER RIGHT (A$)
ExERCISE PRICEPER RIGHT (A$)
ExPIRYDATE
NUMBER OFRIGHTS VESTED
DURING 2011
DIRECTORS
P Botten 245,800 23 May 11 $4.40 $0.00 16 May 14 338,600
G Aopi 51,100 23 May 11 $4.40 $0.00 16 May 14 48,900
ExECUTIVES
P Bainbridge 62,400 23 May 11 $4.40 $0.00 16 May 14 93,000
P Caldwell 58,700 23 May 11 $4.40 $0.00 16 May 14 61,100
P Cholakos 55,200 23 May 11 $4.40 $0.00 16 May 14 –
P Crute 46,800 23 May 11 $4.40 $0.00 16 May 14 65,900
S Gardiner 44,200 23 May 11 $4.40 $0.00 16 May 14 38,700
R Robinson 49,700 23 May 11 $4.40 $0.00 16 May 14 32,400
Z Todorcevski 75,800 23 May 11 $4.40 $0.00 16 May 14 66,485
FORMER ExECUTIVES
N Hartley – – – – – 76,600
A Miller – – – – – 167,799(1)
(1) The performance rights vesting in 2011 include the early vesting of the 2009 and 2010 allocations as approved by the Board.
No Performance Rights have been granted since the end of the financial year. All Performance Rights were provided at no cost to the recipients.
All Performance Rights expire on the earlier of their expiry date or termination of the individual’s employment. They are exercisable on the vesting dates detailed in the tables above and the ability to exercise Performance Rights is conditional on Oil Search achieving certain performance hurdles. Details of the performance criteria are included in the section on Long Term Incentives above. For Performance Rights granted in the current year the earliest exercise date is 16 May 2014.
The deferred component of the 2010 STI was allocated as Restricted Shares under the Long Term Incentive Plan outlined above for certain key management personnel in 2011. The number of Restricted Shares granted or vested in advance of their vesting date during the reporting period is as follows:
Table 14 – Details of Deferred STI granted as Restricted Shares
NUMBER GRANTEDDURING 2011
GRANTDATE
FAIR VALUE(A$)
ExERCISEPRICE (A$)
VESTINGDATE
DIRECTORS
P Botten(1) 74,588 1 Mar 11 $6.94 $0.00 1 Jan 13
G Aopi(2) 18,592 1 Mar 11 $6.94 $0.00 1 Jan 13
ExECUTIVES
P Bainbridge 24,258 1 Mar 11 $6.94 $0.00 1 Jan 13
P Caldwell 22,381 1 Mar 11 $6.94 $0.00 1 Jan 13
P Cholakos Nil – – – –
P Crute 18,061 1 Mar 11 $6.94 $0.00 1 Jan 13
S Gardiner Nil – – – –
R Robinson 19,123 1 Mar 11 $6.94 – 1 Jan 13
Z Todorcevski 28,932 1 Mar 11 $6.94 $0.00 1 Jan 13
FORMER ExECUTIVES
N Hartley(3) 40,482 3 Mar 10 $5.28 $0.00 1 Jul 11
20,327 1 Mar 11 $6.94 $0.00 1 Jul 11
A Miller(4) 46,016 3 Mar 10 $5.28 $0.00 1 Mar 11
(1) The allocation for P Botten was formally approved at the Annual Meeting on 12 May 2011.(2) The allocation for G Aopi was formally approved at the Annual Meeting on 12 May 2011.(3) The 2010 and 2011 allocations vested on 1 July 2011, in advance of their original vesting date and as part of the retirement arrangements for N Hartley.(4) The 2010 allocation vested on 1 March 2011, in advance of the original vesting date and as part of the separation arrangements for A Miller.
83

ModIFICAtIon oF tErMS oF EquIty SEttlEd SHArE BASEd PAyMEnt trAnSACtIonSNo terms related to equity-settled share based payment transactions (including Performance Rights and Restricted Shares granted as compensation to key management personnel) have been altered or modified by the issuing entity during the reporting period or the prior period.
ExErCISE oF rIgHtS grAntEd AS rEMunErAtIon During the reporting period, the following shares were issued on the exercise of Performance Rights previously granted as remuneration:
Table 15 – Details of the Exercise of Performance Rights
ExERCISED IN 2011NUMBER OF
SHARESAMOUNT PAID
PER SHARE (A$)
DIRECTORS
P Botten – –
G Aopi – –
ExECUTIVES
P Bainbridge 93,000 $0.00
P Caldwell 61,100 $0.00
P Cholakos – –
P Crute 65,900 $0.00
S Gardiner 29,753 $0.00
R Robinson 32,400 $0.00
Z Todorcevski 66,485 $0.00
FORMER ExECUTIVES
N Hartley 76,600 $0.00
A Miller(1) 167,799 $0.00
(1) The rights vesting in 2011 include the early vesting of the 2009 and 2010 allocations as approved by the Board.
ExERCISED IN 2010NUMBER OF
SHARESAMOUNT PAID
PER SHARE (A$)
DIRECTORS
P Botten 398,091 $0.00
G Aopi – –
ExECUTIVES
P Bainbridge 109,258 $0.00
P Caldwell 58,000 $0.00
P Cholakos – –
P Crute – –
S Gardiner – –
R Robinson 39,422 $0.00
Z Todorcevski 66,485 $0.00
FORMER ExECUTIVES
N Hartley 90,012 $0.00
A Miller 113,956 $0.00
DiRectoRs’ RepoRt foR tHe financial YeaR enDeD 31 DecemBeR 2011
84
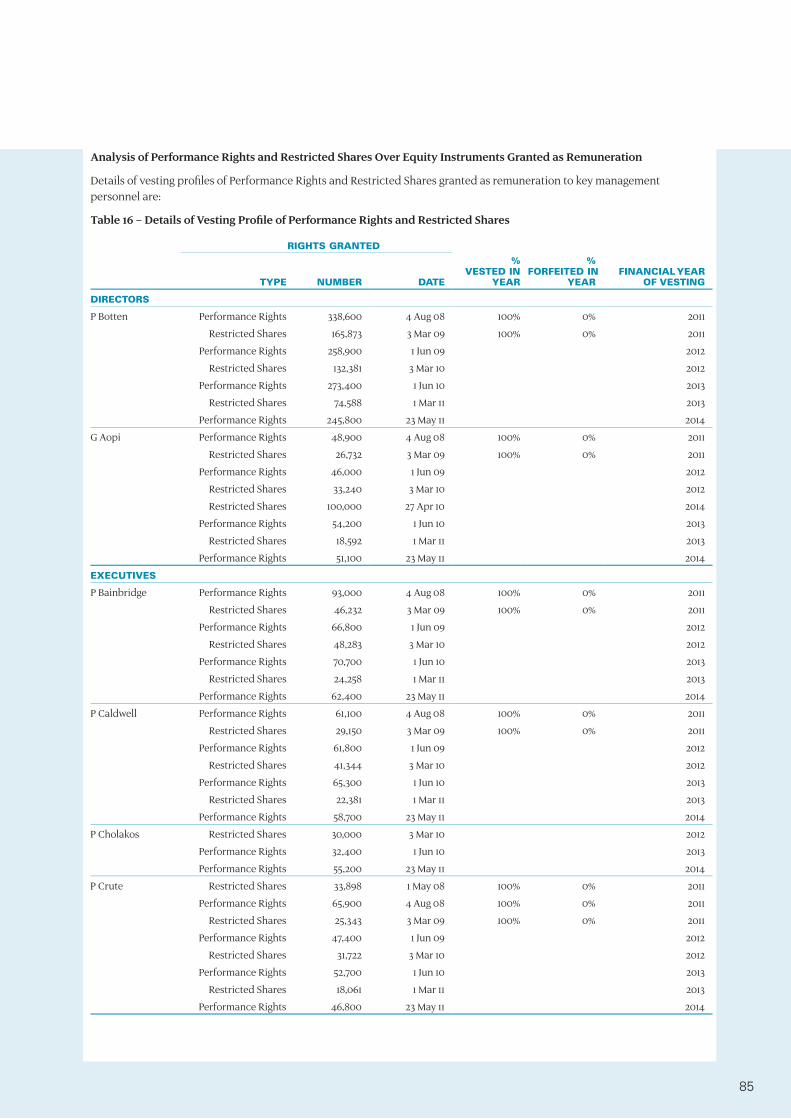
Analysis of Performance Rights and Restricted Shares Over Equity Instruments Granted as Remuneration
Details of vesting profiles of Performance Rights and Restricted Shares granted as remuneration to key management personnel are:
Table 16 – Details of Vesting Profile of Performance Rights and Restricted Shares
RIGHTS GRANTED
TYPE NUMBER DATE
%VESTED IN
YEAR
%FORFEITED IN
YEARFINANCIAL YEAR
OF VESTING
DIRECTORS
P Botten Performance Rights 338,600 4 Aug 08 100% 0% 2011
Restricted Shares 165,873 3 Mar 09 100% 0% 2011
Performance Rights 258,900 1 Jun 09 2012
Restricted Shares 132,381 3 Mar 10 2012
Performance Rights 273,400 1 Jun 10 2013
Restricted Shares 74,588 1 Mar 11 2013
Performance Rights 245,800 23 May 11 2014
G Aopi Performance Rights 48,900 4 Aug 08 100% 0% 2011
Restricted Shares 26,732 3 Mar 09 100% 0% 2011
Performance Rights 46,000 1 Jun 09 2012
Restricted Shares 33,240 3 Mar 10 2012
Restricted Shares 100,000 27 Apr 10 2014
Performance Rights 54,200 1 Jun 10 2013
Restricted Shares 18,592 1 Mar 11 2013
Performance Rights 51,100 23 May 11 2014
ExECUTIVES
P Bainbridge Performance Rights 93,000 4 Aug 08 100% 0% 2011
Restricted Shares 46,232 3 Mar 09 100% 0% 2011
Performance Rights 66,800 1 Jun 09 2012
Restricted Shares 48,283 3 Mar 10 2012
Performance Rights 70,700 1 Jun 10 2013
Restricted Shares 24,258 1 Mar 11 2013
Performance Rights 62,400 23 May 11 2014
P Caldwell Performance Rights 61,100 4 Aug 08 100% 0% 2011
Restricted Shares 29,150 3 Mar 09 100% 0% 2011
Performance Rights 61,800 1 Jun 09 2012
Restricted Shares 41,344 3 Mar 10 2012
Performance Rights 65,300 1 Jun 10 2013
Restricted Shares 22,381 1 Mar 11 2013
Performance Rights 58,700 23 May 11 2014
P Cholakos Restricted Shares 30,000 3 Mar 10 2012
Performance Rights 32,400 1 Jun 10 2013
Performance Rights 55,200 23 May 11 2014
P Crute Restricted Shares 33,898 1 May 08 100% 0% 2011
Performance Rights 65,900 4 Aug 08 100% 0% 2011
Restricted Shares 25,343 3 Mar 09 100% 0% 2011
Performance Rights 47,400 1 Jun 09 2012
Restricted Shares 31,722 3 Mar 10 2012
Performance Rights 52,700 1 Jun 10 2013
Restricted Shares 18,061 1 Mar 11 2013
Performance Rights 46,800 23 May 11 2014
85

Table 16 – Details of Vesting Profile of Performance Rights and Restricted Shares (Continued)
RIGHTS GRANTED
TYPE NUMBER DATE
%VESTED IN
YEAR
%FORFEITED IN
YEARFINANCIAL YEAR
OF VESTING
S Gardiner Performance Rights 38,700 4 Aug 08 100% 0% 2011
Performance Rights 35,000 1 Jun 09 2012
Performance Rights 32,400 1 Jun 10 2013
Performance Rights 44,200 23 May 11 2014
R Robinson Performance Rights 32,400 4 Aug 08 100% 0% 2011
Performance Rights 29,700 1 Jun 09 2012
Performance Rights 55,800 1 Jun 10 2013
Restricted Shares 19,123 1 Mar 11 2013
Performance Rights 49,700 23 May 11 2014
Z Todorcevski Performance Rights 99,728 1 Jan 09 100% 0% 2011
Performance Rights 66,485 1 Jan 09 100% 0% 2011
Performance Rights 146,285 1 Jun 09 2012
Restricted Shares 30,439 3 Mar 10 2012
Performance Rights 84,400 1 Jun 10 2013
Restricted Shares 28,932 1 Mar 11 2013
Performance Rights 75,800 23 May 11 2014
FORMER ExECUTIVES
N Hartley(1) Performance Rights 76,600 4 Aug 08 100% 0% 2011
Restricted Shares 35,364 3 Mar 09 100% 0% 2011
Performance Rights 54,900 1 Jun 09 0% 100% 2012
Restricted Shares 40,482 3 Mar 10 100% 0% 2012
Performance Rights 59,300 1 Jun 10 0% 100% 2013
Restricted Shares 20,327 1 Mar 11 100% 0% 2013
A Miller(2) Performance Rights 96,900 4 Aug 08 100% 0% 2011
Restricted Shares 50,548 3 Mar 09 100% 0% 2011
Performance Rights 69,600 1 Jun 09 67% 33% 2012
Restricted Shares 46,016 3 Mar 10 100% 0% 2012
Performance Rights 73,500 1 Jun 10 33% 67% 2013
(1) As part of his retirement the Board approved full vesting of all restricted shares for N Hartley.(2) As part of his separation the Board approved full vesting of all restricted shares and partial vesting of performance rights based on tenure for A Miller.
DiRectoRs’ RepoRt foR tHe financial YeaR enDeD 31 DecemBeR 2011
86
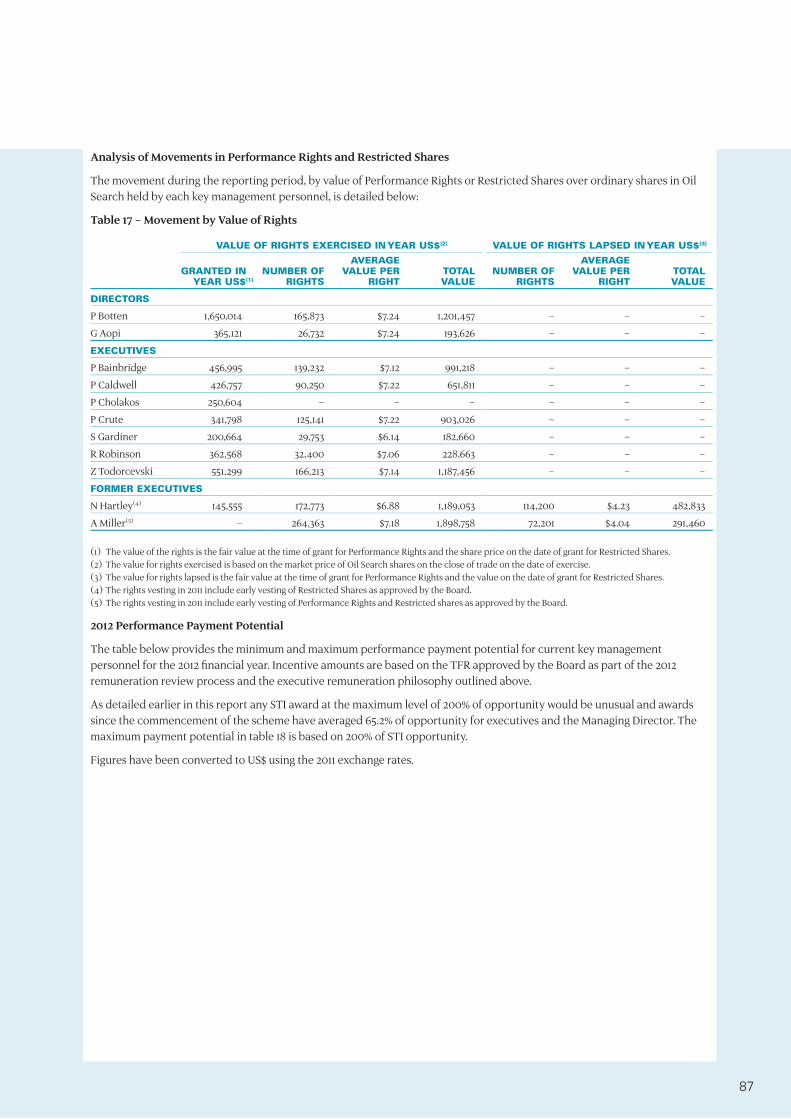
Analysis of Movements in Performance Rights and Restricted Shares
The movement during the reporting period, by value of Performance Rights or Restricted Shares over ordinary shares in Oil Search held by each key management personnel, is detailed below:
Table 17 – Movement by Value of Rights
VALUE OF RIGHTS ExERCISED IN YEAR US$(2) VALUE OF RIGHTS LAPSED IN YEAR US$(3)
GRANTED INYEAR US$(1)
NUMBER OFRIGHTS
AVERAGEVALUE PER
RIGHTTOTALVALUE
NUMBER OFRIGHTS
AVERAGEVALUE PER
RIGHTTOTALVALUE
DIRECTORS
P Botten 1,650,014 165,873 $7.24 1,201,457 – – –
G Aopi 365,121 26,732 $7.24 193,626 – – –
ExECUTIVES
P Bainbridge 456,995 139,232 $7.12 991,218 – – –
P Caldwell 426,757 90,250 $7.22 651,811 – – –
P Cholakos 250,604 – – – – – –
P Crute 341,798 125,141 $7.22 903,026 – – –
S Gardiner 200,664 29,753 $6.14 182,660 – – –
R Robinson 362,568 32,400 $7.06 228,663 – – –
Z Todorcevski 551,299 166,213 $7.14 1,187,456 – – –
FORMER ExECUTIVES
N Hartley(4) 145,555 172,773 $6.88 1,189,053 114,200 $4.23 482,833
A Miller(5) – 264,363 $7.18 1,898,758 72,201 $4.04 291,460
(1) The value of the rights is the fair value at the time of grant for Performance Rights and the share price on the date of grant for Restricted Shares.(2) The value for rights exercised is based on the market price of Oil Search shares on the close of trade on the date of exercise.(3) The value for rights lapsed is the fair value at the time of grant for Performance Rights and the value on the date of grant for Restricted Shares.(4) The rights vesting in 2011 include early vesting of Restricted Shares as approved by the Board.(5) The rights vesting in 2011 include early vesting of Performance Rights and Restricted shares as approved by the Board.
2012 Performance Payment Potential
The table below provides the minimum and maximum performance payment potential for current key management personnel for the 2012 financial year. Incentive amounts are based on the TFR approved by the Board as part of the 2012 remuneration review process and the executive remuneration philosophy outlined above.
As detailed earlier in this report any STI award at the maximum level of 200% of opportunity would be unusual and awards since the commencement of the scheme have averaged 65.2% of opportunity for executives and the Managing Director. The maximum payment potential in table 18 is based on 200% of STI opportunity.
Figures have been converted to US$ using the 2011 exchange rates.
87

Table 18 – 2012 Performance Payment Potential
SHORT TERM INCENTIVE SHORT TERM INCENTIVE LONG TERM INCENTIVE
PAID AS CASH(1) DEFERRED AS SHARES(2) PERFORMANCE RIGHTS(3)
MINIMUM MAxIMUM MINIMUM MAxIMUM MINIMUM MAxIMUM
Directors
P Botten $0 $2,008,605 $0 $2,008,605 $0 $1,807,745
G Aopi $0 $520,027 $0 $520,027 $0 $390,020
Executives
P Bainbridge $0 $582,761 $0 $582,761 $0 $437,070
P Caldwell $0 $575,332 $0 $575,332 $0 $431,499
P Cholakos $0 $541,489 $0 $541,489 $0 $406,116
P Crute $0 $454,817 $0 $454,817 $0 $341,113
S Gardiner $0 $433,356 $0 $433,356 $0 $325,017
R Robinson $0 $482,882 $0 $482,882 $0 $362,162
Z Todorcevski $0 $743,721 $0 $743,721 $0 $557,791
(1) The STI Paid as Cash would be paid in 2013 based on performance for the 2012 year.(2) The STI deferred as shares represents 50% of any STI payment deferred into Restricted Shares under the LTIP for all key management personnel.
These shares would vest in 2014.(3) The maximum value for LTI is based on the methodology detailed in the section on Long Term Incentives (LTI) – Performance Rights.
10. NON-ExECUTIVE DIRECTOR REMUNERATIONrEMunErAtIon PolICy Remuneration for Non-Executive Directors is determined by reference to advice from external consultants and subject to the aggregate limit of A$1,950,000 in any calendar year set by shareholders at the 2009 Annual General Meeting. This advice takes into consideration the level of fees paid to directors of other Australian corporations of similar size and complexity to Oil Search, the growing scale of its international activities and the responsibilities and work requirements of Board members.
rEMunErAtIon PAyABlE Fees payable to Non-Executive Directors are reviewed annually and are fixed by the Board as discussed above. Table 18 below sets out the fee structure applied from 1 January 2011. The fees are based on data from independent advisors and were last increased in 2008.
Table 19 – Annual Board and Committee Fees Payable to Non-Executive Directors in Australian Dollars
POSITIONANNUAL FEE FROM
1 JAN 2011
Chairman of the Board(1) A$450,000
Non-Executive Directors other than the Chairman A$150,000
Chairman Audit Committee (additional fee) A$45,000
Chairman Finance and Risk Management Committee (additional fee) A$35,000
Chairman Remuneration and Nominations Committee (additional fee) A$35,000
Member Audit Committee (additional fee) A$23,000
Member Finance and Risk Management Committee (additional fee) A$20,000
Member Remuneration and Nominations Committee (additional fee) A$20,000
(1) The fees paid to the Chairman of the Board are inclusive of any Committee Fees.
Each non-executive director also receives a travel allowance of A$23,000 per annum to compensate for the extraordinary time spent travelling between Papua New Guinea and Australia to attend Board and Committee Meetings.
Board fees are paid to non-executive directors only.
In addition to Board and Committee fees, non-executive directors are entitled to be reimbursed for all reasonable travel, accommodation and other expenses incurred in attending meetings of the Board, Committees or shareholders or while engaged on Oil Search business.
The Board approved a one off payment to the Chairman of A$26,000 in 2011 for his work in the capacity of Acting Chairman of the Remuneration and Nominations Committee from December 2009 until May 2011.
DiRectoRs’ RepoRt foR tHe financial YeaR enDeD 31 DecemBeR 2011
88

The total remuneration which was paid to each non-executive director in 2011 is set out in Table 20.
There are no provisions in any of the non-executive directors’ appointment arrangements for compensation payable on early termination of their directorship.
There is no separate retirement benefits plan or provision for superannuation for Oil Search’s non-executive directors.
Equity Participation for Non-Executive Directors
There is no share plan for Oil Search non-executive directors.
Details of Directors’ Remuneration
The details of the remuneration received by Oil Search directors in 2011 are set out in Table 20 below.
The Managing Director, Mr Botten, and the Executive General Manager External Affairs and Sustainability, Mr Aopi, are the only executive directors on the Board.
Table 20 – Remuneration (US$) of Directors of Oil Search Limited
SHORT TERMPOST
EMPLOYMENTLONGTERM EqUITY OTHER TOTAL
YEAR
SALARIES,FEES AND
ALLOW-ANCES
NON-MONETARY
BENEFITS
SHORTTERM
IN-CENTIVE
COMPANYCONTRI-BUTION
TO SUPER
LONGSERVICE
LEAVEACCRUAL
PERFOR-MANCERIGHTS
REST-RICTED
SHARES
SIGN ON/TERMIN-
ATIONBENE-
FITS
ExECUTIVE DIRECTORS
P Botten 2011 2,102,632 8,573 254,024 15,980 178,728 1,180,905 637,140 – 4,377,982
2010 1,573,700 – 1,537,624 37,605 50,544 1,138,738 697,931 – 5,036,142
G Aopi 2011 449,981 57,348 67,987 76,593 56,284 217,284 308,676 – 1,234,153
2010 391,906 53,327 288,141 57,487 98,371 189,290 229,060 – 1,307,582
NON-ExECUTIVE DIRECTORS
BF Horwood 2011 514,868 – – – – – – – 514,868
2010 376,667 – – – – – – – 376,667
F Ainsworth* 2011 – – – – – – – – –
2010 131,604 – – – – – – – 131,604
KG Constantinou 2011 219,773 – – – – – – – 219,773
2010 166,285 – – – – – – – 166,285
R Igara 2011 222,869 – – – – – – – 222,869
2010 171,797 – – – – – – – 171,797
A Kantsler* 2011 236,368 – – – – – – – 236,368
2010 76,252 – – – – – – – 76,252
MDE Kriewaldt 2011 245,568 – – – – – – – 245,568
2010 178,228 – – – – – – – 178,228
JL Stitt 2011 222,869 – – – – – – – 222,869
2010 171,797 – – – – – – – 171,797
ZE Switkowski* 2011 229,638 – – – – – – – 229,638
2010 18,074 – – – – – – – 18,074
TN Warren* 2011 – – – – – – – – –
2010 – – – – – – – – –
* The following movements occurred in the non-executive directors during 2010 and 2011. F Ainsworth resigned from the Oil Search Board on 20 September 2010. A Kantsler joined the Oil Search Board on 19 July 2010. ZE Switkowski joined the Oil Search Board on 22 November 2010. TN Warren resigned from the Oil Search Board on 31 May 2010 following a leave of absence.
89
DiRectoRs’ RepoRt foR tHe financial YeaR enDeD 31 DecemBeR 2011
IndEMnIFICAtIon And InSurAnCE oF dIrECtorS, oFFICErS, EMPloyEES And AudItorS During the financial year, the Company paid premiums to insure all directors, officers and employees of the Company against claims brought against the individual while performing services for the Company and against expenses relating thereto. The amount of the insurance premium paid during the year has not been disclosed as it would breach the confidentiality clause in the insurance policy.
The Company has agreed to indemnify the directors, officers and employees of the Company against any liability to another person other than the Company or a related body corporate for an act or omission that may arise from their positions as directors, officers and employees of the Company and its controlled entities, to the extent permitted by the PNG Companies Act 1997.
No indemnity has been granted to an auditor of the Company in their capacity as auditor of the Company.
AudItor IndEPEndEnCE And non-AudIt SErvICES During the year the auditor, Deloitte Touche Tohmatsu provided non-audit accounting services for the economic entity. This is outlined in note 27. Deloitte Touche Tohmatsu’s Independence Declaration which forms part of this report is attached on page 91.
lIKEly FuturE dEvEloPMEntS Oil and gas production from each of the PNG fields in which the Company holds an interest is expected to continue in 2012.
The 2012 work programme includes ongoing development wells in the Kutubu and Moran fields and a number of workovers. Exploration activity will increase in both PNG and the Middle East/North Africa in 2012. The Company is set to embark on the largest drilling programme in its long history, with gas appraisal and development wells at Hides and P’nyang, gas exploration at Trapia and oil appraisal and exploration in the Kutubu fields and in the Taza PSC in Kurdistan.
The construction phase for the PNG LNG Project will continue in 2012 with major work programmes planned for the LNG plant, field and pipeline development and supporting infrastructure.
Recent successful exploration and appraisal drilling within the oil fields is expected to largely offset natural field decline. Output will be impacted by a three week shutdown of the Central Processing Facility and Agogo Processing Facility in the first quarter of 2012 and two shorter shutdowns of the Gobe Processing Facility in the second and fourth quarters of 2012, to enable Associated Gas work related to the PNG LNG Project to be progressed further. Present forecasts indicate that production is likely to remain largely flat into 2013, assuming planned development activities are successful.
Further information about likely developments in the operations of the Group and the expected results of those operations in future financial years has not been included in this report because disclosure of the information would be likely to result in unreasonable prejudice to the Group.
roundIng The majority of amounts included in this report are rounded to the nearest US$1,000 (where rounding is applicable).
Signed in accordance with a resolution of the Directors.
BF HORWOOD Chairman
PR BOTTEN Managing Director
Sydney, 20 February 2012
90

auDitoR’s inDepenDence DeclaRation DiRectoRs’ RepoRt foR tHe financial YeaR enDeD 31 DecemBeR 2011
Liability limited by a scheme approved under Professional Standards Legislation. Member of Deloitte Touche Tohmatsu Limited
Deloitte Touche Tohmatsu A.B.N. 74 490 121 060
Grosvenor Place 225 George Street Sydney NSW 2000 PO Box N250 Grosvenor Place Sydney NSW 1220 Australia
DX 10307SSE Tel: +61 (0) 2 9322 7000 Fax: +61 (0) 2 9322 7001 www.deloitte.com.au
20 February 2012 Dear Directors,
Oil Search Limited I am pleased to provide the following declaration of independence to the directors of Oil Search Limited. As lead audit partner for the audit of the financial statements of Oil Search Limited for the year ended 31 December 2011, I declare that to the best of my knowledge and belief, there have been no contraventions of:
(i) the auditor independence requirements of the Australian Corporations Act 2001 in relation to the audit; and
(ii) any applicable code of professional conduct in relation to the audit. Yours sincerely DELOITTE TOUCHE TOHMATSU Jason Thorne Partner Chartered Accountants
The Directors Oil Search Limited Level 27, Angel Place 123 Pitt Street Sydney NSW 2000
91
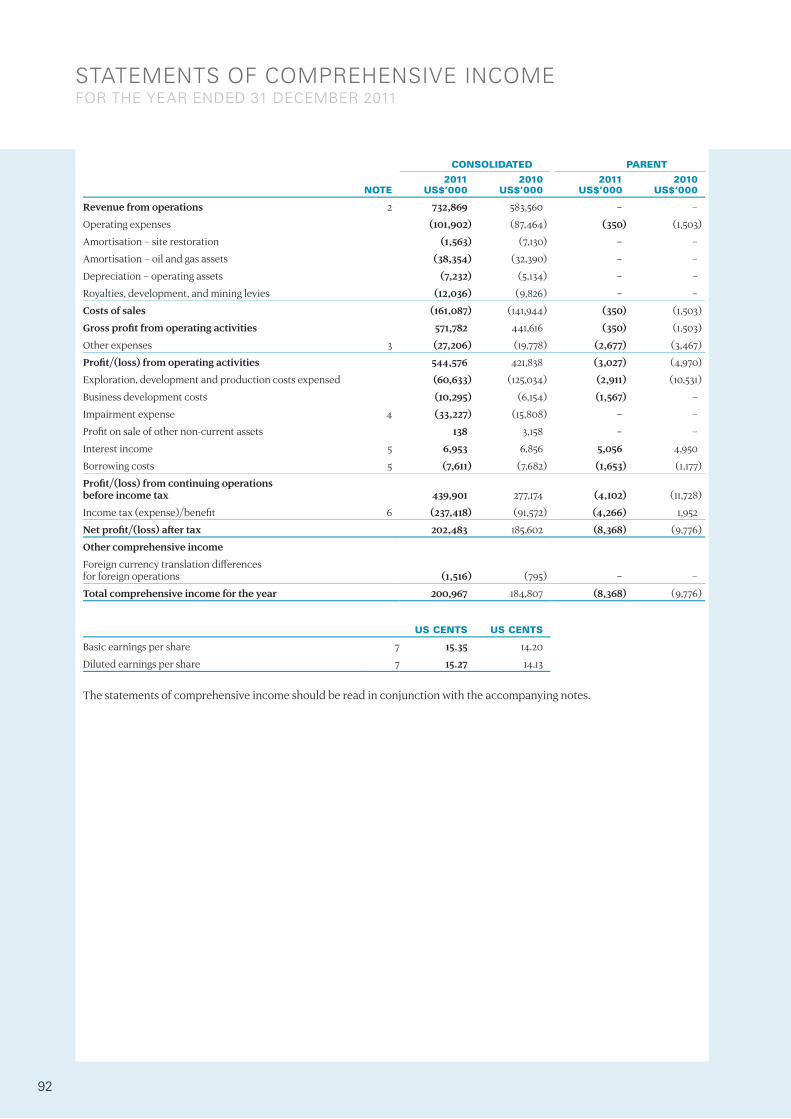
statements of compReHensive incomefoR tHe YeaR enDeD 31 DecemBeR 2011
CONSOLIDATED PARENT
NOTE2011
US$’0002010
US$’0002011
US$’0002010
US$’000
Revenue from operations 2 732,869 583,560 – –
Operating expenses (101,902) (87,464) (350) (1,503)
Amortisation – site restoration (1,563) (7,130) – –
Amortisation – oil and gas assets (38,354) (32,390) – –
Depreciation – operating assets (7,232) (5,134) – –
Royalties, development, and mining levies (12,036) (9,826) – –
Costs of sales (161,087) (141,944) (350) (1,503)
Gross profit from operating activities 571,782 441,616 (350) (1,503)
Other expenses 3 (27,206) (19,778) (2,677) (3,467)
Profit/(loss) from operating activities 544,576 421,838 (3,027) (4,970)
Exploration, development and production costs expensed (60,633) (125,034) (2,911) (10,531)
Business development costs (10,295) (6,154) (1,567) –
Impairment expense 4 (33,227) (15,808) – –
Profit on sale of other non-current assets 138 3,158 – –
Interest income 5 6,953 6,856 5,056 4,950
Borrowing costs 5 (7,611) (7,682) (1,653) (1,177)
Profit/(loss) from continuing operations before income tax 439,901 277,174 (4,102) (11,728)
Income tax (expense)/benefit 6 (237,418) (91,572) (4,266) 1,952
Net profit/(loss) after tax 202,483 185,602 (8,368) (9,776)
Other comprehensive income
Foreign currency translation differences for foreign operations (1,516) (795) – –
Total comprehensive income for the year 200,967 184,807 (8,368) (9,776)
US CENTS US CENTS
Basic earnings per share 7 15.35 14.20
Diluted earnings per share 7 15.27 14.13
The statements of comprehensive income should be read in conjunction with the accompanying notes.
92

CONSOLIDATED PARENT
NOTE2011
US$’0002010
US$’0002011
US$’0002010
US$’000
Current assets
Cash and cash equivalents 22(a) 1,047,463 1,263,589 779,259 972,745
Receivables 9 102,253 87,912 423,464 210,992
Inventories 10 59,862 60,190 – –
Current tax asset – – – 4,229
Other assets 11 85,600 85,771 359 136
Total current assets 1,295,178 1,497,462 1,203,082 1,188,102
Non-current assets
Receivables 9 3,966 3,326 – –
Other non-current assets 11 329 916 – –
Exploration and evaluation assets 12 337,611 281,840 30,069 27,510
Oil and gas assets 13 3,778,161 2,311,194 – 2
Other property, plant and equipment 14 67,977 72,108 – 11
Investments 15 29 29 326,507 326,507
Deferred tax assets 16 218,783 203,192 6,556 6,982
Total non-current assets 4,406,856 2,872,605 363,132 361,012
Total assets 5,702,034 4,370,067 1,566,214 1,549,114
Current liabilities
Payables 17 415,946 301,042 9,520 1,529
Provisions 18 5,556 5,540 80 80
Current tax payable 106,908 69,660 791 –
Total current liabilities 528,410 376,242 10,391 1,609
Non-current liabilities
Payables 17 4,899 – – –
Provisions 18 212,429 111,408 – –
Loans and borrowings 19 1,747,567 929,720 – –
Deferred tax liabilities 20 191,497 154,230 359 388
Total non-current liabilities 2,156,392 1,195,358 359 388
Total liabilities 2,684,802 1,571,600 10,750 1,997
Net assets 3,017,232 2,798,467 1,555,464 1,547,117
Shareholders’ equity
Share capital 21 1,683,492 1,610,667 1,683,492 1,610,667
Reserves 21 12,956 16,818 6,498 9,882
Retained earnings 1,320,784 1,170,982 (134,526) (73,432)
Total shareholders’ equity 3,017,232 2,798,467 1,555,464 1,547,117
The statements of financial position should be read in conjunction with the accompanying notes.
statements of financial positionas at 31 DecemBeR 2011
93

statements of casH flowsfoR tHe YeaR enDeD 31 DecemBeR 2011
CONSOLIDATED PARENT
NOTE2011
US$’0002010
US$’0002011
US$’0002010
US$’000
Cash flows from operating activities
Receipts from customers 724,392 624,048 – –
Payments to suppliers and employees (103,184) (103,108) (4,769) (6,124)
Interest received 7,205 6,021 5,377 4,130
Borrowing costs paid (2,927) (2,694) (1,653) (1,177)
Income tax (paid)/refund (178,494) (124,447) 1,151 (6,353)
Payments for exploration and evaluation – seismic, G&A , G&G(1) (49,838) (46,991) – –
Payments for site rehabilitation (666) – – –
Payments for business development (10,295) (6,154) (1,567) –
Net cash from/(used in) operating activities 22(b) 386,193 346,675 (1,461) (9,524)
Cash flows from investing activities
Payments for property, plant and equipment (7,121) (6,984) – (10)
Payments for exploration and evaluation expenditure(1) (121,866) (140,635) (10,364) (36,620)
Payments for development asset expenditure (1,059,263) (908,739) – (2)
Payments for producing asset expenditure (128,540) (48,650) – –
Net cash outflow on investment – (29) – –
Net cash used in investing activities (1,316,790) (1,105,037) (10,364) (36,632)
Cash flows from financing activities
Proceeds from underwriter of dividend reinvestment plan (DRP) 36,786 33,921 36,786 33,921
Dividend payments (net of DRP)(2) 8 (36,723) (33,797) (36,786) (33,921)
Cash received from option/right share issues 6,328 4,049 6,328 4,049
Costs relating to dividend reinvestment plan (49) (52) (49) (52)
Purchase of treasury shares – (59) – –
Proceeds from borrowings 708,129 729,812 – –
Net cash from/(used in) financing activities 714,471 733,874 (181,661) (12,337)
Net decrease in cash and cash equivalents (216,126) (24,488) (193,486) (58,493)
Cash and cash equivalents at the beginning of the year 1,263,589 1,288,077 972,745 1,031,238
Cash and cash equivalents at the end of the year 22(a) 1,047,463 1,263,589 779,259 972,745
(1) Prior year comparatives have been restated in accordance with IAS 8 “Accounting Policies, Changes in Accounting Estimates and Errors” upon adoption of the “Improvements to IFRS’s”, specifically IAS 7 “Statement of Cash Flows”.
(2) Total dividend payments including cash and dividend reinvestment was US$52.7 million (2010: US$52.1 million). Total dividend payments net of dividends reinvested under the dividend reinvestment plan was US$36.8 million (2010: US$33.9 million).
The statements of cash flows should be read in conjunction with the accompanying notes.
94

statements of cHanges in equitYfoR tHe YeaR enDeD 31 DecemBeR 2011
CONSOLIDATED
SHARECAPITALUS$’000
FOREIGNCURRENCY
TRANS-LATION
RESERVEUS$’000
RESERVEFOR
TREASURYSHARESUS$’000
EMPLOYEEEqUITY
COMPEN-SATION
RESERVEUS$’000
RETAINEDEARNINGSUS$’000
TOTALUS$’000
Balance at 1 January 2010 1,550,213 2,737 (16,821) 19,531 1,037,521 2,593,181
Dividends provided for or paid – – – – (52,087) (52,087)
Total comprehensive income for the year
Net profit after tax for the year – – – – 185,602 185,602
Other comprehensive income:
Exchange differences on translation of foreign operations – (795) – – – (795)
Total comprehensive income for the year – (795) – – 185,602 184,807
Transactions with owners, recorded directly in equity
Issue of shares through dividend reinvestment plan 52,211 – – – – 52,211
Costs associated with share issues (52) – – – – (52)
Transfer of vested shares 13,421 – – (13,421) – –
Release of treasury shares on vesting (11,491) – 11,491 – – –
Issue of shares on exercise of options and rights 4,049 – – – – 4,049
Employee share-based remuneration expense – – – 14,932 – 14,932
Issue of treasury shares 2,316 – (2,316) – – –
Purchase of treasury shares – – (59) – – (59)
Net exchange differences – 1,327 212 – 1,539
Trust distribution – – – – (54) (54)
Total transactions with owners 60,454 – 10,443 1,723 (54) 72,566
Balance at 31 December 2010 1,610,667 1,942 (6,378) 21,254 1,170,982 2,798,467
Balance at 1 January 2011 1,610,667 1,942 (6,378) 21,254 1,170,982 2,798,467
Dividends provided for or paid – – – – (52,663) (52,663)
Total comprehensive income for the year
Net profit after tax for the year – – – – 202,483 202,483
Other comprehensive income:
Exchange differences on translation of foreign operations – (1,516) – – – (1,516)
Total comprehensive income for the year – (1,516) – – 202,483 200,967
Transactions with owners, recorded directly in equity
Issue of shares through dividend reinvestment plan 52,726 – – – – 52,726
Costs associated with share issues (49) – – – – (49)
Transfer of vested shares 13,070 – – (13,070) – –
Release of treasury shares on vesting (1,039) – 2,566 (1,527) – –
Issue of shares on exercise of options and rights 6,328 – – – – 6,328
Employee share-based remuneration expense – – – 12,057 – 12,057
Issue of treasury shares 1,789 – (1,789) – – –
Net exchange differences – – (583) – (583)
Trust distribution – – – – (18) (18)
Total transactions with owners 72,825 – 777 (3,123) (18) 70,461
Balance at 31 December 2011 1,683,492 426 (5,601) 18,131 1,320,784 3,017,232
The statements of changes in equity should be read in conjunction with the accompanying notes.
95

statements of cHanges in equitYfoR tHe YeaR enDeD 31 DecemBeR 2011
PARENT
SHARECAPITALUS$’000
FOREIGNCURRENCY
TRANS-LATION
RESERVEUS$’000
AMALGAMATION
RESERVEUS$’000
RESERVEFOR
TREASURYSHARESUS$’000
EMPLOYEEEqUITY
COMPEN-SATION
RESERVEUS$’000
RETAINEDEARNINGSUS$’000
TOTALUS$’000
Balance at 1 January 2010 1,550,213 – (2,990) – 13,465 (11,445) 1,549,243
Dividends provided for or paid – – – – – (52,087) (52,087)
Total comprehensive income for the year
Net loss after tax for the year – – – – – (9,776) (9,776)
Total comprehensive income for the year – – – – – (9,776) (9,776)
Transactions with owners, recorded directly in equity
Issue of shares through dividend reinvestment plan 52,211 – – – – – 52,211
Costs associated with share issues (52) – – – – – (52)
Transfer of vested shares 13,421 – – – (13,421) – –
Release of treasury shares on vesting (11,491) – – – – – (11,491)
Issue of shares on exercise of options and rights 4,049 – – – – – 4,049
Employee share-based remuneration – – – – 14,932 – 14,932
Issue of treasury shares 2,316 – – – (2,316) – –
Net exchange differences – – – – 212 – 212
Dividends received on shares held in trust(1) – – – – – (124) (124)
Total transactions with owners 60,454 – – – (593) (124) 59,737
Balance at 31 December 2010 1,610,667 – (2,990) – 12,872 (73,432) 1,547,117
Balance at 1 January 2011 1,610,667 – (2,990) – 12,872 (73,432) 1,547,117
Dividends provided for or paid – – – – – (52,663) (52,663)
Total comprehensive income for the year
Net loss after tax for the year – – – – – (8,368) (8,368)
Total comprehensive income for the year – – – – – (8,368) (8,368)
Transactions with owners, recorded directly in equity
Issue of shares through dividend reinvestment plan 52,726 – – – – – 52,726
Costs associated with share issues (49) – – – – – (49)
Transfer of vested shares 13,070 – – – (13,070) – –
Release of treasury shares on vesting (1,039) – – – – – (1,039)
Issue of shares on exercise of options and rights 6,328 – – – – – 6,328
Employee share-based remuneration – – – – 12,057 – 12,057
Issue of treasury shares 1,789 – – – (1,789) – –
Net exchange differences – – – – (582) – (582)
Dividends received on shares held in trust(1) – – – – – (63) (63)
Total transactions with owners 72,825 – – – (3,384) (63) 69,378
Balance at 31 December 2011 1,683,492 – (2,990) – 9,488 (134,526) 1,555,464
(1) Dividends received on shares held in Retention Share Plan Trust are eliminated on a Group basis.
The statements of changes in equity should be read in conjunction with the accompanying notes.
96

notes to tHe financial statementsfoR tHe financial YeaR enDeD 31 DecemBeR 2011
1 summaRY of significant accounting policies
Oil Search Limited, the parent entity, is incorporated in Papua New Guinea (PNG). The consolidated financial report for the year ended 31 December 2011 comprises the parent and its controlled entities (consolidated entity).
The financial statements were authorised for issue by the directors on 21 February 2012.
(A) BASIS OF PREPARATIONThe financial statements have been prepared in accordance with the historical cost convention together with the PNG Companies Act 1997, International Financial Reporting Standards (IFRS) and interpretations of the International Financial Reporting Interpretations Committee.
All amounts in these statements are expressed in US dollars, as this is the functional and presentational currency of the consolidated entity.
(i) Issued standards adopted during year > Revised IAS 24 “Related Party Disclosures”; > Amended IAS 27 “Consolidated and Separate Financial Statements”; > Amended IAS 32 “Classification of Rights Issues”; > Various Standards “Improvements to IFRS’s 2009” – dealt with on a standard-by-standard basis; > Various Standards “Improvements to IFRS’s 2010” – dealt with on a standard-by-standard basis; > Interpretation 14 “Prepayments of a Minimum Funding Requirement”; and > Interpretation 19 “Extinguishing Financial Liabilities with Equity Instruments”.
(ii) Issued standards not early adopted At 31 December 2011, certain new accounting standards and interpretations have been published that will become mandatory in future reporting periods. Oil Search has not elected to early-adopt these new or amended accounting standards and interpretations. The expected impact of these changed accounting requirements should not materially alter Oil Search’s financial results at the date of this report. The consolidated entity will adopt the following standards during the applicable mandatory annual reporting periods:
Standards applicable for annual reporting periods beginning on or after 1 July 2011 > Amended IFRS 7 “Financial Instruments: Disclosures”; > Various Standards “Improvements to IFRS’s 2011” - dealt with on a standard-by-standard basis.
Standards applicable for annual reporting periods beginning on or after 1 January 2012 > Amended IAS 12 “Income Taxes”.
Standards applicable for annual reporting periods beginning on or after 1 July 2012 > Amended IAS 1 “Presentation of Items of Other Comprehensive Income”.
Standards applicable for annual reporting periods beginning on or after 1 January 2013 > IFRS 10 “Consolidated Financial Statements”; > IFRS 11 “Joint Arrangements”; > IFRS 12 “Disclosures of Interests in Other Entities”; > IFRS 13 “Fair Value Measurement”; > IAS 19 “Employee Benefits”; > IAS 27 “Separate Financial Statements”; > IAS 28 “Investments in Associates and Joint Ventures”; and > Amended IAS 32 “Financial Instruments: Presentation”.
Standards applicable for annual reporting periods beginning on or after 1 January 2015 > IFRS 9 “Financial Instruments”, (this standard will eventually replace IAS 39 “Financial Instruments: Recognition
and Measurement”); and > IFRS 9 “Financial Instruments - Amendments to Other IFRSs”, (to be adopted upon application of IFRS 9).
97

notes to tHe financial statementsfoR tHe financial YeaR enDeD 31 DecemBeR 2011
1 summaRY of significant accounting policies ContInuEd
(B) PRINCIPLES OF CONSOLIDATIONThe consolidated financial statements comprise the financial statements of Oil Search Limited (the parent company) and its controlled subsidiaries, after elimination of all inter-company transactions. Subsidiaries are consolidated from the date the parent obtains control and until such time as control ceases.
On acquisition, the assets and liabilities of a subsidiary are measured at their fair values at the date of acquisition. The results of subsidiaries acquired or disposed of during the year are included in the consolidated income statement from the effective date of acquisition or up to the effective date of disposal.
The financial statements of subsidiaries are prepared for the same reporting period as the parent company, using consistent accounting policies. Adjustments are made to bring into line any dissimilar accounting policies that may exist.
(C) CURRENCY TRANSLATIONTranslation of transactions denominated in currencies other than US dollars Transactions in currencies other than US dollars (US$) of entities within the economic entity are converted to US$ at the rate of exchange ruling at the date of the transaction.
Amounts payable to and by the entities within the economic entity that are outstanding at the balance date and are denominated in currencies other than US$ have been converted to US$ using rates of exchange ruling at the end of the financial year.
All resulting exchange differences arising on settlement or retranslation are brought to account in determining the profit or loss for the financial year.
Translation of financial reports of overseas operations All operations outside Australia have a functional currency of US$. Exchange gains and losses arising on translation of non US$ functional currency financial statements are brought to account directly in equity.
(D) INCOME RECOGNITIONOil, gas and other liquid sales The economic entity’s revenue, which is mainly derived from the sale of crude oil, is brought to account after each shipment is loaded. Gas sales are recognised on production following delivery into the pipeline.
Dividend income Dividend income is taken to profit after dividends have been declared.
(E) CAPITALISATION OF BORROWING COSTSInterest and other finance charges on borrowings for major capital projects are capitalised until the commencement of production and then amortised over either the estimated economic life of the project or a fixed term from the completion date. Where only part of a project is commissioned, interest capitalisation occurs on a pro-rata basis. All other borrowing costs are recognised in the profit or loss in the period in which they are incurred.
(F) LEASESOperating lease payments, where the lessor effectively retains substantially all of the risks and benefits of ownership of the leased items, are included in the determination of the operating profit on a straight line basis over the lease term.
(G) SHARE-BASED REMUNERATIONThe Group currently operates equity-settled, share-based compensation plans of share options, share appreciation rights, performance rights and restricted shares. In accordance with IFRS 2, the fair value of the employee services received in exchange for the grant of the options and rights is recognised as an expense. The total amount to be expensed over the vesting period is determined by reference to their grant date fair value, excluding the impact of any non-market vesting conditions. Non-market vesting conditions are included in assumptions about the number of options, rights and restricted shares that are expected to become exercisable. At each balance sheet date, the entity revises its estimates of the number of options that are expected to become exercisable. It recognises the impact of the revision of original estimates, if any, in the profit and loss statement, and a corresponding adjustment to equity over the remaining vesting period.
The proceeds received net of any directly attributable transaction costs are credited to share capital when options are exercised.
98

notes to tHe financial statementsfoR tHe financial YeaR enDeD 31 DecemBeR 2011
The reserve for the Company’s own shares (“treasury shares”) represents the cost of shares held by the trustee of an equity compensation plan that the Group is required to include in the consolidated financial statements. This reserve will be reversed with any surplus or deficit on sale shown as an adjustment to retained earnings when the underlying shares are exercised under share rights. No gain or loss is recognised in profit or loss on the purchase, sale, issue or cancellation of the Group’s own equity instruments.
(H) INCOME TAxThe current tax payable or receivable is based on taxable profit for the year. Taxable profit differs from net profit as reported in the profit and loss statement because it excludes items of income or expense that are taxable or deductible in other years and it further excludes items that are never taxable or deductible. The economic entity’s liability or asset for current tax is calculated using tax rates that have been enacted
Deferred tax is accounted for using the balance sheet liability method. Temporary differences are differences between the tax base of an asset or liability and its carrying amount in the balance sheet. The tax base of an asset or liability is the amount attributed to that asset or liability for tax purposes.
In principle, deferred tax liabilities are recognised for all taxable temporary differences. Deferred tax assets are recognised to the extent that it is probable that sufficient taxable amounts will be available against which deductible temporary differences or unused tax losses and tax offsets can be utilised. However, deferred tax assets and liabilities are not recognised if the temporary differences giving rise to them arise from initial recognition of assets and liabilities (other than as a result of a business combination) which affects neither taxable income nor accounting profit. Furthermore, a deferred tax liability is not recognised in relation to taxable temporary differences arising from the initial recognition of goodwill.
The carrying amount of deferred tax assets is reviewed at each balance sheet date and reduced to the extent that it is no longer probable that sufficient taxable profit will be available to allow all or part of the deferred tax asset to be utilised.
Deferred tax assets and liabilities are measured at the tax rates that are expected to apply to the period when the asset is realised or the liability is settled, based on tax rates (and tax laws) that have been enacted or substantively enacted at the balance sheet date. Deferred tax is charged or credited in the profit and loss statement, except when it relates to items charged or credited directly to equity, in which case the deferred tax is also dealt with in equity.
Tax benefits transferred between group companies are transferred under normal commercial arrangements, with consideration paid equal to the tax benefit of the transfer.
(I) INVENTORIESInventories are valued at the lower of cost or net realisable value. Cost is determined as follows:
> materials, which include drilling and maintenance stocks, are valued at the cost of acquisition; and > petroleum products, comprising extracted crude oil and condensate stored in tanks and pipeline systems, are valued
using the full absorption cost method.
Inventories are accounted for on a FIFO basis.
(J) ExPLORATION AND EVALUATION ASSETSExploration and evaluation expenditures are accounted for under the successful efforts method. Exploration licence acquisition costs are initially capitalised. For exploration wells, costs directly associated with the drilling of wells are initially capitalised pending evaluation of whether potentially economic reserves of hydrocarbons have been discovered.
Costs are expensed where the well does not result in the successful discovery of potentially economically recoverable hydrocarbons, unless the well is to be used in the recovery of economically recoverable hydrocarbons.
All other exploration and evaluation expenditures including directly attributable general administration costs, geological and geophysical costs and new venture activity expenditures are charged as expenses in the income statement as incurred, except where:
> The expenditure relates to an exploration discovery that: – at balance date, an assessment of the existence or otherwise of economically recoverable reserves is not yet complete; or where – a decision on additional major capital expenditure is pending; or – additional exploration wells or appraisal work is underway or planned.
> The expenditure relates to a discovery well and it is expected that the expenditure will be recouped by future exploitation or sale.
When an oil or gas field has been approved for development, the accumulated exploration and evaluation costs are transferred to Oil and Gas Assets – Assets in Development.
99

notes to tHe financial statementsfoR tHe financial YeaR enDeD 31 DecemBeR 2011
1 summaRY of significant accounting policies ContInuEd
(k) OIL AND GAS ASSETSAssets in development The costs of oil and gas assets in development are separately accounted for and include past exploration and evaluation costs, development drilling and other subsurface expenditure, surface plant and equipment and any associated land and buildings. When the committed development expenditure programmes are completed and production commences, these costs are subject to amortisation. Once the required statutory documentation for a production licence is lodged the accumulated costs are transferred to Oil and Gas Assets – Producing Assets.
Producing assets The costs of oil and gas assets in production are separately accounted for and include past exploration and evaluation costs, past development costs and the ongoing costs of continuing to develop reserves for production and to expand or replace plant and equipment and any associated land and buildings. These costs are subject to amortisation. Where asset costs incurred in relation to a producing field are under evaluation and appraisal, those costs will be continually reviewed for recoupment of those costs by future exploitation. When a determination has been made that those expenditures will not be recouped and/or no further appraisal will be undertaken, they will be written off.
Commencing from 2010, past expenditure and accumulated amortisation relating to oil operations now included within the LNG Project will be transferred from producing assets to assets in development with amortisation suspended. Upon completion of the LNG Project, all LNG assets in development will be transferred to producing assets and amortised.
Amortisation of oil and gas assets Costs in relation to producing assets are amortised on a production output basis. In relation to the Kutubu, Gobe, Greater Moran and SE Mananda oil fields, previously capitalised exploration and development costs, along with any future expenditure necessary to develop the assumed reserves, are amortised over the remaining estimated economic life of the fields. Producing assets under evaluation and appraisal are not subject to amortisation until such time as the evaluation and appraisal stage is complete.
Costs in relation to the Hides gas to electricity project are amortised in order to expense accumulated exploration and development costs over the gas sales contract term with the Porgera Joint Venture for supply of gas to the Porgera Gold Mine.
Restoration costs Site restoration costs are capitalised within the cost of the associated assets and the provision is stated in the balance sheet at total estimated present value. These costs are estimated and based on judgements and assumptions regarding removal dates, technologies, and industry practice. Over time, the liability is increased for the change in the present value based on a risk adjusted pre-tax discount rate appropriate to the risks inherent in the liability. The costs of restoration are brought to account in the profit and loss through depreciation of the associated assets over the economic life of the projects with which these costs are associated. The unwinding of the discount is recorded as an accretion charge within finance costs.
(L) OTHER PROPERTY, PLANT AND EqUIPMENTPlant and equipment are carried at cost less accumulated depreciation and impairment. Any gain or loss on the disposal of assets is determined as the difference between the carrying value of the asset at the time of disposal and the proceeds from disposal, and is included in the results of the economic entity in the year of disposal.
Depreciation Depreciation on corporate plant and equipment is calculated on a straight-line basis so as to generally write off the cost of each fixed asset over its estimated useful life on the following basis:
> Motor vehicles 20.0% > Office furniture 13.0% > Office equipment 20.0% > Buildings 3.0% > Computer equipment 33.3% > Rigs Drilling days based on a 5 year drilling life
Depreciation is applied to joint venture plant and equipment so as to expense the cost over the estimated economic life of the reserves with which it is associated.
100

notes to tHe financial statementsfoR tHe financial YeaR enDeD 31 DecemBeR 2011
(M) IMPAIRMENT OF ASSETSThe carrying amounts of all assets, other than inventory, certain financial assets and deferred tax assets, are reviewed at each balance sheet date to determine whether there is an indication of impairment. Where such an indication exists, an estimate of the recoverable amount is made. For any asset that does not generate largely independent cash flows, the recoverable amount is determined for the cash generating unit (CGU) to which the asset belongs. Expected future cash flows are the basis for impairment assessment, however, market values are also referenced where appropriate.
An impairment loss is recognised in the profit and loss statement when the carrying amount of an asset or its CGU exceeds its recoverable amount. Where an impairment loss subsequently reverses, the carrying amount of the asset (or CGU) is increased to the revised estimate of its recoverable amount, but only to the extent that the asset’s carrying amount does not exceed the carrying amount that would have been determined, net of depreciation or amortisation, if no impairment loss had been recognised.
Financial assets, other than those at fair value through profit or loss, are assessed for indicators of impairment at each balance sheet date. Financial assets are impaired where there is objective evidence that as a result of one or more events that occurred after the initial recognition of the financial asset the estimated future cash flows of the investment have been impacted.
(N) JOINTLY CONTROLLED OPERATIONSExploration, development and production activities of the economic entity are carried on through joint ventures with other parties and the economic entity’s interest in each joint venture is brought to account by including in the respective classifications, where material, the share of individual assets and liabilities.
The Group’s investment in Papua New Guinea Liquefied Natural Gas Global Company LDC is treated as a joint venture established for financing purposes and is equity accounted (refer to note 19 for further details).
(O) EMPLOYEE BENEFITSProvision is made for long service leave and annual leave estimated to be payable to employees on the basis of statutory and contractual requirements. Vested benefits are classified as current liabilities.
The contributions made to defined contribution superannuation funds by entities within the economic entity are charged against profits when due. In Australia, contributions of up to 9% of employees’ salaries and wages are legally required to be made.
(P) FINANCIAL INSTRUMENTSTrade receivables Trade receivables are stated at amortised cost as reduced by appropriate allowances for estimated irrecoverable amounts.
Trade payables Trade payables and other accounts payable are recognised when the economic entity becomes obliged to make future payments resulting from the purchase of goods and services. Trade payables are stated at amortised cost.
Loans and borrowings Interest-bearing loans are initially recorded at fair value net of transaction costs. Finance charges are accounted for on an accrual basis at the effective interest rate.
Cash and cash equivalents For the purposes of the cash flow statement, cash and cash equivalents includes cash at bank and on hand and short-term interest-bearing investments readily convertible into cash which are subject to an insignificant risk of charges in value, net of outstanding bank overdrafts.
Investments Investments are initially measured at fair value. Investments classified as available-for-sale are measured at subsequent reporting dates at fair value. Gains and losses arising from changes in fair value are recognised directly in equity, until the security is disposed of or is determined to be impaired, at which time the cumulative gain or loss previously recognised in equity is included in the profit or loss for the period.
101

notes to tHe financial statementsfoR tHe financial YeaR enDeD 31 DecemBeR 2011
1 summaRY of significant accounting policies ContInuEd
Hedging contracts Hedging contracts are periodically entered into to limit the financial exposure of the economic entity in relation to oil price, interest rate and foreign exchange movements. Such derivatives are initially recorded at fair value and remeasured to fair value at subsequent reporting dates.
Changes in the fair value of derivative financial instruments that are designated and effective as hedges of future cash flows relating to foreign currency risk of firm commitments and highly probable forecast transactions are recognised directly in equity. Hedge accounting is discontinued when the hedging instrument expires or is sold, terminated, or exercised, or no longer qualifies for hedge accounting. At that time, any cumulative gain or loss on the hedging instrument recognised in equity is retained in equity until the forecast transaction occurs. If a hedged transaction is no longer expected to occur, the net cumulative gain or loss recognized in equity is transferred to the profit or loss for the period.
(q) CRITICAL ACCOUNTING ESTIMATES AND ASSUMPTIONSIn applying the Group’s accounting policies, management continually evaluates judgements, estimates and assumptions based on experience and other factors, including expectations of future events that may have an impact on the Group. All judgements, estimates and assumptions made are believed to be reasonable based on the most current set of circumstances available to management. Actual results may differ from those judgements, estimates and assumptions. Significant judgements, estimates and assumptions made by management in the preparation of these financial statements are outlined below.
Impairment of assets The Group assesses whether oil and gas assets are impaired on a semi-annual basis. This requires an estimation of the recoverable amount of the cash-generating unit to which the assets belong. For oil and gas properties, expected future cash flow estimation is based on reserves, future production profiles, commodity prices and costs. Market values are also referenced where appropriate. The carrying value of oil and gas properties, exploration and evaluation and other plant and equipment are discussed in notes 12 to 14.
Restoration obligations The Group estimates the future removal and restoration costs of oil and gas production facilities, wells, pipelines and related assets at the time of installation of the assets. In most instances the removal of these assets will occur many years in the future. The estimate of future removal costs are made considering relevant legislation and industry practice and require management to make judgments regarding the removal date, the extent of restoration activities required and future removal technologies. For more detail regarding the policy in respect of provision for restoration refer to note 1(k). The carrying amount of the provision for restoration is disclosed in note 18.
Reserve estimates The estimated reserves are management assessments and take into consideration reviews by an independent third party, Netherland Sewell and Associates under the reserve audit programme requiring an external audit of each material producing field every three years, as well as other assumptions, interpretations and assessments. These include assumptions regarding commodity prices, exchange rates, discount rates, future production and transportation costs, and interpretations of geological and geophysical models to make assessments of the quality of reservoirs and their anticipated recoveries.
Changes in reported reserves can impact asset carrying values, the provision for restoration and the recognition of deferred tax assets, due to changes in expected future cash flows. Reserves are integral to the amount of depreciation, depletion and amortisation charged to the income statement and the calculation of inventory. Reserves estimation conforms with guidelines prepared by the Society of Petroleum Engineers.
Exploration and evaluation The Group’s policy for exploration and evaluation expenditure is discussed in note 1(j). The application of this policy requires management to make certain estimates and assumptions as to future events and circumstances, particularly in relation to the assessment of whether economic quantities of reserves have been found. Any such estimates and assumptions may change as new information becomes available. If, after having capitalised exploration and evaluation expenditure, management concludes that the capitalised expenditure is unlikely to be recovered by future exploitation or sale, then the relevant capitalised amount will be written off to the profit and loss statement.
The carrying amount of exploration and evaluation assets is disclosed in note 12.
(R) ROUNDINGThe majority of amounts included in this report are rounded to the nearest US$1,000.
102

notes to tHe financial statementsfoR tHe financial YeaR enDeD 31 DecemBeR 2011
2 Revenue fRom opeRations
CONSOLIDATED PARENT
2011US$’000
2010US$’000
2011US$’000
2010US$’000
Oil sales (gross) 654,266 517,345 – –
Gas and refined product sales 49,017 39,704 – –
Other field revenue 29,586 26,511 – –
Total revenue 732,869 583,560 – –
3 otHeR expenses
CONSOLIDATED PARENT
2011US$’000
2010US$’000
2011US$’000
2010US$’000
Salaries and short term employee benefits (49,307) (44,642) – –
Post-employment benefits (2,366) (2,156) – –
Employee share-based remuneration (12,057) (14,932) – –
Premises and equipment – operating leases (4,749) (4,216) – –
Other expenses (27,920) (19,970) (4,419) (3,404)
Corporate cost recoveries 74,524 69,281 – –
Net corporate expenses (21,875) (16,635) (4,419) (3,404)
Depreciation (4,158) (5,220) – (47)
Foreign currency (losses)/gains (1,173) 2,077 1,742 (16)
Total other expenses (27,206) (19,778) (2,677) (3,467)
4 significant items
CONSOLIDATED PARENT
2011US$’000
2010US$’000
2011US$’000
2010US$’000
Restatement of deferred tax, following LNG
Project development approval – 49,574 – –
Impairment expense(1) (33,227) (15,808) – –
Applicable income tax benefit – 7,722 – –
Net impairment losses (33,227) (8,086) – –
Total significant items (33,227) 41,488 – –
(1) The impairment expense of US$33.2 million relates to the Shakal asset in Iraq and the expiration of the licence subsequent to year end.
103

notes to tHe financial statementsfoR tHe financial YeaR enDeD 31 DecemBeR 2011
5 net financing costs
CONSOLIDATED PARENT
2011US$’000
2010US$’000
2011US$’000
2010US$’000
Interest received or receivable from others 6,953 6,856 5,056 4,950
Interest paid or payable to subsidiaries – – (1,653) (1,177)
Finance costs (3,368) (3,945) – –
(3,368) (3,945) (1,653) (1,177)
Unwinding of discount on site restoration (4,243) (3,737) – –
Total borrowing costs expensed (7,611) (7,682) (1,653) (1,177)
Net finance (costs)/income (658) (826) 3,403 3,773
6 income tax
CONSOLIDATED PARENT
2011US$’000
2010US$’000
2011US$’000
2010US$’000
The major components of tax expense are:
Current tax expense 219,713 161,552 – –
Adjustments for current tax of prior periods (3,971) (7,198) 3,869 (558)
Deferred tax expense/(income) 21,676 (62,782) 397 (1,394)
Income tax expense/(benefit) 237,418 91,572 4,266 (1,952)
Reconciliation between tax expense and the pre-tax profit multiplied by the applicable tax rate is set out below:
Pre-tax profit/(loss) 439,901 277,174 (4,102) (11,728)
Tax at PNG rate for petroleum (50%) 219,951 138,587 (2,051) (5,864)
Restatement of deferred tax for gas and non-oil (30%) (132) (49,574) – –
Effect of differing tax rates across tax regimes (3,530) (2,420) 2,445 2,346
216,289 86,593 394 (3,518)
Tax effect of items not tax deductible or assessable:
(Over)/under provisions in prior periods (3,971) (7,198) 3,869 (558)
Non-deductible expenditure 25,100 10,494 3 2,124
Non-assessable income – (890) – –
Other – 2,573 – –
Income tax expense/(benefit) 237,418 91,572 4,266 (1,952)
The amount of the deferred tax (income)/expense recognised in the net profit in respect of each type of temporary difference:
Exploration and development 41,108 (84,644) (974) (176)
Other assets 504 (506) (3) (14)
Provisions (25,201) 18,412 (28) 250
Other items (981) (306) 1,625 (135)
Tax losses 6,246 4,262 (223) (1,319)
21,676 (62,782) 397 (1,394)
104
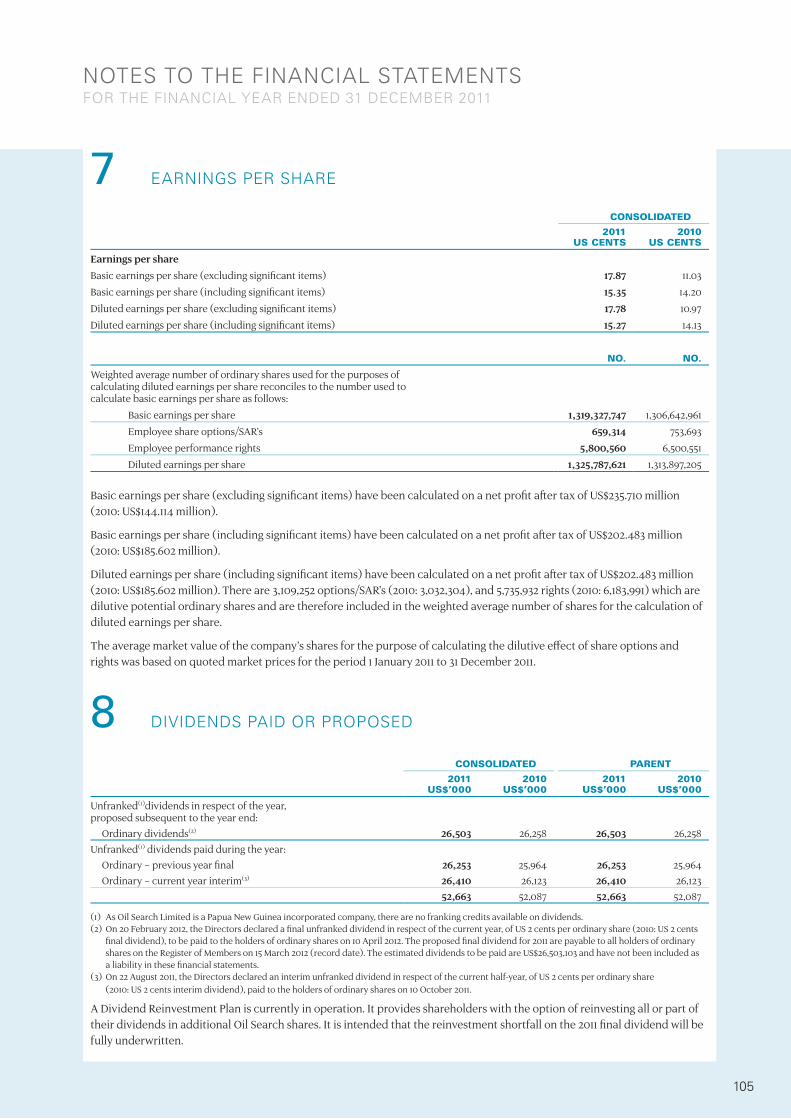
notes to tHe financial statementsfoR tHe financial YeaR enDeD 31 DecemBeR 2011
7 eaRnings peR sHaRe
CONSOLIDATED
2011US CENTS
2010US CENTS
Earnings per shareBasic earnings per share (excluding significant items) 17.87 11.03
Basic earnings per share (including significant items) 15.35 14.20
Diluted earnings per share (excluding significant items) 17.78 10.97
Diluted earnings per share (including significant items) 15.27 14.13
NO. NO.
Weighted average number of ordinary shares used for the purposes of calculating diluted earnings per share reconciles to the number used to calculate basic earnings per share as follows:
Basic earnings per share 1,319,327,747 1,306,642,961
Employee share options/SAR’s 659,314 753,693
Employee performance rights 5,800,560 6,500,551
Diluted earnings per share 1,325,787,621 1,313,897,205
Basic earnings per share (excluding significant items) have been calculated on a net profit after tax of US$235.710 million (2010: US$144.114 million).
Basic earnings per share (including significant items) have been calculated on a net profit after tax of US$202.483 million (2010: US$185.602 million).
Diluted earnings per share (including significant items) have been calculated on a net profit after tax of US$202.483 million (2010: US$185.602 million). There are 3,109,252 options/SAR’s (2010: 3,032,304), and 5,735,932 rights (2010: 6,183,991) which are dilutive potential ordinary shares and are therefore included in the weighted average number of shares for the calculation of diluted earnings per share.
The average market value of the company’s shares for the purpose of calculating the dilutive effect of share options and rights was based on quoted market prices for the period 1 January 2011 to 31 December 2011.
8 DiviDenDs paiD oR pRoposeD
CONSOLIDATED PARENT
2011US$’000
2010US$’000
2011US$’000
2010US$’000
Unfranked(1)dividends in respect of the year, proposed subsequent to the year end: Ordinary dividends(2) 26,503 26,258 26,503 26,258 Unfranked(1) dividends paid during the year: Ordinary – previous year final 26,253 25,964 26,253 25,964 Ordinary – current year interim(3) 26,410 26,123 26,410 26,123
52,663 52,087 52,663 52,087
(1) As Oil Search Limited is a Papua New Guinea incorporated company, there are no franking credits available on dividends.(2) On 20 February 2012, the Directors declared a final unfranked dividend in respect of the current year, of US 2 cents per ordinary share (2010: US 2 cents
final dividend), to be paid to the holders of ordinary shares on 10 April 2012. The proposed final dividend for 2011 are payable to all holders of ordinary shares on the Register of Members on 15 March 2012 (record date). The estimated dividends to be paid are US$26,503,103 and have not been included as a liability in these financial statements.
(3) On 22 August 2011, the Directors declared an interim unfranked dividend in respect of the current half-year, of US 2 cents per ordinary share (2010: US 2 cents interim dividend), paid to the holders of ordinary shares on 10 October 2011.
A Dividend Reinvestment Plan is currently in operation. It provides shareholders with the option of reinvesting all or part of their dividends in additional Oil Search shares. It is intended that the reinvestment shortfall on the 2011 final dividend will be fully underwritten.
105

notes to tHe financial statementsfoR tHe financial YeaR enDeD 31 DecemBeR 2011
9 ReceivaBles
CONSOLIDATED PARENT
2011US$’000
2010US$’000
2011US$’000
2010US$’000
Current
Trade debtors(1) 49,336 40,859 – –
Other debtors(1) 52,917 47,053 6,683 1,388
Amounts due from subsidiary entities – – 416,781 209,604
102,253 87,912 423,464 210,992
Non-current
Amounts due by:
other entities 3,966 3,326 – –
3,966 3,326 – –
(1) During the year no receivables have been determined to be impaired and no related impairment loss has been charged to the profit and loss statement.
10 inventoRies
CONSOLIDATED PARENT
2011US$’000
2010US$’000
2011US$’000
2010US$’000
Current
At cost
Materials and supplies 55,294 52,107 – –
Petroleum products 4,568 8,083 – –
59,862 60,190 – –
11 otHeR assets
CONSOLIDATED PARENT
2011US$’000
2010US$’000
2011US$’000
2010US$’000
Current
Prepayments 85,600 85,771 359 136
Non current
Prepayments 329 916 – –
106

notes to tHe financial statementsfoR tHe financial YeaR enDeD 31 DecemBeR 2011
12 exploRation anD evaluation assets (non-cuRRent)
CONSOLIDATED PARENT
2011US$’000
2010US$’000
2011US$’000
2010US$’000
At cost 401,237 312,239 30,069 27,510 Less impairment (63,626) (30,399) – –
337,611 281,840 30,069 27,510 Balance at start of year 281,840 808,318 27,510 63,202 Transfer to another subsidiary – – – (44,080)Transferred to assets in development – (559,377) – –Transferred to producing assets – (70) – –Additions 144,606 175,980 5,470 18,919 Exploration costs expensed during the year (60,633) (128,106) (2,911) (10,531)Impairment losses(1) (33,227) (14,899) – –Changes in restoration obligations 4,952 – – –Net exchange differences 73 (6) – –Balance at end of year 337,611 281,840 30,069 27,510
(1) The impairment expense of US$33.2 million relates to the Shakal asset in Iraq and the expiration of the licence subsequent to year end.
13 oil anD gas assets (non-cuRRent)
CONSOLIDATED PARENT
2011US$’000
2010US$’000
2011US$’000
2010US$’000
Assets in developmentAt cost 3,467,975 2,063,629 – –Accumulated amortisation – – – –
3,467,975 2,063,629 – –Balance at start of year 2,063,629 – – –Transferred from exploration and evaluation assets – 559,377 – –Transferred from producing assets 98,509 367,060 – –Additions 1,176,824 944,683 – –Borrowing costs capitalised (LNG project) 109,718 194,375 – –Development costs expensed during the period – (1,866) – –Changes in restoration obligations 19,295 – – –Balance at end of year 3,467,975 2,063,629 – –Producing assets At cost 1,468,712 1,366,642 – 2 Accumulated amortisation and impairment (1,158,526) (1,119,077) – –
310,186 247,565 – 2 Balance at start of year 247,565 638,026 2 –Transferred from exploration – 70 – –Transferred to development (98,509) (367,060) – –Additions 129,396 41,850 2 Producing costs expensed during the period – (1,216) – –Disposals – (1,885) (2) –Changes in restoration obligations 71,183 (23,820) – –Amortisation of site restoration (1,284) (7,200) – –Amortisation (38,165) (31,200) – –Balance at end of year 310,186 247,565 – 2
Total oil and gas assets 3,778,161 2,311,194 – 2
107
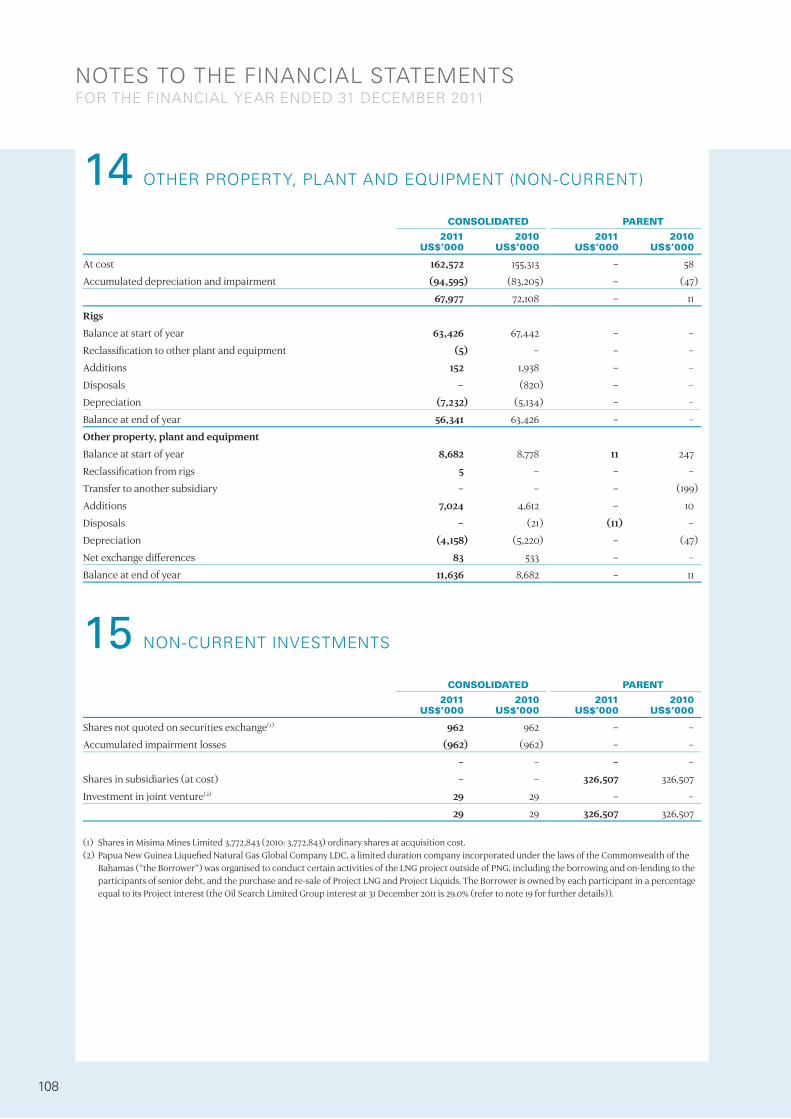
notes to tHe financial statementsfoR tHe financial YeaR enDeD 31 DecemBeR 2011
14 otHeR pRopeRtY, plant anD equipment (non-cuRRent)
CONSOLIDATED PARENT
2011US$’000
2010US$’000
2011US$’000
2010US$’000
At cost 162,572 155,313 – 58
Accumulated depreciation and impairment (94,595) (83,205) – (47)
67,977 72,108 – 11
Rigs
Balance at start of year 63,426 67,442 – –
Reclassification to other plant and equipment (5) – – –
Additions 152 1,938 – –
Disposals – (820) – –
Depreciation (7,232) (5,134) – –
Balance at end of year 56,341 63,426 – –
Other property, plant and equipment
Balance at start of year 8,682 8,778 11 247
Reclassification from rigs 5 – – –
Transfer to another subsidiary – – – (199)
Additions 7,024 4,612 – 10
Disposals – (21) (11) –
Depreciation (4,158) (5,220) – (47)
Net exchange differences 83 533 – –
Balance at end of year 11,636 8,682 – 11
15 non-cuRRent investments
CONSOLIDATED PARENT
2011US$’000
2010US$’000
2011US$’000
2010US$’000
Shares not quoted on securities exchange(1) 962 962 – –
Accumulated impairment losses (962) (962) – –
– – – –
Shares in subsidiaries (at cost) – – 326,507 326,507
Investment in joint venture(2) 29 29 – –
29 29 326,507 326,507
(1) Shares in Misima Mines Limited 3,772,843 (2010: 3,772,843) ordinary shares at acquisition cost.(2) Papua New Guinea Liquefied Natural Gas Global Company LDC, a limited duration company incorporated under the laws of the Commonwealth of the
Bahamas (“the Borrower”) was organised to conduct certain activities of the LNG project outside of PNG, including the borrowing and on-lending to the participants of senior debt, and the purchase and re-sale of Project LNG and Project Liquids. The Borrower is owned by each participant in a percentage equal to its Project interest (the Oil Search Limited Group interest at 31 December 2011 is 29.0% (refer to note 19 for further details)).
108
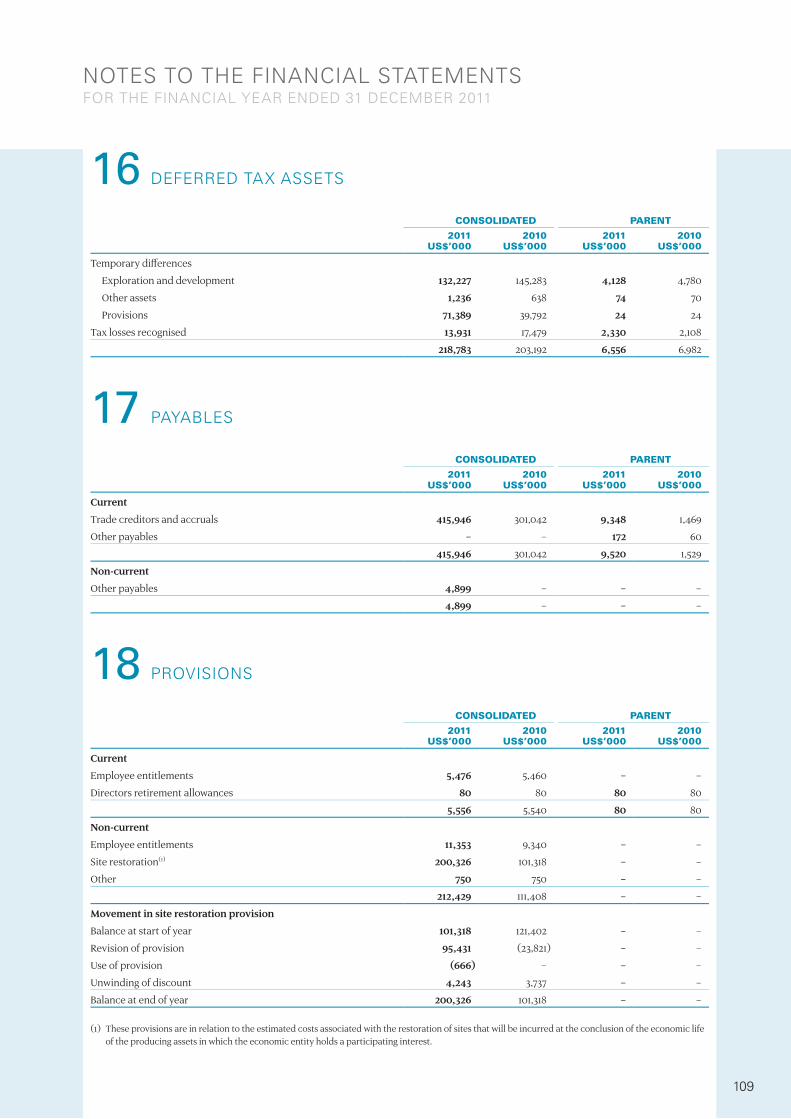
notes to tHe financial statementsfoR tHe financial YeaR enDeD 31 DecemBeR 2011
16 DefeRReD tax assets
CONSOLIDATED PARENT
2011US$’000
2010US$’000
2011US$’000
2010US$’000
Temporary differences
Exploration and development 132,227 145,283 4,128 4,780
Other assets 1,236 638 74 70
Provisions 71,389 39,792 24 24
Tax losses recognised 13,931 17,479 2,330 2,108
218,783 203,192 6,556 6,982
17 paYaBles
CONSOLIDATED PARENT
2011US$’000
2010US$’000
2011US$’000
2010US$’000
Current
Trade creditors and accruals 415,946 301,042 9,348 1,469
Other payables – – 172 60
415,946 301,042 9,520 1,529
Non-current
Other payables 4,899 – – –
4,899 – – –
18 pRovisions
CONSOLIDATED PARENT
2011US$’000
2010US$’000
2011US$’000
2010US$’000
Current
Employee entitlements 5,476 5,460 – –
Directors retirement allowances 80 80 80 80
5,556 5,540 80 80
Non-current
Employee entitlements 11,353 9,340 – –
Site restoration(1) 200,326 101,318 – –
Other 750 750 – –
212,429 111,408 – –
Movement in site restoration provision
Balance at start of year 101,318 121,402 – –
Revision of provision 95,431 (23,821) – –
Use of provision (666) – – –
Unwinding of discount 4,243 3,737 – –
Balance at end of year 200,326 101,318 – –
(1) These provisions are in relation to the estimated costs associated with the restoration of sites that will be incurred at the conclusion of the economic life of the producing assets in which the economic entity holds a participating interest.
109

notes to tHe financial statementsfoR tHe financial YeaR enDeD 31 DecemBeR 2011
19 loans anD BoRRowings
CONSOLIDATED PARENT
2011US$’000
2010US$’000
2011US$’000
2010US$’000
Non-current
Secured loan from joint venture(1) 1,747,567 929,720 – –
(1) Papua New Guinea Liquefied Natural Gas Global Company LDC, a limited duration company incorporated under the laws of the Commonwealth of the Bahamas (the “Borrower”) was organised to conduct certain activities of the LNG Project outside of PNG, including the borrowing and on-lending to the participants of senior debt, and the purchase and re-sale of LNG project liquids and LNG. The Borrower is owned by each participant in a percentage equal to its project interest (the Oil Search Limited Group interest at 31 December 2011 is 29.0%).
The terms of the borrowings are reflected in the on-loan agreements between the Borrower and the Oil Search participants in the LNG Project, being Oil Search (Tumbudu) Limited and Oil Search (LNG) Limited (the “OSL Participants”).
After its initial limited term of 30 years, shareholders may pass a resolution to alter the constitution to provide for duration in excess of 30 years.
Terms and debt repayment schedule The PNG LNG Project (“LNG Project”) achieved financial investment decision on 8 December 2009 and financial close on 12 March 2010. The maximum committed debt facility available to the LNG Project at the date of signing was US$14.0 billion under nine loan facility agreements.
As at 31 December 2011, the weighted average rate of the drawn loan was 3.28% (2010: 3.32%), consisting of both fixed or floating rate portions. The source of funding was from:
> Export Credit Agencies (ECA). > ExxonMobil Finance Company Limited. > Australian and international commercial banks.
The loan facility is made up of the following:
> Direct loan facilities – direct loans from each respective ECA. > Covered loan facilities – facilities comprising loans from several commercial bank lenders that benefit from a guarantee by
the relevant ECA. > Uncovered bank loan facility – a syndicated loan facility comprising several commercial bank lenders which is not
guaranteed by or affiliated with any ECA. > Funding from ExxonMobil Finance Company Limited spread pro rata across all other borrowings and assumes the same
pricing as other lenders.
Each ECA facility is either tied (to the source of the purchase of goods and services by the LNG Project) or untied (not tied to any particular developments or procurement of goods).
Each participant to the LNG Project severally provides participant equity funding pro rata with each disbursement of ECA/bank loans so that participant equity funding is provided for at least 30% of project capital costs at such time.
At financial close, Oil Search established an escrow account, secured to the lenders, whereby 60% of future base equity commitments were deposited. Oil Search will maintain the escrow account balance at 60% of future equity costs, or 6 months’ interest, whichever is greater.
Drawdowns under the ECA/bank loans may be made once a month and will end on the completion date of the LNG Project or June 2016, whichever is earlier. Interest and finance fees are capitalised during this period.
Interest and principal on the ECA/bank loans are payable on specified semi-annual dates, and will commence, in the case of interest, on the first payment date falling at least six months after financial close, and in the case of principal, on the earlier of six months after the completion date or June, 2016.
Post completion, principal is repayable over 11.5 years based on a customised repayment profile.
Following completion, the LNG sales proceeds are receipted into a sales escrow account from which a portion of agreed expenditure obligations are firstly made, and subject to meeting certain debt service cover ratio tests, are distributed to the project participants.
110

notes to tHe financial statementsfoR tHe financial YeaR enDeD 31 DecemBeR 2011
The Borrower grants to the security trustee:
> a first-ranking security interest in all of the Borrower’s assets (Oil Search’s share US$1,447.4 million at 31 December 2011 (2010: US$738.2 million)), with a few limited exceptions;
> a fixed and floating charge in existing and future funds in the offshore accounts; > a deed of charge (and assignment) in the sales contracts, LNG charter party agreements, rights under insurance policies,
LNG supply and sales commitment agreements, on-loan agreements and the sales, shipping and finance administration agreements, collectively known as “Borrower Material Agreements”; and
> a mortgage of contractual rights over Borrower Material Agreements.
The loan facility is subject to various covenants and a negative pledge restricting future secured borrowings, subject to a number of permitted lien exceptions. Neither the covenants nor the negative pledge have been breached at any time during the reporting period.
Oil Search Limited, as completion guarantor, has guaranteed payment by the Borrower of the OSL Participants share (29.0%) of the senior debt obligations up until practical completion is achieved. Oil Search Limited, as completion guarantor, is subject to certain covenants and undertakings. Neither the covenants nor the undertakings have been breached at any time during the reporting period or have unduly restricted Oil Search’s planned activities.
Oil Search has also granted security over:
> the shares in each of the project participants; and > the participants project interests and gas field licences.
20 DefeRReD tax liaBilities
CONSOLIDATED PARENT
2011US$’000
2010US$’000
2011US$’000
2010US$’000
Temporary differences
Exploration and development 181,480 145,226 – –
Prepayments and receivables 794 1,157 359 388
Other assets 9,223 7,847 – –
191,497 154,230 359 388
111

notes to tHe financial statementsfoR tHe financial YeaR enDeD 31 DecemBeR 2011
21 sHaRe capital anD ReseRves
CONSOLIDATED PARENT
2011US$’000
2010US$’000
2011US$’000
2010US$’000
Issued 1,325,155,171 (2010: 1,312,888,303)
Ordinary shares, fully paid (no par value) 1,683,492 1,610,667 1,683,492 1,610,667
2011 SHARES
2010 SHARES
2011US$’000
2010US$’000
Movements in issued and fully paid shares
Balance at the beginning of the period 1,312,888,303 1,299,562,220 1,610,667 1,550,213
Transfer of vested shares from employee equity compensation reserve – – 13,070 13,421
Release of treasury shares on vesting – – (1,039) (11,491)
Ordinary shares issued on exercise of options and rights, and grant of restricted shares 3,975,651 3,900,448 8,117 6,365
DRP underwriting agreement(1)
Ordinary shares issued at US$5.44 (2009 final dividend) – 3,125,015 – 17,001
Ordinary shares issued at US$5.72 (2010 interim dividend) – 2,956,028 – 16,920
Ordinary shares issued at US$6.98 (2010 final dividend) 2,715,366 – 18,965 –
Ordinary shares issued at US$5.91 (2011 interim dividend) 3,017,882 – 17,821 –
DRP(2)
Ordinary shares issued at US$5.33 (2009 final dividend) – 1,691,539 – 9,016
Ordinary shares issued at US$5.61 (2010 interim dividend) – 1,653,053 – 9,274
Ordinary shares issued at US$6.85 (2010 final dividend) 1,069,058 – 7,319 –
Ordinary shares issued at US$5.79 (2011 interim dividend) 1,488,911 – 8,621 –
Share issue costs – – (49) (52)
1,325,155,171 1,312,888,303 1,683,492 1,610,667
(1) A fully underwritten DRP has been utilised for all dividends paid during the period covered by the Financial Statements.(2) The price for shares issued under the DRP was calculated in accordance with the DRP Rules and is the arithmetic average of the daily volume weighted
average sales price of all Oil Search shares sold on the Australian Securities Exchange (excluding off-market trades) during the trading days immediately after the Record Date for the dividend less a discount of 2.00%.
Employee Share Option Plan, Share Appreciation Rights Plan, Performance Rights Plan, and Restricted Share Plan At balance date, there are 1,659,552 options (2010: 3,032,304), 2,918,020 share appreciation rights (2010: 1,542,800), 5,735,932 performance rights (2010: 6,183,991), and 1,657,365 restricted shares (2010: 1,915,386) granted over ordinary shares exercisable at various dates in the future, subject to meeting applicable performance hurdles, and at varying exercise prices (refer to note 25 for further details).
During the year, a total of 1,264,452 share options (2010: 1,313,171) and 1,750,411 performance rights (2010: 1,926,853) were exercised and 108,300 options (2010: 135,850), 123,340 share appreciation rights (2010: 11,400) and 394,148 performance rights (2010: 398,054) were forfeited. Restricted shares totalling 619,693 were exercised (2010: 1,707,447) and 103,318 (2010: 72,256) restricted shares were forfeited during the year.
During the year 1,498,560 share appreciation rights (2010: 1,554,200) were granted under the Employee Share Appreciation Rights Plan. There were 1,696,500 performance rights (2010: 1,997,400) granted under the Performance Rights Plan, and 443,289 restricted shares (2010: 751,857) granted under the Restricted Share Plan during the year.
112

notes to tHe financial statementsfoR tHe financial YeaR enDeD 31 DecemBeR 2011
21 sHaRe capital anD ReseRves ContInuEd
(A) rESErvES At tHE End oF tHE FInAnCIAl yEArCONSOLIDATED PARENT
2011US$’000
2010US$’000
2011US$’000
2010US$’000
Foreign currency translation reserve 426 1,942 – –
Amalgamation reserve – – (2,990) (2,990)
Reserve for treasury shares (5,601) (6,378) – –
Employee equity compensation reserve 18,131 21,254 9,488 12,872
Balance at end of year 12,956 16,818 6,498 9,882
(B) MovEMEntS In rESErvESCONSOLIDATED PARENT
2011US$’000
2010US$’000
2011US$’000
2010US$’000
Foreign currency translation reserve
Balance at start of year 1,942 2,737 – –
Translation of financial statements of foreign subsidiaries (1,516) (795) – –
Balance at end of year 426 1,942 – –
The foreign currency translation reserve is used to record foreign exchange differences arising from the translation of the financial statements of foreign subsidiaries.
Amalgamation reserve
Balance at start of year – – (2,990) (2,990)
Balance at end of year – – (2,990) (2,990)
The amalgamation reserve was used to record the retained earnings of entities amalgamated into the parent entity in 2006.
Reserve for treasury shares
Balance at start of year (6,378) (16,821) – –
Purchase of shares during financial year – (59) – –
Issue of shares during financial year (1,789) (2,316) – –
Release of treasury shares on vesting 2,566 11,491 – –
Transfer of exchange differences to FCTR – 1,327
Balance at end of year (5,601) (6,378) – –
The reserve for treasury shares is used to record the cost of purchasing Oil Search Limited shares by the Restricted Share Plan Trust.
Employee equity compensation reserve
Balance at start of year 21,254 19,531 12,872 13,465
Expense recognised in subsidiaries during financial year 12,057 14,932 12,057 14,932
Transfer of vested shares to share capital (13,070) (13,421) (13,070) (13,421)
Issue of treasury shares – – (1,789) (2,316)
Release of treasury shares on vesting (1,527) – – –
Net exchange differences (583) 212 (582) 212
Balance at end of year 18,131 21,254 9,488 12,872
The employee equity compensation reserve is used to record the share based remuneration obligations to employees in relation to Oil Search Limited ordinary shares as held by the Employee Options and Rights Share Plans and Share Appreciation Rights Share Plans, which have not vested as at the end of the year.
113
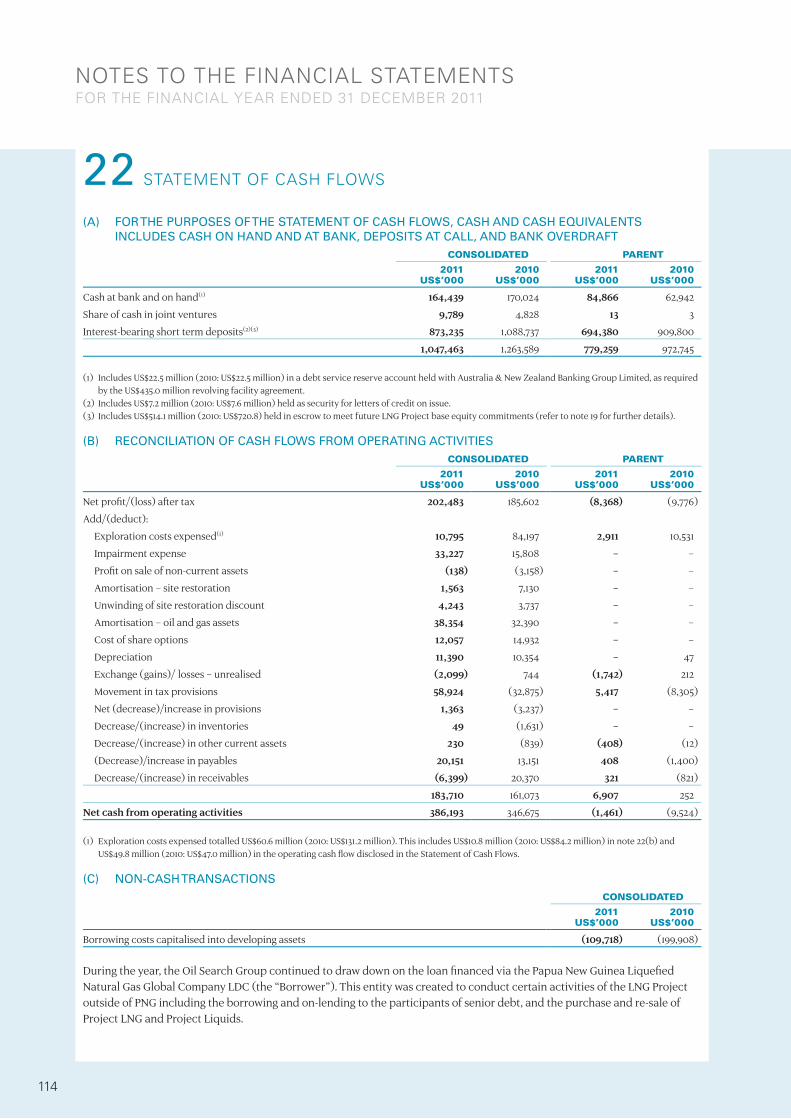
notes to tHe financial statementsfoR tHe financial YeaR enDeD 31 DecemBeR 2011
22 statement of casH flows
(A) For tHE PurPoSES oF tHE StAtEMEnt oF CASH FlowS, CASH And CASH EquIvAlEntS InCludES CASH on HAnd And At BAnK, dEPoSItS At CAll, And BAnK ovErdrAFt
CONSOLIDATED PARENT
2011US$’000
2010US$’000
2011US$’000
2010US$’000
Cash at bank and on hand(1) 164,439 170,024 84,866 62,942
Share of cash in joint ventures 9,789 4,828 13 3
Interest-bearing short term deposits(2)(3) 873,235 1,088,737 694,380 909,800
1,047,463 1,263,589 779,259 972,745
(1) Includes US$22.5 million (2010: US$22.5 million) in a debt service reserve account held with Australia & New Zealand Banking Group Limited, as required by the US$435.0 million revolving facility agreement.
(2) Includes US$7.2 million (2010: US$7.6 million) held as security for letters of credit on issue.(3) Includes US$514.1 million (2010: US$720.8) held in escrow to meet future LNG Project base equity commitments (refer to note 19 for further details).
(B) rEConCIlIAtIon oF CASH FlowS FroM oPErAtIng ACtIvItIESCONSOLIDATED PARENT
2011US$’000
2010US$’000
2011US$’000
2010US$’000
Net profit/(loss) after tax 202,483 185,602 (8,368) (9,776)
Add/(deduct):
Exploration costs expensed(1) 10,795 84,197 2,911 10,531
Impairment expense 33,227 15,808 – –
Profit on sale of non-current assets (138) (3,158) – –
Amortisation – site restoration 1,563 7,130 – –
Unwinding of site restoration discount 4,243 3,737 – –
Amortisation – oil and gas assets 38,354 32,390 – –
Cost of share options 12,057 14,932 – –
Depreciation 11,390 10,354 – 47
Exchange (gains)/ losses – unrealised (2,099) 744 (1,742) 212
Movement in tax provisions 58,924 (32,875) 5,417 (8,305)
Net (decrease)/increase in provisions 1,363 (3,237) – –
Decrease/(increase) in inventories 49 (1,631) – –
Decrease/(increase) in other current assets 230 (839) (408) (12)
(Decrease)/increase in payables 20,151 13,151 408 (1,400)
Decrease/(increase) in receivables (6,399) 20,370 321 (821)
183,710 161,073 6,907 252
Net cash from operating activities 386,193 346,675 (1,461) (9,524)
(1) Exploration costs expensed totalled US$60.6 million (2010: US$131.2 million). This includes US$10.8 million (2010: US$84.2 million) in note 22(b) and US$49.8 million (2010: US$47.0 million) in the operating cash flow disclosed in the Statement of Cash Flows.
(C) non-CASH trAnSACtIonSCONSOLIDATED
2011US$’000
2010US$’000
Borrowing costs capitalised into developing assets (109,718) (199,908)
During the year, the Oil Search Group continued to draw down on the loan financed via the Papua New Guinea Liquefied Natural Gas Global Company LDC (the “Borrower”). This entity was created to conduct certain activities of the LNG Project outside of PNG including the borrowing and on-lending to the participants of senior debt, and the purchase and re-sale of Project LNG and Project Liquids.
114

notes to tHe financial statementsfoR tHe financial YeaR enDeD 31 DecemBeR 2011
The movement in capitalised interest, is not a cash movement by the Oil Search Group. This cost, in accordance with the loan agreements is accrued into the loan balance prior to the completion of the construction phase of the PNG LNG Project.
This movement is therefore not included in the net cash flow used in investing activities in the Oil Search consolidated cash flow statement.
23 inteRests in jointlY contRolleD opeRations
(A) nEt ASSEtS EMPloyEd In JoInt vEnturESCONSOLIDATED PARENT
2011 2010 2011 2010
NOTE US$’000 US$’000 US$’000 US$’000
Current assetsCash 22(a) 9,789 4,828 13 3
Receivables 88,870 25,996 185 –
Inventories 50,764 47,625 – –
Non-current assetsExploration and evaluation assets 337,611 281,840 30,069 27,510
Oil and gas assets 3,778,161 2,311,194 – 2
Current liabilities (338,134) (200,787) (1,136) (66)
3,927,061 2,470,696 29,131 27,449
(B) SHArE oF ContIngEnt lIABIlItIES And ExPEndIturE CoMMItMEntS oF JoIntly ControllEd oPErAtIonS
CONSOLIDATED
2011US$’000
2010US$’000
Contingent liabilities – –
Capital expenditure commitments 2,073,493 2,099,198
Other expenditure commitments 309,314 322,343
(C) IntErEStS In JoIntly ControllEd oPErAtIonSThe principal activities of the following jointly controlled operations in which the economic entity holds an interest are the exploration for and the production of crude oil and natural gas.
Contingent liabilities and commitments for expenditure in respect of these jointly controlled operations are disclosed in notes 30 and 31, respectively.
(i) Production licences
% INTEREST
COUNTRY 2011 2010
PDL 1(1) Hides gas to electricity project PNG 100.00 100.00PDL 2(2, 3) Kutubu & Moran oil fields PNG 60.05 60.05PDL 2(2, 3) South East Mananda oil fields PNG 72.27 72.27PDL 3 South East Gobe oil field PNG 36.36 36.36PDL 4(2) Gobe Main and South East Gobe oil fields PNG 10.00 10.00PDL 5(3) Moran oil field PNG 40.69 40.69PDL 6(2, 3) Moran oil field PNG 71.07 71.07PL 1(2) Hides gas pipeline PNG 100.00 100.00PL 2(2) Kutubu oil pipeline PNG 60.05 60.05PL 3(2) Gobe oil pipeline PNG 17.78 17.78
(1) Economic entity is operator of the gas to electricity project.(2) Joint venture operated by the economic entity.(3) Whilst not the operator of PDL 5, the economic entity operates the Greater Moran Unit, incorporating PDL 2, 5 and 6, under a separate commercial
arrangement.
115

notes to tHe financial statementsfoR tHe financial YeaR enDeD 31 DecemBeR 2011
23 inteRests in jointlY contRolleD opeRations ContInuEd
(ii) Exploration licences
% INTEREST
COUNTRY 2011 2010
PPL 190(1)(2) PNG – 62.56
PPL 219(1) PNG 71.25 71.25
PPL 233 PNG 52.50 52.50
PPL 234(1) PNG 80.00 80.00
PPL 239 PNG 20.00 20.00
PPL 240(1) PNG 100.00 100.00
PPL 244(1) PNG 80.00 80.00
PPL 260(1) PNG 50.00 50.00
PPL 276 PNG 30.00 30.00
PPL 312(1) PNG 30.00 30.00
PPL 338 PNG 30.00 30.00
PPL 339 PNG 30.00 30.00
ELA 1720, 1721, 1722, 1723, 1724, 1725, 1726(3) PNG – 100.00
Taza (K42)(1) Iraq 60.00(4) 60.00(4)
Shakal Iraq 15.00 15.00
Le Kef Tunisia 50.00 50.00
Tajerouine(1) Tunisia 100.00 100.00
Block 3(1) Yemen 40.00 40.00
Block 7(1) Yemen 34.00 34.00
(iii) Gas licences
PDL 1 Hides gas field PNG 16.66 16.66
PDL 7 South Hides gas field PNG 40.69 40.69
PDL 8 Angore gas field PNG 40.69 40.69
PDL 9 Juha gas field PNG 24.42 24.42
PRL 1 Pandora gas field PNG 24.09 24.09
PRL 2 Juha gas field PNG 31.51 31.51
PRL 3 P’nyang gas field PNG 38.51 38.51
PRL 8(1) Kimu gas field PNG 60.71 60.71
PRL 9(1) Barikewa gas field PNG 45.11 45.11
PRL 10(1) Uramu gas field PNG 59.55 59.55
PRL 11 Angore gas field PNG 52.50 52.50
PRL 14(1)(2) Cobra, Iehi, Bilip gas fields PNG 62.56 –
PNG LNG PNG LNG project PNG 29.00 29.00
PPFL 2 PNG LNG project PNG 29.00 29.00
PL 4 PNG LNG project PNG 29.00 29.00
PL 5 PNG LNG project PNG 29.00 29.00
PL 6 PNG LNG project PNG 29.00 29.00
PL 7 PNG LNG project PNG 29.00 29.00
PL 8 PNG LNG project PNG 29.00 29.00
(1) Joint venture operated by the economic entity.(2) PPL190 was converted into PRL14.(3) All CSG licences relinquished in 2011.(4) 60% represents participating interest. Previously disclosed as 75% paying interest.
116

notes to tHe financial statementsfoR tHe financial YeaR enDeD 31 DecemBeR 2011
24 segment RepoRting
InForMAtIon ABout rEPortABlE SEgMEntSThe Group’s segments are arranged primarily by location of operation (e.g. PNG and MENA) followed by the commodity (e.g. oil, gas or LNG).
Each managed segment has a management team that is accountable to the Managing Director.
The Group’s Executive Management team evaluates the financial performance of the Group and its segments principally with reference to earnings before interest and tax, and capital expenditure on exploration and evaluation assets, oil and gas assets, and property, plant and equipment.
PNG MENA CORPORATE TOTAL
OIL AND GAS31 DECEMBER
LNG31 DECEMBER
OIL AND GAS31 DECEMBER 31 DECEMBER 31 DECEMBER
US$’000 2011 2010 2011 2010 2011 2010 2011 2010 2011 2010
External revenues 732,869 583,560 – – – – – – 732,869 583,560Amortisation – site restoration (1,563) (7,130) – – – – – – (1,563) (7,130)Amortisation – oil and gas assets (38,354) (32,390) – – – – – – (38,354) (32,390)Depreciation – operating assets (7,232) (5,134) – – (83) (27) (4,075) (5,193) (11,390) (10,354)Foreign currency (losses)/gains (2,685) 2,051 – – (2) (3) 1,514 29 (1,173) 2,077Exploration, development and production costs expensed (51,619) (107,928) – – (9,014) (17,106) – – (60,633) (125,034)Business development costs (6,397) (5,374) – – (3,898) (780) – – (10,295) (6,154)Employee share based remuneration – – – – – – (12,057) (14,932) (12,057) (14,932)Operating costs (113,938) (99,660) – – (333) (224) (9,485) 891 (123,756) (98,993)EBIT 511,081 327,995 – – (13,330) (18,140) (24,103) (19,205) 473,648 290,650Profit on sale of other non-current assets 138 3,158Unwinding of discount on site restoration (4,243) (3,737)Impairment expense (33,227) (15,808)Interest income 6,953 6,856Interest expense (3,368) (3,945)Reportable segment profit before income tax 439,901 277,174Income tax expense (237,418) (91,572)Net profit after tax 202,483 185,602Investment expenditure Exploration and evaluation assets (89,544) (140,415) – – (55,062) (35,565) – – (144,606) (175,980)Oil and gas assets – development and production (130,191) (41,850) (1,285,747) (1,139,058) – – – – (1,415,938) (1,180,908)Property, plant and equipment (151) (1,938) – – (234) (83) (6,791) (4,529) (7,176) (6,550)Total investment expenditure (219,886) (184,203) (1,285,747) (1,139,058) (55,296) (35,648) (6,791) (4,529) (1,567,720) (1,363,438)
Geographical segmentsThe Oil Search Group operates primarily in Papua New Guinea but also has activities in Yemen, Libya, Iraq, Tunisia and Australia. Production from the designated segments is sold on commodity markets and may be sold to other geographical segments.
In presenting information on the basis of geographical segments, segment revenue and segment assets are based on the location of operating activity.
117

notes to tHe financial statementsfoR tHe financial YeaR enDeD 31 DecemBeR 2011
24 segment RepoRting ContInuEd
REVENUES NON-CURRENT ASSETS
US$’000 2011 2010 2011 2010
PNG 732,869 583,560 4,294,018 2,778,024
Australia – – 21,340 16,712
MENA – – 91,498 77,869
Total 732,869 583,560 4,406,856 2,872,605
Major customersThere is one customer with revenue exceeding 10% of the Group’s total oil and gas sales revenue.
Revenue from this customer represents approximately US$604.1 million or 88% of the Group’s total oil and gas sales revenues (2010: US$358.4 million, 66%) and 82% of the Group’s total revenue of US$732.9 million (2010: 61% of US$583.6 million).
Revenue from each of the other customers is less than 10% of total revenue for the Group.
25 emploYee entitlements anD supeRannuation commitments
CONSOLIDATED PARENT
2011US$’000
2010US$’000
2011US$’000
2010US$’000
The aggregate employee entitlement liability is comprised of:
Annual leave entitlements 5,476 5,460 – –
Directors’ retirement allowances 80 80 80 80
Long service leave entitlements 11,353 9,340 – –
16,909 14,880 80 80
Balance at start of year 14,880 11,963 –
Additional provision 8,214 10,114 – –
Provision utilised (6,185) (7,197) – –
Balance at end of year 16,909 14,880 – –
The provisions represent amounts due to employees in respect of entitlements to annual leave and long service leave accrued under statutory obligations applicable in Australia, PNG, and Middle East and North Africa. These amounts are payable in the normal course of business either when leave is taken or on termination of employment.
Employee Share Option Plan and Share Appreciation Rights PlanThe Employee Share Option Plan was established in 2004 where selected employees of the economic entity are granted options over ordinary shares of Oil Search Limited. The options are granted for nil consideration and are granted in accordance with guidelines approved by shareholders at the Annual Meeting in 2004. The options cannot be transferred and are not quoted on the Australian Securities Exchange. If an employee ceases to be employed by the Group they forfeit any options and rights that have not vested, subject to Board discretion.
Commencing with the 2010 grant, options are no longer awarded and all grants are for share appreciation rights (SAR’s). SAR’s are similar to traditional employee share options, except that they are net settled. Net-settled refers to the fact that the employee does not have the option to take delivery of the full underlying number of shares, but merely receives the net gain on the option on maturity. The gain is calculated as the difference between the exercise price, being the share price at the time the SAR’s were issued, and the Oil Search Limited share price at maturity. The option is assumed to be exercised on maturity if it is in the money, and the net gain is settled by delivering shares in Oil Search Limited to the value of the gain.
There are currently 899 (2010: 869) employees participating in the Employee Share Option Plan and Share Appreciation Rights plan.
118

notes to tHe financial statementsfoR tHe financial YeaR enDeD 31 DecemBeR 2011
25 emploYee entitlements anD supeRannuation commitments ContInuEd
MAY2011
GRANT
JUNE 2010
GRANT
JUNE 2009
GRANT
AUGUST 2008
GRANT(1)
MAY 2007
GRANT
JULY 2006
GRANT
OCTOBER2005
GRANT(2)
Grant date 23 May 2011 1 June 2010 1 June 2009 4 Aug 2008 7 May 2007 28 July 2006 28 Oct 2005
Share price at grant date A$6.92 A$5.61 A$5.73 A$5.65 A$3.66 A$4.13 A$3.30
Fair value A$1.73 A$1.52 A$2.02 A$2.16 A$1.01 A$1.28 A$1.48
Exercise date 23 May 2014 17 May 2013 13 May 2012 5 May 2011 7 May 2010 28 July 2009 13 May 2008
Exercise price A$6.98 A$5.63 A$5.22 A$4.88 A$3.57 A$4.15 A$2.29
Number of options
Balance at 1 January 2011 – 1,542,800 1,209,600 1,501,640 217,000 104,064 –
Granted during period 1,498,560 – – – – – –
Forfeited during period (30,240) (93,100) (43,200) (65,100) – – –
Exercised during period(3) – – – (1,059,418) (100,970) (104,064) –
Balance at 31 December 2011 1,468,320 1,449,700 1,166,400 377,122 116,030 – –
Exercisable at 31 December 2011 – – – 377,122 116,030 – –
Average share price at date of exercise A$6.90 A$6.71 A$6.58 –
Balance at 1 January 2010 – – 1,291,200 1,551,550 1,347,570 227,640 63,365
Granted during period – 1,554,200 – – – – –
Forfeited during period – (11,400) (81,600) (49,910) (4,340) – –
Exercised during period(3,4) – – – – (1,126,230) (123,576) (63,365)
Balance at 31 December 2010 – 1,542,800 1,209,600 1,501,640 217,000 104,064 –
Exercisable at 31 December 2010 – – – – 217,000 104,064 –
Average share price at date of exercise A$5.97 A$5.97 A$5.97
(1) Whilst not formally granted until 4 August 2008, the 2008 options were awarded on 5 May 2008, when the share price was A$4.88.(2) Whilst not formally granted until 28 October 2005, the 2005 options were awarded on 13 May 2005, when the share price was A$2.29.(3) Settled by cashing out and cancelling the options or by issuing new shares. (4) Settled by cashing out and cancelling the options or by purchasing shares on market.
Options and SAR’s were priced using a binomial option pricing model using the following inputs:
MAY2011
GRANT
JUNE 2010
GRANT
JUNE 2009
GRANT
AUGUST 2008
GRANT
MAY 2007
GRANT
JULY 2006
GRANT
OCTOBER2005
GRANT
Volatility 30% 35% 40% 38% 32% 35% 40%
Dividend yield 0.60% 0.90% 2.00% 1.50% 2.90% 1.80% 1.73%
Risk-free interest rate 4.88% 4.64% 4.55% 5.96% 5.93% 5.90% 5.27%
An expense of US$2,535,939 (2010: US$2,615,054) has been recognised in the profit and loss statement in respect of these options and SAR’s. All options expire two years after their vesting date or on termination of employment. SAR’s are exercised on maturity if they are in the money.
119

notes to tHe financial statementsfoR tHe financial YeaR enDeD 31 DecemBeR 2011
25 emploYee entitlements anD supeRannuation commitments ContInuEd
PERFORMANCE RIGHTS PLANAn employee Performance Rights Plan was established in 2004 where selected employees of the economic entity are granted rights over ordinary shares of Oil Search Limited. Vesting of the awards depends on Oil Search’s Total Shareholder Return (TSR) performance over a three-year period relative to peer groups of companies. For awards prior to 2007, a single peer group of the first 150 companies included in the ASX 200 Index was used. From 2007 onwards, Oil Search’s performance has been measured against two peer groups, with an equal weighting ascribed to each of:
> The first 150 companies included in the ASX 200 Index; and > A selected group of similar sized international oil and gas exploration and production companies.
To determine the level of vesting of the awards, Oil Search’s TSR over the three year performance period is ranked against the TSR of each company in the peer groups over the same period.
For each peer group, if Oil Search’s TSR performance is:
> below median, that is the 50th percentile, no performance rights will vest; > at the median, 25% of the performance rights granted will vest; > greater than the median and less than the 75th percentile, the number of performance rights that will vest increases on a
straight line basis from 25% to 50% of the total number of performance rights granted; > at or above the 75th percentile, 50% of the performance rights granted will vest.
The rights are granted for nil consideration and are granted in accordance with guidelines approved by shareholders at the Annual Meeting in 2004. The rights cannot be transferred and are not quoted on the Australian Securities Exchange. There are currently 112 (2010: 155) employees participating in the Performance Rights Plan.
120

notes to tHe financial statementsfoR tHe financial YeaR enDeD 31 DecemBeR 2011
25 emploYee entitlements anD supeRannuation commitments ContInuEd
MAY2011
GRANT(1)
JUNE2010
GRANT(2)
JUNE2009
GRANT(3)
AUGUST2008
GRANT(4)
MAY2007
GRANT(5)
JULY2006
GRANT(6)
OCTOBER2005
GRANT(7)
Grant date 23 May 2011 1 June 2010 1 June 2009 4 Aug 2008 7 May 2007 28 July 2006 28 Oct 2005
Share price at grant date A$6.92 A$5.61 A$5.73 A$5.65 A$3.66 A$4.13 A$3.30
Fair value A$4.40 A$3.54 A$4.70 A$4.39 A$2.10 A$2.72 A$2.81
Exercise date 23 May 2014 17 May 2013 13 May 2012 5 May 2011 7 May 2010 28 July 2009 13 May 2008
Exercise price A$ nil A$ nil A$ nil A$ nil A$ nil A$ nil A$ nil
Number of rights
Balance at 1 January 2011 – 1,828,200 1,655,185 2,202,985 384,522 113,099 –
Granted during period 1,696,500 – – – – – –
Forfeited during period (44,163) (141,132) (179,553) (29,300) – – –
Exercised during period(8,9) (1,437) (29,068) (53,547) (1,351,185) (202,075) (113,099) –
Balance at 31 December 2011 1,650,900 1,658,000 1,422,085 822,500 182,447 – –
Exercisable at 31 December 2011 – – – 822,500 182,447 – –
Average share price at date of exercise A$6.26 A$6.83 A$6.85 A$6.76 A$6.51 A$6.60 –
Balance at 1 January 2010 – – 1,737,785 2,392,285 2,113,722 234,127 33,579
Granted during period – 1,997,400 – - – – –
Forfeited during period – (169,200) (64,792) (134,755) (29,307) – –
Exercised during period(8,9) – – (17,808) (54,545) (1,699,893) (121,028) (33,579)
Balance at 31 December 2010 – 1,828,200 1,655,185 2,202,985 384,522 113,099 –
Exercisable at 31 December 2010 – – – – 384,522 113,099 –
Average share price at date of exercise A$5.49 A$5.49 A$5.97 A$5.97 A$5.97
(1) Performance period 1 January 2011 – 31 December 2013. (2) Performance period 1 January 2010 – 31 December 2012. (3) Performance period 1 January 2009 – 31 December 2011. (4) Performance period 1 January 2008 – 31 December 2010.(5) Performance period 1 January 2007 – 31 December 2009. All rights vested on 7 May 2010.(6) Performance period 1 January 2006 – 31 December 2008. All rights vested on 28 July 2009.(7) Performance period 1 January 2005 – 31 December 2007. All rights vested on 13 May 2008.(8) Settled by cashing out or cancelling the rights or by issuing new shares.(9) Board discretion exercised in relation to death, resignation or termination of employment.
Performance rights were priced using a Monte-Carlo simulation model using the following inputs:
MAY2011
GRANT
JUNE2010
GRANT
JUNE2009
GRANT
AUGUST2008
GRANT
MAY2007
GRANT
JULY2006
GRANT
OCTOBER2005
GRANT
Volatility 30% 35% 40% 38% 32% 35% 40%
Dividend yield 0.60% 0.90% 2.00% 1.50% 2.90% 1.80% 1.73%
Risk-free interest rate 4.88% 4.64% 4.16% 6.00% 5.98% 5.93% 5.25%
An expense of US$5,779,112 (2010: US$7,011,533) has been recognised in the profit and loss statement in respect of these rights. All rights that have vested expire two years after their exercise date or on termination of employment.
121
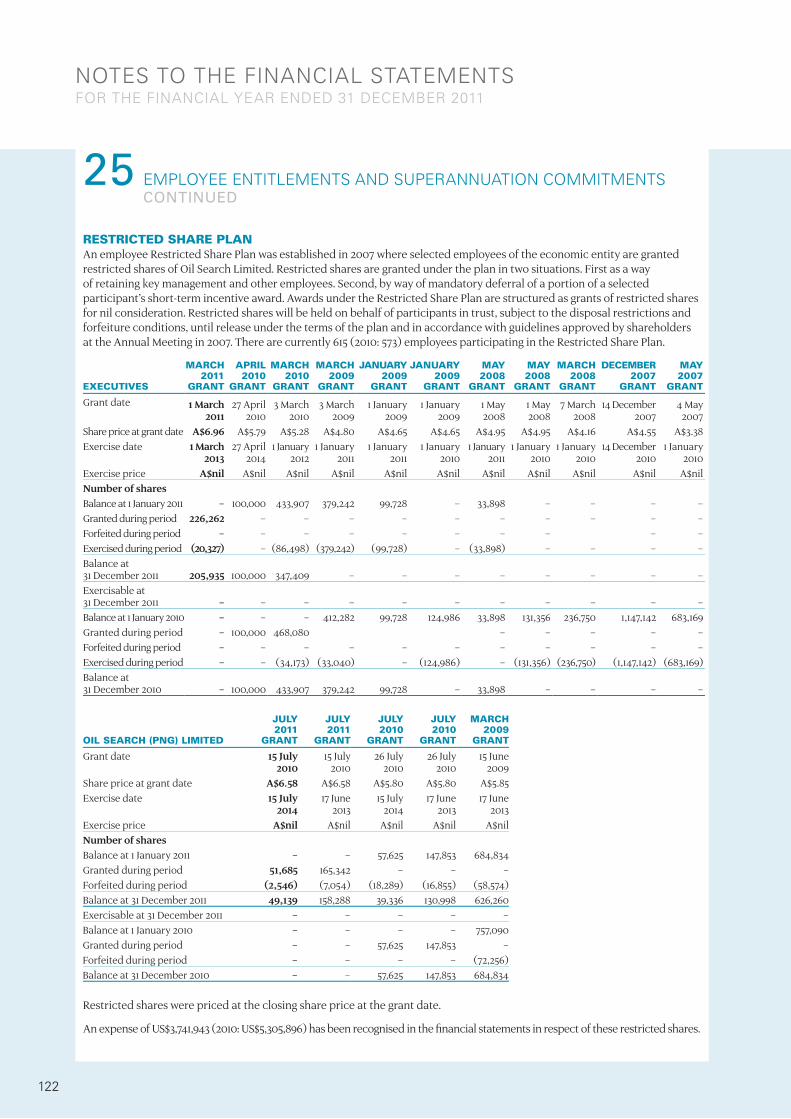
notes to tHe financial statementsfoR tHe financial YeaR enDeD 31 DecemBeR 2011
25 emploYee entitlements anD supeRannuation commitments ContInuEd
RESTRICTED SHARE PLANAn employee Restricted Share Plan was established in 2007 where selected employees of the economic entity are granted restricted shares of Oil Search Limited. Restricted shares are granted under the plan in two situations. First as a way of retaining key management and other employees. Second, by way of mandatory deferral of a portion of a selected participant’s short-term incentive award. Awards under the Restricted Share Plan are structured as grants of restricted shares for nil consideration. Restricted shares will be held on behalf of participants in trust, subject to the disposal restrictions and forfeiture conditions, until release under the terms of the plan and in accordance with guidelines approved by shareholders at the Annual Meeting in 2007. There are currently 615 (2010: 573) employees participating in the Restricted Share Plan.
ExECUTIVES
MARCH 2011
GRANT
APRIL2010
GRANT
MARCH 2010
GRANT
MARCH2009
GRANT
JANUARY2009
GRANT
JANUARY2009
GRANT
MAY2008
GRANT
MAY2008
GRANT
MARCH 2008
GRANT
DECEMBER2007
GRANT
MAY2007
GRANT
Grant date 1 March2011
27 April2010
3 March2010
3 March2009
1 January2009
1 January2009
1 May2008
1 May2008
7 March2008
14 December2007
4 May2007
Share price at grant date A$6.96 A$5.79 A$5.28 A$4.80 A$4.65 A$4.65 A$4.95 A$4.95 A$4.16 A$4.55 A$3.38Exercise date 1 March
201327 April
20141 January
20121 January
20111 January
20111 January
20101 January
20111 January
20101 January
201014 December
20101 January
2010Exercise price A$nil A$nil A$nil A$nil A$nil A$nil A$nil A$nil A$nil A$nil A$nilNumber of sharesBalance at 1 January 2011 – 100,000 433,907 379,242 99,728 – 33,898 – – – –Granted during period 226,262 – – – – – – – – – –Forfeited during period – – – – – – – – – –Exercised during period (20,327) – (86,498) (379,242) (99,728) – (33,898) – – – –Balance at 31 December 2011 205,935 100,000 347,409 – – – – – – – –Exercisable at 31 December 2011 – – – – – – – – – – –Balance at 1 January 2010 – – – 412,282 99,728 124,986 33,898 131,356 236,750 1,147,142 683,169Granted during period – 100,000 468,080 – – – – –Forfeited during period – – – – – – – – – – –Exercised during period – – (34,173) (33,040) – (124,986) – (131,356) (236,750) (1,147,142) (683,169)Balance at 31 December 2010 – 100,000 433,907 379,242 99,728 – 33,898 – – – –
OIL SEARCH (PNG) LIMITED
JULY 2011
GRANT
JULY 2011
GRANT
JULY 2010
GRANT
JULY 2010
GRANT
MARCH 2009
GRANT
Grant date 15 July2010
15 July2010
26 July2010
26 July2010
15 June2009
Share price at grant date A$6.58 A$6.58 A$5.80 A$5.80 A$5.85Exercise date 15 July
201417 June
201315 July
201417 June
201317 June
2013Exercise price A$nil A$nil A$nil A$nil A$nilNumber of sharesBalance at 1 January 2011 – – 57,625 147,853 684,834Granted during period 51,685 165,342 – – –Forfeited during period (2,546) (7,054) (18,289) (16,855) (58,574)Balance at 31 December 2011 49,139 158,288 39,336 130,998 626,260Exercisable at 31 December 2011 – – – – –Balance at 1 January 2010 – – – – 757,090Granted during period – – 57,625 147,853 –Forfeited during period – – – – (72,256)Balance at 31 December 2010 – – 57,625 147,853 684,834
Restricted shares were priced at the closing share price at the grant date.
An expense of US$3,741,943 (2010: US$5,305,896) has been recognised in the financial statements in respect of these restricted shares.
122

notes to tHe financial statementsfoR tHe financial YeaR enDeD 31 DecemBeR 2011
26 KeY management peRsonnel RemuneRation
(A) DIRECTORS’ REMUNERATIONRemuneration paid or payable, or otherwise made available, in respect of the financial year, to all Directors of Oil Search Limited, directly or indirectly, by the entity or any related party:
2011US$
2010US$
Short term benefits(1) 4,832,498 5,135,402
Long term benefits 235,012 148,915
Post-employment benefits 92,573 95,092
Share-based payments 2,344,005 2,255,019
7,504,088 7,634,428
(1) The 2010 comparative data for short term benefits has been restated as it included the 50% of STI deferred into restricted shares within share-based payments.
The number of Directors of Oil Search Limited whose remuneration falls within the following bands:
NO. NO.
US$0 – US$9,999 – 1
US$10,000 – US$19,999 – 1
US$70,000 – US$79,999 – 1
US$130,000 – US$139,999 – 1
US$160,000 – US$169,999 – 1
US$170,000 – US$179,999 – 3
US$210,000 – US$219,999 1 –
US$220,000 – US$229,999 3 –
US$230,000 – US$239,999 1 –
US$240,000 – US$249,999 1 –
US$370,000 – US$379,999 – 1
US$510,000 – US$519,999 1 –
US$1,230,000 – US$1,239,999 1 –
US$1,300,000 – US$1,309,999 – 1
US$4,370,000 – US$4,379,999 1 –
US$5,030,000 – US$5,039,999 – 1
The insurance premium paid during the year to insure the Directors against claims made against them while performing services for the Company has not been disclosed as it would breach the confidentiality clause in the insurance policy.
(B) ExECUTIVES’ REMUNERATION (ExCLUDING DIRECTORS)Amounts received or due and receivable by executive officers of the economic entity whose remuneration is US$100,000 or more, from entities in the economic entity and related entities:
2011US$
2010US$
Short term benefits(1) 7,061,596 8,499,876
Long term benefits(2) (158,507) (42,391)
Post-employment benefits 239,373 287,745
Share-based payments 3,267,398 3,753,518
10,409,860 12,498,748
(1) The 2010 comparative data for short term benefits has been restated as it included the 50% of STI deferred into restricted shares within share-based payments.
(2) This is a negative balance as a result of a large long service leave entitlement paid out to a departing executive which was previously accrued.
123
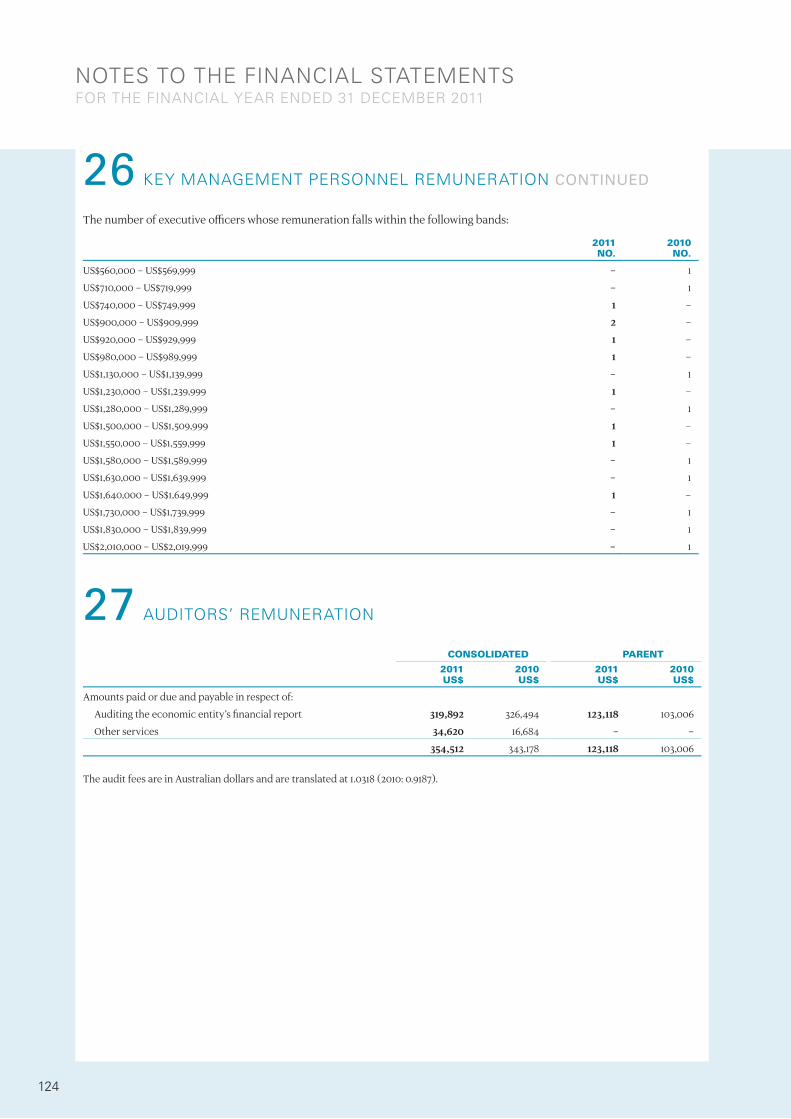
notes to tHe financial statementsfoR tHe financial YeaR enDeD 31 DecemBeR 2011
26 KeY management peRsonnel RemuneRation ContInuEd
The number of executive officers whose remuneration falls within the following bands:
2011NO.
2010NO.
US$560,000 – US$569,999 – 1
US$710,000 – US$719,999 – 1
US$740,000 – US$749,999 1 –
US$900,000 – US$909,999 2 –
US$920,000 – US$929,999 1 –
US$980,000 – US$989,999 1 –
US$1,130,000 – US$1,139,999 – 1
US$1,230,000 – US$1,239,999 1 –
US$1,280,000 – US$1,289,999 – 1
US$1,500,000 – US$1,509,999 1 –
US$1,550,000 – US$1,559,999 1 –
US$1,580,000 – US$1,589,999 – 1
US$1,630,000 – US$1,639,999 – 1
US$1,640,000 – US$1,649,999 1 –
US$1,730,000 – US$1,739,999 – 1
US$1,830,000 – US$1,839,999 – 1
US$2,010,000 – US$2,019,999 – 1
27 auDitoRs’ RemuneRation
CONSOLIDATED PARENT
2011US$
2010US$
2011US$
2010US$
Amounts paid or due and payable in respect of:
Auditing the economic entity’s financial report 319,892 326,494 123,118 103,006
Other services 34,620 16,684 – –
354,512 343,178 123,118 103,006
The audit fees are in Australian dollars and are translated at 1.0318 (2010: 0.9187).
124
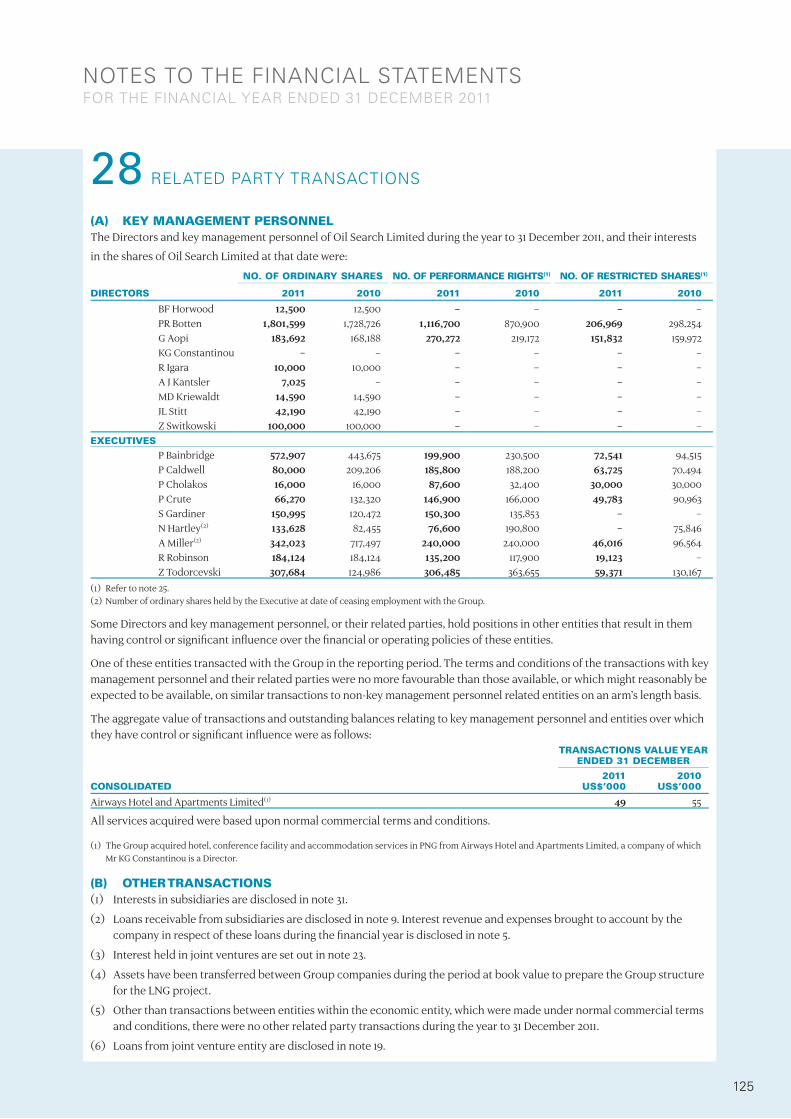
notes to tHe financial statementsfoR tHe financial YeaR enDeD 31 DecemBeR 2011
28 RelateD paRtY tRansactions
(A) kEY MANAGEMENT PERSONNELThe Directors and key management personnel of Oil Search Limited during the year to 31 December 2011, and their interests
in the shares of Oil Search Limited at that date were:
NO. OF ORDINARY SHARES NO. OF PERFORMANCE RIGHTS(1) NO. OF RESTRICTED SHARES(1)
DIRECTORS 2011 2010 2011 2010 2011 2010
BF Horwood 12,500 12,500 – – – –PR Botten 1,801,599 1,728,726 1,116,700 870,900 206,969 298,254 G Aopi 183,692 168,188 270,272 219,172 151,832 159,972 KG Constantinou – – – – – –R Igara 10,000 10,000 – – – –A J Kantsler 7,025 – – – – –MD Kriewaldt 14,590 14,590 – – – –JL Stitt 42,190 42,190 – – – –Z Switkowski 100,000 100,000 – – – –
ExECUTIVES
P Bainbridge 572,907 443,675 199,900 230,500 72,541 94,515 P Caldwell 80,000 209,206 185,800 188,200 63,725 70,494 P Cholakos 16,000 16,000 87,600 32,400 30,000 30,000 P Crute 66,270 132,320 146,900 166,000 49,783 90,963 S Gardiner 150,995 120,472 150,300 135,853 – –N Hartley(2) 133,628 82,455 76,600 190,800 – 75,846 A Miller(2) 342,023 717,497 240,000 240,000 46,016 96,564 R Robinson 184,124 184,124 135,200 117,900 19,123 –Z Todorcevski 307,684 124,986 306,485 363,655 59,371 130,167
(1) Refer to note 25.(2) Number of ordinary shares held by the Executive at date of ceasing employment with the Group.
Some Directors and key management personnel, or their related parties, hold positions in other entities that result in them having control or significant influence over the financial or operating policies of these entities.
One of these entities transacted with the Group in the reporting period. The terms and conditions of the transactions with key management personnel and their related parties were no more favourable than those available, or which might reasonably be expected to be available, on similar transactions to non-key management personnel related entities on an arm’s length basis.
The aggregate value of transactions and outstanding balances relating to key management personnel and entities over which they have control or significant influence were as follows:
TRANSACTIONS VALUE YEAR ENDED 31 DECEMBER
CONSOLIDATED2011
US$’0002010
US$’000
Airways Hotel and Apartments Limited(1) 49 55
All services acquired were based upon normal commercial terms and conditions.
(1) The Group acquired hotel, conference facility and accommodation services in PNG from Airways Hotel and Apartments Limited, a company of which Mr KG Constantinou is a Director.
(B) OTHER TRANSACTIONS(1) Interests in subsidiaries are disclosed in note 31.
(2) Loans receivable from subsidiaries are disclosed in note 9. Interest revenue and expenses brought to account by the company in respect of these loans during the financial year is disclosed in note 5.
(3) Interest held in joint ventures are set out in note 23.
(4) Assets have been transferred between Group companies during the period at book value to prepare the Group structure for the LNG project.
(5) Other than transactions between entities within the economic entity, which were made under normal commercial terms and conditions, there were no other related party transactions during the year to 31 December 2011.
(6) Loans from joint venture entity are disclosed in note 19.
125

notes to tHe financial statementsfoR tHe financial YeaR enDeD 31 DecemBeR 2011
29 leases
CONSOLIDATED PARENT
2011US$’000
2010US$’000
2011US$’000
2010US$’000
Operating leases not capitalised in the accountsRental of premises and motor vehicles Payable within 12 months 5,747 5,861 – – Payable 1 to 2 years 2,980 5,598 – – Payable 2 to 5 years 958 5,416 – –
30 contingent liaBilities
(A) GUARANTEESAs part of the terms and conditions of a Loan Agreement between Oil Search (PNG) Limited (“OSP”) as borrower and the Commonwealth Bank of Australia lending syndicate for the provision of a US$435 million term revolving facility, OSP provided a charge over its credit account in Melbourne with Australia & New Zealand Banking Group Limited.
Oil Search Limited, as Completion Guarantor, has guaranteed payment by the Borrower of its share in the LNG Project (29.0%) of the senior debt obligations (refer note 19).
(B) CONTINGENT CLAIMSVarious claims for damages, occurring through the ordinary course of business, existed at balance sheet date. Legal advice indicates it is unlikely that any significant liabilities will arise from these outstanding claims.
The ultimate parent company will provide necessary financial support to ensure any subsidiary companies with a net current asset deficiency, will pay their debts as and when they fall due.
31 gRoup entities
OWNERSHIPINTEREST %
2011
OWNERSHIPINTEREST %
2010COUNTRY OF
INCORPORATION
Parent entityOil Search Limited PNGConsolidated entitiesOil Search (Middle Eastern) Limited 100 100 British Virgin Is. Oil Search (Iraq) Limited 100 100 British Virgin Is. Oil Search (Libya) Limited 100 100 British Virgin Is. Oil Search (Tunisia) Limited 100 100 British Virgin Is. Oil Search (ROY) Limited 100 100 British Virgin Is.Oil Search (Gas Holdings) Limited 100 100 PNG Oil Search (Tumbudu) Limited 100 100 PNGOil Search (PNG) Limited 100 100 PNG Oil Search (Drilling) Limited 100 100 PNG Oil Search (Exploration) Inc. 100 100 Cayman Is.Oil Search (LNG) Limited 100 100 PNGNew Guinea Investments Limited 100 100 PNG New Guinea (Petroleum) Limited 100 100 PNGOil Search Health Foundation Limited(1)(2)(3) 100 100 PNGPapuan Oil Search Limited 100 100 AustraliaOil Search Limited Retention Share Plan Trust 100 100 Australia
(1) Name has changed since previous financial year. Formerly known as New Guinea (LNG Interests) Limited.(2) Prior to 2011 this entity was a subsidiary of New Guinea (Investments) Limited.(3) Oil Search Health Foundation Limited is Trustee of the Oil Search Health Foundation Trust, a not-for-profit organisation established for charitable
purposes in PNG. This Trust is not controlled by Oil Search and is not consolidated within the Group.
126

notes to tHe financial statementsfoR tHe financial YeaR enDeD 31 DecemBeR 2011
32 financial instRuments
(A) TERMS, CONDITIONS AND ACCOUNTING POLICIESThe economic entity’s accounting policies, including the terms and conditions of each class of financial asset, financial liability and equity instrument, both recognised and unrecognised at balance date, are as follows:
RECOGNISEDFINANCIALINSTRUMENTS
BALANCESHEETNOTES
ACCOUNTINGPOLICIES
TERMS AND CONDITIONS
(i) Financial assets
Receivables – trade 9 Trade receivables are carried at amortised costs less any allowance for doubtful debts. An allowance for doubtful debts is recognised when collection of the full nominal amount is no longer probable.
Credit sales are on 30 day terms.
Receivables – Related parties/entities
9 Amounts (other than trade debts) receivable from related parties/entities are carried at amortised cost less any allowance for doubtful debts.
Receivables from related parties/entities are payable at call. Refer to note 28(b).
Short-term deposits 22(a) Short-term deposits are stated at amortised cost. Interest is recognised in the profit and loss account at the effective interest rate.
Short-term deposits have maturity dates of six months or less.
(ii) Financial liabilities
Trade creditors and accruals
17 Liabilities are recognised for amounts to be paid in the future for goods and services received, whether or not billed to the economic entity.
Trade liabilities are normally settled on 30 day terms.
Accounts payable – Related parties/entities
17 Loans from related parties are carried at amortised cost. Interest is taken up as an expense on an accrual basis.
Amounts owing to related parties/entities are payable at call.
Secured loans – Secured loans are carried at amortised cost net of transaction costs. Interest on borrowings for major projects is capitalised until the commencement of production and then amortised over:
> the estimated life of the project (oil facility); or
> a fixed term from the Completion date (LNG Project).
All other interest on borrowings is expensed at the effective interest rate.
Secured loans are repayable in quarterly instalments from proceeds earned from the producing oil fields (oil facility) or semi-annually from LNG proceeds (LNG Project). Interest is either fixed or floating (LIBOR plus a margin). Details of the security over the secured loans are set out in notes 19 and 30(a).
(iii) Equity
Ordinary shares 21 Ordinary share capital is recognised at the historical US$ equivalent of capital raised, net of capital raising costs.
Under the PNG Companies’ Act, the concept of Authorised Capital no longer exists and there is no limit on the number of shares the company may issue. Details of shares issued and the terms and conditions of options and rights outstanding over ordinary shares are disclosed in notes 21 and 25.
Hedges From time to time the economic entity enters into hedging arrangements in circumstances where it is necessary to ensure adequate cash flow to meet financial commitments. As per IAS 39: Financial Instruments Recognition and Measurement the company recognises the fair value of outstanding effective hedges in the Balance Sheet. Hedging settlements are included in the profit and loss at the same time as the underlying physical exposure is recognised in the profit and loss.
There are no outstanding forward sales contracts at balance date (2010: nil).As at 31 December 2011, there are no outstanding barrels hedged (2010: nil).
127

notes to tHe financial statementsfoR tHe financial YeaR enDeD 31 DecemBeR 2011
32 financial instRuments ContInuEd
(B) FINANCIAL RISk MANAGEMENTFinancial risk exposures arise in the course of the day-to-day operating activities of the Group, primarily due to the impact of oil price movements on revenue items and exchange rate and interest rate impacts on expenditure and balance sheet items. The management of borrowings and surplus cash also create liquidity and credit risk exposures. Monetary assets and liabilities denominated in currencies other than the Group’s functional currency, US dollars (US$), may also give rise to translation exposures.
The Group’s overall approach is to enter into hedges using derivative financial instruments only in circumstances where it is necessary to ensure adequate cash flow to meet future financial commitments. Financial risk management is undertaken by Group Treasury and risks are managed within the parameters of the Board approved Financial Risk Management policy.
(i) Market riskForeign exchange risk The Group has revenue flows and major capital obligations predominantly denominated in US$ and the functional currency for the preparation of consolidated accounts is US$.
The Group’s residual currency risk exposure originates from two different sources:
> Administrative and business development expenditures incurred at the corporate level in Australian dollars (A$); and > Operating and capital expenditures incurred by the Group in its role of Operator in Papua New Guinea Kina (PGK) and A$.
In addition to these operational foreign exchange exposures, the Group may also be exposed to one-off transactional flows which occur on an ad hoc basis: i.e. capital equipment purchases in currencies other than US$. The Group is not exposed to material translation exposures as the majority of its assets and liabilities are denominated in US$.
Foreign exchange risk management The Group manages its exposure to foreign exchange rate volatility by matching the currency of its cost structure to its US$ revenue stream. Transaction exposures are netted off across the Group to reduce volatility and avoid incurring the dealing spread on transactions, providing a natural hedge. The residual operating cost exposures, primarily in A$, are recurring in nature and therefore no long term hedging is undertaken to minimise the profit and loss impact of these exposures.
The Operator cash flows are managed independently to the Group’s corporate exposures, reflecting the interests of joint venture partners in the Operator cash flows. A$ and PGK are bought on the spot market in excess of immediate requirements. Where these currencies are purchased in advance of requirements, A$ and PGK cash balances do not exceed three months requirements.
As at 31 December 2011, there were no foreign exchange deals outstanding (2010: nil).
No currency sensitivity analysis is provided as there were no derivative financial instruments in place to hedge residual foreign exchange exposure and any non-derivative financial instruments are directly denominated in the functional currency of the entity in which it is taken out.
(ii) Interest rate riskThe Group is exposed to interest rate exposure directly through borrowings and investments in each of the currencies of its operations. Surplus cash is invested in short term (floating) instruments due to uncertainty of timing of major cash outflows. Whilst some of the invested cash is in PGK and A$, the primary exposure is to US interest rates.
Interest rate risk management Interest rate risk is managed on a Group basis at the corporate level. Limits on the proportion of fixed interest rate exposure are applied and interest rates may be fixed for a maximum term of four years or the remaining life of term debt facilities, whichever is the longer.
As at 31 December 2011, there was no interest rate hedging in place (2010: nil). Surplus cash was invested in short term instruments with an average maturity of 1 to 6 months.
Interest rate sensitivity The sensitivity analysis below has been determined based on exposure to interest rates at the reporting date and the stipulated change taking place at the beginning of the financial year and held constant throughout the year.
At the reporting date, if interest rates had been 25 basis points higher or lower and all other variables were held constant, the consolidated entity’s:
> net profit after tax would increase/decrease by US$1.7 million (2010: US$1.9 million).
At the reporting date, if interest rates had been 25 basis points higher or lower and all other variables were held constant, the parent company’s:
> net profit after tax would increase/decrease by US$1.1 million (2010: US$1.3 million).
128

notes to tHe financial statementsfoR tHe financial YeaR enDeD 31 DecemBeR 2011
32 financial instRuments ContInuEd
(B) FINANCIAL RISk MANAGEMENT (CONTINUED)(ii) Interest rate risk (continued)Consolidated
FINANCIAL INSTRUMENTS
FLOATINGINTEREST
RATEUS$’000
FIxED INTEREST RATE MATURING IN:
NONINTERESTBEARINGUS$’000
TOTALCARRYING
AMOUNT ASPER THE
BALANCESHEET
US$’000
WEIGHTEDAVERAGE
EFFECTIVEINTEREST
RATE%
1 YEAR OR LESS
US$’0001-5 YEARS
US$’000
MORE THAN5 YEARSUS$’000
2011
Financial assets
Cash and cash equivalents 174,228 873,235 – – – 1,047,463 0.6%
Receivables – trade – – – – 49,336 49,336
Other debtors – – – – 52,917 52,917
Non-current receivables – – – – 3,966 3,966
Total financial assets 174,228 873,235 – – 106,219 1,153,682
Financial liabilities
Trade creditors and accruals – – – – 415,946 415,946
Other payables – – – – 4,899 4,899
Loans and borrowings 1,398,578 – – 348,989 – 1,747,567 3.3%
Total financial liabilities 1,398,578 – – 348,989 420,845 2,168,412
2010
Financial assets
Cash and cash equivalents 174,852 1,088,737 – – – 1,263,589 0.5%
Receivables – trade – – – – 40,859 40,859
Other debtors – – – – 47,053 47,053
Non-current receivables – – – – 3,326 3,326
Total financial assets 174,852 1,088,737 – – 91,238 1,354,827
Financial liabilities
Trade creditors and accruals – – – – 301,042 301,042
Loans and borrowings 846,510 – – 83,210 – 929,720 3.3%
Total financial liabilities 846,510 – – 83,210 301,042 1,230,762
There exists no unrecognised financial instruments at balance date.
129

notes to tHe financial statementsfoR tHe financial YeaR enDeD 31 DecemBeR 2011
32 financial instRuments ContInuEd
(B) FINANCIAL RISk MANAGEMENT (CONTINUED)(ii) Interest rate risk (continued)Parent
FINANCIAL INSTRUMENTS
FLOATINGINTEREST
RATEUS$’000
FIxED INTEREST RATE MATURING IN:
NON INTERESTBEARINGUS$’000
TOTALCARRYING
AMOUNT ASPER THE
BALANCESHEET
US$’000
WEIGHTEDAVERAGE
EFFECTIVEINTEREST
RATE%
1 YEAR ORLESS
US$’0001-5 YEARS
US$’000
MORE THAN5 YEARSUS$’000
2011
Financial assets
Cash and cash equivalents 84,879 694,380 – – – 779,259 0.6%
Other debtors – – – – 6,683 6,683
Total financial assets 84,879 694,380 – – 6,683 785,942
Financial liabilities
Trade creditors and accruals – – – – 9,348 9,348
Other payables – – – – 172 172
Total financial liabilities – – – – 9,520 9,520
2010
Financial assets
Cash and cash equivalents 62,945 909,800 – – – 972,745 0.5%
Other debtors – – – – 1,388 1,388
Total financial assets 62,945 909,800 – – 1,388 974,133
Financial liabilities
Trade creditors and accruals – – – – 1,469 1,469
Other payables – – – – 60 60
Total financial liabilities – – – – 1,529 1,529
There exists no unrecognised financial instruments at balance date.
(iii) Commodity price riskThe Group has exposure to commodity price risk associated with the production and sale of crude.
Commodity risk management The Group does not seek to limit its exposure to the fluctuations in oil prices; rather the central aim of oil price risk management is to ensure the Group’s financial position remains sound and that the Group is able to meet its financial obligations in the event of low oil prices. Hedge cover targets are determined through detailed modelling of the Group’s position under various oil price scenarios. The policy ensures that maturities of the hedges are spread over time and there is no fixed minimum hedge cover level. This allows the Group not to be forced to price a significant proportion of its exposure in an unfavourable oil price environment.
Under the PNG LNG Project financing there are restrictions relating to hedging instruments that may be undertaken. Permitted hedging instruments as defined in the financing agreements must be non-recourse to the participants project interest and the project property.
As at 31 December 2011, there was no oil price hedging in place (2010: nil).
No commodity price sensitivity analysis is required as there was no hedging in place.
130

notes to tHe financial statementsfoR tHe financial YeaR enDeD 31 DecemBeR 2011
32 financial instRuments ContInuEd
(B) FINANCIAL RISk MANAGEMENT (CONTINUED)(iv) Credit riskThe Group has exposure to credit risk if counterparties are not able to meet their financial obligations to the Group.
The exposure arises as a result of the following activities:
> Financial transactions involving money market, surplus cash investments and derivative instruments. > Direct sales of crude. > Other receivables. > Granting financial guarantees on the PNG LNG Project.
Credit risk management Global credit limits have been established across all categories of financial transactions. The limits are based on the credit ratings provided by Standard and Poor’s, and Moody’s.
The Group markets Kutubu crude on behalf of the Joint Lifting Consortium, primarily selling crude to investment grade counterparties, provided the counterparties enter into Buyer Consent Deeds as required under the terms of the Group’s debt facility. Sales to all other buyers are secured by letters of credit issued by single “A” rated banks and confirmed by the ANZ Banking Corporation.
At 31 December 2011 there was no significant concentration of credit risk exposure to any counterparty (2010: nil).
The extent of the Group’s credit risk exposure is identified in the following table.
CONSOLIDATED PARENT
NOTE2011
US$’0002010
US$’0002011
US$’0002010
US$’000
Current
Cash at bank and on hand 22(a) 164,439 170,024 84,866 62,942
Share of cash in joint ventures 22(a) 9,789 4,828 13 3
Interest-bearing short term deposits 22(a) 873,235 1,088,737 694,380 909,800
Receivables 9 102,253 87,912 423,464 210,992
1,149,716 1,351,501 1,202,723 1,183,737
Non-current
Receivables 9 3,966 3,326 – –
Loans and borrowings 19 1,747,567 929,720 – –
1,751,533 933,046 – –
(v) Liquidity riskThe Group has exposure to liquidity risk if it is unable to settle transactions in the normal course of business and if new funding and refinancing cannot be obtained as required and on reasonable terms.
Liquidity risk management The Group manages liquidity risk by ensuring that there are sufficient funds available to meet its financial obligations on a day-to-day basis and to meet unexpected liquidity needs in the normal course of business. The Group’s liquidity policy is to maintain surplus immediate cash liquidity together with committed undrawn lines of credit for business opportunities and unanticipated cash outflows.
The Group also seeks to ensure maturities of committed debt facilities are reasonably well spread over time to minimise the Group’s exposure to risk on the cost or availability of funds should the refinancing requirement coincide with unexpected short term disruption or adverse fund-raising conditions in the capital markets. In order to avoid an exposure to any particular source of external funding the Group acknowledges the benefits of diversification of funding sources and where possible, aims to source its funds from a range of lenders, markets and funding instruments.
Oil Search (PNG) Limited (“OSP”) signed a five year financing facility effective 23 October 2008 for US$435.0 million, decreasing by US$14.5 million at the end of each quarter. A facility limit of US$246.5 million was available at 31 December 2011. There was a nil drawn balance as at 31 December 2011 (2010: nil). As part of the terms and conditions of this facility, OSP has provided a charge over its credit account in Melbourne with Australia & New Zealand Banking Group Limited.
131
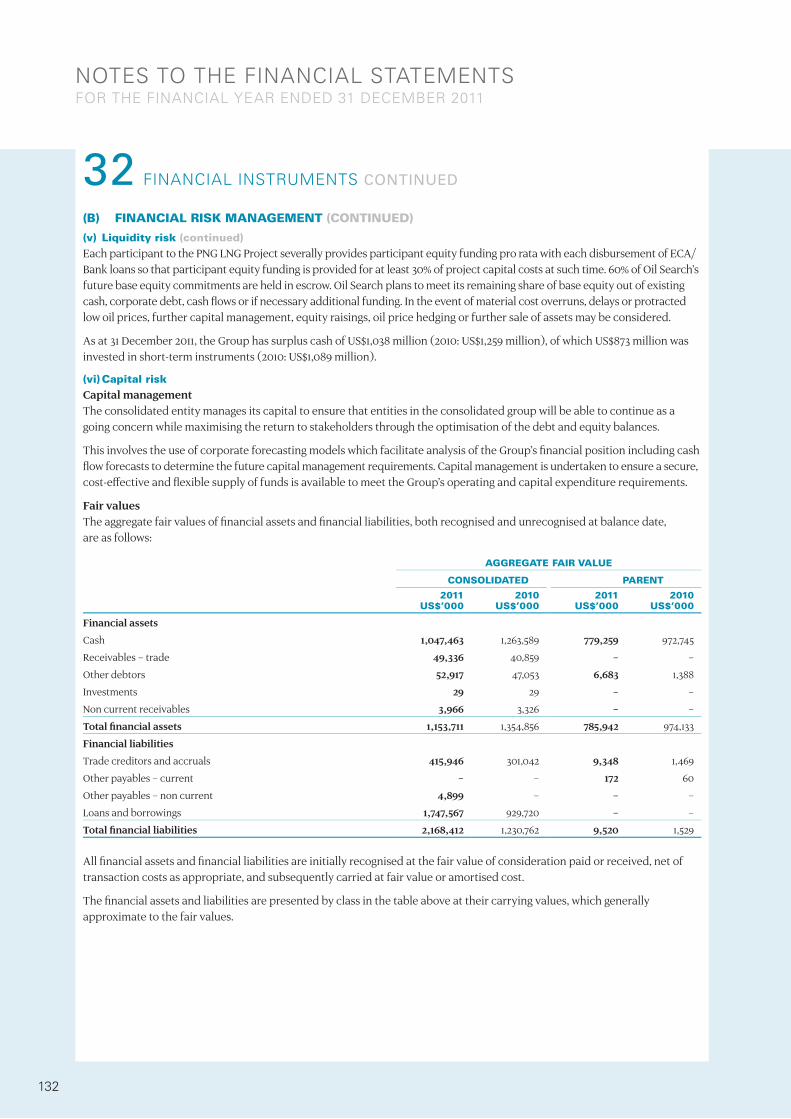
notes to tHe financial statementsfoR tHe financial YeaR enDeD 31 DecemBeR 2011
32 financial instRuments ContInuEd
(B) FINANCIAL RISk MANAGEMENT (CONTINUED)
(v) Liquidity risk (continued)Each participant to the PNG LNG Project severally provides participant equity funding pro rata with each disbursement of ECA/Bank loans so that participant equity funding is provided for at least 30% of project capital costs at such time. 60% of Oil Search’s future base equity commitments are held in escrow. Oil Search plans to meet its remaining share of base equity out of existing cash, corporate debt, cash flows or if necessary additional funding. In the event of material cost overruns, delays or protracted low oil prices, further capital management, equity raisings, oil price hedging or further sale of assets may be considered.
As at 31 December 2011, the Group has surplus cash of US$1,038 million (2010: US$1,259 million), of which US$873 million was invested in short-term instruments (2010: US$1,089 million).
(vi) Capital riskCapital management The consolidated entity manages its capital to ensure that entities in the consolidated group will be able to continue as a going concern while maximising the return to stakeholders through the optimisation of the debt and equity balances.
This involves the use of corporate forecasting models which facilitate analysis of the Group’s financial position including cash flow forecasts to determine the future capital management requirements. Capital management is undertaken to ensure a secure, cost-effective and flexible supply of funds is available to meet the Group’s operating and capital expenditure requirements.
Fair values The aggregate fair values of financial assets and financial liabilities, both recognised and unrecognised at balance date, are as follows:
AGGREGATE FAIR VALUE
CONSOLIDATED PARENT
2011US$’000
2010US$’000
2011US$’000
2010US$’000
Financial assets
Cash 1,047,463 1,263,589 779,259 972,745
Receivables – trade 49,336 40,859 – –
Other debtors 52,917 47,053 6,683 1,388
Investments 29 29 – –
Non current receivables 3,966 3,326 – –
Total financial assets 1,153,711 1,354,856 785,942 974,133
Financial liabilities
Trade creditors and accruals 415,946 301,042 9,348 1,469
Other payables – current – – 172 60
Other payables – non current 4,899 – – –
Loans and borrowings 1,747,567 929,720 – –
Total financial liabilities 2,168,412 1,230,762 9,520 1,529
All financial assets and financial liabilities are initially recognised at the fair value of consideration paid or received, net of transaction costs as appropriate, and subsequently carried at fair value or amortised cost.
The financial assets and liabilities are presented by class in the table above at their carrying values, which generally approximate to the fair values.
132

DiRectoRs’ DeclaRation31 DecemBeR 2011
In accordance with a resolution of the directors of Oil Search Limited, the Directors declare that:
(a) the attached financial statements and notes thereto of the Company and of the consolidated entity:
(i) give a true and fair view of the Company’s and consolidated entity’s financial position as at 31 December 2011 and their performance for the year ended on that date; and
(ii) comply with International Financial Reporting Standards; and
(iii) the attached financial statements and notes thereto comply with the reporting requirements of the Australian Securities Exchange Listing Rules; and
(b) in the opinion of the Directors, there are reasonable grounds to believe that the Company will be able to pay its debts as and when they become due or payable.
This declaration has been made after receiving unqualified declarations from the Managing Director and the Chief Financial Officer, that are consistent with requirements under section 295A of the Australian Corporations Act 2001, for the year ended 31 December 2011.
Signed in accordance with a resolution of the Directors.
On behalf of the Board of Directors
BF HORWOOD Chairman
PR BOTTEN Managing Director
Sydney, 20 February 2012
133

inDepenDent auDitoR’s RepoRtto tHe memBeRs of oil seaRcH limiteD
Liability limited by a scheme approved under Professional Standards Legislation. Member of Deloitte Touche Tohmatsu Limited.
Independent Auditor’s Report to the members of Oil Search Limited
Report on the Financial Report We have audited the accompanying financial statements of Oil Search Limited (the Company), which comprises the statement of financial position as at 31 December 2011, the statement of comprehensive income, the statement of cash flows and the statement of changes in equity for the year ended on that date, notes comprising a summary of significant accounting policies and other explanatory information, and the directors’ declaration of the consolidated entity comprising the Company and the entities it controlled at the year’s end or from time to time during the financial year as set out on pages92 to 133. Directors’ Responsibility for the Financial Statements The directors of the Company are responsible for the preparation of financial statements that give a true and fair view in accordance with International Financial Reporting Standards (including the interpretations of the International Financial Reporting Interpretations Committee) and the PNGCompanies Act 1997 and for such internal control as the directors determine is necessary to enable the preparation of financial statements that is free from material misstatement, whether due to fraud or error. Auditor’s Responsibility Our responsibility is to express an opinion on the financial report based on our audit. We conducted our audit in accordance with International Standards of Auditing. Those standards require that we comply with relevant ethical requirements relating to audit engagements and plan and perform the audit to obtain reasonable assurance whether the financial report is free from material misstatement. An audit involves performing procedures to obtain audit evidence about the amounts and disclosures in the financial report. The procedures selected depend on the auditor’s judgement, including the assessment of the risks of material misstatement of the financial report, whether due to fraud or error. In making those risk assessments, the auditor considers internal control, relevant to the entity’s preparation of the financial report that gives a true and fair view, in order to design audit procedures that are appropriate in the circumstances, but not for the purpose of expressing an opinion on the effectiveness of the entity’s internal control. An audit also includes evaluating the appropriateness of accounting policies used and the reasonableness of accounting estimates made by the directors, as well as evaluating the overall presentation of the financial statements. We believe that the audit evidence we have obtained is sufficient and appropriate to provide a basis for our audit opinion.
Deloitte Touche Tohmatsu A.B.N. 74 490 121 060
Grosvenor Place 225 George Street Sydney NSW 2000 PO Box N250 Grosvenor Place Sydney NSW 1220 Australia DX 10307SSE
Tel: +61 (0) 2 9322 7000 Fax: +61 (0) 2 9322 7001 www.deloitte.com.au
Deloitte Touche Tohmatsu A.B.N. 74 490 121 060
Deloitte Tower, Level 12 Douglas Street Port Moresby PO Box 1275 Port Moresby National Capital District Papua New Guinea
Tel: +675 308 7000 Fax: +675 308 7001 www.deloitte.com.pg
134
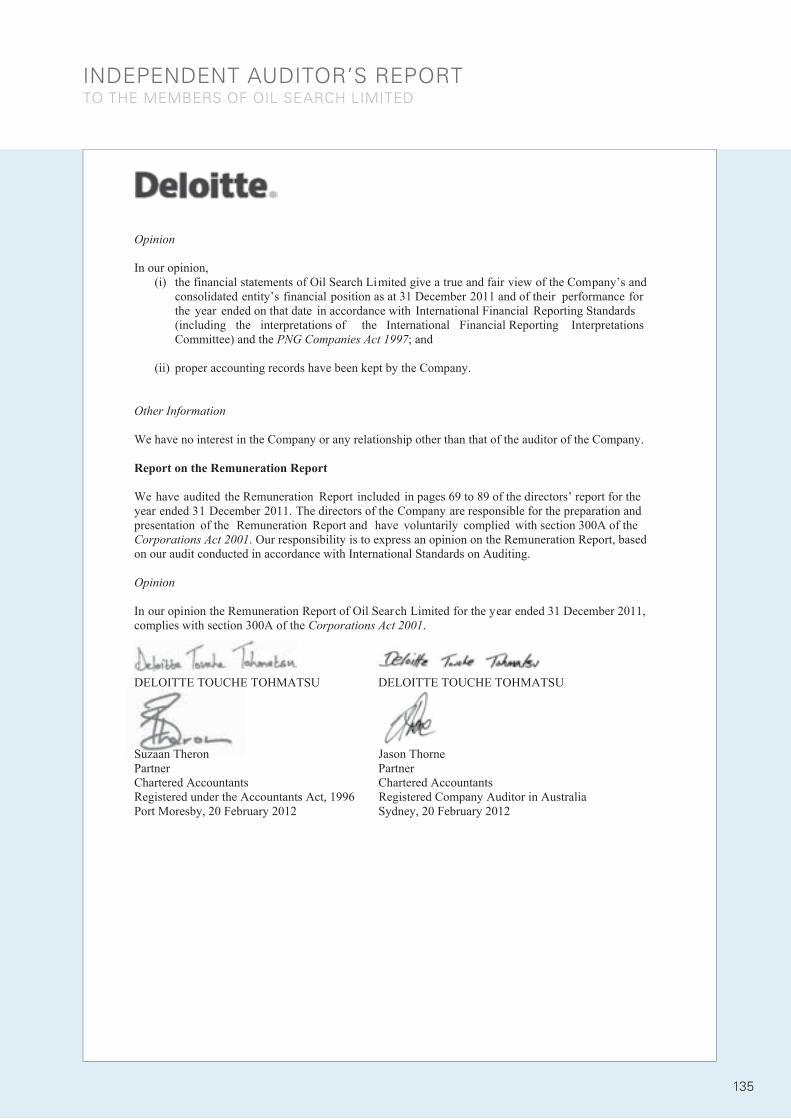
inDepenDent auDitoR’s RepoRtto tHe memBeRs of oil seaRcH limiteD
Opinion In our opinion,
(i) the financial statements of Oil Search Limited give a true and fair view of the Company’s and consolidated entity’s financial position as at 31 December 2011 and of their performance for the year ended on that date in accordance with International Financial Reporting Standards (including the interpretations of the International Financial Reporting Interpretations Committee) and the PNG Companies Act 1997; and
(ii) proper accounting records have been kept by the Company.
Other Information We have no interest in the Company or any relationship other than that of the auditor of the Company. Report on the Remuneration Report We have audited the Remuneration Report included in pages 69 to 89 of the directors’ report for the year ended 31 December 2011. The directors of the Company are responsible for the preparation and presentation of the Remuneration Report and have voluntarily complied with section 300A of the Corporations Act 2001. Our responsibility is to express an opinion on the Remuneration Report, based on our audit conducted in accordance with International Standards on Auditing. Opinion In our opinion the Remuneration Report of Oil Search Limited for the year ended 31 December 2011, complies with section 300A of the Corporations Act 2001. DELOITTE TOUCHE TOHMATSU DELOITTE TOUCHE TOHMATSU Suzaan Theron Jason Thorne Partner Partner Chartered Accountants Chartered Accountants Registered under the Accountants Act, 1996 Registered Company Auditor in Australia Port Moresby, 20 February 2012 Sydney, 20 February 2012
135

sHaReHolDeR infoRmation
OIL SEARCH LIMITEDARBN 055 079 868
(a) The distribution of ordinary shares ranked according to size as at 29 February 2012 was:
SIzE OF HOLDINGNUMBER
OF HOLDERSNUMBER
OF SHARES
% OFISSUED
CAPITAL
1 – 1,000 17,348 8,854,736 0.67
1,001 – 5,000 16,355 40,019,685 3.02
5,001 – 10,000 3,731 27,168,650 2.05
10,001 – 100,000 2,305 50,438,429 3.81
100,001 – 999,999,999 169 1,198,673,671 90.46
39,908 1,325,155,171 100.00
(b) The 20 largest ordinary shareholders representing 85.70% of the ordinary shares as at 29 February 2012 were as follows:
SHAREHOLDERNUMBER
OF SHARES
% OFISSUED
CAPITAL
1 JP Morgan Nominees Australia Limited 279,072,471 21.06
2 HSBC Custody Nominees (Australia) Limited 264,022,225 19.92
3 Independent Public Business Corporation 196,604,177 14.84
4 National Nominees Limited 193,292,572 14.59
5 Citicorp Nominees Pty Limited 63,330,932 4.78
6 Colonial First State Inv Account 30,307,793 2.29
7 Cogent Nominees Pty Limited 20,141,193 1.52
8 Australian Foundation Investment Company Limited 13,515,662 1.02
9 AMP Life Limited 12,586,054 0.95
10 JP Morgan Nominees Australia Limited (Cash Income Account) 11,953,360 0.90
11 RBC Dexia Investor Services Australia Nominees Pty Limited 11,701,684 0.88
12 Cogent Nominees Pty Limited 6,811,430 0.51
13 National Superannuation Fund Limited 6,081,472 0.46
14 Djerriwarrh Investments Limited 4,535,339 0.34
15 Dr Kwok Ching Chow & Mrs Chan Pik Yun Peggy Chow 4,268,880 0.32
16 UBS Wealth Management Australia Nominees Pty Ltd 4,189,509 0.32
17 Mrs Frances Claire Fox 3,973,000 0.30
18 RBC Dexia Investor Services Australia Nominees Pty Ltd 3,412,417 0.26
19 UBS Nominees Pty Ltd 3,015,000 0.23
20 Australian Reward Investment Alliance 2,772,283 0.21
Total 1,135,587,453 85.70
136

sHaReHolDeR infoRmationcontinueD
(c) Issued capital as at 29 February 2012 was: 1,325,155,171 ordinary fully paid shares 1,579,382 unlisted employee options 5,197,932 unlisted performance rights 1,347,091 restricted shares 2,903,700 share appreciation rights
The trustee for the employee share plan holds 2,078,410 shares that are available to satisfy the exercise of employee rights and options and vesting of restricted shares. The shares in the trust are part of the issued capital.
(d) The following interests were registered on the Company’s register of Substantial Shareholders as at 29 February 2012:
SHAREHOLDERNUMBER
OF SHARES
% OF ISSUED
CAPITAL
Independent Public Business Corporation as Trustee of The General Business Trust of Papua New Guinea* 196,604,177 14.97
The Capital Group Companies 152,543,105 11.51
* Independent Public Business Corporation (IPBC) has issued bonds that are exchangeable for IPBC’s Oil Search shares on prescribed terms and conditions to International Petroleum Investment Company (IPIC), a wholly owned subsidiary of the Abu Dhabi Government.
(e) The Company’s ordinary fully paid shares are listed on the Australian Securities Exchange and the Port Moresby Stock Exchange. Shares are also listed in the United States of America, via American Depositary Receipts (ADRs).
(f) At 29 February 2012, 1,487 holders held unmarketable parcels of ordinary shares in the Company.
votIng rIgHtS AttACHEd to or dInAry SHArES1. On a show of hands, one vote per member.
2. On a poll, every member present shall have one vote for every share held by them in the Company.
137
sHaReHolDeR infoRmationcontinueD
ANNUAL MEETINGOil Search’s 2012 Annual Meeting will be held at the Crowne Plaza, Cnr Hunter and Douglas Street, Port Moresby, Papua New Guinea on Tuesday 8 May 2012, commencing at 11am.
2011 FINAL DIVIDENDThe 2011 final dividend will be paid on 10 April 2012 to shareholders registered as at the close of business on 15 March 2012.
The dividend will be paid in PNG Kina for those shareholder domiciled in Papua New Guinea, in GB Pounds for those shareholders that have lodged direct credit details requesting a GB credit with the Company’s share registry, Computershare, and in Australian dollars for all other shareholders. The exchange rates used for converting the US dollar dividend into the payment currencies are the rates as on the record date, 15 March 2012.
The dividend will be unfranked and no withholding tax will be deducted. The Company’s dividend reinvestment plan, which will be underwritten, will operate for the 2011 final dividend.
SHARE REGISTRY:
ENqUIRIESOil Search’s share register is handled by Computershare, the world’s leading transfer agency/share registry. Please contact Computershare for all shareholding and dividend related enquiries.
CHANGE OF SHAREHOLDER DETAILSShareholders should notify Computershare of any changes in shareholder details via the Computershare website (www.computershare.com.au) or in writing (fax, email, mail). Examples of such changes include:
> Registered name > Registered address > Direct credit payment details > Dividend payment currency preference.
Computershare Investor Services Pty Limited
GPO Box 2975 Melbourne VIC 3000, Australia
Telephone: Within Australia: 1300 850 505 Outside Australia: +61 3 9415 4000
Facsimile: +61 3 9473 2500
Email: [email protected]
Website: www.computershare.com.au
138

sHaReHolDeR infoRmationcontinueD
AMERICAN DEPOSITARY RECEIPTS PROGRAMMEBank of New York Mellon ADR Division 22nd Floor 101 Barclay Street New York NY 10286
Telephone within USA: +1 888 269 2377 Telephone outside USA: +1 201 680 6825 Facsimile: +1 212 571 3050
SHARE CODESASX Share Code: OSH ADR Share Code: OISHY
OIL SEARCH WEBSITEA wide range of information on Oil Search is available on the Company’s website, at www.oilsearch.com. As well as reviews of Oil Search’s Board and senior management team, corporate governance practices, activities and sustainability initiatives, the following information for investors is available:
> Share price information. > Dividend information. > Annual reports. > Profit announcements. > Drilling reports. > Press releases. > Quarterly reports. > Presentations. > Archived webcasts.
Investor information, other than about shareholdings and dividends, can be obtained by sending an email to: [email protected]
2012 FINANCIAL CALENDAR(1)
ExPECTED DATE EVENT
Tuesday 24 January 2012 Release of 2011 4th Quarter results
Tuesday 21 February 2012 Release of full year results for 2011
Thursday 8 March 2012 Ex-dividend date for 2011 final dividend
Thursday 15 March 2012 Record date for 2011 final dividend
Thursday 5 April 2012 Release of 2011 Annual Report
Tuesday 10 April 2012 Payment of 2011 final dividend
Tuesday 24 April 2012 Release of 2012 1st Quarter results
Tuesday 8 May 2012 Annual Meeting
Tuesday 24 July 2012 Release of 2012 2nd Quarter results
Tuesday 21 August 2012 Release of interim results for 2012
Friday 7 September 2012 Ex-dividend date for 2012 interim dividend
Thursday 13 September 2012 Record date for 2012 interim dividend
Monday 8 October 2012 Payment of 2012 interim dividend
Tuesday 23 October 2012 Release of 2012 3rd Quarter results
Monday 31 December 2012 End of Financial Year
(1) Dates are subject to change.
139

coRpoRate DiRectoRY
SENIOR MANAGEMENTPeter Botten CBE Managing Director (Australia)
Gerea Aopi CBE Executive General Manager, External and Government Affairs and Sustainability - Executive Director (Papua New Guinea)
Philip Caldwell Executive General Manager, PNG LNG (Papua New Guinea)
Paul Cholakos Executive General Manager, Project Development (Australia)
Paul Crute Executive General Manager, Human Resources, Health and Administration (Australia)
Stephen Gardiner Executive General Manager, Corporate Services, Sustainability and Group Secretary (Australia)
Carleton Nothling Acting Executive General Manager, Gas Growth (Australia)
Richard Robinson Executive General Manager, PNG Operations (Papua New Guinea)
Zlatko Todorcevski Executive General Manager, Finance and Treasury – Chief Financial Officer (Australia)
REGISTERED OFFICEOil Search (PNG) Limited 7th Floor Credit House Cuthbertson Street Port Moresby Papua New Guinea
PO Box 842 Port Moresby Papua New Guinea
Telephone: +675 322 5599 Facsimile: +675 322 5566
AUSTRALIAN OFFICESPapuan Oil Search Limited
Sydney officeLevel 27 Angel Place 123 Pitt Street Sydney NSW 2000
GPO Box 2442 Sydney NSW 2001
Telephone: +61 2 8207 8400 Facsimile: +61 2 8207 8500
Brisbane office 555 Coronation Drive Cnr Landsborough Terrace Toowong QLD 4066
PO Box 2270 Toowong QLD 4066
Telephone: +61 7 3114 1799 Facsimile: +61 7 3114 1750
DUBAI OFFICE Oil Search (Middle Eastern) Limited Al Attar Business Tower Level 8, Office 802 Sheikh Zayed Road Dubai United Arab Emirates
Telephone: +971 4 331 4884 Facsimile: +971 4 331 1610
IRAq OFFICE Oil Search (Iraq) Limited Block 3, Floor 4 Girdi Sarchinar Baharan Apartments Sulaymaniyah, KRG, Iraq
Telephone: +964 0 53 318 8581
TUNISIAN OFFICE Oil Search (Tunisia) Limited Bureau B1, Entree B bis, Immeuble Kenzet Rue du lac Tchad, Les Berges du Lac 1053, Tunis Tunisia
Telephone: +216 71 860 532 Facsimile: +216 71 960 473
YEMEN OFFICEOil Search (ROY) Limited PO Box 16380 Sana’a Republic of Yemen
Telephone: +967 1 423 440/441/422 Facsimile: +967 1 410 314
140

glossaRY of teRms
1CLow estimate of contingent resources
1PProven reserves
2CBest estimate of contingent resources
2PProven and Probable reserves
BARREL/BBLThe standard unit of measurement for all production and sales – one barrel equals 159 litres or 35 Imperial gallons
BCF/BSCFBillion standard cubic feet where a billion is defined as 109. On average 1 bscf of sales gas = 1.055 petajoules
BOEBarrels of oil equivalent – the factor used to convert volumes of different hydrocarbon production to barrels of oil equivalent. Conversion rate used by Oil Search for gas is 6,000 cubic feet gas is equivalent to 1 barrel of oil
BOPDBarrels of oil per day
BTUBritish Thermal Units, a measure of thermal energy. 1 BTU is equivalent to 1,055 joules
DEVELOPMENT WELLWells designed to produce hydrocarbons from a gas or oil field within a proven productive reservoir defined by exploration or appraisal drilling
GOR Gas to oil ratio
HYDROCARBONSSolid, liquid or gas compounds of the elements hydrogen and carbon
LNGLiquefied natural gas
LPGLiquid petroleum gas
MDMillidarcy is a unit measure of permeability
MENAMiddle East/North Africa
MMBBLMillion barrels
MMSCF/DMillion standard cubic feet per day
MTPAMillion tonnes per annum (LNG)
PDLPetroleum Development Licence
PJPetajoules – joules are the metric measurement unit for energy – a petajoule is equal to 1 joule x 1015
PLPipeline Licence
PNG Papua New Guinea
PNG LNG PROJECT OPERATOREsso Highlands Limited, a subsidiary of Exxon Mobil Corporation (ExxonMobil)
PPFLPetroleum Processing Facilities Licence
PPLPetroleum Prospecting Licence
PRLPetroleum Retention Licence
SEISMIC SURVEYA survey used to gain an understanding of rock formations beneath the earth’s surface
TCFTrillion cubic feet (measurement of gas volume)
WILDCATSExploration wells testing new play concepts or structures distanced from current fields
DEFINITION OF RESERVES AND CONTINGENT RESOURCESEstimates of reserves and contingent resources are conducted to Society of Petroleum Engineers (SPE) standards on a Proven (1P and 1C) and Proven and Probable (2P and 2C) basis.
Proven ReservesProven reserves are the estimated quantities of crude oil, natural gas and natural gas liquids which geological and engineering data demonstrate with reasonable certainty to be recoverable in future years from known reservoirs under existing economic and operating conditions. Proven reserves are limited to those quantities of oil and gas which can be expected, with little doubt, to be recoverable commercially at current prices and costs, under existing regulatory practices and with existing conventional equipment and operating methods. Proven (1P) reserves are probabilistically calculated reserves having a 90 per cent confidence level (P90); such reserves have a 90 per cent likelihood of being equalled or exceeded.
Probable ReservesProbable reserves are those reserves which geological and engineering data demonstrate to be potentially recoverable, but where some element of risk or insufficient data prevent classification as proven. Probable reserves are calculated by subtracting proven reserves from those probabilistically calculated reserves having a 50 per cent confidence level (P50). Therefore, “Proven plus Probable” (2P) reserves are defined as those reserves which have a 50 per cent likelihood of being equalled or exceeded.
CONTINGENT RESOURCESThe Company’s technically recoverable resources for its discovered but uncommercialised gas fields are classified as contingent resources. These resources would be expected to be booked in the reserves category once commercialisation arrangements have been finalised.
2C denotes the best estimate of contingent resources.
141

ten YeaR summaRY(1)(2)
2011US$ 000
2010US$ 000
2009US$ 000
2008US$ 000
2007US$ 000
2006US$ 000
2005US$ 000
RESTATED20042
US$ 0002003
US$ 0002002
US$ 000
INCOME STATEMENT
Revenue from operations 732,869 583,560 512,154 814,330 718,755 644,534 663,993 416,296 350,801 233,003 Other income/(expenses) – – – – 803 4,000 (479) 837 – – Foreign exchange (losses)/gains (1,173) 2,077 2,455 (992) (1,423) (886) (1,076) (620) 2,716 1,505 Operating expenses (113,938) (97,290) (94,494) (107,225) (104,702) (91,140) (99,022) (75,461) (103,595) (65,172)Net corporate costs (21,875) (16,635) (10,728) (8,052) (15,214) (11,751) (9,596) (10,224) (10,867) (8,665)EBITDAX3 595,883 471,712 409,387 698,061 598,219 544,757 553,820 330,828 239,055 160,671 Amortisation and depreciation (49,744) (42,744) (96,860) (117,311) (124,822) (98,421) (85,013) (62,981) (73,655) (61,910)Amortisation – site restoration (1,563) (7,130) (8,556) (9,919) (11,117) (4,554) (9,725) (6,112) (5,960) (3,613)Amortisation negative goodwill – – – – – – – – 9,428 5,576 Business development costs (10,295) (6,154) (4,738) – – – – – – –Exploration costs expensed and written-off (60,633) (125,034) (70,991) (91,234) (163,324) (46,765) (37,334) (64,276) (12,467) (13,982)EBIT 473,648 290,650 228,242 479,597 298,956 395,017 421,748 197,459 156,401 86,742 Net interest and borrowing costs (658) (826) (3,326) 6,093 22,791 21,802 (2,035) (4,158) (8,074) (3,853)Capital profit 138 3,158 14,914 126,145 1,291 258,321 4,663 9,621 5,575 1,734 Acquisition accounting adjustment – – – – – – 350 7,497 – – Net impairment reversals/(losses) (33,227) (15,808) – (91,530) 129 (65,180) – – – – Operating profit before income tax 439,901 277,174 239,830 520,305 323,167 609,960 424,726 210,419 153,902 84,623 Income tax expense (237,418) (91,572) (106,150) (206,943) (185,972) (197,978) (224,548) (103,138) (68,224) (37,623)Net profit after income tax, significant items 202,483 185,602 133,680 313,362 137,195 411,982 200,178 107,281 85,678 47,000 Significant items (33,227) 41,488 34,058 73,396 (3,621) 204,437 – – – – Net profit after tax, before significant items 235,710 144,114 99,622 239,966 140,816 207,545 200,178 107,281 85,678 47,000
Dividends paid – ordinary (52,663) (52,087) (67,359) (89,415) (89,587) (100,739) (55,896) (33,424) (10,557) – Dividends paid – preference – – – – – – – – (1,158) (2,965)BALANCE SHEET
Total assets 5,702,034 4,370,067 3,077,390 2,005,457 1,833,479 1,802,755 1,519,529 1,329,801 1,377,033 1,197,703 Total cash 1,047,463 1,263,589 1,288,077 534,928 343,578 477,884 212,163 210,367 102,645 60,843 Total debt 1,747,567 929,720 – – – – 126,000 168,000 200,000 192,105 Shareholders’ equity 3,017,232 2,798,467 2,593,181 1,593,227 1,389,132 1,340,980 1,020,713 869,747 846,385 787,314 OTHER INFORMATION
Average realised oil price (US$/bbl) 116.09 80.19 65.40 100.10 77.78 67.22 58.06 41.65 29.80 24.87Average realised gold price (US$/ounce) N/A N/A N/A N/A N/A N/A N/A N/A 361.00 320.00Net annual oil production (mmstb) 5.76 6.77 7.20 7.71 8.98 9.22 11.15 10.00 9.51 7.70Net annual gas production (bcf)4 5.56 5.35 5.52 5.35 4.80 5.13 5.40 5.50 5.30 3.80Total BOE net annual production (mmboe) 6.69 7.66 8.12 8.60 9.78 10.20 12.18 11.05 10.40 8.34Net annual gold production (ounces) N/A N/A N/A N/A N/A N/A N/A N/A 161,475 108,979 Exploration and evaluation expenditure incurred (US$’000) 144,606 175,980 438,922 257,286 222,391 120,929 78,624 75,556 52,908 28,629 Assets in development expenditure incurred (US$’000) 1,286,542 1,139,058 – 4,214 37,617 294 104,625 6,145 27,165 57,671 Producing assets expenditure incurred (US$’000) 129,396 41,850 142,325 157,584 57,219 143,367 76,799 45,815 – –Operating cash flow (US$’000) 386,193 346,675 284,099 507,423 326,783 398,978 357,715 276,716 191,257 127,915Operating cash flow per ordinary share (US cents) 29.3 26.5 24.5 45.3 29.2 35.6 32.0 24.8 17.3 13.0Diluted EPS (including significant items) (US cents) 15.3 14.1 11.5 27.8 12.2 36.6 17.8 9.6 7.7 4.5Basic EPS (excluding significant items) (US cents) 17.9 11.0 8.6 21.4 12.6 18.5 17.9 13.5 7.7 4.5Ordinary dividend per share (US cents) 4.0 4.0 4.0 8.0 8.0 8.0 5.0 4.0 1.0 1.0Special dividend per share (US cents) – – – – – – 2.0 – 1.0 –Gearing (%)5 18.8% – – – – – – – 10.3% 14.3%Return on average shareholders’ funds (%) 7.0% 6.9% 6.4% 21.0% 10.1% 34.9% 21.2% 12.5% 10.5% 7.3%Number of issued shares – ordinary (000’s) 1,325,155 1,312,888 1,299,562 1,119,841 1,119,841 1,119,841 1,118,895 1,114,385 1,113,790 1,088,429Number of issued shares – preference (000’s) – – – – – – – – – 802ExCHANGE RATES Year end A$: US$ 1.016 1.016 0.897 0.693 0.791 0.791 0.734 0.779 0.743 0.556 Average A$: US$ 1.032 0.919 0.792 0.868 0.836 0.752 0.762 0.737 0.653 0.539
(1) Prior year comparatives have been restated where necessary, in order to achieve consistency with current year disclosures.(2) Reflects changes in accounting policies.(3) Earnings before interest, borrowing costs, tax, depreciation and amortisation, exploration and business development costs expensed.(4) Hides gas production for 2008 onwards includes vent gas. Vent gas not reported prior to 2008. (5) Net debt / (net debt & shareholders’ funds).
142

2011
US$ 0002010
US$ 0002009
US$ 0002008
US$ 0002007
US$ 0002006
US$ 0002005
US$ 000
RESTATED20042
US$ 0002003
US$ 0002002
US$ 000
INCOME STATEMENT
Revenue from operations 732,869 583,560 512,154 814,330 718,755 644,534 663,993 416,296 350,801 233,003 Other income/(expenses) – – – – 803 4,000 (479) 837 – – Foreign exchange (losses)/gains (1,173) 2,077 2,455 (992) (1,423) (886) (1,076) (620) 2,716 1,505 Operating expenses (113,938) (97,290) (94,494) (107,225) (104,702) (91,140) (99,022) (75,461) (103,595) (65,172)Net corporate costs (21,875) (16,635) (10,728) (8,052) (15,214) (11,751) (9,596) (10,224) (10,867) (8,665)EBITDAX3 595,883 471,712 409,387 698,061 598,219 544,757 553,820 330,828 239,055 160,671 Amortisation and depreciation (49,744) (42,744) (96,860) (117,311) (124,822) (98,421) (85,013) (62,981) (73,655) (61,910)Amortisation – site restoration (1,563) (7,130) (8,556) (9,919) (11,117) (4,554) (9,725) (6,112) (5,960) (3,613)Amortisation negative goodwill – – – – – – – – 9,428 5,576 Business development costs (10,295) (6,154) (4,738) – – – – – – –Exploration costs expensed and written-off (60,633) (125,034) (70,991) (91,234) (163,324) (46,765) (37,334) (64,276) (12,467) (13,982)EBIT 473,648 290,650 228,242 479,597 298,956 395,017 421,748 197,459 156,401 86,742 Net interest and borrowing costs (658) (826) (3,326) 6,093 22,791 21,802 (2,035) (4,158) (8,074) (3,853)Capital profit 138 3,158 14,914 126,145 1,291 258,321 4,663 9,621 5,575 1,734 Acquisition accounting adjustment – – – – – – 350 7,497 – – Net impairment reversals/(losses) (33,227) (15,808) – (91,530) 129 (65,180) – – – – Operating profit before income tax 439,901 277,174 239,830 520,305 323,167 609,960 424,726 210,419 153,902 84,623 Income tax expense (237,418) (91,572) (106,150) (206,943) (185,972) (197,978) (224,548) (103,138) (68,224) (37,623)Net profit after income tax, significant items 202,483 185,602 133,680 313,362 137,195 411,982 200,178 107,281 85,678 47,000 Significant items (33,227) 41,488 34,058 73,396 (3,621) 204,437 – – – – Net profit after tax, before significant items 235,710 144,114 99,622 239,966 140,816 207,545 200,178 107,281 85,678 47,000
Dividends paid – ordinary (52,663) (52,087) (67,359) (89,415) (89,587) (100,739) (55,896) (33,424) (10,557) – Dividends paid – preference – – – – – – – – (1,158) (2,965)BALANCE SHEET
Total assets 5,702,034 4,370,067 3,077,390 2,005,457 1,833,479 1,802,755 1,519,529 1,329,801 1,377,033 1,197,703 Total cash 1,047,463 1,263,589 1,288,077 534,928 343,578 477,884 212,163 210,367 102,645 60,843 Total debt 1,747,567 929,720 – – – – 126,000 168,000 200,000 192,105 Shareholders’ equity 3,017,232 2,798,467 2,593,181 1,593,227 1,389,132 1,340,980 1,020,713 869,747 846,385 787,314 OTHER INFORMATION
Average realised oil price (US$/bbl) 116.09 80.19 65.40 100.10 77.78 67.22 58.06 41.65 29.80 24.87Average realised gold price (US$/ounce) N/A N/A N/A N/A N/A N/A N/A N/A 361.00 320.00Net annual oil production (mmstb) 5.76 6.77 7.20 7.71 8.98 9.22 11.15 10.00 9.51 7.70Net annual gas production (bcf)4 5.56 5.35 5.52 5.35 4.80 5.13 5.40 5.50 5.30 3.80Total BOE net annual production (mmboe) 6.69 7.66 8.12 8.60 9.78 10.20 12.18 11.05 10.40 8.34Net annual gold production (ounces) N/A N/A N/A N/A N/A N/A N/A N/A 161,475 108,979 Exploration and evaluation expenditure incurred (US$’000) 144,606 175,980 438,922 257,286 222,391 120,929 78,624 75,556 52,908 28,629 Assets in development expenditure incurred (US$’000) 1,286,542 1,139,058 – 4,214 37,617 294 104,625 6,145 27,165 57,671 Producing assets expenditure incurred (US$’000) 129,396 41,850 142,325 157,584 57,219 143,367 76,799 45,815 – –Operating cash flow (US$’000) 386,193 346,675 284,099 507,423 326,783 398,978 357,715 276,716 191,257 127,915Operating cash flow per ordinary share (US cents) 29.3 26.5 24.5 45.3 29.2 35.6 32.0 24.8 17.3 13.0Diluted EPS (including significant items) (US cents) 15.3 14.1 11.5 27.8 12.2 36.6 17.8 9.6 7.7 4.5Basic EPS (excluding significant items) (US cents) 17.9 11.0 8.6 21.4 12.6 18.5 17.9 13.5 7.7 4.5Ordinary dividend per share (US cents) 4.0 4.0 4.0 8.0 8.0 8.0 5.0 4.0 1.0 1.0Special dividend per share (US cents) – – – – – – 2.0 – 1.0 –Gearing (%)5 18.8% – – – – – – – 10.3% 14.3%Return on average shareholders’ funds (%) 7.0% 6.9% 6.4% 21.0% 10.1% 34.9% 21.2% 12.5% 10.5% 7.3%Number of issued shares – ordinary (000’s) 1,325,155 1,312,888 1,299,562 1,119,841 1,119,841 1,119,841 1,118,895 1,114,385 1,113,790 1,088,429Number of issued shares – preference (000’s) – – – – – – – – – 802ExCHANGE RATES Year end A$: US$ 1.016 1.016 0.897 0.693 0.791 0.791 0.734 0.779 0.743 0.556 Average A$: US$ 1.032 0.919 0.792 0.868 0.836 0.752 0.762 0.737 0.653 0.539
(1) Prior year comparatives have been restated where necessary, in order to achieve consistency with current year disclosures.(2) Reflects changes in accounting policies.(3) Earnings before interest, borrowing costs, tax, depreciation and amortisation, exploration and business development costs expensed.(4) Hides gas production for 2008 onwards includes vent gas. Vent gas not reported prior to 2008. (5) Net debt / (net debt & shareholders’ funds).
This report is printed on Monza Recycled and Sumo Offset paper.
Monza Recycled contains 55% recycled fibre (25% post consumer and 30% pre consumer) and FSC Certified pulp, which ensures that all virgin pulp is derived from well-managed forests and controlled sources. It is manufactured by an ISO 14001 certified mill. Monza Recycled is an FSC Mixed Sources Certified paper.
Sumo Offset is an environmentally responsible paper manufactured under the environmental management system ISO 14001 using Elemental Chlorine Free (ECF) pulp sourced from certified, well managed forests. Sumo Offset is FSC Chain of Custody (CoC) certified (mixed sources).
Designed and produced by ArmstrongQ www.armstrongQ.com.au143