OIL REMOVAL FOR PRODUCED WATER TREATMENT AND …
66
OIL REMOVAL FOR PRODUCED WATER TREATMENT AND MICELLAR CLEANING OF ULTRAFILTRATION MEMBRANES A Thesis by SCOTT JAY BEECH Submitted to the Office of Graduate Studies of Texas A&M University in partial fulfillment of the requirements for the degree of MASTER OF SCIENCE August 2006 Major Subject: Biological and Agricultural Engineering
Transcript of OIL REMOVAL FOR PRODUCED WATER TREATMENT AND …
OIL REMOVAL FOR PRODUCED WATER TREATMENT AND
MICELLAR CLEANING OF ULTRAFILTRATION MEMBRANES
A Thesis
by
SCOTT JAY BEECH
Submitted to the Office of Graduate Studies of Texas A&M University
in partial fulfillment of the requirements for the degree of
MASTER OF SCIENCE
August 2006
Major Subject: Biological and Agricultural Engineering

OIL REMOVAL FOR PRODUCED WATER TREATMENT AND
MICELLAR CLEANING OF ULTRAFILTRATION MEMBRANES
A Thesis
by
SCOTT JAY BEECH
Submitted to the Office of Graduate Studies of Texas A&M University
in partial fulfillment of the requirements fro the degree of
MASTER OF SCIENCE
Approved by: Chair of Committee, Bruce J. Lesikar Committee Members, David Burnett Zivko Nikolov Head of Department, Gerald Riskowski
August 2006
Major Subject: Biological and Agricultural Engineering

iii
ABSTRACT
Oil Removal for Produced Water Treatment and Micellar Cleaning of Ultrafiltration
Membranes. (August 2006)
Scott Jay Beech, B.S., Texas A&M University
Chair of Advisory Committee: Dr. Bruce J. Lesikar
Produced water is a major waste produced from oil and natural gas wells in the
state of Texas. This water could be a possible source of new fresh water to meet the
growing demands of the state after treatment and purification. This thesis describes a
research project that evaluated the treatment of brine generated in oil fields (produced
water) with ultrafiltration membranes. The characteristics of various ultrafiltration
membranes for oil and suspended solids removal from produced water were studied to
test whether they could be used in a pretreatment method. The research measured the
effect of pressure and flow rate on performance of three commercially available
membranes for treatment of oily produced water. Oil and suspended solids removal were
measured by using turbidity and oil in water measurements taken periodically.
The study also analyzed the flux through the membrane and any effect it had on
membrane performance. The research showed that an ultrafiltration membrane provided
turbidity removal of over 99% and oil removal of 78% for the produced water samples.
The results indicated that the ultrafiltration membranes would be useful as one of the
first steps in purifying the water.

iv
Membrane cleaning of produced water-fouled membranes by micellar solutions
was investigated. A neutral pH and ambient temperature micelle solution for effective
cleaning of oily water-fouled membranes was developed and studied. The performance
of cleaning solutions on ultrafiltration membranes was investigated on laboratory size
membrane testing equipment. Different micro emulsion solutions were studied to
evaluate the effect of solution properties on cleaning performance. Three types of
multiple membranes were studied, each having the same polyvinylidene fluoride
(PVDF) material but with different nominal separation or flux characteristics. The data
showed that the use of a micelle solution to clean the produced water-fouled membranes
was a feasible and effective method. The study showed with further adjustment of the
micelle solution the cleaning effectiveness could be optimized to provide double the
effectiveness of current industry methods for membranes fouled by produced water.
v
TABLE OF CONTENTS Page ABSTRACT ................................................................................................................ iii
LIST OF TABLES....................................................................................................... vii
LIST OF FIGURES ..................................................................................................... viii
1. INTRODUCTION ................................................................................................... 1
1.1. Background..................................................................................................... 2 1.2. Produced Water Treatment Technologies ...................................................... 3 1.3. Membrane Filtration ....................................................................................... 4
2. MATERIAL AND FEED SAMPLE COLLECTION ............................................. 9
2.1. Feed Sample Collection.................................................................................. 9 2.2. Description of Experimental Setup and Equipment ....................................... 9 2.3. Obtaining Membrane Samples ....................................................................... 12
3. OIL AND SUSPENDED SOLIDS REMOVAL FOR PRODUCED WATER
TREATMENT BY ULTRAFILTRATION MEMBRANES ................................ 13
3.1. Overview......................................................................................................... 13 3.2. Introduction..................................................................................................... 13 3.3. Materials and Methods ................................................................................... 15
3.3.1. Experimental method.......................................................................... 15 3.3.2. Experimental procedure...................................................................... 16 3.3.3. Data analysis....................................................................................... 16 3.3.4. Water sample analysis ........................................................................ 17
3.4. Results............................................................................................................. 18 3.4.1. Flux curves.......................................................................................... 18 3.4.2. Separation performance ...................................................................... 23
3.5. Discussion....................................................................................................... 24 3.5.1. Flux curves.......................................................................................... 24 3.5.2. Water analysis..................................................................................... 25
3.6. Conclusions..................................................................................................... 26
vi
Page
4. MEMBRANE CLEANING AFTER PRODUCED WATER TREATMENT
WITH A MICELLAR SOLUTION........................................................................ 28
4.1. Overview......................................................................................................... 28 4.2. Introduction..................................................................................................... 28 4.3. Materials and Methods ................................................................................... 30
4.3.1. Fouling of membrane samples............................................................ 30 4.3.2. Cleaning of fouled membranes........................................................... 31 4.3.3. Membrane testing ............................................................................... 34
4.4. Results............................................................................................................. 39 4.4.1. Micelle solution test series.................................................................. 39 4.4.2. Cleaning solution flow rate test series ................................................ 42 4.4.3. Contact time test series ....................................................................... 42 4.4.4. Water rinse test series ......................................................................... 43 4.4.5. Membrane type and ambient temperature effect ................................ 43
4.5. Discussion....................................................................................................... 45 4.5.1. Micelle solution test series.................................................................. 45 4.5.2. Cleaning solution flow rate test series ................................................ 45 4.5.3. Micelle solution contact time test series............................................. 46 4.5.4. Water rinse test series ......................................................................... 47 4.5.5. Comparison of micelle solution general effectiveness on different
membranes......................................................................................... 48 4.6. Conclusions..................................................................................................... 50
5. SUMMARY AND CONCLUSIONS...................................................................... 51
6. RECOMMENDATIONS......................................................................................... 53
REFERENCES ............................................................................................................ 54
VITA............................................................................................................................ 58

vii
LIST OF TABLES
TABLE Page
1 Pump flow rate control specification............................................................... 11
2 Membrane specifications ................................................................................. 12
3 Water quality results ........................................................................................ 23
4 Fouling conditions for ultrafiltration membranes............................................ 31
5 Micelle solution characteristics ....................................................................... 32
6 Micelle solution series test conditions............................................................. 35
7 Flow rate test series parameters ....................................................................... 37
8 Water rinsing test series parameters ................................................................ 38
9 Micelle solution testing results ........................................................................ 41
10 Cleaning flow rate test sets .............................................................................. 42
11 Rinse water test series results .......................................................................... 44
viii
LIST OF FIGURES
FIGURE Page
1 GE Sepa™ CF II Med/High Foulant System operation schematic
(modified from [25])................................................................................ 10
2 Laboratory process experimental schematic ............................................ 11
3 Brine fouling curves at TMP of 20 psi (138 kPa), for the two feed flow
rates........................................................................................................... 18
4 Brine fouling curves at TMP of 30 psi (207 kPa), for the two feed flow
rates........................................................................................................... 20
5 Brine fouling curves at TMP of 40 psi (276 kPa), for the two feed flow
rates........................................................................................................... 21
6 Brine flux @ 120 min versus TMP, corrected to 298K and for the two
flow rates ................................................................................................. 22
7 Experiment 1 pure water flux curves........................................................ 40
8 Rinse time comparisons............................................................................ 48
1
1. INTRODUCTION
Advances in membrane technology have allowed the development of an effective
onsite treatment system for the conversion of produced water into a potable fresh water
resource. Produced water represents waste generated by the oil and gas industry. If it is
cleaned and desalinate, it can help in meeting future fresh water needs in the state of
Texas.
The goal of this project was to determine the best membrane technology for the
economical onsite pretreatment of produced water. This project included a study of the
feasibility of using micellar solutions to clean the membrane fouling that occurs during
onsite operation.
The specific objectives of this research has been 1) to determine the most
effective commercial available ultrafiltration membrane and effect of operation
parameters for onsite produced water pretreatment, 2) to determine whether micelle
solutions for membrane cleaning are effective, 3) and to determine effects of different
micelle solution compositions for membrane cleanup.
The research data are compiled and presented as two separate studies:
• The screening and evaluation of the most effective ultrafiltration membranes for
use in oilfield brine pretreatment for turbidity and oil removal to meet feed water
quality requirements for desalination.
• To evaluate cleaning parameters and use of micelle solutions to remove fouling
caused by produced water fouled ultrafiltration membranes under ambient
temperature and pH for an onsite treatment system.
_____________ This thesis follows the style and format of Journal of Membrane Science.
2
1.1. Background
The oil and gas industry produces large amounts of wastewater as one of the
byproduct of production. This wastewater is commonly referred as produced water or
oilfield brine. In Texas, the oil and gas industries produce 250 billion gallons of
produced water annually [1]. This produced water, treated currently as waste, could be a
major resource to reduce water shortages in Texas [1].
Currently produced water is typically disposed in injection wells as waste or for
pressure maintenance of the reservoir [1-2]. Produced water disposal and handling is
covered by the Clean Water Act and United States Environmental Protection Agency
(EPA) and is treated as a non-hazardous waste from oil and gas production and is
exempt from the Resource Conservation and Recovery Act (RCRA) for monitoring
specific constituents [2-3]. These disposal wells are tightly monitored and controlled to
prevent groundwater contamination through overfilling or too high contaminant loads
[3]. These restrictions on injection wells size, depth, and capacity were developed by the
EPA to prevent pollution of current underground fresh water supplies or future sources
of fresh water. The current regulation on produce water is based on the Best Practicable
Technology (BPT) for onshore production [3]. The BPT limit set by the EPA is 35 mg/L
oil and grease daily max for use as an agricultural or wildlife reuse or no onsite
discharge for onshore production facilities [3].
Produced water in Texas has widely varying composition [2, 4]. Produced water
contains suspended oil and grease, organics, dissolved and suspended solids, salts and
various other trace metals. Their characteristics differ depending on the particular
3
location of the oil well. They are typically saline with total dissolved solids (TDS)
concentrations ranging from 100 ppm to over 300,000 ppm [2, 4]. Produced water also
typically contains between 50 to a 100 ppm total oil and grease along with low
concentrations of minor and trace metals [2, 4].
1.2. Produced Water Treatment Technologies
Produced water treatment and purification was accomplished through a variety of
chemical and physical separation techniques. Since produced water composition varies
from location to location, a proven purification method has been difficult to develop.
Depending on the exact characteristic of the particular source of produced water
different pretreatment processed are applied. Hydrocyclones, centrifuges, membrane
filtration, and activated carbon or depth filters are all techniques that have been tested to
perform produced water treatment [2, 4-6]. Removal treatments have concentrated on
suspended solids and oil and grease. Removal of the dissolved and suspended oil and
grease has been especially difficult. Membrane treatment used to reduce or eliminate the
oil and grease also achieved the necessary removal for trace metals. Oil removal to the
35 mg/L required by the EPA precluded the use of hydrocyclones or centrifuges. The
secondary concern is salt removal. The common techniques currently used for
desalination are multistage flash or reverse osmosis [7]. New techniques for desalination
of produced water are being researched including membrane pervaporation [7] and
electrodialysis [8].
Most oil removal technologies cannot achieve the separation required to meet
water quality standards [9]. These separation technology mechanisms did not remove the
entrained or suspended oils. The concern or problem with use of the first two types of
4
technologies for treatment of produced water was that the minute amounts typically
found in produced water sources fall below the required concentration to make the
technology operate efficiently or economically. For example, hydrocyclones are
typically utilized to achieve separation between the crude oil and the brine. The
suspended oil concentration remaining in the produced water was near the minimum that
the separation technologies were able to economically obtain. Absorption techniques can
and would provide separation required but were limited by the suspended solids or by
trace contaminates found in different sources that could react with absorption material
and introduce different contaminates that would later need to be removed. Filtration
techniques were capable of most of the necessary reduction in oil content and suspended
solid removal. Membranes, a type of filtration, technology that provided the separation
while minimizing replacement of filters or membranes.
1.3. Membrane Filtration
Membrane filters are classified into types based on their nominal size or
molecular weight cutoff (MWCO). These classifications are commonly classified as
microfiltration, ultrafiltration, nanofiltration, and reverse osmosis and correspond to the
size of particle that is rejected by the membrane. Microfiltration rejects suspended solids
ranging from 0.10 μm to about 100 μm [10]. Ultrafiltration membranes provide
separation from 1000 to 100,000 MWCO or 0.001 μm to 0.02 μm for macromolecules
and suspended solids [10]. Nanofiltration membranes increase the rejected range to
include sugars, divalent salts, and dissociated acids below the 1000 MWCO range [10].
Reverse osmosis membranes are normally classified for ideal rejection of all components
except solvent (e.g., water) [10].

5
The membrane technologies are also developed into four configurations for
industrial applications. These four configurations are tubular membranes, hollow fibers,
plate and frame, and spiral membranes. Each configuration has distinct advantages or
disadvantages in their operation. Tubular membranes are able to handle larger size
particles, higher flow rates, easier cleaning by clean-in-place techniques, but lowest
surface area to volume ratio [10]. Hollow fiber membranes have the characteristics of
highest surface area to volume ratio, back flushing capability, but require smaller
particles in the feed to prevent plugging [10]. Plate and frame membranes provide easy
onsite membrane replacement and visual observation of permeate for sample collection
and detection of leaks [10]. Spiral membranes provide turbulent flow due to the feed
spacers breaking up the laminar flow and adding turbulence, fairly high surface area to
volume ratio, and lowest energy consumption due to low flow rates, pressure drops, and
relatively high turbulence.
Membrane filtration technology developments are resulting in an increasing
range of material of construction, provide better membrane performance, higher
temperature limits, and larger pH ranges. The membranes currently being manufactured
include cellulose acetate, polysulfone, polyamide, nylon, PVDF, polytetrafluoroethylene,
polypropylene, and others [10]. These materials provide increased temperature, pH, and
chemical compatibility ranges. Also, membranes have been developed with different
membrane structures including thin film composites [10].
Membrane filtration operations are affected by the feed water composition,
temperature, and flow rate and turbulence [10]. These factors affect the flux of the
membrane due to concentration polarization of the membrane [10]. Concentration

6
polarization refers to the development of another layer on the membrane surface besides
the boundary layer and the membrane that provides resistance to permeate flow.
Concentration polarization effects can be minimized by increasing cross flow velocity or
turbulence and lowering transmembrane pressure (TMP) with varying membrane
configurations.
Fouling also occurs during membrane operation. Fouling is the result of
interactions between the membrane surface chemistry and the solutes being separated.
Membrane fouling by minerals, organics, particles and colloids, and microbial growth is
a major operational factor that requires periodic cleaning [11-15]. Any of these four
types of membrane fouling may occur during membrane filtration depending on the
nature of the feed. Fouling of membranes is considered a consequence of the separation
process itself [15]. The fouling of the membrane surface requires techniques to remove
the fouling layers. Both physical and chemical methods are employed. Important
parameters when cleaning fouling are the type of fouling, cleaning agent, pH,
concentration, temperature, and time [11-12, 14-15]. The typical cleaning agents for
membrane cleaning are bases, acids, enzymes, surface active agents, sequestering agents,
detergents, and disinfectants [11-12]. Each type of cleaning agent has benefits and
drawbacks for use with produced water. For example, an acid cleaning of an oily
wastewater ultrafiltration membrane resulted in an appreciable increase of permeate flux
but became time dependent, while an alkaline solution resulted in a lower flux with time
independence [12]. Studies have been reported that examined the effect of chemical and
physical aspects of cleaning organic fouled membranes [16], enzymatic cleaning [17],
and biological cleaning [18]. In 2005, Ang, Lee, Eleimelech showed that the by
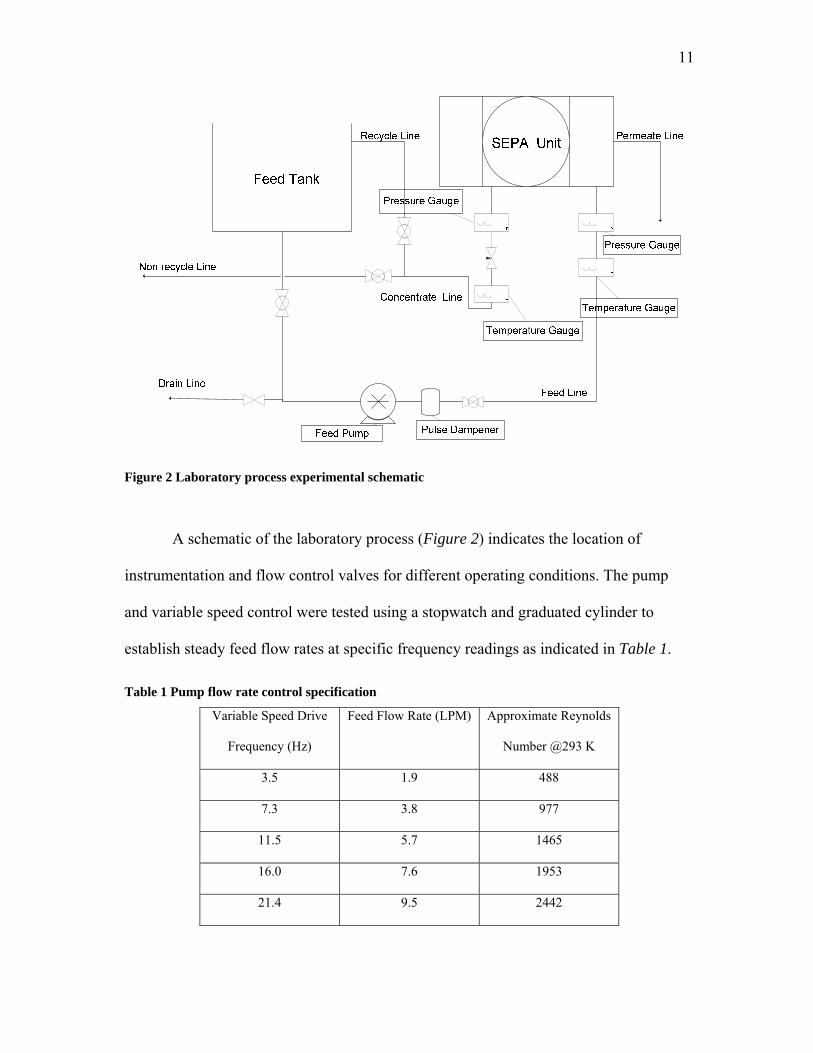
7
optimizing the chemical reaction between the organic foulant and the cleaning chemical
along with physical components of cleaning an efficient cleaning procedure was
developed for the organic fouled reverse osmosis membranes [16]. Enzymatic cleaning
of protein and lipid fouled ultrafiltration membranes were shown to be an effective
method to recover the membrane flux by using specific enzymes to remove the protein
and lipid fouling the membrane surface [17]. Also in 2005, Pavlova showed that
biological fouling could be treated similarly with the disinfectants specific to the
membrane chemistry [18].
Membrane filtration has been proven effective in treating oily water in other
industries including municipal wastewater [19-21], engine rooms [22], and industrial
wastewater [2,4-6, 21]. Membrane technologies also have been utilized in the production
of fresh water from surface water [23] and seawater [2, 4-6, 19-20, 22]. The cost
effective use of membrane technology is determined by the reliability of the system and
maintenance of the permeate flow rate. The industry has developed a wide range of
materials and techniques to improve the efficiency and applications of the membranes
compared to the first cellulose acetate membranes. These new materials allow the
technology to be used with new feeds including produced water. Membranes available
for industrial use include thin film polyamide membranes on a polysulfone support,
ceramic membranes, and stainless steel [10]. Novel bentonite clay membranes have
been tested for produced water treatment but with high TDS [24].
Produced water with its wide range of composition of feed causes significant
operational problems. These problems include the fouling of the membrane surface, the
loss of flux through the membrane surface, poor rejection characteristics, and membrane

8
failure due to chemical reactions with the membranes. The major operational concern is
typically the fouling of the membranes. For efficient operation, pretreatment reduces the
fouling of the membranes without creating other problems [15]. Also, operation
conditions can be selected to minimize the concentration polarization and membrane
fouling with resultant increased operational permeate flux.
As mentioned, produced water and oily water can cause severe fouling problems
on most membranes. Produced water can cause all four categories of particle, organic,
mineral, biological membrane fouling and must be pretreated to minimize the fouling of
the membranes used for RO desalination. Proper pretreatment and system design should
include steps to reduce the suspended particles, oil and grease, mineral deposit, and
biofilm formation through pretreatment or to select an appropriate membrane
configuration. In actual operation, membrane fouling is not completely avoidable, thus
periodic cleaning is required

9
2. MATERIAL AND FEED SAMPLE COLLECTION
2.1. Feed Sample Collection
Produced water samples were obtained from transport trucks delivering brine to a
Key Energy salt water disposal well in Brazos County, Texas. The raw water feed
samples were stabilized (for transportation and temporary storage) by addition of
commercially available and industry recommended oilfield chemicals, RSI 224sp, RSI
676, and RSI 513. At the pilot plant, the water was pumped through a 10 μm (nominal)
depth filter for bulk particle and oil separation of material possibly added during
transport and collection.
The produced water feed, after filtration, was stored in barrels and sealed to
reduce aeration and increase duration of water stability before 6-8 liter feed samples
were aliquoted for testing. The quality of the produced water was visually monitored for
a noticeable change in produced water color while obtaining feed samples. The stored
feed water was periodically replaced as dictated by a visible color change in feed water
samples.
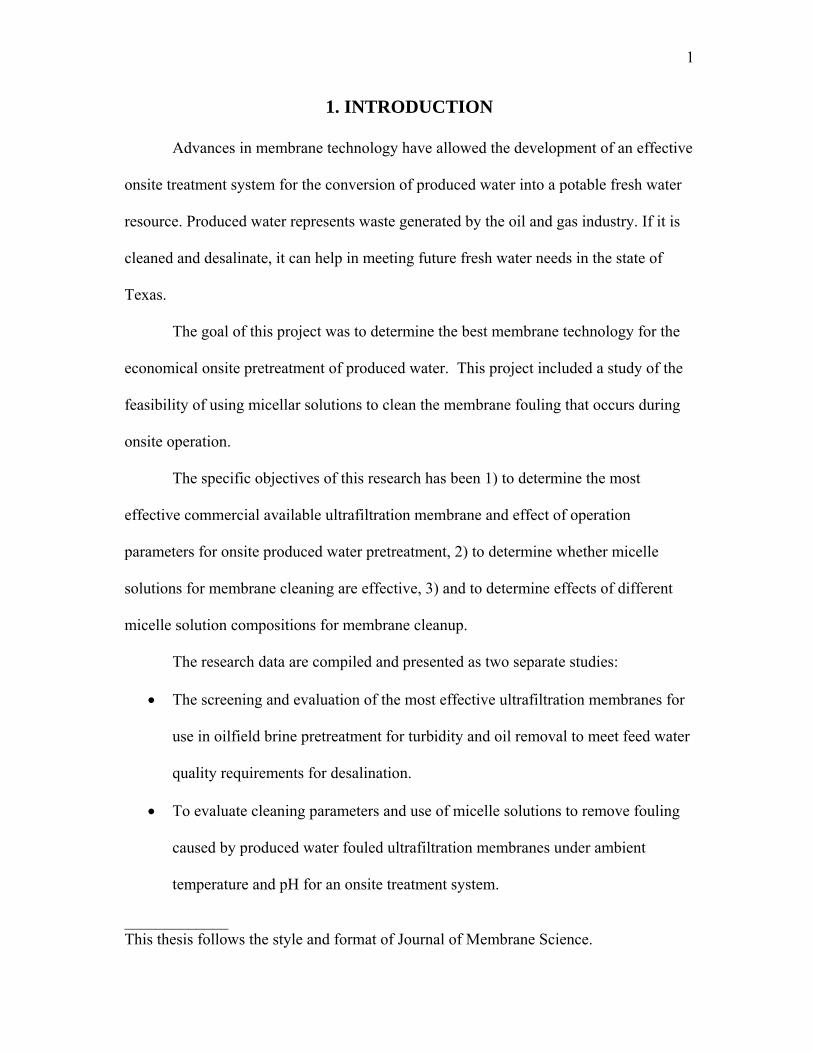
2.2. Description of Experimental Setup and Equipment The experiments were performed by using the GE Sepa™ CF II Med/High
Foulant System (GE, YCFHFSYS01) for membrane testing designed for 140 cm2 flat
sheet membranes shown in Figure 1.

10
Figure 1 GE Sepa™ CF II Med/High Foulant System operation schematic (modified from [25])
Figure 1 shows the placement of the feed spacers, permeate carrier, and
membrane that model operation of spiral membranes. The apparatus includes a 15 liter
feed tank, pulse dampener, high pressure pump with variable speed control, and pressure
and temperature gauges to monitor inlet and outlet conditions.
11
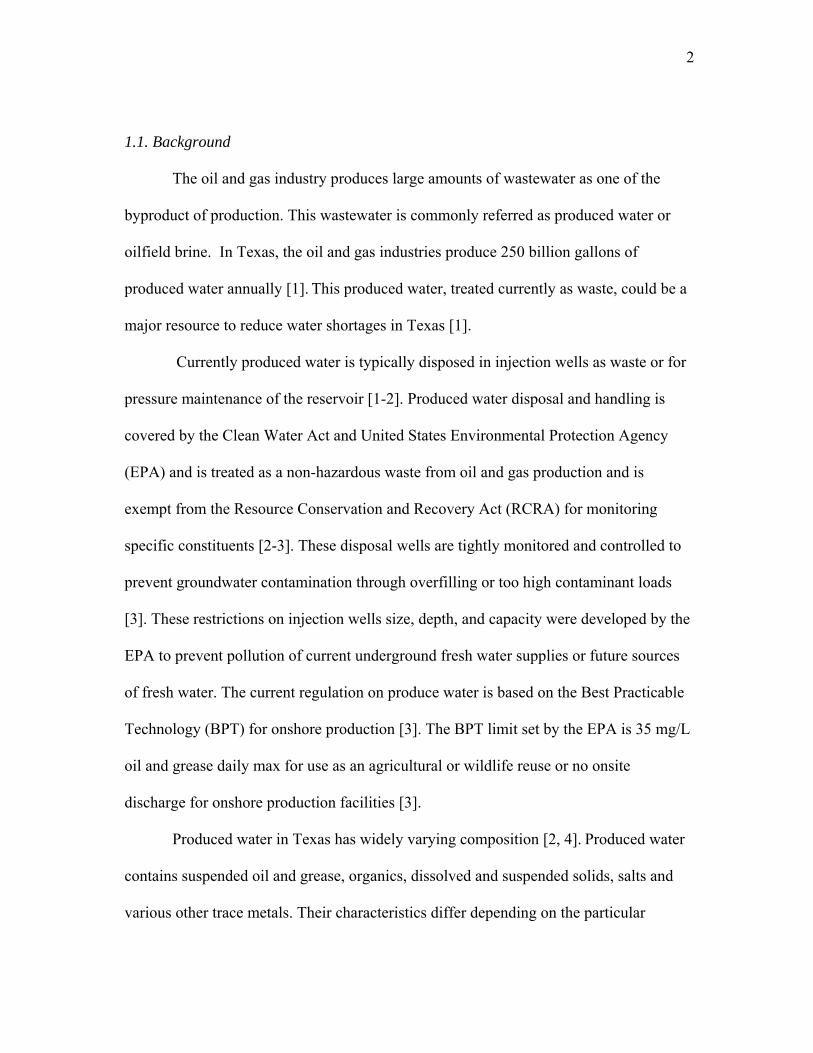
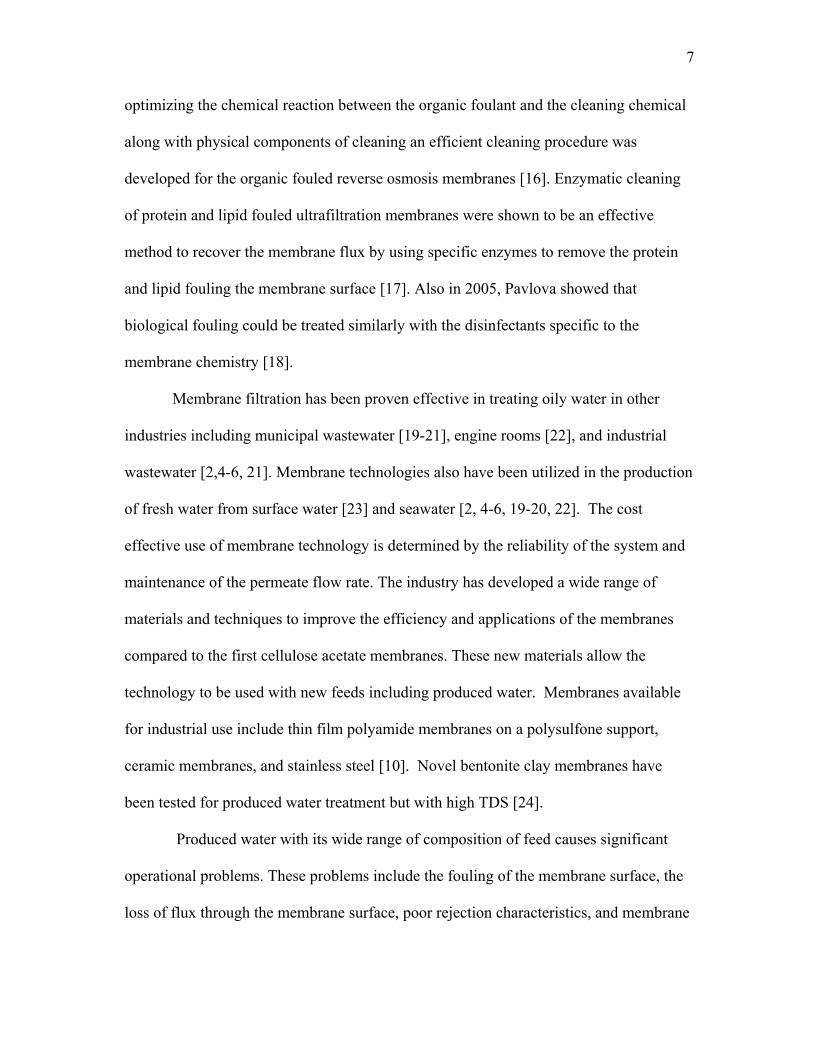
Figure 2 Laboratory process experimental schematic
A schematic of the laboratory process (Figure 2) indicates the location of
instrumentation and flow control valves for different operating conditions. The pump
and variable speed control were tested using a stopwatch and graduated cylinder to
establish steady feed flow rates at specific frequency readings as indicated in Table 1.
Table 1 Pump flow rate control specification
Variable Speed Drive
Frequency (Hz)
Feed Flow Rate (LPM) Approximate Reynolds
Number @293 K
3.5 1.9 488
7.3 3.8 977
11.5 5.7 1465
16.0 7.6 1953
21.4 9.5 2442

12
Standard pH paper was used to monitor the pH of the feed tank during testing. Permeate
flow rate was measured by stopwatch and graduated cylinder as needed for cleaning
analysis.
2.3. Obtaining membrane samples
Membrane manufacturers were contacted for ultrafiltration membrane
recommendations for use in oily water separations. Three membranes were chosen each
having a spiral membrane configuration type for compact design configuration.
Membranes also had a range of MWCO and expected compatibility with the micelle
solutions. Flat sheet samples were obtained of each selected membrane and cut to fit the
Sepa unit and the 140 cm2 test area. The differences in the three membrane types are
provided in Table 2 and each membrane type are referred to as JW, 5k, and BN.
Table 2 Membrane specifications
Test Code JW 5k BN
Membrane
manufacturer
General Electric PTI Snyder
MWCO 30k 5k 30k
Material PVDF PVDF PVDF
pH range 1-11 3-10 1-11
Operating pressure
range (psi)
10-50 15-50 10-150

13
3. OIL AND SUSPENDED SOLIDS REMOVAL FOR PRODUCED
WATER TREATMENT BY ULTRAFILTRATION MEMBRANES
3.1. Overview
The first sets of experiments were performed to treat produced brine to measure
the performance of ultrafiltration membranes for oil and turbidity removal. The research
focused on the effect of pressure and flow rate on membrane performance with respect
to flux and contaminant removal from produced water with three selected membranes.
Oil and suspended solids were evaluated using turbidity and oil in water measurements
taken every 30 minutes. The studied showed that ultrafiltration membranes achieved
turbidity removal of over 99% and oil content removal of greater than 87 %.
3.2. Introduction
The difficulty with produced water cleanup is the need to design for the extreme
variability of produced water from different sources and wells. Robust treatment systems
should handle the bulk of potential contaminants in produced water and be effective on
most produced water sources. One method to help achieve this goal is to design the
treatment system in stages with increasing water quality or separation requirements as
you progress through the treatment train. Two of the major contaminants that need to be
removed from oilfield brine to meet water quality standards are suspended and dissolved
oil and grease and suspended solids. Removal of dissolved solids has been commercially
available for seawater and utilize well characterized technologies like reverse osmosis
and multistage flash evaporation. These technologies require a high quality of water feed
for efficiency to minimize the energy requirement.
14
For suspended solids or turbidity removal, some form of filtration is the typical
method used in industry. Filtration can be used after treatment of the water by a
coagulant such as for municipal water treatment. The concern with using filtration
technology to remove the suspended solids from oilfield brine is the need to replace
standard filters frequently if the water source has a high concentration of suspended
solids, (the case for most sources of produced water). Other techniques that have been
tested for produced water suspended solids treatment include activated carbon [26],
ceramic microfiltration [9], and ceramic ultrafiltration [2]. Oil removal or organics
removal has been investigated using various technologies including electroflocculation
[27], carbonaceous absorbent [28], bioreactors [29], wetland treatment [30],
ultrafiltration [2, 31] and nanofiltration [32]. These studies have given varying results for
oil content removal. The use of ultrafiltration using new types of membranes offer the
most promise for produced water pretreatment for later desalination. The use of
ultrafiltration membranes for pretreatment to meet established feed conditions for
reverse osmosis or multistage flash evaporation can be used to make the onsite treatment
of produced water economically viable. Membrane technology utilized cross flow
filtration to provide the treatment and was allowed to reduce the accumulation of
suspended solids and oil content on the membrane surface.
With membrane technology, produced water can be treated onsite to meet feed
water conditions of less than 5 normalized turbidity units (NTU) and high removal of oil
content for treatment by reverse osmosis. Ultrafiltration membranes were selected to be
compatible with oily water and to provide better separation without causing higher
capital cost due to higher operation pressures. This study examined and evaluated the

15
use of commercially available ultrafiltration membranes to achieve the desired reduction
in both turbidity and oil content of the produced water. The study examined whether
ultrafiltration membranes could be used for onsite produced water pretreatment for both
turbidity and oil content removal before produced water desalination. The study
examined the effect of operation pressure and flow rate on the effectiveness of
membrane treatment to meet the desalination feed requirements.
3.3. Materials and Methods
3.3.1. Experimental method
Evaluation of commercial ultrafiltration membranes for use in produced water
treatment has been conducted. Ultrafiltration membranes should provide the necessary
pretreatment separation for desalination with minimum space and cost requirement. Each
membrane type obtained was tested for produced water treatment under two operational
factors of pressure and flow rate under a 3X2 factorial design with no replication based
on the membrane specification provided by the membrane manufacture. The membrane
specifications for the three ultrafiltration membranes suggested an operational pressure
of about 30 psi or 207 kilopascals (kPa). This pressure indicated three factor levels of 20,
30, and 40 psi (corresponding to 138, 207, and 276 kPa) for the factorial design
experiments were appropriate. Limits on flow rates recommended by the Sepa System
lab equipment and high fouling feed spacer indicated a maximum flow rate of
approximately 8 liters per minute (LPM) for high fouling tests provided for flow rate
operation levels of 1.9 and 3.8 LPM in the factorial design. Each experiment was
monitored for temperature, flow rate, pressure, pH, operation time, and feed and
permeate quality.
16
3.3.2. Experimental procedure
The test consisted of a batch operation with full concentrate recycle. Each
experiment consisted of placing approximately 7 liters of produced water feed into the
feed tank (see Figure 2). The test consisted of operating the Sepa system (Figure 1) for 2
hours while maintaining the operational flow rate and pressure for the particular test with
concentrate being continuously recycled to the feed tank. Approximately 30 milliliter
(mL) feed samples were taken before and after the two hour test duration to monitor the
change in feed conditions during testing. Inlet and outlet pressure were constantly
monitored and adjusted during the experiment to maintain the TMP, average of the inlet
and outlet pressures, at the specified level. Temperature, permeate flow rate, pressure
measurements were taken every 30 minutes to monitor change in flux. Also,
approximately 30 mL permeate samples were collected every 30 minutes to measure
water quality achieved by the membrane. Finally pH of the produced water feed was
monitored throughout the duration of the experiment for any major change.
3.3.3. Data analysis
Flux measurements were temperature adjusted for viscosity to a common
temperature of 298 K and reported as liters per square meter per hour (LMH). The data
collected during each of the runs were analyzed and computed to provide direct flux
performance comparisons between the different membranes through plots: 120min Flux
vs. TMP at 1.9 and 3.8 LPM and flux vs. time or fouling curve for direct comparison of
the data for each membrane under the same operating conditions. The samples were
analyzed for turbidity a reflection of suspended solids and oil. Water samples were

17
measured for an estimated oil content to provide separation characteristics of the
membranes. The classification and selection of the best membrane will be based on the
120min flux, lowest TMP, and high rejection characteristics of the membrane obtained.
3.3.4. Water sample analysis
Water sample analyses consisted of two measurements, turbidity and oil content.
Turbidity analyses were conducted using a Hach 2100p turbidity meter calibrated with
factory standards for NTU. Oil analyses were conducted using the TD-500 oil in water
meter developed by Turner Designs Hydrocarbon Instruments, Inc. The TD-500 oil in
water meter involved use of a solvent extraction procedure with high accuracy and
repeatability and correlates to EPA and other industry accepted laboratory methods for
oil and grease measurements in water. The TD-500 utilized the FastHEX procedure with
the high accuracy and repeatability. The FastHEX procedure involved the extraction of
the suspended and dissolved oil from the water samples then using ultraviolet light to
detect the oil concentration in the solvent. The analysis method was compatible with all
popular solvents including hexane, Vertrel, AK-225, Freon, xylene, and others. The
water sample analyses used hexane as the extraction solvent and were calibrated to
known oil concentrations. Each sample collected during an experiment was tested three
times for instrument error and averaged to calculate the turbidity and oil content of a
particular sample. The two feed samples were averaged and the five permeate sample
averages were then averaged for a combined feed average and permeate average for both
the turbidity and oil content. The average values were used to calculate removal
percentages for the test as follows in Eq. 1.
18
100*1(%)⎟⎟⎟
⎠
⎞
⎜⎜⎜
⎝
⎛−=
averagefeed
averagepermeatemovalRePercent (1)
The calculated removal percentages were used in evaluating the separation
characteristics under the same flow and pressure for each membrane type.
3.4. Results.
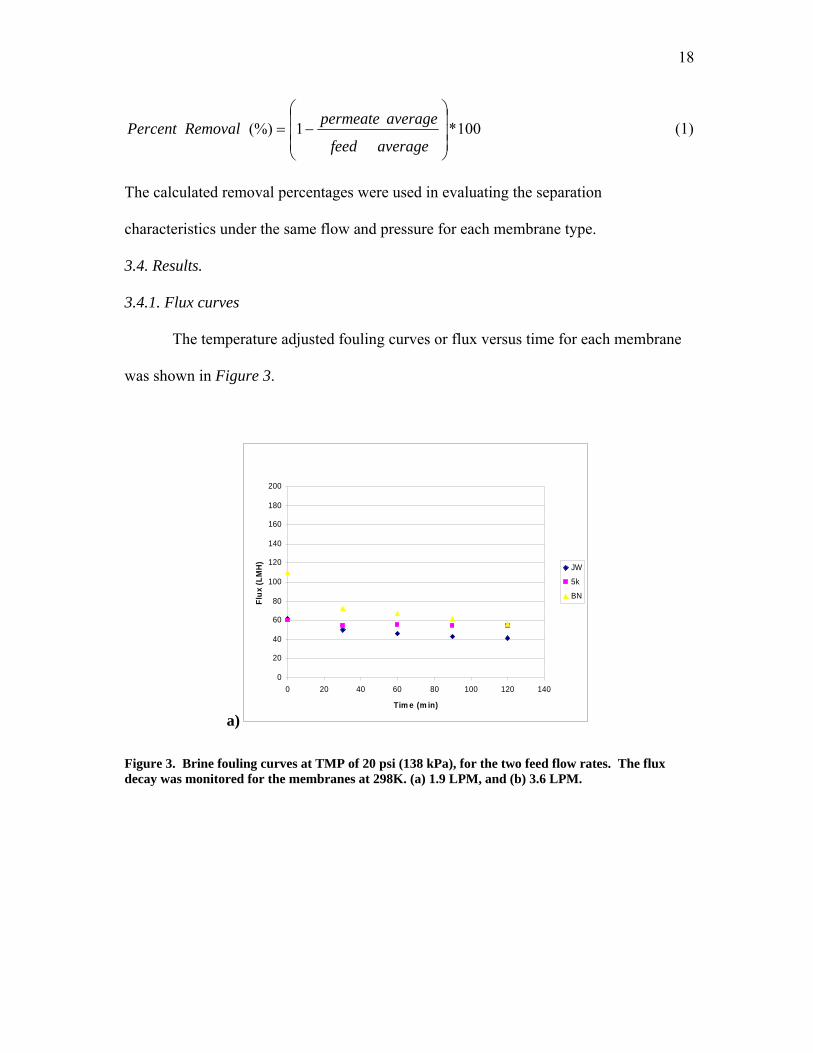
3.4.1. Flux curves
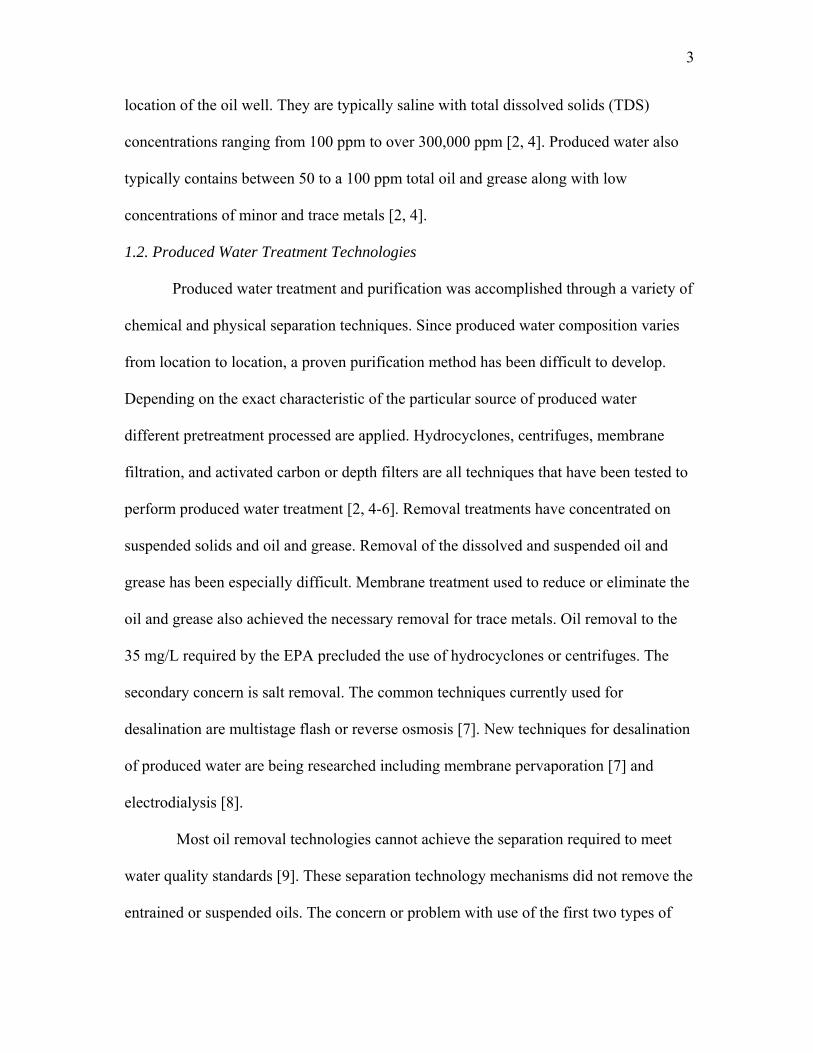
The temperature adjusted fouling curves or flux versus time for each membrane
was shown in Figure 3.
a)
0
20
40
60
80
100
120
140
160
180
200
0 20 40 60 80 100 120 140
Tim e (m in)
Flux
(LM
H)
JW
5k
BN
Figure 3. Brine fouling curves at TMP of 20 psi (138 kPa), for the two feed flow rates. The flux decay was monitored for the membranes at 298K. (a) 1.9 LPM, and (b) 3.6 LPM.

19
b)
0
20
40
60
80
100
120
140
160
180
200
0 20 40 60 80 100 120 140
Tim e (m in)
Flux
(LM
H)
JW
5k
BN
Figure 3. Continued.
Figure 3 showed that the flux decays were slight and steady over the time period
for the 5k and JW. For the BN membrane, Figure 3 showed a major drop in the flux
within the first 30 minutes followed by a slow decline for the rest of the experiment.
Figure 4 showed similar curves on the membrane types for a 207 kPa TMP. Figure 4
showed similar behavior for the 207 kPa TMP at both flow rates and the JW membrane
at the higher flow rate. The figure also indicated that only a moderate decline occurred
for the JW membrane at the low flow rate and for the 5k membrane. Figure 4 also
showed that the flux decay for the BN membrane occurred mainly within the first 30
minutes and then stabilized.

20
a)
0
50
100
150
200
250
300
0 20 40 60 80 100 120 140
Time (min)
Flux
(LM
H) JW
5k
BN
b)
0
50
100
150
200
250
300
0 20 40 60 80 100 120 140
Time (min)
Flux
(LM
H) JW
5kBN
Figure 4. Brine fouling curve at TMP of 30 psi (207 kPa), for the two feed flow rates. The flux decay was monitored for the membranes at 298K. (a) 1.9 LPM, and (b) 3.6 LPM.
These curves indicate a major decay for the three membranes during the
experiment with the exception for the 5k membrane under the high flow. Figure 5
showed the highest pressure flux decline for the three membrane types.

21
a)
0
20
40
60
80
100
120
140
160
180
200
0 20 40 60 80 100 120 140
Tim e (m in)
Flux
(LM
H)
JW
5k
BN
b)
0
20
40
60
80
100
120
140
160
180
200
0 20 40 60 80 100 120 140
Tim e (m in)
Flux
(LM
H)
JW
5k
BN
Figure 5. Brine fouling curve at TMP of 40 psi (276 kPa), for the two feed flow rates. The flux decay was monitored for the membranes at 298K. (a) 1.9 LPM, and (b) 3.6 LPM.
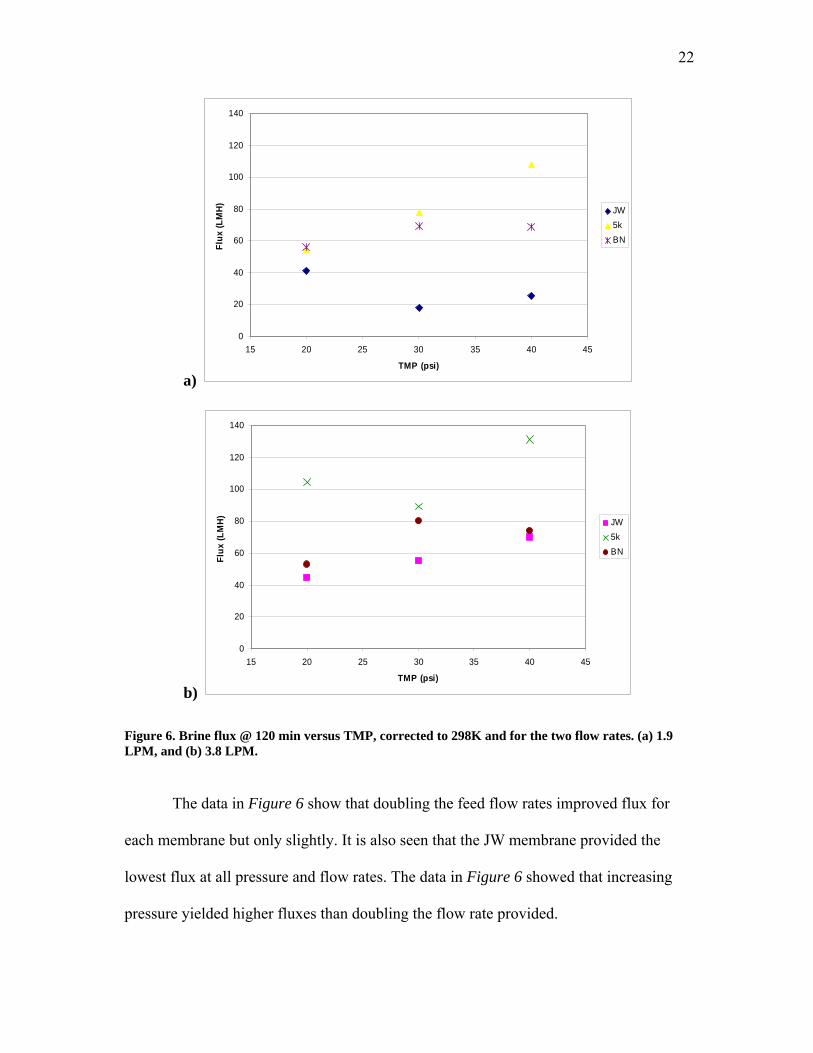
Figure 5 shows the major decay in flux in the first 30 minutes. After 30 minutes,
the data show only a steady slow decline in the flux performance. Figure 6 shows that
120 minute fluxes were the highest for the 5k membrane except for TMP of 176 kPa and
1.9 LPM flow rate.
22
a)
0
20
40
60
80
100
120
140
15 20 25 30 35 40 45
TMP (psi)
Flux
(LM
H)
JW5kBN
b)
0
20
40
60
80
100
120
140
15 20 25 30 35 40 45
TMP (psi)
Flux
(LM
H)
JW5kBN
Figure 6. Brine flux @ 120 min versus TMP, corrected to 298K and for the two flow rates. (a) 1.9 LPM, and (b) 3.8 LPM.
The data in Figure 6 show that doubling the feed flow rates improved flux for
each membrane but only slightly. It is also seen that the JW membrane provided the
lowest flux at all pressure and flow rates. The data in Figure 6 showed that increasing
pressure yielded higher fluxes than doubling the flow rate provided.

23
3.4.2. Separation performance
Water quality analyses for turbidity and oil content were computed and averaged
for every experiment and shown in Table 3.
Table 3 Water quality results
Experiment parameters
Feed Turbidity Average (NTU)
Permeate Turbidity Average (NTU)
Turbidity % Removal
Feed Oil content Average (ppm Oil)
Permeate Oil Content Average (ppm Oil)
Oil content % Removal
JW: 1.9LPM/138kPa 627.8 2.5 99.60% 363.5 34.8 90.43% JW: 1.9LPM/207kPa 412.2 1.6 99.61% 1927.8 573.3 70.26% JW: 1.9LPM/276kPa 238.2 1.7 99.27% 1509.0 188.1 87.53% JW: 3.8LPM/138kPa 252.3 1.1 99.57% 28.0 11.3 59.52% JW: 3.8LPM/207kPa 1000.0 1.3 99.87% 204.3 47.7 76.64% JW: 3.8LPM/276kPa 1000.0 1.9 99.81% 156.3 26.9 82.81% 5k: 1.9LPM/138kPa 365.8 3.7 98.99% 43.8 15.6 64.41% 5k: 1.9LPM/207kPa 868.7 1.6 99.82% 48.0 7.9 83.61% 5k: 1.9LPM/276kPa 1000.0 2.4 99.76% 62.8 8.0 87.27% 5k: 3.8LPM/138kPa 565.2 2.6 99.55% 76.0 26.3 65.44% 5k: 3.8LPM/207kPa 954.7 8.8 99.07% 192.2 30.9 83.94% 5k: 3.8LPM/276kPa 832.8 35.4 95.75% 44.2 23.3 47.32% BN: 1.9LPM/138kPa 1000.0 1.8 99.82% 136.0 7.7 94.31% BN: 1.9LPM/207kPa 875.8 2.5 99.71% 61.8 7.7 87.60% BN: 1.9LPM/276kPa 922.5 2.3 99.75% 98.2 7.9 91.92% BN: 3.8LPM/138kPa 1000.0 1.8 99.82% 121.0 7.3 93.94% BN: 3.8LPM/207kPa 1000.0 1.8 99.82% 76.8 9.3 87.94% BN: 3.8LPM/276kPa 974.0 1.8 99.81% 42.5 9.3 78.20%
The data in Table 3 show that the turbidity and the oil content of the feed were
different for each experiment but within the range for produced water. Table 3 displayed
values for turbidity of the permeate water samples calculated below 5 NTU. The
removal percentage for the turbidity ranged from 95.75% to 99.87%. Table 3 also shows
that the oil contents of the water samples were influenced by the feed concentrations.
The oil removal percentages for the experiments ranged from 47.32% to 94.31%. The
results indicated that all three membranes achieved the turbidity removal less than 5
NTU necessary to meet feed quality requirements for desalination technologies. Table 3
also showed that the oil removal percentages were the highest for the BN membrane and
24
that the permeate oil content was the lowest concentration achieved by the membranes
and averaged below 10 ppm oil. Finally, Table 3 indicated that increased TMP or feed
flow rates did not improve the oil content separation removal percentages or obtained oil
content concentration characteristics of three membranes.
3.5. Discussion
3.5.1. Flux curves
The results indicated that the three membranes were able to provide a high flux
to treat the oilfield brine. The fouling curves indicate that the 5k membrane was able to
reduce fouling by the produced water over the duration of the experiment. This could be
the result of a lower MWCO for the membrane. The lower MWCO could prevent the
pores of the membrane surface from being plugged by the suspended and dissolved oils.
The JW and the BN membrane or higher MWCO membranes showed large flux decays
which were possibly explained by the filling of the larger pores on the membrane
surface, but more likely explained by surface fouling.
The flux curves indicated that the increased feed flow rates increased
performance of the membranes without any loss in water quality. The 120 minute flux
showed higher flux for the increased TMP for each membrane type as you would expect
for most membrane systems. The flux data indicate that the higher pressure caused faster
fouling while significantly decreasing the flux rate of the fouled membrane. The higher
pressure caused the formation of the fouling layers to occur at a faster rate by forcing the
oil deposits or particles within the produced water feed to plug the membrane pores or
increasing the surface fouling of the membrane. The fouling curves also indicated two

25
distinct regions of fouling of the membrane, the rapid initial flux decline during the first
30 minutes and the second gradual flux decay during the rest of the experiment.
3.5.2. Water analysis
The water analyses indicated that even though the produced water feed samples
were taken from the same 10 micron filtered sources the quality of the feed varied
significantly for the experiments. This variation led to the treatment of some produced
water with higher concentrations of oil and suspended solids and some treatment with
lower concentrations of oil and suspended solids in the produced water feed. The
analysis showed that even for the feed samples with the higher concentration of
contaminates the membrane was able to treat the produced water. The higher
concentrations of the suspended solids or oils indicated by the high or maximum
turbidity on most feed samples provided no noticeable effect on the water quality of the
permeate samples when compared to the lower feed turbidity experiments. The
membranes were capable of providing the required suspended solid or oil removal of a
turbidity of about 5 NTU for subsequent TDS treatment. The oil separation
characteristics provided by the membranes showed that increased pressure and feed flow
rate forced oil content through the membrane while also increasing the fouling rate. This
indicated that increased pressure reduces the performance of two of the ultrafiltration
membranes while increasing the fouling rate of the produced water. The BN membrane
showed that the increased TMP while causing the faster fouling, did not hinder the water
quality of permeate obtained. This suggested that the membrane prevented the oil
content for being forced through the membrane by the higher flow rate and pressures.

26
3.6. Conclusions
The treatment of produced water by ultrafiltration membranes was a logical
treatment step for an onsite system before the desalination of the brine. The commercial
available membranes were able to treat the produced water to the desired water quality
for later desalination. The results indicated that the system would be operated at very
low pressure and high flow rates that would provide low capital and operational costs.
The testing showed that increased flow rate would provide the necessary throughput
while limiting the fouling rate and improving water quality.
The PVDF membranes selected for testing each had different separation
characteristics for the produced water. The three ultrafiltration membranes all had a
capability of at least 30,000 MWCO. The MWCO generally was not an indicator of the
separation capable of the membranes. The BN membrane provided the overall best
treatment of the produced water with high flux rate and the best separation
characteristics. The 5k membrane was the second effective membrane with the highest
flow rates but reduced water quality. The JW membrane was the least effective
membrane tested.
The study showed that the treatment of produced water with ultrafiltration
membranes onsite can be effective. The study showed the operation pressure and flow
rate affected the treatment of the water with only two of the membranes. The study
indicates that the commercially available BN membrane would be a good choice for the
onsite application of produce water treatment because the water quality obtained by the
membrane was suitable for later reverse osmosis desalination. The study also showed
27
that for the BN membrane the feed flow rate, TMP, feed suspended solids concentration,
and feed oil content provided no change in the membrane effectiveness.

28
4. MEMBRANE CLEANING AFTER PRODUCED WATER
TREATMENT WITH A MICELLAR SOLUTION
4.1. Overview
The second objective of this research was to test the effectiveness of a new type
of membrane cleaning agent. A neutral pH and ambient temperature micro emulsion
cleaning agent has been developed that effectively cleans oily water fouled membranes.
The performance of the cleaning solutions on produced water fouled ultrafiltration
membranes was tested on laboratory membrane testing equipment. Micro emulsion
chemical make-up and solubilizing characteristics were varied to determine their effect
on cleaning performance. Physical cleaning factors were studied for the micelle solution
cleaning performance along with the multiple membranes of the same PVDF material
but different nominal separation or flux characteristics. The results indicated the micellar
solution was effective in cleaning the produced water fouled ultrafiltration membranes.
Physical factors that influenced the micelle solution cleaning effectiveness included the
cleaning flow rate, rinse time, and membrane size.
4.2. Introduction
Membrane filtration has been utilized in various industries for the treatment of
water and wastewater. These membrane systems are designed for treatment of a specific
known water source and remove the desired contaminants to meet environment
regulations or desired water quality for industrial use. These contaminants can have a
wide range of characteristics that will allow them to be separated through membrane
technology. The concern with using membranes in the treatment of wastewater was to

29
increase efficiency of the treatment system by minimizing the fouling and to efficiently
clean the membranes after fouling.
To efficiently clean membrane fouling, the fouling type caused by the
wastewater should be known. The degree of fouling is related to the wastewater
characteristics and the amount of filtration desired. In a typical membrane application
the wastewater characteristics are almost constant and have known concentrations, but
for produced water treatment the water characteristics will vary from well to well and
over time causing additional concerns when developing a cleaning protocol. Also,
temperature an important factor for cleaning membranes required additional
consideration, especially for remote filtration units for well sites where high temperature
cleaning might not be practical. A cleaning solution that will work at ambient conditions
would also reduce costs. An ambient temperature micelle solution would be a possible
solution to the temperature limitation. Micro emulsion solutions consist of micelles
formed by surfactants to create a hydrophobic cell within an aqueous environment.
As explained earlier, produced water has caused all four types of membrane
fouling but typically mineral and oil deposits dominate. The mineral and oil deposits on
the membrane were the primary concern since they will occur from every produced
water source and require a different cleaning approach than biological fouling.
Particulate fouling can be cleaned using physical cleaning or high flow rate to strip the
layers from the membrane surface along with the chemical cleaning the mineral and
organic layers. Mineral and organic fouling has been utilized for cleaning by the industry
for oily water fouled ultrafiltration by acidic and basic solutions, respectively [12]. The
micelle solutions created using surfactants were utilized in this study as a solution for

30
cleaning of produced water fouled ultrafiltration membranes. These surface active agents
formed micelles that reacted with the mineral and oil droplets to form larger particles
that are then removed by the high flow rate. The micelle should improve the
effectiveness of dissolving the organic and mineral fouling layer over the acidic and
basic solutions currently employed.
This study was testing the feasibility of using such a micelle solution to clean the
membrane fouling that was occurring during operation. The specific objective of this
research was to examine the feasibility of using micelle chemical solutions with different
micro emulsion characteristics for membrane cleaning of produced water fouled
ultrafiltration membranes. The research was designed to measure micelle solution
cleaning at ambient conditions and compare their performance to commercial acidic and
basic solutions or manufacturers recommended cleaning solutions for produced water.
The research evaluated the use of the micelle solution on PVDF ultrafiltration
membranes from three manufactures, GE, PTI, and Snyder, used in produced water
treatment and to determine whether physical conditions of cleaning time, flow rates, and
rinse times affect the cleaning performance to optimize the micellar cleaning solution for
these ultrafiltration membranes.
4.3. Materials and Methods
4.3.1. Fouling of membrane samples
The membranes are fouled by using random samples of different produced water
obtained from a local disposal well with unknown oil and suspended solids
concentrations. The produced water sample obtained is then filtered by a 10 μm depth
filter to remove large particles. The membranes are fouled by a 6-8 liter filtered produce

31
water feed sample by batch operating the experimental apparatus for 2 hours with
concentrated recycle under different operating conditions provided in Table 4.
Table 4 Fouling conditions for ultrafiltration membranes
Fouling Condition Feed Flow Rate LPM TMP psi (kPa)
1A 1.9 20 (138)
1B 1.9 30 (207)
1C 1.9 40 (276)
2A 3.8 20 (138)
2B 3.8 30 (207)
2C 3.8 40 (276)
The effect of fouling conditions will be assumed to be negligible on cleaning
effectiveness. The effect of the conditions under which the membranes were fouled
should have no appreciable effect on cleaning the surface of the membranes since the
cleaning solutions were being designed to clean heavily fouled oily membranes. These
heavily fouled membranes have a limit on the amount to which they are fouled and can
be fouled only to the limiting factor of the cross flow rate or shear rate of the feed across
the membrane.
4.3.2. Cleaning of fouled membranes
4.3.2.1. Solution preparation and cleaning procedure
The micelle solutions were prepared using reverse osmosis (RO) water and
precise amounts of surfactants and salt concentration to provide the micellar
characteristics. The micellar solution consisted of a 1-1.5% surfactant solution of three
32
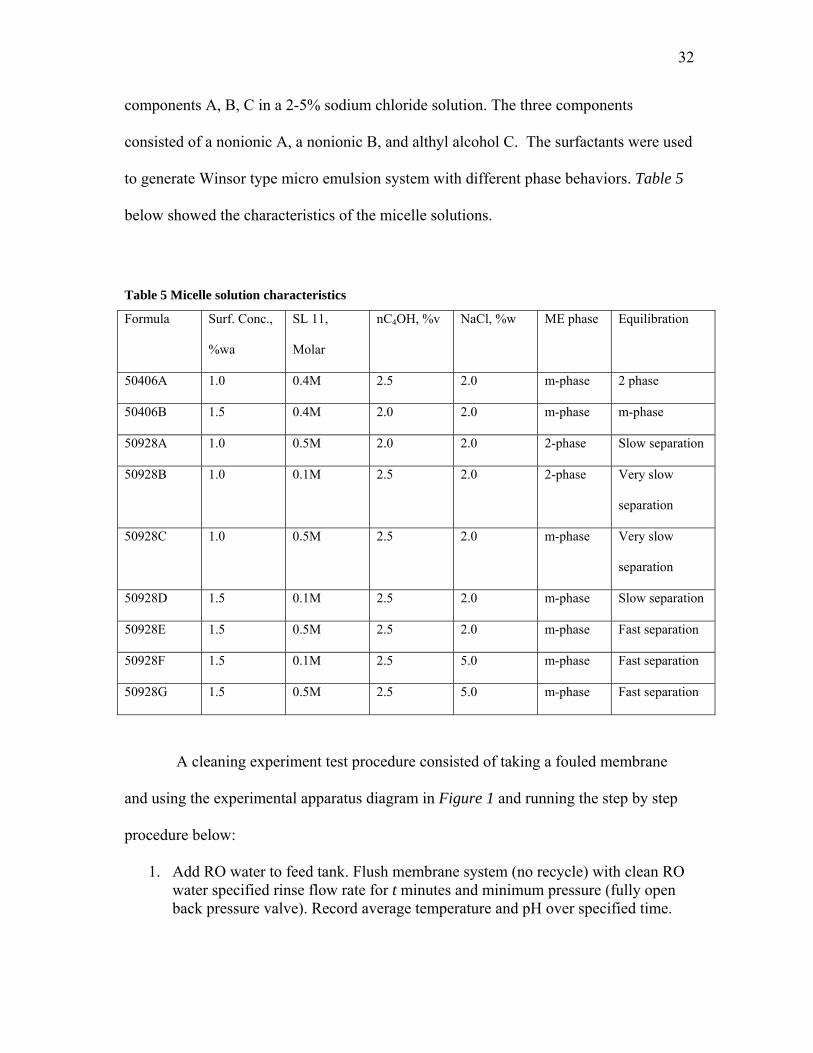
components A, B, C in a 2-5% sodium chloride solution. The three components
consisted of a nonionic A, a nonionic B, and althyl alcohol C. The surfactants were used
to generate Winsor type micro emulsion system with different phase behaviors. Table 5
below showed the characteristics of the micelle solutions.
Table 5 Micelle solution characteristics
Formula Surf. Conc.,
%wa
SL 11,
Molar
nC4OH, %v NaCl, %w ME phase Equilibration
50406A 1.0 0.4M 2.5 2.0 m-phase 2 phase
50406B 1.5 0.4M 2.0 2.0 m-phase m-phase
50928A 1.0 0.5M 2.0 2.0 2-phase Slow separation
50928B 1.0 0.1M 2.5 2.0 2-phase Very slow
separation
50928C 1.0 0.5M 2.5 2.0 m-phase Very slow
separation
50928D 1.5 0.1M 2.5 2.0 m-phase Slow separation
50928E 1.5 0.5M 2.5 2.0 m-phase Fast separation
50928F 1.5 0.1M 2.5 5.0 m-phase Fast separation
50928G 1.5 0.5M 2.5 5.0 m-phase Fast separation
A cleaning experiment test procedure consisted of taking a fouled membrane
and using the experimental apparatus diagram in Figure 1 and running the step by step
procedure below:
1. Add RO water to feed tank. Flush membrane system (no recycle) with clean RO water specified rinse flow rate for t minutes and minimum pressure (fully open back pressure valve). Record average temperature and pH over specified time.
33
2. Flush membrane system (concentrate recycle) with clean RO water specified rinse flow rate for t minutes and minimum pressure. Record average temperature and pH over specified time.
3. Drain system 4. Add RO water to feed tank. Run system taking clean water flux data over range
of pressures at 3.8 LPM flow rate. 5. Record flux data and plot with temperature correction for viscosity. 6. Drain system 7. Add 2L of cleaning solution to feed tank. Run cleaning chemical solution over
system (concentrate recycle) for t min at specified operating flow rate and minimum pressure. Record average temperature and pH over specified time.
8. Drain system 9. Add RO water to feed tank. Flush system (no recycle) for t minutes with clean
RO water at specified rinse flow rate and minimum pressure. 10. Flush system (concentrate recycle) for t minutes at rinsing flow rate and
minimum pressure 11. Drain system. 12. Add RO water to feed tank. Run system taking clean water flux test over range of
pressures at 3.8 LPM flow rate. 13. Record flux data and plot with temperature correction and compare to new clean
flux data and to Step 4 data.
Step 1 and 9 were performed without any recycling of the RO water to reduce
mixing of fouling water or cleaning solution and Step 2 and 10 were performed with
concentrate recycle specifying the time and flow rate while monitoring pH and
temperature of feed through the instrumentation shown in Figure 1. Then, Step 4 and 12
were conducted by using a stopwatch and graduated cylinder for permeate flow rate
measurements at the specified TMP and 3.8 LPM flow rate. Permeate flow rate
measurements were taken over a range of at least 5 TMP pressures suggested by the
membrane manufacturers from 69 to 345 kPa to obtain a pure water flux versus TMP
plot. During the permeate flow rate measurements, pH and inlet and outlet temperatures
were recorded.
34
4.3.2.2. Analysis of the cleaning effectiveness
The cleaning effectiveness was determined by comparing the un-cleaned flux to
the cleaned flux. The operational conditions during fouling were assumed not a factor
due to limited effect these conditions will have on cleaning effectiveness. To calculate
the flux the permeate flow rate is divided by the membrane area. After initial flux
calculation, the flux was adjusted or corrected to a specified temperature of 298 K by
viscosity for baseline comparisons. Simple linear regressions were used to analyze the
corrected flux curves. Linear regressions were used to predict pure water flux rate at
three specified TMP for the un-cleaned, cleaned, and the new flux curves. The
predicated pure water flux rate were used to calculate ratios of cleaned flux to un-
cleaned flux, un-cleaned flux to new clean flux, and un-cleaned flux to cleaned flux at
the 3 specified TMP. The ratios obtained at each specified TMP were averaged to
provide overall flux ratio for cleaned to un-cleaned, cleaned to new, un-cleaned to new,
and the cleaning effectiveness calculated according to Eq. 2.
100*)(1(%) ⎟⎟⎠
⎞⎜⎜⎝
⎛−=
fluxcleanedfluxuncleanedAvgessEffectivenCleaning (2)
The cleaning effectiveness percentage showed percentage improvement provided by the
cleaning solution and procedure over the un-cleaned flux. The percentage calculated the
effect of cleaning the membrane while neglecting the amount of fouling that was
obtained by the fouling conditions.
4.3.3. Membrane testing
4.3.3.1. Micelle solution formulation experiments
The first series of cleaning tests, Experiments 1-9, were testing the differences
between the micelle micro emulsion solutions. This series is conducted using the above

35
procedure with each test being conducted on the same membrane under the identical
cleaning parameters of flow rates and time as indicated in Table 6. The series also
included Experiment RC, a recommended cleaning procedure provided by Ecolab using
their commercial cleaning chemicals of 2% enzyme solution of Ultrasil 53, 1% acidic
solution of Ultrasil MP, and1.5% basic solution of Ultrasil 10 in series to clean the
membranes.
Table 6 Micelle solution test conditions Experiment Test 1 2 3 4 5 6 7 8 9 RC Micelle formula
50406A 50406B 50928A 50928B 50928C 50928D 50928E 50929F 50929G
Ultrasil 53 Ultrasil
MP Ultrasil 10
No recycle Rinse before Cleaning Cycle duration (min)
1 1 1 1 1 1 1 1 1
1 1 1
Recycling Rinse before Cleaning duration (min) 5 5 5 5 5 5 5 5 5
5 5 5
Rinse Solution Flow Rate (LPM)
3.8 3.8 3.8 3.8 3.8 3.8 3.8 3.8 3.8 3.8 3.8 3.8
Cleaning Cycle duration (min) 15 15 15 15 15 15 15 15 15
15 15 15
Cleaning Solution Flow rate (LPM)
3.8 3.8 3.8 3.8 3.8 3.8 3.8 3.8 3.8 3.8 3.8 3.8
No recycle Rinse after Cleaning Cycle duration (min)
1 1 1 1 1 1 1 1 1
1 1 1
Recycling Rinse after Cleaning Cycle duration (min)
5 5 5 5 5 5 5 5 5 5 5 5
Membrane JW JW JW JW JW JW JW JW JW JW
A commercial cleaning process was performed to use as a baseline comparison.
Experiment RC was performed under the same flow rate and rinse flow rate and duration
as Experiments 1-9 but with corresponding rinse and cleaning cycle for each additional
cleaning solution as shown in Table 6.

36
4.3.3.2. Flow rate experiments
The next series of experiments, Experiments 10-18, consisted of using the best
two micelle solutions from the first test series and performing threes sets of three flow
experiment tests. The first set of three experiments was performed on the JW membrane
and used the 50928A formula where three flow rates for the cleaning solution were
tested within the set. The second set consisted of the utilization of the same three flow
rates and the 50928A formula but were performed on the 5k membrane. The last set was
conducted on the 5k membrane and the three flow rates but utilized a different formula
50406B. All three sets were conducted using the same specified cleaning parameters for
rinse flow rate, rinse time, and cleaning time as shown in Table 7. These sets of
experiments tested the effect shear stress or cross flow rate for the cleaning solution
effectiveness. This series of tests also considered whether the different formulas had
different or corresponding effect on cleaning performance and flow rate effect and
whether the different membranes showed similar performance trends.
37
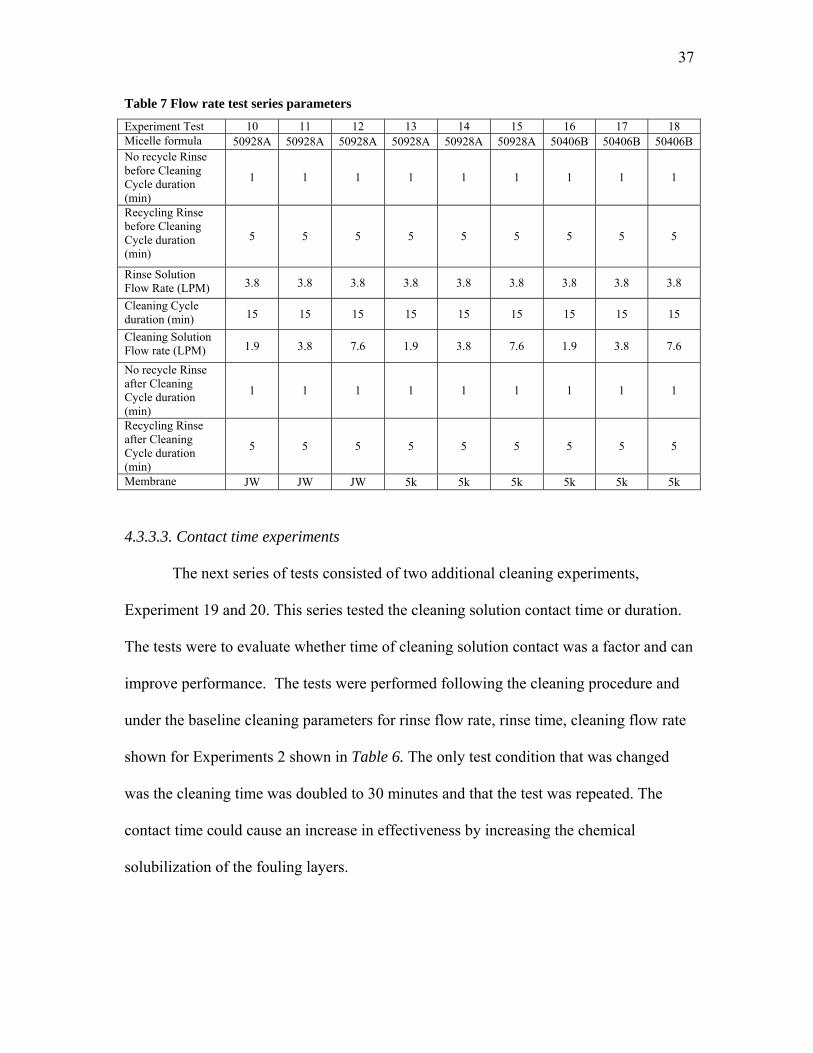
Table 7 Flow rate test series parameters
Experiment Test 10 11 12 13 14 15 16 17 18 Micelle formula 50928A 50928A 50928A 50928A 50928A 50928A 50406B 50406B 50406B No recycle Rinse before Cleaning Cycle duration (min)
1 1 1 1 1 1 1 1 1
Recycling Rinse before Cleaning Cycle duration (min)
5 5 5 5 5 5 5 5 5
Rinse Solution Flow Rate (LPM) 3.8 3.8 3.8 3.8 3.8 3.8 3.8 3.8 3.8
Cleaning Cycle duration (min) 15 15 15 15 15 15 15 15 15
Cleaning Solution Flow rate (LPM) 1.9 3.8 7.6 1.9 3.8 7.6 1.9 3.8 7.6
No recycle Rinse after Cleaning Cycle duration (min)
1 1 1 1 1 1 1 1 1
Recycling Rinse after Cleaning Cycle duration (min)
5 5 5 5 5 5 5 5 5
Membrane JW JW JW 5k 5k 5k 5k 5k 5k
4.3.3.3. Contact time experiments
The next series of tests consisted of two additional cleaning experiments,
Experiment 19 and 20. This series tested the cleaning solution contact time or duration.
The tests were to evaluate whether time of cleaning solution contact was a factor and can
improve performance. The tests were performed following the cleaning procedure and
under the baseline cleaning parameters for rinse flow rate, rinse time, cleaning flow rate
shown for Experiments 2 shown in Table 6. The only test condition that was changed
was the cleaning time was doubled to 30 minutes and that the test was repeated. The
contact time could cause an increase in effectiveness by increasing the chemical
solubilization of the fouling layers.

38
4.3.3.4. Water rinsing experiments
The last series of cleaning tests conducted evaluated the changing of the rinse
duration and flow rates to see if any effect was seen of the micro emulsion solution
being maintained on the membrane and reducing the actual effectiveness of the cleaning
cycle. The tests were conducted to form sets of experiments to coincide with previous
tests, Experiment 17 and 18 shown in Table 7, to test the rinse flow rate effect with
similar conditions for comparison. The experiments in Table 8 along with Experiment 17
and 18 tested whether doubling the rinse time and flow rate before and after the cleaning
cycle added any notable effect on performance.
Table 8 Water rinsing test series parameters
Experiment Test 21 22 23 24 25 26 27 28 Micelle formula 50406B 50406B 50406B 50406B 50928C 50928C 50928C 50928C No recycle Rinse before Cleaning Cycle duration (min)
1 1 1 2 1 1 2 2
Recycling Rinse before Cleaning Cycle duration (min)
5 5 5 10 5 5 10 10
Rinse Solution Flow Rate (LPM) 7.6 7.6 3.8 3.8 3.8 7.6 3.8 7.6 Cleaning Cycle duration (min) 15 15 15 15 15 15 15 15
Cleaning Solution Flow rate (LPM) Reynolds Number
3.8 7.6 3.8 3.8 3.8 3.8 3.8 3.8
No recycle Rinse after Cleaning Cycle duration (min)
1 1 1 2 1 1 2 2
Recycling Rinse after Cleaning Cycle duration (min)
5 5 5 10 5 5 10 10
Membrane 5k 5k BN BN BN BN BN BN

39
The different sets consists of changing one other variable along rinse flow rate or
time to make direct comparisons on performance changes and to notice any trends or
slight variation on the rinse effect to the other parameters.
4.3.3.5. Comparison of type of membrane on cleaning effectiveness
The last set of experiments and analysis consists of analyzing the data to make a
comparison on which membrane type was cleaned more effectively. The set of
experiments consisted of the baseline test conditions of Experiments 1-9 with changing
only the membrane type and utilizing the same micelle solution. The analysis also
included whether different membranes showed different effects for rinsing effects or
cleaning flow rates. This analysis tested the suitability of the micelle solution for wide
varieties of PVDF ultrafiltration membranes. The analysis also examines the cleaning
solution temperature provided by ambient conditions.
4.4. Results
4.4.1. Micelle solution test series
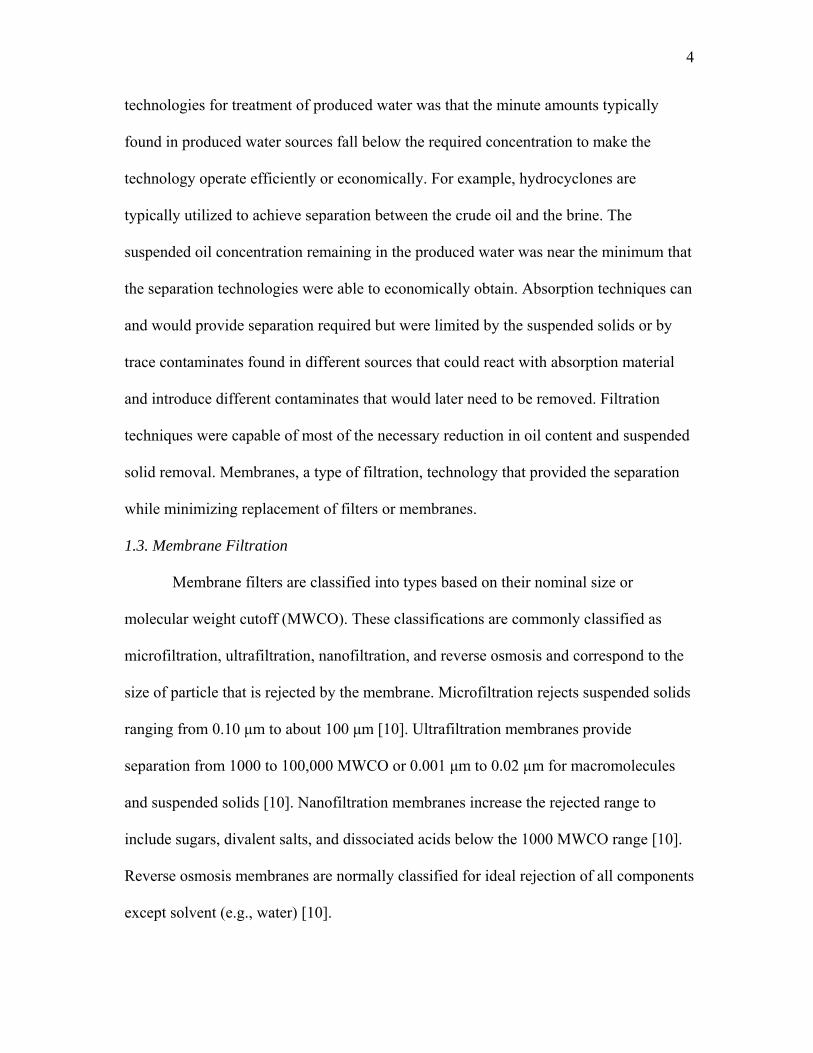
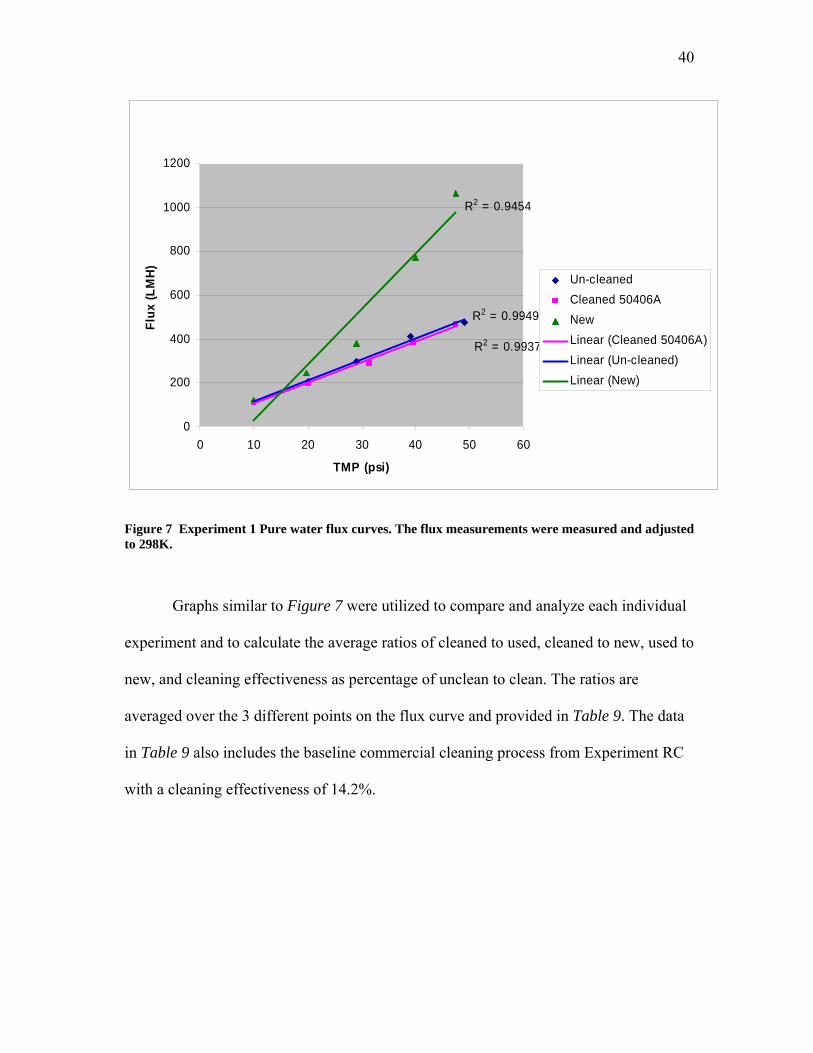
The flux measurement results from Experiment 1 are shown in Figure7.
40
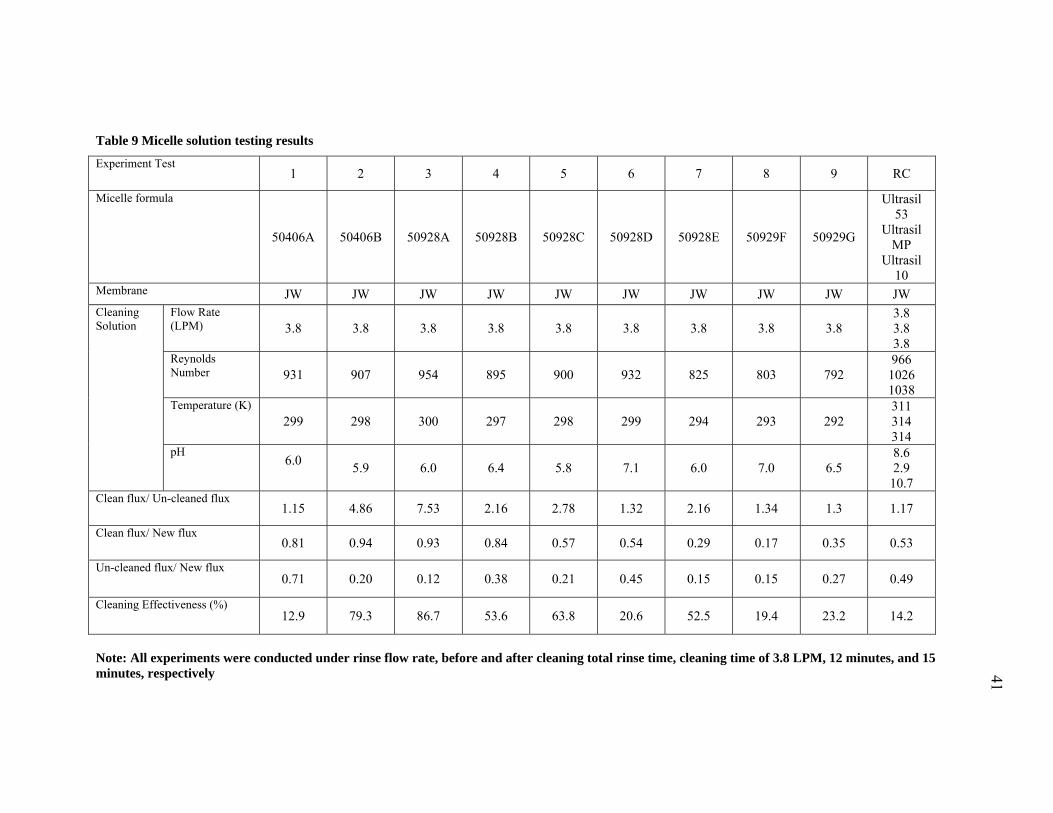
Graphs similar to Figure 7 were utilized to compare and analyze each individual
experiment and to calculate the average ratios of cleaned to used, cleaned to new, used to
new, and cleaning effectiveness as percentage of unclean to clean. The ratios are
averaged over the 3 different points on the flux curve and provided in Table 9. The data
in Table 9 also includes the baseline commercial cleaning process from Experiment RC
with a cleaning effectiveness of 14.2%.
Figure 7 Experiment 1 Pure water flux curves. The flux measurements were measured and adjusted to 298K.
R2 = 0.9949
0.9937
R2 = 0.9454
600
800
1000
1200
0 60
x (L
MH)
R2 =
0
200
400
0 10 20 30 40 5
TMP (psi)
Flu
Linear (New)Linear (Un-cleaned)Linear (Cleaned 50406A)NewCleaned 50406AUn-cleaned
41
Table 9 Micelle solution testing results
Experiment Test 1 2 3 4 5 6 7 8 9 RC
Micelle formula
50406A 50406B 50928A 50928B 50928C 50928D 50928E 50929F 50929G
Ultrasil 53
Ultrasil MP
Ultrasil 10
Membrane JW JW JW JW JW JW JW JW JW JW Flow Rate (LPM)
3.8 3.8 3.8 3.8 3.8 3.8 3.8 3.8 3.8 3.8 3.8 3.8
Reynolds Number 931 907 954 895 900 932 825 803 792
966 1026 1038
Temperature (K) 299 298 300 297 298 299 294 293 292
311 314 314
Cleaning Solution
pH 6.0
5.9 6.0 6.4 5.8 7.1 6.0 7.0 6.5 8.6 2.9
10.7 Clean flux/ Un-cleaned flux
1.15 4.86 7.53 2.16 2.78 1.32 2.16 1.34 1.3 1.17
Clean flux/ New flux 0.81 0.94 0.93 0.84 0.57 0.54 0.29 0.17 0.35 0.53
Un-cleaned flux/ New flux 0.71 0.20 0.12 0.38 0.21 0.45 0.15 0.15 0.27 0.49
Cleaning Effectiveness (%) 12.9 79.3 86.7 53.6 63.8 20.6 52.5 19.4 23.2 14.2
Note: All experiments were conducted under rinse flow rate, before and after cleaning total rinse time, cleaning time of 3.8 LPM, 12 minutes, and 15 minutes, respectively
42
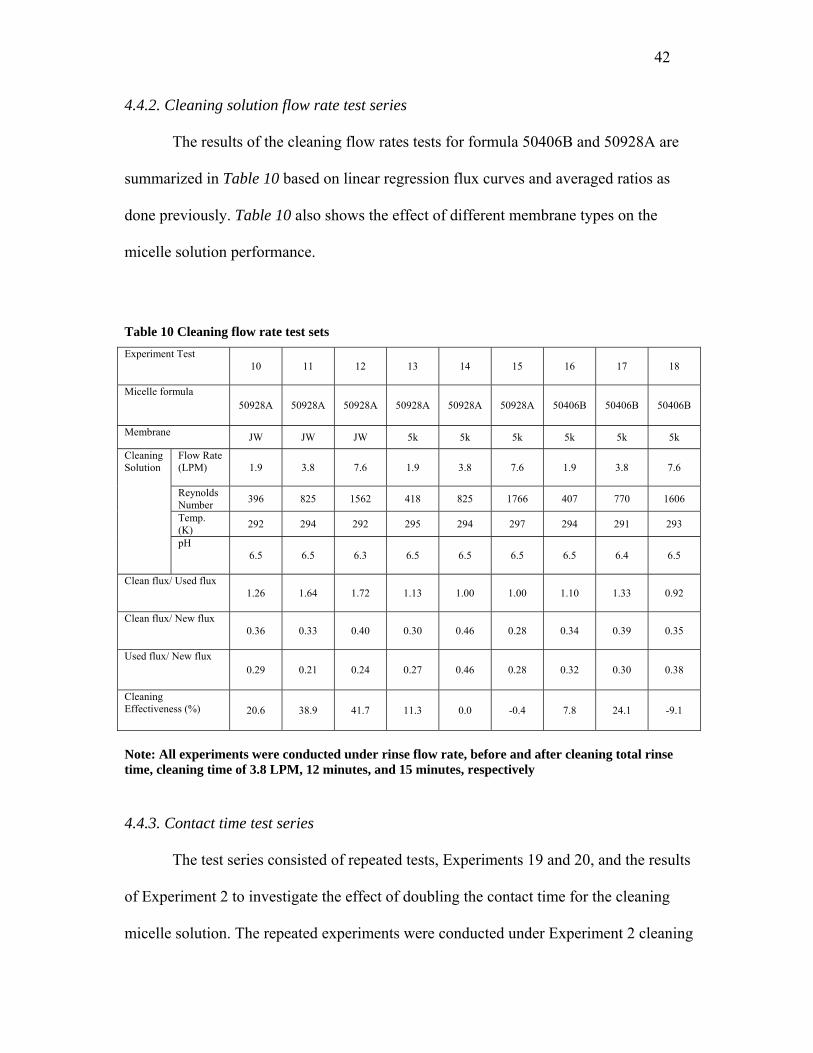
4.4.2. Cleaning solution flow rate test series
The results of the cleaning flow rates tests for formula 50406B and 50928A are
summarized in Table 10 based on linear regression flux curves and averaged ratios as
done previously. Table 10 also shows the effect of different membrane types on the
micelle solution performance.
Table 10 Cleaning flow rate test sets Experiment Test
10 11 12 13 14 15 16 17 18
Micelle formula 50928A 50928A 50928A 50928A 50928A 50928A 50406B 50406B 50406B
Membrane JW JW JW 5k 5k 5k 5k 5k 5k
Flow Rate (LPM)
1.9 3.8 7.6 1.9 3.8 7.6 1.9 3.8 7.6
Reynolds Number 396 825 1562 418 825 1766 407 770 1606
Temp. (K) 292 294 292 295 294 297 294 291 293
Cleaning Solution
pH 6.5 6.5 6.3 6.5 6.5 6.5 6.5 6.4 6.5
Clean flux/ Used flux 1.26 1.64 1.72 1.13 1.00 1.00 1.10 1.33 0.92
Clean flux/ New flux 0.36 0.33 0.40 0.30 0.46 0.28 0.34 0.39 0.35
Used flux/ New flux 0.29 0.21 0.24 0.27 0.46 0.28 0.32 0.30 0.38
Cleaning Effectiveness (%) 20.6 38.9 41.7 11.3 0.0 -0.4 7.8 24.1 -9.1
Note: All experiments were conducted under rinse flow rate, before and after cleaning total rinse time, cleaning time of 3.8 LPM, 12 minutes, and 15 minutes, respectively
4.4.3. Contact time test series
The test series consisted of repeated tests, Experiments 19 and 20, and the results
of Experiment 2 to investigate the effect of doubling the contact time for the cleaning
micelle solution. The repeated experiments were conducted under Experiment 2 cleaning

43
parameters for rinse flow rate, rinse time, and for cleaning flow rate. The experiments
resulted in cleaning effectiveness for Experiment 19 and 20 of 82.7% and 77.2 %,
respectively. The clean flux to un-cleaned flux ratios were 5.77 and 4.40, respectively.
The clean to new flux ratios for set were 0.78 and 1.60. The unclean to new flux ratios
for Experiment 19 and 20 were 0.14 and 0.37, respectively.
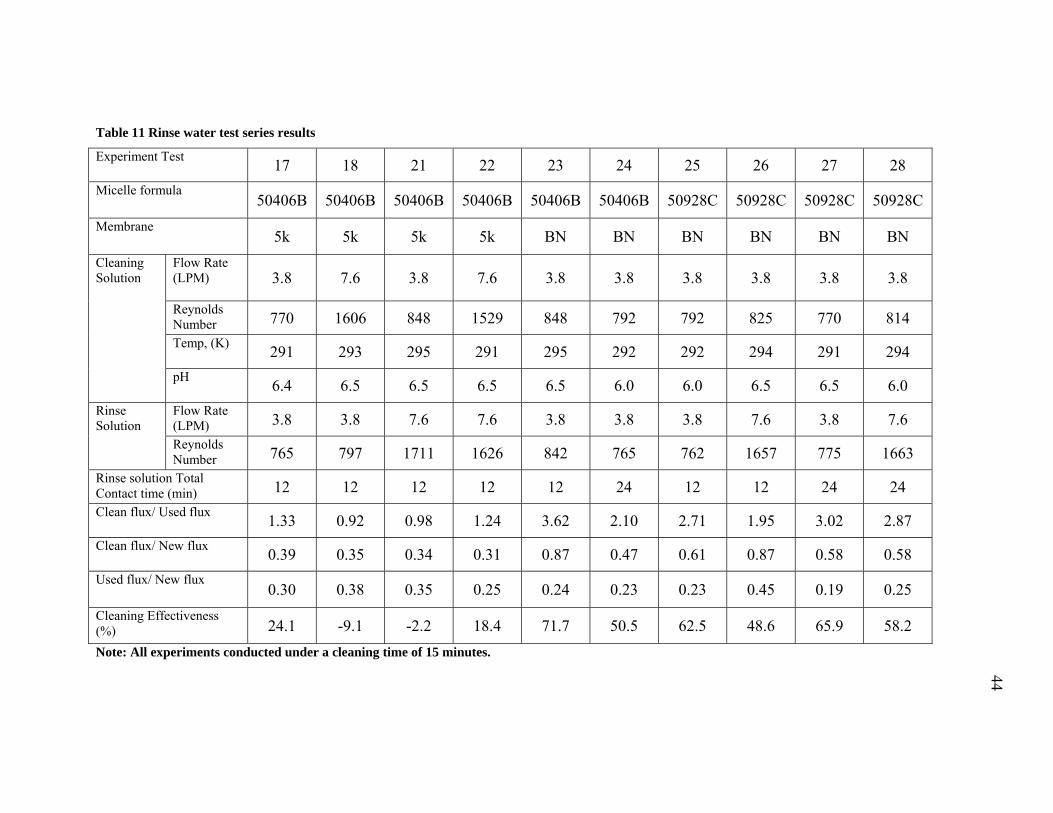
4.4.4. Water rinse test series
Water rinse effects on cleaning results are shown in Table 11. The results are for
doubling the rinse flow rate, rinse duration, or both.
4.4.5. Membrane type and ambient temperature effect
The general effectiveness of the micelle cleaning solution for each membrane
type, see Table 2, was shown under the same test conditions in Experiments 2, 17, and
23. The cleaning effectiveness for this set of experiments was 79.3%, 24.1%, and 71.7%,
respectively. Also, Experiments 10-15 indicated that the membrane type was a factor on
how changing cleaning flow rates affected cleaning solution effectiveness. The
membrane type effect was indicated by the difference in the effect of the cleaning flow
rate for Experiments 10-12 on the JW membrane and the effect shown for Experiments
13-15 for the 5k membrane.
44
Table 11 Rinse water test series results
Experiment Test 17 18 21 22 23 24 25 26 27 28 Micelle formula
50406B 50406B 50406B 50406B 50406B 50406B 50928C 50928C 50928C 50928C Membrane
5k 5k 5k 5k BN BN BN BN BN BN Flow Rate (LPM)
3.8 7.6 3.8 7.6 3.8 3.8 3.8 3.8 3.8 3.8
Reynolds Number 770 1606 848 1529 848 792 792 825 770 814 Temp, (K) 291 293 295 291 295 292 292 294 291 294
Cleaning Solution
pH 6.4 6.5 6.5 6.5 6.5 6.0 6.0 6.5 6.5 6.0 Flow Rate (LPM) 3.8 3.8 7.6 7.6 3.8 3.8 3.8 7.6 3.8 7.6 Rinse
Solution Reynolds Number 765 797 1711 1626 842 765 762 1657 775 1663
Rinse solution Total Contact time (min) 12 12 12 12 12 24 12 12 24 24 Clean flux/ Used flux 1.33 0.92 0.98 1.24 3.62 2.10 2.71 1.95 3.02 2.87 Clean flux/ New flux 0.39 0.35 0.34 0.31 0.87 0.47 0.61 0.87 0.58 0.58 Used flux/ New flux
0.30 0.38 0.35 0.25 0.24 0.23 0.23 0.45 0.19 0.25 Cleaning Effectiveness (%) 24.1 -9.1 -2.2 18.4 71.7 50.5 62.5 48.6 65.9 58.2 Note: All experiments conducted under a cleaning time of 15 minutes.
45
4.5. Discussion
4.5.1. Micelle solution test series
The results from the first series of tests were shown in Table 9 and indicate that
Experiments 2 and 3 showed the best results with highest cleaning effectiveness
percentage and cleaned to un-cleaned flux ratios. In 1994, Lindau and Jonsson reported
acid and basic cleaning of oily water membranes cleaned to un-cleaned flux ratio of 1.3
and 1.4, respectively [11].The data in Table 9 indicates that the performance of the
micelle solution in Experiments 2, 3, and 5 were significantly better than for the
commercial cleaning process (Experiment RC). The data indicated that the micelle
solution generally provided a cleaned to un-cleaned flux ratio greater than the
commercial cleaning process value of 1.17.
Micelle formulas 50406B, 50928A, and 50928C chemically reacted to the
oilfield brine fouled membrane, achieving better cleaning effectiveness by dissolving the
oil particulates on the surface of the fouled membrane into the micelle solution. The data
shows that cleaning of produced water fouled ultrafiltration membranes with micelle is
feasible and more effective than reported in the literature for standard acid and basic
cleaning of such fouled membranes. The results also indicate the micelle solution can be
optimized to obtain the desired oil and water properties to enhance the performance of
the solution.
4.5.2. Cleaning solution flow rate test series
The results of Experiments 10-18 indicated that there might be a maximum or
optimum effective cleaning flow rate for the micelle solution for produced water fouled
membranes. The change in cleaning effectiveness indicated that increasing cleaning flow
46
rate improves performance for Experiments 10-12 but only to a point shown by
Experiments 13-15 for micelle solution 50928A. Solution 50406B and Experiments 16-
18 also showed that increased flow rate improves performance to a point that then
reduced performance. These experiments indicated the point at which cleaning flow
maximizes cleaning effectiveness is dependent on the specific membrane and the micelle
solution formula. The membranes affected the cleaning flow rate effect by how tight the
membrane was and whether the micelle solution penetrates within the membrane by the
increased flow rate.
Experiment 11 and 12 for the micelle solution also indicated that increasing the
cleaning flow rate above the rates of the fouling solution flow rates (see Table 6) show
only marginal cleaning effectiveness improvement from 38.9% to 41.7%. This result
along with Experiments 15 and 18 indicates that increasing micelle solution cleaning
above the operation flow is not necessary or significantly beneficial to cleaning
effectiveness. Cleaning flow rates above the operational flow rates for Experiment 15
and 18 yielded cleaning effectiveness of- 0.4% and -9.1% respectively or a flux
reduction due to the cleaning cycle.
4.5.3. Micelle solution contact time test series
Experiment 2 and repeated experiments for doubling the contact time of the
micelle solution Experiments 19 and 20 indicated that no significant effect on the
cleaning performance was achieved by the increased contact time. The three
experiments, Experiments 2, 19-20, resulted in cleaning effectiveness of 79.3%, 82.7%,
and 77.2%, respectively. The three experiments showed little if any change in
effectiveness between the repeated longer contact time tests and Experiment 2 that

47
would not be expected for repeated experiments. The set of three experiments show the
reaction time of the micelle solution is not the limiting factor on the cleaning
effectiveness. The experiments indicated the cleaning flow rate described earlier has a
greater effect on performance than contact time.
4.5.4. Water rinse test series
Comparison of results obtained between Experiments 17 and 21, 18 and 22, and
between Experiment 25 and 26 indicates the effect of doubling the rinse water flow rates
from 3.8 LPM to 7.6 LPM. The data indicates that doubling the water rinse flow rate for
the cleaning cycle greatly reduces the effectiveness of the cleaning solution unless the
micelle solution flow rate was also doubled. Previous experimental series data indicated
that increasing the cleaning solution flow rate above the operational condition of fouling
was not beneficial. The combined effect of these facts indicate that for the micelle
solution, the cleaning flow rate and the rinse flow rate should be the same for the most
effective cleaning cycle. These results in the conclusion that turbulent flow effects of
higher cross flows had no significant advantage on cleaning effectiveness for the micelle
solution. The micelle solution cleaning cycle flow rate should be determined by the
membrane specification on size or by the separation flow rate used during operation of
the membrane.
Experimental data comparison shows that rinse cycle flow rate does have an
effect on the cleaning effectiveness shown in Figure 8.
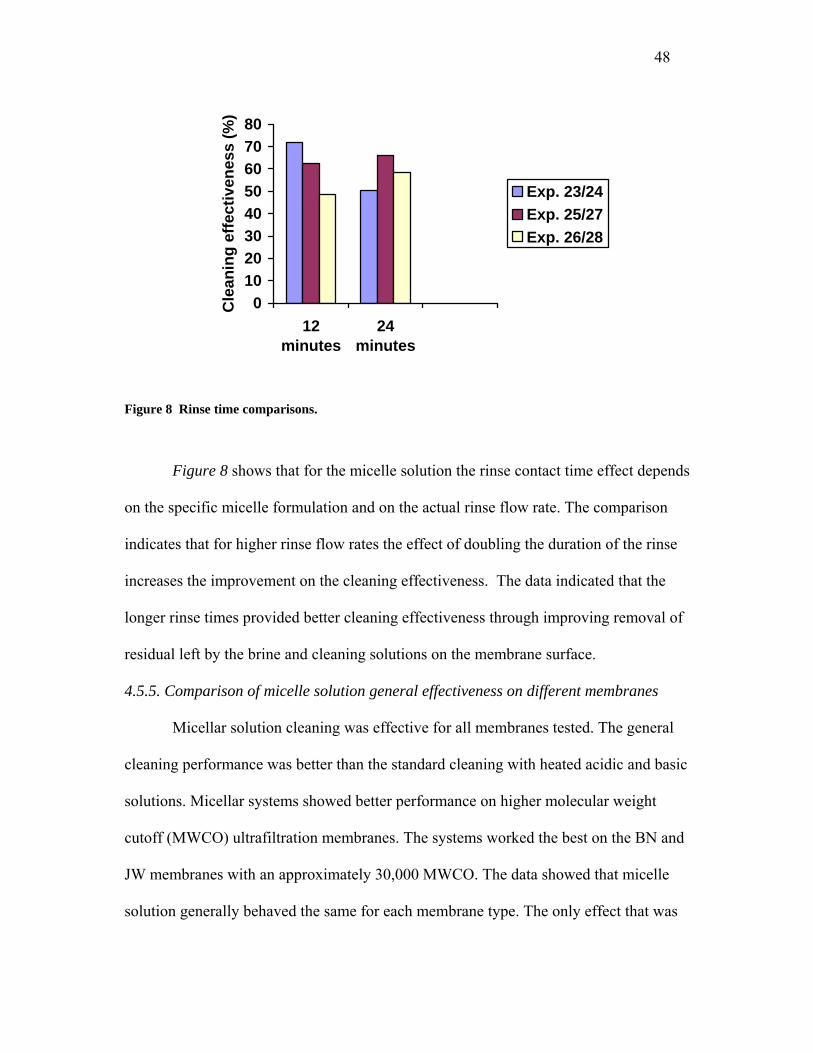
48
01020304050607080
12minutes
24minutes
Cle
anin
g ef
fect
iven
ess
(%)
Exp. 23/24Exp. 25/27Exp. 26/28
Figure 8 Rinse time comparisons.
Figure 8 shows that for the micelle solution the rinse contact time effect depends
on the specific micelle formulation and on the actual rinse flow rate. The comparison
indicates that for higher rinse flow rates the effect of doubling the duration of the rinse
increases the improvement on the cleaning effectiveness. The data indicated that the
longer rinse times provided better cleaning effectiveness through improving removal of
residual left by the brine and cleaning solutions on the membrane surface.
4.5.5. Comparison of micelle solution general effectiveness on different membranes
Micellar solution cleaning was effective for all membranes tested. The general
cleaning performance was better than the standard cleaning with heated acidic and basic
solutions. Micellar systems showed better performance on higher molecular weight
cutoff (MWCO) ultrafiltration membranes. The systems worked the best on the BN and
JW membranes with an approximately 30,000 MWCO. The data showed that micelle
solution generally behaved the same for each membrane type. The only effect that was
49
indicated by the different membranes was the limit on cleaning flow rate for the tighter
membranes tested.
The average temperature of the micelle solution during cleaning for all
experiments was monitored. The temperature of the cleaning solution, a factor in
cleaning performance, was not controlled and dictated by ambient test conditions and
heat added due to the pump and line friction was within range 10K for all tests
conducted.
The commercial cleaning process recommended by Ecolab required higher
cleaning temperatures than the ambient conditions utilized for the micelle solutions. The
commercial cleaning process included three different chemical solutions. The first
solution (Ultrasil 53) was an enzymatic cleaning solution developed for organic or
biological fouling by proteins, lipids and other biological components. The solution was
developed for other organic applications and not specifically for oily water applications.
The other two solutions (Ultrasil MP and Ultrasil 10) were buffered acidic and basic
cleaning solutions to provide low and high pH solutions that were within membrane pH
specifications. These solutions were developed for mineral fouling that would require a
non-neutral pH to facilitate membrane cleaning. The micellar cleaning solution was
developed to specifically react with oily water deposits from produced water to improve
membrane cleaning. The micellar cleaning generally provided better performance than
enzyme cleaning for oily water fouled membranes and was achieved at lower
temperature (see Table 9). The better performance would be due to the specific design of
the micelle solution for oily water organics when compared to organics left by biological
components. The micellar cleaning would also be able to provide improved cleaning

50
when compared to higher temperature acidic and basic solution for oily water fouled
membranes of literature and commercial cleaning process.
4.6. Conclusions
Micellar solutions were effective in cleaning the produced water fouled
membranes. The results indicated that the micelle solution can be optimized to perform
better on the produced water fouled membranes according to micro emulsion properties.
The results showed that the micelle solution performed better on 30,000 MWCO
ultrafiltration membranes than with the tighter 5,000 MWCO membrane. The study
showed that the four cleaning cycle parameters affected the micellar system
performance. The four parameters for optimization of the micelle system were the
micelle formula, the cleaning flow rate influenced by the MWCO, rinse duration, and the
membrane type. The micelle solution formula had the most effect on performance,
followed by the membrane type or size, then the cleaning flow rate, and last the duration
of the water rinses. Cleaning flow rate and water rinse duration showed significant
improvement on the base level of cleaning effectiveness of the solution on a membrane
type.
The micelle solution does provide greatly improved cleaning performance for
produced water or oily water fouled membranes over the standard cleaning solution of
acid and basic solution typically employed by the membrane industry. The cleaning
temperature utilized yielded that a micelle solution can be formulated to operate at
ambient conditions and to eliminate the requirement of a heat source for an onsite
membrane unit. With optimization, a micelle cleaning solution can provide a very cost
effective solution to cleaning oily water fouled membranes at ambient temperature.
51
5. SUMMARY AND CONCLUSIONS
The first objective of the study was to evaluate the use of three commercial
membranes, JW, 5k, and BN, for the pretreatment of produced water. The study
conducted showed that PVDF ultrafiltration membranes could provide treatment to less
than 5 NTU for subsequent desalination for an onsite produced water treatment system.
The results showed that the turbidity removal ranges for JW, 5k, and BN ultrafiltration
membranes were 99.27% to 99.87%, 95.75% to 99.82%, and 99.71% to 99.82%,
respectively. The study showed that the oil removal ranged for JW, 5k, and BN
ultrafiltration membranes were 59.52% to 90.43%, 47.32% to 87.27%, and 78.20% to
94.31%, respectively. BN membrane would be the best membrane available for the
treatment of the produced water to meet feed specification for desalination. The data also
indicated that for the BN membrane no effect was shown for operation parameters of
TMP and feed flow rate on water quality. The 5k and the JW membranes showed TMP
and feed flow rate affected the water quality performance of the membrane.
The second objective focused on the cleaning of produced water fouled
membranes by micelle solution. The study consisted of using linear regression to
calculate average flux ratios and cleaning effectiveness. The data showed that the use of
a micelle solution to clean the produced water fouled membranes was a feasible and
effective method. The study showed that the micelle solution performed better than
acidic and basic solutions reported in the literature for this type of foulant. The study
also showed that the micelle solution performed better than the recommended
commercial cleaning process for produced water fouled membranes. The study showed

52
with further adjustment of the micelle solution the cleaning effectiveness could be
optimized for an ambient temperature cleaning of membranes.
The last objective was to evaluate the micellar solution cleanup under varying
operation parameters. The parameters were the membrane type or size, cleaning flow
rate, cleaning duration, rinse flow rate, and rinse duration. The studied showed that for
the micelle solution the cleaning effectiveness was not affected by cleaning duration or
the rinse flow rate. The study did demonstrate that the cleaning flow rate improved
performance but was limited by membrane type or MWCO. The results also indicate that
increasing the duration of the rinse before and after cleaning improved the overall
effectiveness of the micelle solution cleaning of the produced water fouled membranes.

53
6. RECOMMENDATIONS
Based on the first study, the use of the BN membrane should be field tested on a
pilot plant for the pretreatment of produced water. The BN membrane should be field
tested for treatment effectiveness over longer periods. Investigation into the mechanism
of fouling of the ultrafiltration membrane by the produced water to explore the two rate
of fouling decay observed during the study. Additional studies on the water quality
obtained by the membranes should be conducted checking for removal of the other
contaminants found in produced water sources. Investigation of hollow fiber membranes
for the treatment should be studied and compared to the data obtained for spiral
membranes. The micelle solution needs to be field tested on pilot equipment. The
micelle solution needs further optimization for cleaning produced water fouled
membranes. Studies need to be performed how long the cleaning solution will remain
effective in cleaning the membranes. Also, tests should be conducted with higher pH
micelle solutions for improved membrane cleaning effectiveness. Statistical testing of
the cleaning effectiveness of the optimized micelle solution should be formed to validate
its effectiveness for cleaning the produced water fouled membranes.

54
REFERENCES
[1] Railroad Commission of Texas. RRC: William Partners with Texas A&M to
Increase State Water Supply News release September 13, 2002.
www.rrc.tx.us/commissioner/willliams/williams.html (accessed May 2005).
[2] Siddiqui, M.A., Sustainable Development through Beneficial Use of Produced
Water for the Oil and Gas Industry, M.S. thesis Texas A&M University, College
Station, TX 2002.
[3] M. Reed and S. Johnsen (Editors), Legislative and Management Issues, in
Produced Water 2: Environmental Issues and Mitigation Technologies, Plenum
Press, New York, 1996, pp. 3-41.
[4] J. P. Ray and F. R. Engelhardt (Editors), Chemical Characterization, in Produced
Water: Technical/Environmental Issues and Solutions, Plenum Press, New York,
1992, pp. 97-174.
[5] J. P. Ray and F. R. Engelhardt (Editors), Method Development and New
Technology, in Produced Water: Technical/Environmental Issues and Solutions,
Plenum Press, New York, 1992, pp. 455-604.
[6] M. Reed and S. Johnsen (Editors), Technology for Mitigation, in Produced Water
2: Environmental Issues and Mitigation Technologies, Plenum Press, New York,
1996, pp. 413-532.
[7] H.J. Zwijnenberg, G.H. Koops and M. Wessling, Solar driven membrane
pervaporation for desalination processes, J. Membrane Sci. 250 (2005) 235-246.
55
[8] T. Sirivedhin, J. McCue and L. Dallbauman, Reclaiming produced water for
beneficial use: salt removal by electrodialysis, J. Membrane Sci. 243 (2004) 335-
343.
[9] J. Mueller, Y. Cen and R. H. Davis, Crossflow microfiltration of oily water, J.
Membrane Sci. 129 (1997) 221-235.
[10] M. Cheryan, Ultrafiltration and Microfiltration Handbook, CRC Press LLC,
New York, 1998.
[11] G. Trägårdh, Membrane cleaning, Desalination 71 (1989) 325-335.
[12] J. Lindau and A-S. Jönsson, Cleaning of ultrafiltration membranes after
treatment of oily waste water, J. Membrane Sci. 87 (1994) 71-78.
[13] H. Flemming, Reverse osmosis membrane biofouling, Experimental Thermal
and Fluid Sci. 14 (1997) 382-391.
[14] J. Paul Chen, S. L. Kim and Y. P. Ting, Optimization of membrane physical
and chemical cleaning by a statistically designed approach, J. Membrane Sci.,
219, (2003) 27-45.
[15] S. Ebrahim, Cleaning and regeneration of membranes in desalination and
wastewater applications: State-of-the-art, Desalination 96 (1994) 225-238.
[16] W. S. Ang, S. Lee and M. Elimelech, Chemical and physical aspects of
cleaning of organic-fouled reverse osmosis membranes, J. Membrane Sci., 217,
(2006) 198-210.
[17] Z. Allie, E. P. Jacobs, A. Maartens and P. Swart, Enzymatic cleaning of
ultrafiltration membranes fouled by abattoir effluent, J. Membrane Sci. 218
(2003) 107-116.
56
[18] S. Pavlova, Study on the cleaning of new ultrafiltration spiral-wound modules
to prevent membrane fouling (including biological fouling), Desalination 172
(2005) 267-270.
[19] B. Nicolaisen, Developments in membrane technology for water treatment,
Desalination 153 (2003) 355-360.
[20] K. C. Channabasappa, Membrane technology for water reuse application,
Desalination 23 (1966) 495-514.
[21] J. Qin, M. H. Oo, H. Lee and R. Kolkman, Dead-end ultrafiltration for
pretreatment of RO in reclamation of municipal wastewater effluent, J.
Membrane Sci. 243 (2004) 107-113.
[22] K. Karakulski, A. Kozlowski and A. W. Morawski, Purification of oily
wastewater by ultrafiltration, Separations Technol. Volume 5 (1995) 197-205.
[23] B. Schlichter, V. Mavrov and H. Chmiel, Study of a hybrid process combining
ozonation and microfiltration/ultrafiltration for drinking water production from
surface water, Desalination 168 (2004) 307-317.
[24] L. Liangxiong, T. M. Whitworth and R. Lee, Separation of inorganic solutes
from oil-field produced water using a compacted bentonite membrane, J.
Membrane Sci. 217 (2003) 215-225.
[25] General Electic, GE Sepa™ CF II Med/High Foulant System Product
Information (1995-2006) Available:
www.osmolabstore.com/OsmoLabPage.dll?BuildPage&1&1&171#.
57
[26] B. Dalmacija, Z. Tamas, E. Karlovic and D. Miskovic, Tertiary treatment of
oil-field brine in a biosorption system with granulated activated carbon, Water
Res. 30 (1996) 1065-1068.
[27] S. Rubach, I.F. Saur, Onshore testing of produced water by electroflocculation,
Filtr. Sep. 34 (1997) 877–882.
[28] D.L. Gallup, E.G. Isacoff, D.N. Smith III, Use of Ambersorb® carbonaceous
adsorbent for removal of BTEX compounds from oil-field produced water,
Environ. Prog. 15 (1996) 197–203.
[29] G.T. Tellez, N. Nirmalakhandan, J.L. Gardea-Torresdey, Performance
evaluation of an activated sludge system for removing petroleum hydrocarbons
from oilfield produced water, Adv. Environ. Res. (2002) 455–470.
[30] G. Ji, T. Sun, Q. Zhou, X. Sui, S. Chang, P. Li, Constructed subsurface flow
wetland for treating heavy oil-produced water of the Liaohe Oilfield in China,
Ecol. Eng. 18 (2002) 459–465.
[31] T. Bilstad, Espedal, Membrane separation of produced water, Water Sci.
Technol. 34 (1996) 239–246.
[32] C.A. Dyke, C.R. Bartels, Removal of organics from offshore produced waters
using nanofiltration membrane technology, Environ. Prog. 9 (1990) 183–186.

58
VITA
Scott Jay Beech Professional Address: 142 Scoates Hall Texas A&M University College Station, TX 77843-2117 Permanent Address: 305 Flagship Dr May, TX 76857-1813 Education: Texas A&M University, B.S. Chemical Engineering, May 2004 Texas A&M University, M.S. Biological and Agricultural Engineering, August 2006 Work Experience: Texas Agricultural Experiment Station, College Station, TX (10/04-present) Research Assistant
• Designed & Built 1 field desalination unit
Vector Marketing Corporation, Amarillo, TX
(6/01-8/01)
Sales Representative • Sold company product directly
Demand Staff Inc. Brownwood, TX
(6/00-8/00)
Day worker • Built buildings for local contractor
Keith Silman Painting & Remodeling Amarillo, TX
(6/99-8/99)
Painter • Built commercial cabinets • Painted commercial and residential buildings