
Oil Price Outlook - Brandon Hill Capital · Oil Price Outlook 20 July 2017 This is a marketing...
12
OIL & GAS FLASHNOTE Oil Price Outlook 20 July 2017 This is a marketing communication. It has not been prepared in accordance with legal requirements designed to promote the independence of investment research and is not subject to any prohibition on dealing ahead of the dissemination of investment research. Non-US research analysts who have prepared this report are not registered/qualified as research analysts with FINRA, may not be associated persons of the member organisation and may not be subject to NASD/NYSE restrictions on communications with a subject company, public appearances and trading securities held by a research analyst account. Disclosures can be found at the end of the report. William Arnstein Tel: +44 (0)20 3463 5020 william.arnstein@brandonhillcapital.com www.brandonhillcapital.com More action needed from OPEC in the short term, but medium term outlook for oil prices improving After an initial positive response to OPEC’s decision to cut production, oil prices have now fallen close to 12 month lows. Restoration of shut-in production from Libya and Nigeria, both outside of OPEC agreed cuts, as well as a stronger than expected recovery in US production, appears to have undermined the supply/demand balance seen in early 2017. The outlook for 2018 suggests little improvement in the overall balance and we believe OPEC will need to extend the current agreed cuts and perhaps take further action to normalise inventories. In response to lower oil prices and cost inflation there is a possibility US production growth, which is expected to add 1mmbopd in 2018, may also begin to ease, although we would not expect a significant change. This would certainly help sentiment, but without any supply shocks, oil prices will likely remain in a US$40-60/bbl range. The implication of a low oil price environment has been a collapse in investment targeting conventional oil resources, which due to the time lag between discovery, project sanction and new developments coming onstream, may risk a supply shortfall in the medium term. Due to operational constraints, we believe US unconventional oil is unable expanded quickly enough to bridge this gap alone and OPEC spare capacity is already far from high leaving the industry exposed to periods of higher oil prices and increased volatility in the medium term. Our longer-term view beyond 2030 is more cautious as structural changes in the transportation markets erode oil demand growth and possibly leads to so called ‘peak oil’. As discussed on the following pages, leaders in the automotive and oil industry have quite different views on this and public policy will also play a crucial role. Due to this uncertainty, we recommended avoiding long duration oil stocks, preferring lower cost producers and short to medium term explorers, where the commercial risks are manageable.
Transcript of Oil Price Outlook - Brandon Hill Capital · Oil Price Outlook 20 July 2017 This is a marketing...
OIL & GAS FLASHNOTE
Oil Price Outlook 20 July 2017
This is a marketing communication. It has not been prepared in accordance with legal requirements designed to promote the independence of investment research and is not subject to any
prohibition on dealing ahead of the dissemination of investment research. Non-US research analysts who have prepared this report are not registered/qualified as research analysts with
FINRA, may not be associated persons of the member organisation and may not be subject to NASD/NYSE restrictions on communications with a subject company, public appearances and
trading securities held by a research analyst account. Disclosures can be found at the end of the report.
William Arnstein
Tel: +44 (0)20 3463 5020
www.brandonhillcapital.com
More action needed from OPEC in the short term, but medium term outlook for oil prices improving After an initial positive response to OPEC’s decision to cut production, oil
prices have now fallen close to 12 month lows. Restoration of shut-in
production from Libya and Nigeria, both outside of OPEC agreed cuts, as well
as a stronger than expected recovery in US production, appears to have
undermined the supply/demand balance seen in early 2017.
The outlook for 2018 suggests little improvement in the overall balance and
we believe OPEC will need to extend the current agreed cuts and perhaps take
further action to normalise inventories. In response to lower oil prices and cost
inflation there is a possibility US production growth, which is expected to add
1mmbopd in 2018, may also begin to ease, although we would not expect a
significant change. This would certainly help sentiment, but without any supply
shocks, oil prices will likely remain in a US$40-60/bbl range.
The implication of a low oil price environment has been a collapse in
investment targeting conventional oil resources, which due to the time lag
between discovery, project sanction and new developments coming onstream,
may risk a supply shortfall in the medium term. Due to operational constraints,
we believe US unconventional oil is unable expanded quickly enough to bridge
this gap alone and OPEC spare capacity is already far from high leaving the
industry exposed to periods of higher oil prices and increased volatility in the
medium term.
Our longer-term view beyond 2030 is more cautious as structural changes in
the transportation markets erode oil demand growth and possibly leads to so
called ‘peak oil’. As discussed on the following pages, leaders in the
automotive and oil industry have quite different views on this and public policy
will also play a crucial role.
Due to this uncertainty, we recommended avoiding long duration oil
stocks, preferring lower cost producers and short to medium term
explorers, where the commercial risks are manageable.
OIL & GAS FLASHNOTE 20 July 2017
| Brandon Hill Capital 2
Oil demand trends
Since the financial crisis in 2008 and 2009, oil consumption has been consistently strong
growing by more than 1% in each year. In 2016, oil demand rose by 1.6mmbopd (1.6% YoY),
which was well above the 10-year average growth rate of 1.1mmbopd (1.2%), albeit slower
than the 2.0mmbopd (2.1%) rate achieved in 2015. The primary sources of demand growth
were in China (0.4mmbopd), Europe (0.3mmbopd) and India (0.3mmbopd), although Chinese
demand growth, despite an increase in their strategic reserves, was the slowest since 2008.
Oil consumption is expected to remain robust during the next few years, with the IEA
forecasting that growth in 2017 and 2018 will remain above average, at 1.3mmbopd and
1.4mmbopd, respectively (Oil Market Report, 14 June 2017). Future oil demand growth is
expected to be entirely attributed to non-OECD countries, with consumption in OECD countries
forecast to remain essentially flat in the next two years. Following robust growth in 2015 and
2016, this slow-down may indicate a possible resumption in a downward trend that commenced
in 2006, when oil demand peaked at 50mmbopd. Demand in OECD countries has since fallen
by 3.8mmbopd (7.6%) and BP, in its recent Energy Outlook 2017 report, forecasts that OECD
oil demand is likely to decline at 1% p.a. out to 2035, equating to a 12mmbopd drop from peak
levels.
In contrast, during the same period, demand from non-OECD countries is forecast to rise by
23mmbopd (2.0% p.a.), with China and India providing more than half of this. According to BP
this will increase total demand to 110mmbopd in 2035 (down 2mmbopd from 2016 forecasts),
but sees the annual growth rate fall to just 0.7%.
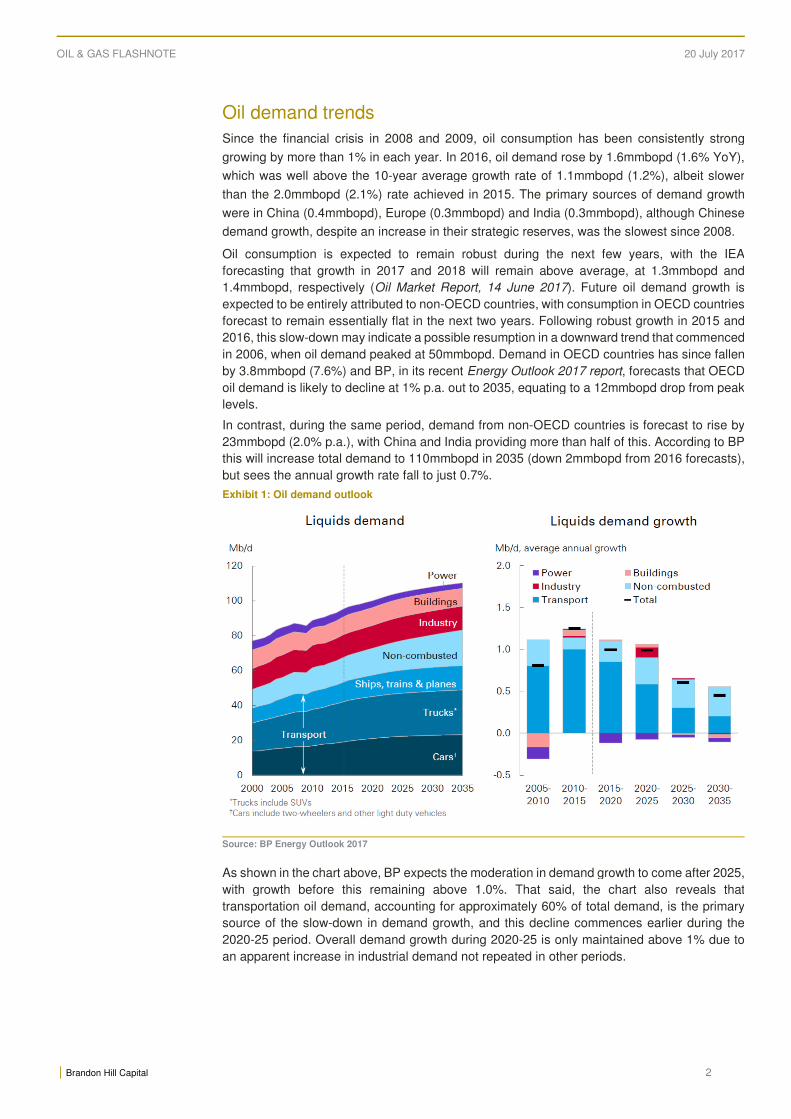
Exhibit 1: Oil demand outlook
Source: BP Energy Outlook 2017
As shown in the chart above, BP expects the moderation in demand growth to come after 2025,
with growth before this remaining above 1.0%. That said, the chart also reveals that
transportation oil demand, accounting for approximately 60% of total demand, is the primary
source of the slow-down in demand growth, and this decline commences earlier during the
2020-25 period. Overall demand growth during 2020-25 is only maintained above 1% due to
an apparent increase in industrial demand not repeated in other periods.

OIL & GAS FLASHNOTE 20 July 2017
| Brandon Hill Capital 3
The expected decline in the growth rate in transportation oil demand is principally driven by an
assumed increase in car fuel efficiency (from 1.5% to 2.6% p.a.) and to a lesser extent
structural changes in the market driven by the emergence of electric vehicles (“EV”). In
aggregate these savings are more than offset by an increase in the number of vehicles, which
are expected to double to approximately 1.8Bn by 2035, so overall oil demand from car
transportation is forecast to increase by 4mmbopd to 23mmbopd.
Exhibit 2: Changes in oil demand from car transportation
Source: BP Energy Outlook 2017
The limited impact from the growth in electric vehicles on future oil demand is perhaps the most
surprising aspect of this, however, this outlook is highly uncertain with a wide range of forecasts
from different sections of the market. For instance, from an existing market share of 0.2% (2m
vehicles), a slide from the Ford investor day (September 2016) shows estimates that the
penetration of electric vehicles could reach 30% by 2030 (~450m vehicles), while BP forecasts
the market share will be just 6% by 2035 (~108m vehicles). These forecasts assume compound
growth rates of ~47% and ~23%, respectively, against overall fleet growth of ~3.7%.
To put these figures in context, the Two Degrees Warming Scenario (“2DS”) assumes ~160m
EVs (11% market share) in 2030, the Beyond Two Degrees Warming Scenario (“B2DS”)
assumes ~210m EVs (14% market share) and the Reference Technology Scenario (“RTS”),
which is based on projections that reflect existing and proposed government policies, assumes
~56m EVs (4% market share). The Electric Vehicle Initiative (“EVI”), which is a multi-
government supported policy forum co-led by China and the US and accounting for 95% of the
current EV market, goes beyond this targeting a 30% collective market share by 2030
(including trucks, buses and other commercial vehicles).
Even at 60% growth rates, as achieved in 2016, it will take at least a decade for electric vehicles
to become a material segment of the market and recent growth rates have in fact been falling,
from 77% in 2015 and 85% in 2014. Interim targets set by a group of the largest manufacturers
(including BMW, Chevrolet, Daimler, Ford, Honda, Renault-Nissan, Tesla, VW, Volvo and
various Chinese manufacturers) seem more realistic (at the lower end), aiming for between 9m
and 20m EVs in 2020 and 40m and 70m EVs in 2025.
In the short-term, development of the EV market remains entirely reliant on continued
government support but, in time, cost parity should be achieved as battery costs fall and optimal
manufacturing scale is reached, while other barriers, such as choice, education and
infrastructure ease. The recent IEA Global EV Outlook 2017 report forecasts that electric
vehicles will be fully cost competitive by 2030 and much lower cost for high mileage users,
while other reports suggest this could be achieved sometime between 2020 and 2025.
Inevitably, government incentives will be removed and new barriers will emerge (i.e. road
OIL & GAS FLASHNOTE 20 July 2017
| Brandon Hill Capital 4
taxation), while investment diverted from conventional engine development may lead to a slow-
down in efficiency gains.
While the BP forecasts assume a relatively small impact on oil demand from the growth in
electric vehicles, the alternative scenarios highlighted above, if realised, could have a bigger
impact. This potential downside is somewhat insulated by the fact that 80% of oil demand,
contributing ~9mmbopd of demand growth by 2035, is unrelated to car transportation and the
electrification of trucks and aeroplanes, while occasionally mentioned, seem far less probable.
This means that just 30% of forecast oil demand growth is at risk and based on BP’s
calculations for the sensitivity of oil demand to electric vehicles (BP forecast a 1.2mmbopd
reduction in oil demand for every 100m electric vehicles) it would take an additional 330m EVs
(c.440m EVs in total) for this demand to disappear. This would need to rise to close to 1.2Bn
EVs (equivalent to a 2/3 market share) to offset the entire expected growth in oil demand and
for ‘peak oil’ to have been realised.
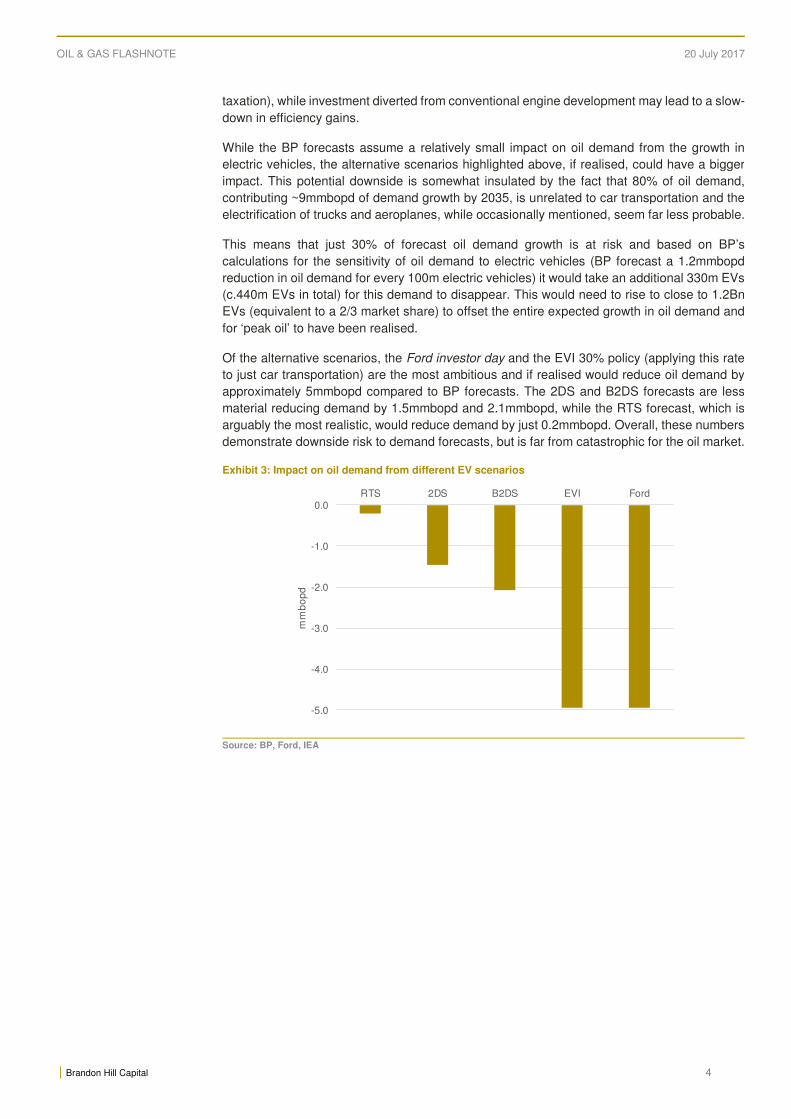
Of the alternative scenarios, the Ford investor day and the EVI 30% policy (applying this rate
to just car transportation) are the most ambitious and if realised would reduce oil demand by
approximately 5mmbopd compared to BP forecasts. The 2DS and B2DS forecasts are less
material reducing demand by 1.5mmbopd and 2.1mmbopd, while the RTS forecast, which is
arguably the most realistic, would reduce demand by just 0.2mmbopd. Overall, these numbers
demonstrate downside risk to demand forecasts, but is far from catastrophic for the oil market.
Exhibit 3: Impact on oil demand from different EV scenarios
Source: BP, Ford, IEA
-5.0
-4.0
-3.0
-2.0
-1.0
0.0RTS 2DS B2DS EVI Ford
mm
bo
pd
OIL & GAS FLASHNOTE 20 July 2017
| Brandon Hill Capital 5
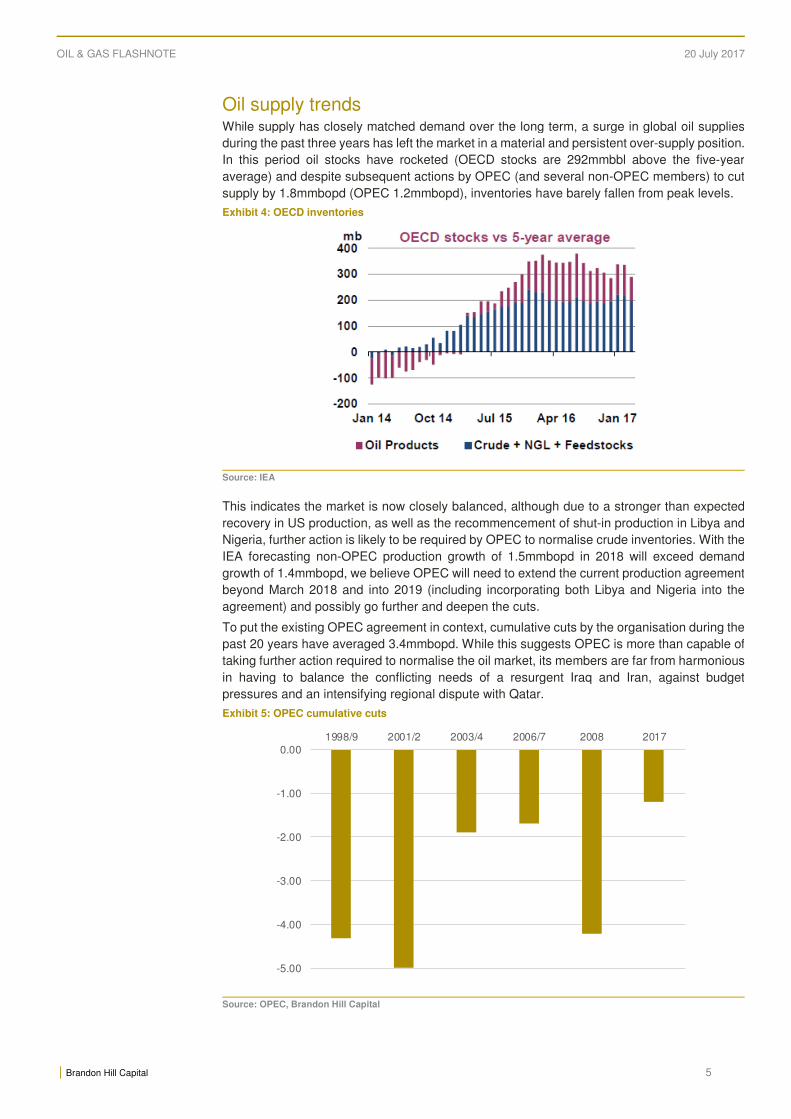
Oil supply trends While supply has closely matched demand over the long term, a surge in global oil supplies
during the past three years has left the market in a material and persistent over-supply position.
In this period oil stocks have rocketed (OECD stocks are 292mmbbl above the five-year
average) and despite subsequent actions by OPEC (and several non-OPEC members) to cut
supply by 1.8mmbopd (OPEC 1.2mmbopd), inventories have barely fallen from peak levels.
Exhibit 4: OECD inventories
Source: IEA
This indicates the market is now closely balanced, although due to a stronger than expected
recovery in US production, as well as the recommencement of shut-in production in Libya and
Nigeria, further action is likely to be required by OPEC to normalise crude inventories. With the
IEA forecasting non-OPEC production growth of 1.5mmbopd in 2018 will exceed demand
growth of 1.4mmbopd, we believe OPEC will need to extend the current production agreement
beyond March 2018 and into 2019 (including incorporating both Libya and Nigeria into the
agreement) and possibly go further and deepen the cuts.
To put the existing OPEC agreement in context, cumulative cuts by the organisation during the
past 20 years have averaged 3.4mmbopd. While this suggests OPEC is more than capable of
taking further action required to normalise the oil market, its members are far from harmonious
in having to balance the conflicting needs of a resurgent Iraq and Iran, against budget
pressures and an intensifying regional dispute with Qatar.
Exhibit 5: OPEC cumulative cuts
Source: OPEC, Brandon Hill Capital
-5.00
-4.00
-3.00
-2.00
-1.00
0.001998/9 2001/2 2003/4 2006/7 2008 2017
OIL & GAS FLASHNOTE 20 July 2017
| Brandon Hill Capital 6
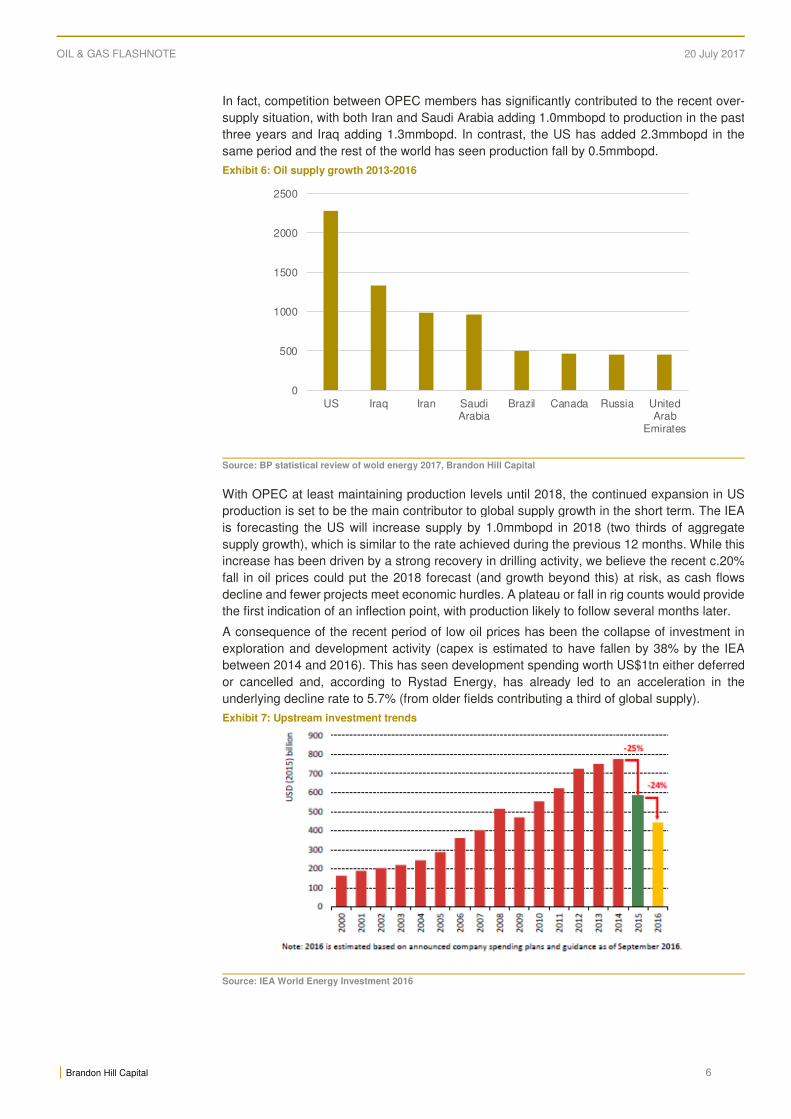
In fact, competition between OPEC members has significantly contributed to the recent over-
supply situation, with both Iran and Saudi Arabia adding 1.0mmbopd to production in the past
three years and Iraq adding 1.3mmbopd. In contrast, the US has added 2.3mmbopd in the
same period and the rest of the world has seen production fall by 0.5mmbopd.
Exhibit 6: Oil supply growth 2013-2016
Source: BP statistical review of wold energy 2017, Brandon Hill Capital
With OPEC at least maintaining production levels until 2018, the continued expansion in US
production is set to be the main contributor to global supply growth in the short term. The IEA
is forecasting the US will increase supply by 1.0mmbopd in 2018 (two thirds of aggregate
supply growth), which is similar to the rate achieved during the previous 12 months. While this
increase has been driven by a strong recovery in drilling activity, we believe the recent c.20%
fall in oil prices could put the 2018 forecast (and growth beyond this) at risk, as cash flows
decline and fewer projects meet economic hurdles. A plateau or fall in rig counts would provide
the first indication of an inflection point, with production likely to follow several months later.
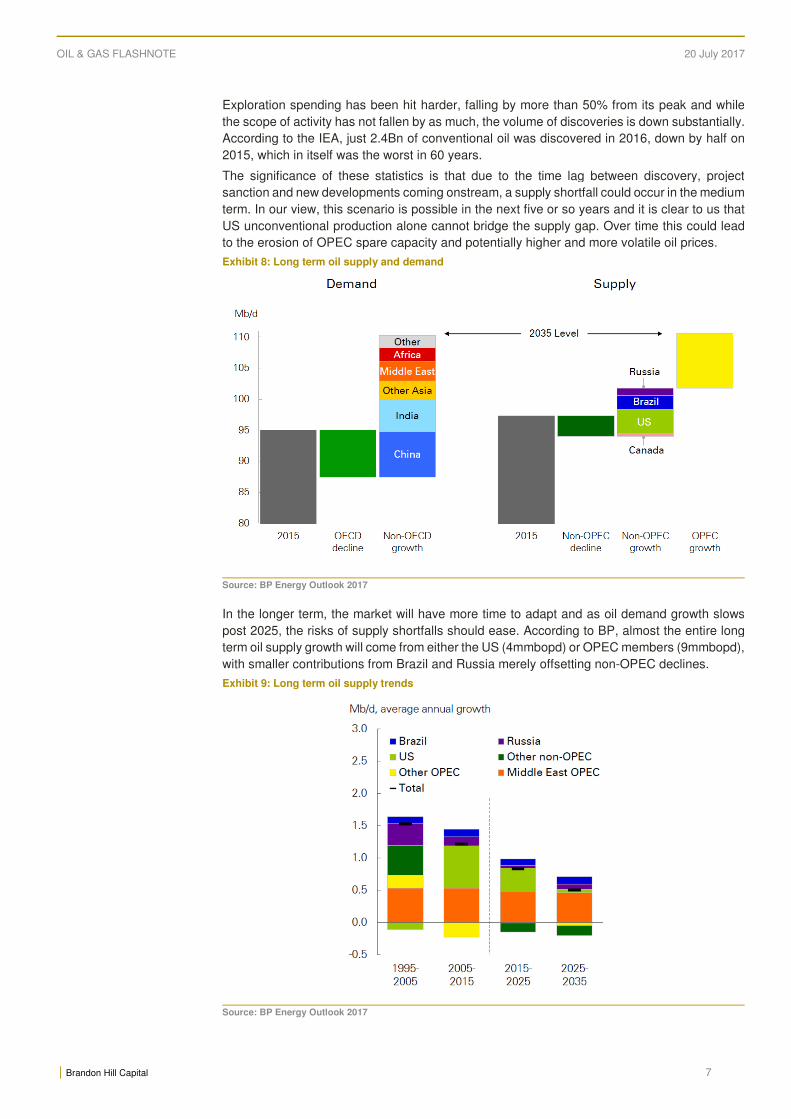
A consequence of the recent period of low oil prices has been the collapse of investment in
exploration and development activity (capex is estimated to have fallen by 38% by the IEA
between 2014 and 2016). This has seen development spending worth US$1tn either deferred
or cancelled and, according to Rystad Energy, has already led to an acceleration in the
underlying decline rate to 5.7% (from older fields contributing a third of global supply).
Exhibit 7: Upstream investment trends
Source: IEA World Energy Investment 2016
0
500
1000
1500
2000
2500
US Iraq Iran SaudiArabia
Brazil Canada Russia UnitedArab
Emirates
OIL & GAS FLASHNOTE 20 July 2017
| Brandon Hill Capital 7
Exploration spending has been hit harder, falling by more than 50% from its peak and while
the scope of activity has not fallen by as much, the volume of discoveries is down substantially.
According to the IEA, just 2.4Bn of conventional oil was discovered in 2016, down by half on
2015, which in itself was the worst in 60 years.
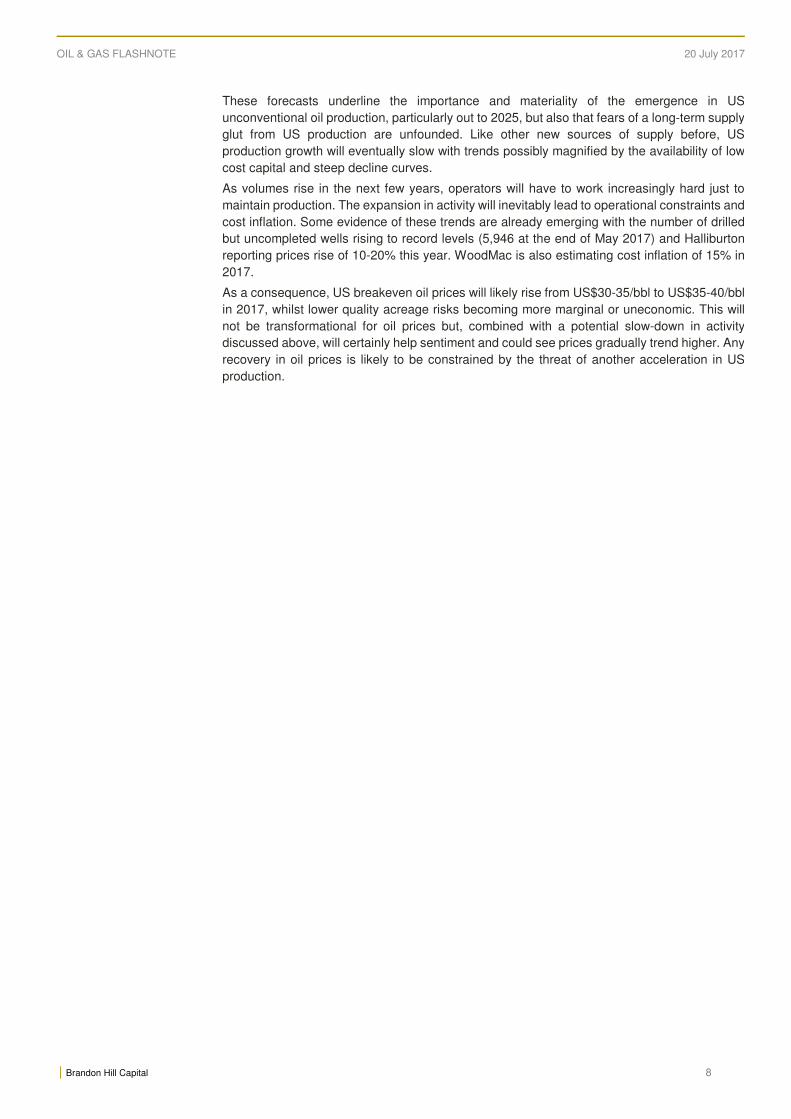
The significance of these statistics is that due to the time lag between discovery, project
sanction and new developments coming onstream, a supply shortfall could occur in the medium
term. In our view, this scenario is possible in the next five or so years and it is clear to us that
US unconventional production alone cannot bridge the supply gap. Over time this could lead
to the erosion of OPEC spare capacity and potentially higher and more volatile oil prices.
Exhibit 8: Long term oil supply and demand
Source: BP Energy Outlook 2017
In the longer term, the market will have more time to adapt and as oil demand growth slows
post 2025, the risks of supply shortfalls should ease. According to BP, almost the entire long
term oil supply growth will come from either the US (4mmbopd) or OPEC members (9mmbopd),
with smaller contributions from Brazil and Russia merely offsetting non-OPEC declines.
Exhibit 9: Long term oil supply trends
Source: BP Energy Outlook 2017
OIL & GAS FLASHNOTE 20 July 2017
| Brandon Hill Capital 8
These forecasts underline the importance and materiality of the emergence in US
unconventional oil production, particularly out to 2025, but also that fears of a long-term supply
glut from US production are unfounded. Like other new sources of supply before, US
production growth will eventually slow with trends possibly magnified by the availability of low
cost capital and steep decline curves.
As volumes rise in the next few years, operators will have to work increasingly hard just to
maintain production. The expansion in activity will inevitably lead to operational constraints and
cost inflation. Some evidence of these trends are already emerging with the number of drilled
but uncompleted wells rising to record levels (5,946 at the end of May 2017) and Halliburton
reporting prices rise of 10-20% this year. WoodMac is also estimating cost inflation of 15% in
2017.
As a consequence, US breakeven oil prices will likely rise from US$30-35/bbl to US$35-40/bbl
in 2017, whilst lower quality acreage risks becoming more marginal or uneconomic. This will
not be transformational for oil prices but, combined with a potential slow-down in activity
discussed above, will certainly help sentiment and could see prices gradually trend higher. Any
recovery in oil prices is likely to be constrained by the threat of another acceleration in US
production.

OIL & GAS FLASHNOTE 20 July 2017
| Brandon Hill Capital 9
Research Disclosures
William ArnsteinWilliam ArnsteinWilliam ArnsteinWilliam Arnstein
Will is a CFA charterholder and has more than 10 years experience as a sell-side equity research analyst having
previously worked at Dresdner Kleinwort, Jefferies International and finnCap. In his last role, he co-founded the Oil & Gas
franchise at finnCap and later became Head of Oil & Gas, where he also coordinated corporate finance and corporate
broking in addition to his responsibilities as a Research Director. During his career, Will has worked closely with many
international E&P companies, both listed and private, evaluating assets across the globe and has developed particular
expertise in petroleum economics and asset valuation. In 2010, Will was awarded No.1 stock picker for the European
energy sector in the FT/Starmine Awards.
Tel: +44 (0)20 3463 5020
Investment Analyst Certification All research is issued under the regulatory oversight of Brandon Hill Capital Limited. Each Investment Analyst of Brandon
Hill Capital Limited whose name appears as the Author of this Investment Research hereby certifies that the
recommendations and opinions expressed in the Investment Research accurately reflect the Investment Analyst’s
personal, independent and objective views about any and all of the Designated Investments or Relevant Issuers
discussed herein that are within such Investment Analyst’s coverage universe.
Brandon Hill Capital Limited provides professional independent research services and all Analysts are free to determine
which assignments they accept, and they are free to decline to publish any research notes if their views change.
Research Recommendations
Brandon Hill CapitalBrandon Hill CapitalBrandon Hill CapitalBrandon Hill Capital uses a fiveuses a fiveuses a fiveuses a five----tier recommendation system for stocks under coveragetier recommendation system for stocks under coveragetier recommendation system for stocks under coveragetier recommendation system for stocks under coverage::::
Buy Recommendation implies that expected total return of at least 15% is expected over 12 months
between current and analysts’ target price.
Trading Buy Recommendation implies that the analysts’ expected total return over the short term compared against
the target price is positive.
Hold Recommendation implies that expected total return of between 15% and zero is expected over 12
months between current and analysts’ target price.
Trading Sell
Recommendation implies that the analysts’ expected total return over the short term compared against
the target price is negative.
Sell Recommendation implies that expected total return expected over 12 months between current and
analysts’ target price is negative.

OIL & GAS FLASHNOTE 20 July 2017
| Brandon Hill Capital 10
Research Disclaimers
Research disclosure as of 20 July 2017
Company Name Disclosure
NA
Investment Research Disclosure Legend:
1. In the past 12 months, Brandon Hill Capital Limited or its affiliates have had corporate finance mandates or
managed or co-managed a public offering of the Relevant Issuer’s securities or received compensation for
Corporate Finance services from the Relevant Issuer.
2. Brandon Hill Capital Limited expects to receive or intends to seek compensation for Corporate Finance services
from this company in the next six months.
3. The Investment Analyst or a member of the Investment Analyst’s household has a long position in the shares or
derivatives of the Relevant Issuer.
4. The Investment Analyst or a member of the Investment Analyst’s household has a short position in the shares or
derivatives of the Relevant Issuer.
5. As of the month end immediately preceding the date of publication of this report, or the prior month end if
publication is within 10 days following a month end, Brandon Hill Capital Limited and / or its affiliates beneficially
owned 1% or more of any class of common equity securities of the Relevant Issuer.
6. A senior executive or director of Brandon Hill Capital Limited or a member of his or her household is an officer,
director or advisor, board member of the Relevant Issuer and / or one of his subsidiaries.
7. Brandon Hill Capital Limited acts as corporate broker for the Relevant Issuer.
8. The Investment Analyst who is responsible for the preparation of this Investment Research is employed by
Brandon Hill Capital Limited, a securities broker-dealer.
9. The Investment Analyst who is responsible for the preparation of this Investment Research has received (or will
receive) compensation linked to the general profits of Brandon Hill Capital Limited.

OIL & GAS FLASHNOTE 20 July 2017
| Brandon Hill Capital 11
Disclaimer: Important Information This document is not independent and should not be relied on as an impartial or objective assessment of its subject matter. Given the
foregoing, this document is deemed to be a marketing communication and as such has not been prepared in accordance with legal
requirements designed to promote the independence of investment research and Brandon Hill Capital Limited is not subject to any prohibition
on dealing ahead of dissemination of this document as it would be if it were independent investment research.
This document has been issued by Brandon Hill Capital Limited for information purposes only and should not be construed in any
circumstances as an offer to sell or solicitation of any offer to buy any security or other financial instrument, nor shall it, or the fact of its
distribution, form the basis of, or be relied upon in connection with, any contract relating to such action. This document has no regard for the
specific investment objectives, financial situation or needs of any specific entity. Brandon Hill Capital Limited and/or connected persons may,
from time to time, have positions in, make a market in and/or effect transactions in any investment or related investment mentioned herein and
may provide financial services to the issuers of such investments. The information contained herein is based on materials and sources that we
believe to be reliable, however, Brandon Hill Capital Limited makes no representation or warranty, either express or implied, in relation to the
accuracy, completeness or reliability of the information contained herein. Opinions expressed are our current opinions as of the date appearing
on this material only. Any opinions expressed are subject to change without notice and Brandon Hill Capital Limited is under no obligation to
update the information contained herein. None of Brandon Hill Capital Limited, its affiliates or employees shall have any liability whatsoever for
any indirect or consequential loss or damage arising from any use of this document.
This report has been approved in the UK by Brandon Hill Capital Limited solely for the purposes of section 21 of the Financial Services and
Markets Act 2000. In the UK, this report is directed at and is for distribution only to persons who (i) fall within Article 19(1) (persons who have
professional experience in matters relating to investments) or Article 49(2) (a) to (d) (high net worth companies, unincorporated associations,
etc.) of the Financial Services and Markets Act 2000 (Financial Promotions) Order 2005 (as amended) or (ii) are professional clients or eligible
counterparties of Brandon Hill Capital Limited (all such persons together being referred to as “relevant persons”). This report must not be acted
on or relied up on by persons in the UK who are not relevant persons.
Neither this report nor any copy of part thereof may be distributed in any other jurisdictions where its distribution may be restricted by law and
persons into whose possession this report comes should inform themselves about, and observe any such restrictions. Distribution of this report
in any such other jurisdictions may constitute a violation of UK or US securities law, or the law of any such other jurisdictions.
Investments in general involve some degree of risk, including the risk of capital loss. The services, securities and investments discussed in this
document may not be available to nor suitable for all investors. Investors should make their own investment decisions based upon their own
financial objectives and financial resources and, if in any doubt, should seek advice from an investment advisor. Past performance is not
necessarily a guide to future performance and an investor may not get back the amount originally invested. Where investment is made in
currencies other than the investor’s base currency, movements in exchange rates will have an effect on the value, either favourable or
unfavourable. Levels and bases for taxation may change. When we comment on AIM or ISDX shares you should be aware that because the
rules for those markets are less demanding than the Official List of London Stock Exchange plc, the risks are higher. Furthermore, the
marketability of these shares is often restricted.
Brandon Hill Capital Limited and/or its associated companies may from time-to-time provide investment advice or other services to, or solicit
such business from, any of the companies referred to in this document. Accordingly, information may be available to Brandon Hill Capital
Limited that is not reflected in this material and Brandon Hill Capital Limited may have acted upon or used the information prior to or immediately
following its publication. In addition, Brandon Hill Capital Limited, the directors and employees thereof and/or any connected persons may have
an interest in the securities, warrants, futures, options, derivatives or other financial instrument of any of the companies referred to in this
document and may from time-to-time add or dispose of such interests. Neither the whole nor any part of this material may be duplicated in any
form or by any means. Neither should any of this material be redistributed or disclosed to anyone without the prior consent of Brandon Hill
Capital Limited. Brandon Hill Capital Limited is authorised and regulated by the Financial Conduct Authority and is a member of the London
Stock Exchange.
Brandon Hill Capital Limited may distribute research in reliance on rule 15a-6(a)(2) of the Securities and Exchange Act 1934 to persons that are
major US Institutional investors, however, transactions in any securities must be effected through a US registered broker-dealer. Any failure to
comply with this restriction may constitute a violation of the relevant country’s laws for which Brandon Hill Capital Limited does not accept any
responsibility. By accepting this document you agree that you have read the above disclaimer and to be bound by the foregoing
limitations/restrictions. Please note that unless otherwise stated, the share price used in this publication is taken at the close of business for the
previous day.
OIL & GAS FLASHNOTE 20 July 2017
| Brandon Hill Capital
Brandon Hill Contact List
International Sales
Oliver StansfieldOliver StansfieldOliver StansfieldOliver Stansfield
Tel: +44 20 3463 5061
Email: [email protected]
Alex WalkerAlex WalkerAlex WalkerAlex Walker
Tel: +44 20 3463 5018
Email: [email protected]
Corporate Finance & Broking
Jonathan Evans Jonathan Evans Jonathan Evans Jonathan Evans
Tel: +44 20 3463 5016
Email: [email protected]
Wei JiaoWei JiaoWei JiaoWei Jiao
Tel: +44 20 3463 5019
Email: [email protected]
Robert BeenstockRobert BeenstockRobert BeenstockRobert Beenstock
Tel: +44 20 3463 5023
Email: [email protected]
Research
William ArnsteinWilliam ArnsteinWilliam ArnsteinWilliam Arnstein
Tel: +44 20 3463 5020
Email: [email protected]
Peter RosePeter RosePeter RosePeter Rose
Tel: +44 20 3463 5034
Email: [email protected]