Oil Patch Bankruptcy Monitor
13
Oil Patch Bankruptcy Monitor June 30, 2021
Transcript of Oil Patch Bankruptcy Monitor
Oil Patch Bankruptcy Monitor
June 30, 2021

Haynes and Boone, LLP has monitored North American oil and gas producer Chapter 11 bankruptcies since 2015.This latest report features new cases filed from January 1, 2021 through June 30, 2021. Over the past six years,there have been 266 oil and gas producer bankruptcies. In the same period, 306 oilfield services and midstreamcompanies have filed for bankruptcy, bringing the combined North American industry total to 572. The report thatfollows includes data points for aggregate debt and several summary data slides.
KEY TAKEAWAYS FOR Q1‐Q2 2021:
• Twelve producers filed in Q1‐Q2 2021, which is the lowest Q1‐Q2 total since 2015 when 13 producers filed.• The aggregate debt for producers that filed in Q1‐Q2 2021 is just over $1.8 billion, which is the lowest Q1‐Q2total, after $3.6 billion in Q1‐Q2 2015.
• There were no producers with billion‐dollar bankruptcies in Q2 2021, which has not happened since Q3 2018.• Texas accounted for 58 percent of the total producer filings in Q1‐Q2 2021, with seven in total.
Our lawyers have played a key role assisting clients in high‐profile E&P, midstream and oilfield services matters,including asset sales, refinancings, debt restructurings and Chapter 11 cases, representing debtors, creditors,energy lenders and private equity investors. Haynes Boone publishes companion reports that can be found on ourEnergy Roundup web page, which include these:
• Borrowing Base Redeterminations Survey• Energy Bank Price Deck Survey• Midstream Report• Oil and Gas ESG Tracker• Oilfield Services Bankruptcy Tracker
OIL PATCH BANKRUPTCY MONITOR
2

2015‐2021 CUMULATIVE NORTH AMERICAN E&P BANKRUPTCY FILINGS
Cumulative bankruptciesNew bankruptcies since the previous quarter
717
1417
3410
9 7 7 2 8 612 4 6 5
1315 9
518
17 68 4
0
50
100
150
200
250
300
2015Q1
2015Q2
2015Q3
2015Q4
2016Q1
2016Q2
2016Q3
2016Q4
2017Q1
2017Q2
2017Q3
2017Q4
2018Q1
2018Q2
2018Q3
2018Q4
2019Q1
2019Q2
2019Q3
2019Q4
2020Q1
2020Q2
2020Q3
2020Q4
2021Q1
2021Q2
NU
MB
ER O
F FI
LIN
GS
HAYNES BOONE OIL PATCH BANKRUPTCY MONITOR©
(As of June 30, 2021)
3
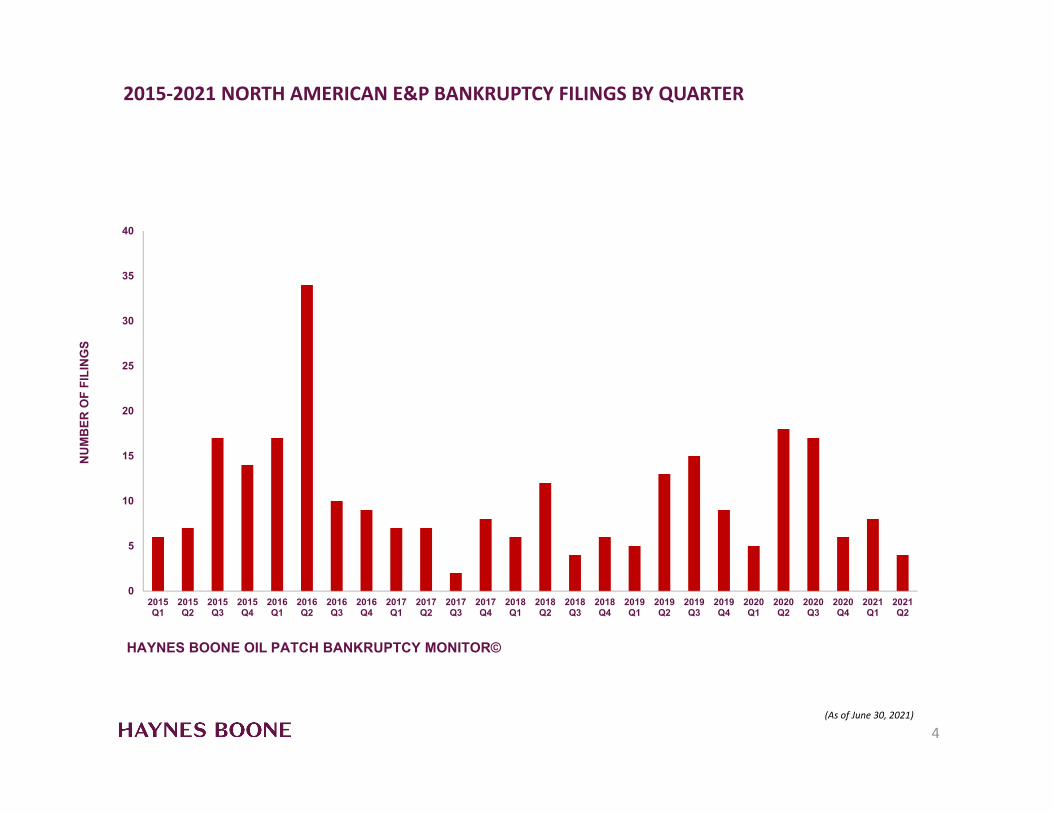
2015‐2021 NORTH AMERICAN E&P BANKRUPTCY FILINGS BY QUARTER
0
5
10
15
20
25
30
35
40
2015Q1
2015Q2
2015Q3
2015Q4
2016Q1
2016Q2
2016Q3
2016Q4
2017Q1
2017Q2
2017Q3
2017Q4
2018Q1
2018Q2
2018Q3
2018Q4
2019Q1
2019Q2
2019Q3
2019Q4
2020Q1
2020Q2
2020Q3
2020Q4
2021Q1
2021Q2
NU
MB
ER O
F FI
LIN
GS
HAYNES BOONE OIL PATCH BANKRUPTCY MONITOR©
(As of June 30, 2021)
4

2015‐2021 CUMULATIVE E&P UNSECURED DEBT, SECURED DEBT AND AGGREGATE DEBT
$0
$20
$40
$60
$80
$100
$120
$140
$160
$180
$200
2015Q1
2015Q2
2015Q3
2015Q4
2016Q1
2016Q2
2016Q3
2016Q4
2017Q1
2017Q2
2017Q3
2017Q4
2018Q1
2018Q2
2018Q3
2018Q4
2019Q1
2019Q2
2019Q3
2019Q4
2020Q1
2020Q2
2020Q3
2020Q4
2021Q1
2021Q2
BIL
LIO
NS
HAYNES BOONE OIL PATCH BANKRUPTCY MONITOR©
(As of June 30, 2021)
5

2015‐2021 E&P UNSECURED DEBT, SECURED DEBT AND AGGREGATE DEBT BY QUARTER
$0
$5
$10
$15
$20
$25
$30
$35
$40
$45
2015Q1
2015Q2
2015Q3
2015Q4
2016Q1
2016Q2
2016Q3
2016Q4
2017Q1
2017Q2
2017Q3
2017Q4
2018Q1
2018Q2
2018Q3
2018Q4
2019Q1
2019Q2
2019Q3
2019Q4
2020Q1
2020Q2
2020Q3
2020Q4
2021Q1
2021Q2
Bill
ions
HAYNES BOONE OIL PATCH BANKRUPTCY MONITOR©
(As of June 30, 2021)
6

2015‐2021 E&P BANKRUPTCY FILINGS BY LOCATION
TEXAS
132
DELAWARE40
COLORADO
12
LOUISIANA
MASSACHUSETTS
1
OKLAHOMA
10
ALABAMA
VIRGINIA
NEW YORK
ARIZONA
1
UTAH2
MINNESOTA
MONTANA1
KENTUCKYCALIFORNIA 7
CANADA*
18
WEST VIRGINIA
NEW MEXICO
1
311
10
1
111
PENNSYLVANIA
2NEVADA
1
MICHIGAN
2
NEW JERSEY1
WYOMING
4
MISSISSIPPI
1
HAYNES BOONE OIL PATCH BANKRUPTCY MONITOR©
*Canada is not tracked post‐2016.((As of June 30, 2021) 7
1
ALASKA

2015‐2021 E&P SECURED AND UNSECURED DEBT BY FILING LOCATION
(As of June 30, 2021)
ALABAMA$212,726
ALASKA$217,158,133
ARIZONA$3,699,213
CALIFORNIA$137,635,084
CANADA*$1,710,380,228
COLORADO$513,110,275
KENTUCKY$15,381,247
LOUISIANA$628,628,399
MASSACHUSETTS$3,578,276
MICHIGAN$51,129,723
MINNESOTA$1,233,733
NEW YORK$20,308,779,582
DELAWARE$31,299,125,481
TEXAS$117,327,007,820
MISSISSIPPI$13,489,109
MONTANA$83,726,167
NEVADA$1,042,675
NEW JERSEY$1,024,566
NEW MEXICO$1,286,649
OKLAHOMA$608,908,858
PENNSYLVANIA$2,009,791,901
UTAH$274,640,449
VIRGINIA$1,250,928,395
WEST VIRGINIA$40,865,611
WYOMING$123,542,133
HAYNES BOONE OIL PATCH BANKRUPTCY MONITOR©
8
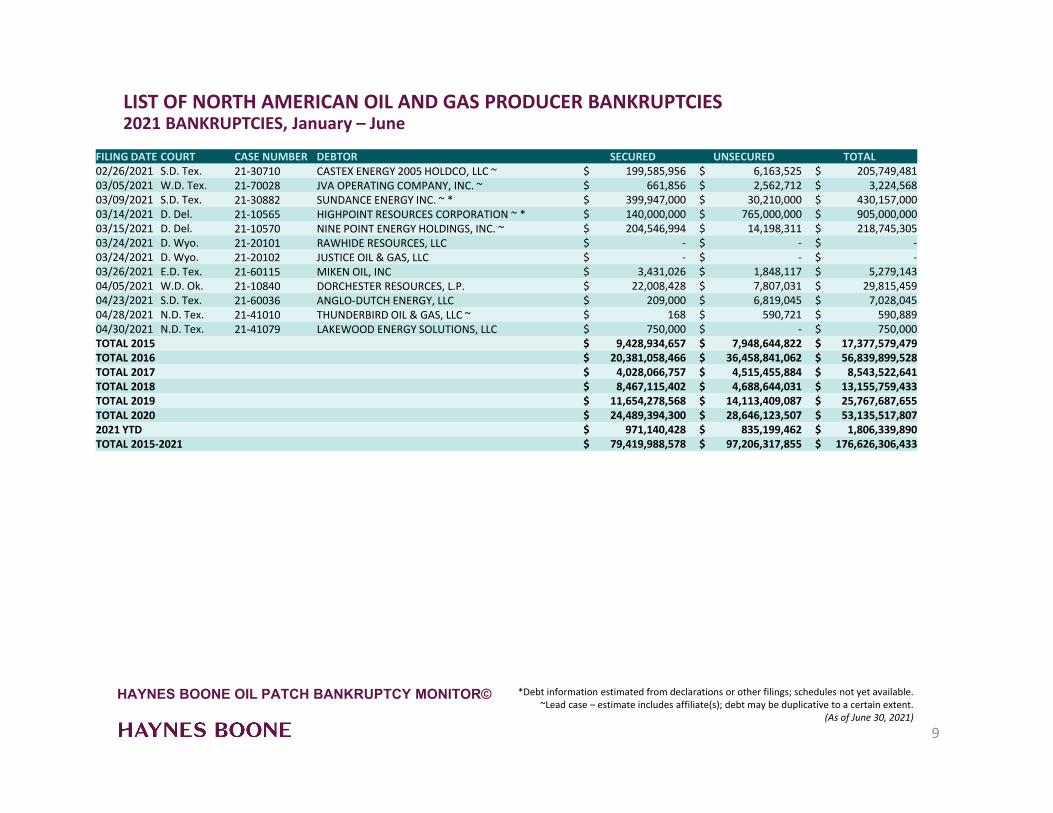
LIST OF NORTH AMERICAN OIL AND GAS PRODUCER BANKRUPTCIES 2021 BANKRUPTCIES, January – June
*Debt information estimated from declarations or other filings; schedules not yet available.~Lead case – estimate includes affiliate(s); debt may be duplicative to a certain extent.
(As of June 30, 2021)
FILING DATE COURT CASE NUMBER DEBTOR SECURED UNSECURED TOTAL02/26/2021 S.D. Tex. 21‐30710 CASTEX ENERGY 2005 HOLDCO, LLC ~ $ 199,585,956 $ 6,163,525 $ 205,749,481 03/05/2021 W.D. Tex. 21‐70028 JVA OPERATING COMPANY, INC. ~ $ 661,856 $ 2,562,712 $ 3,224,568 03/09/2021 S.D. Tex. 21‐30882 SUNDANCE ENERGY INC. ~ * $ 399,947,000 $ 30,210,000 $ 430,157,000 03/14/2021 D. Del. 21‐10565 HIGHPOINT RESOURCES CORPORATION ~ * $ 140,000,000 $ 765,000,000 $ 905,000,000 03/15/2021 D. Del. 21‐10570 NINE POINT ENERGY HOLDINGS, INC. ~ $ 204,546,994 $ 14,198,311 $ 218,745,30503/24/2021 D. Wyo. 21‐20101 RAWHIDE RESOURCES, LLC $ ‐ $ ‐ $ ‐03/24/2021 D. Wyo. 21‐20102 JUSTICE OIL & GAS, LLC $ ‐ $ ‐ $ ‐03/26/2021 E.D. Tex. 21‐60115 MIKEN OIL, INC $ 3,431,026 $ 1,848,117 $ 5,279,143 04/05/2021 W.D. Ok. 21‐10840 DORCHESTER RESOURCES, L.P. $ 22,008,428 $ 7,807,031 $ 29,815,459 04/23/2021 S.D. Tex. 21‐60036 ANGLO‐DUTCH ENERGY, LLC $ 209,000 $ 6,819,045 $ 7,028,045 04/28/2021 N.D. Tex. 21‐41010 THUNDERBIRD OIL & GAS, LLC ~ $ 168 $ 590,721 $ 590,889 04/30/2021 N.D. Tex. 21‐41079 LAKEWOOD ENERGY SOLUTIONS, LLC $ 750,000 $ ‐ $ 750,000 TOTAL 2015 $ 9,428,934,657 $ 7,948,644,822 $ 17,377,579,479 TOTAL 2016 $ 20,381,058,466 $ 36,458,841,062 $ 56,839,899,528 TOTAL 2017 $ 4,028,066,757 $ 4,515,455,884 $ 8,543,522,641 TOTAL 2018 $ 8,467,115,402 $ 4,688,644,031 $ 13,155,759,433 TOTAL 2019 $ 11,654,278,568 $ 14,113,409,087 $ 25,767,687,655 TOTAL 2020 $ 24,489,394,300 $ 28,646,123,507 $ 53,135,517,8072021 YTD $ 971,140,428 $ 835,199,462 $ 1,806,339,890TOTAL 2015‐2021 $ 79,419,988,578 $ 97,206,317,855 $ 176,626,306,433
HAYNES BOONE OIL PATCH BANKRUPTCY MONITOR©
9

PRIMARY CONTACTSRESTRUCTURING
CHARLES BECKHAM, JR.Partner, [email protected]
IAN PECKPartner, [email protected]
ELI COLUMBUS Partner, [email protected]
MATT FERRIS Partner, [email protected]
PATRICK HUGHESPartner, Denver / [email protected]
KENRIC KATTNERPartner, [email protected]
FRASHER MURPHYPartner, [email protected]
STEPHEN PEZANOSKYPartner, Fort [email protected]
KELLI NORFLEETPartner, [email protected]
DAVID STAABAssociate, Fort [email protected]
JAROM YATESAssociate, [email protected]
MARTHA WYRICKAssociate, [email protected]
ARSALAN MUHAMMADCounsel, [email protected]
KOURTNEY LYDACounsel, [email protected]
DAVID TRAUSCHAssociate, [email protected]
Haynes Boone has more than 600 lawyers, including nearly 20 restructuring practitioners and 100 energy lawyers and landmen serving clients across the globe.
10

PRIMARY CONTACTSENERGY TRANSACTIONS
Haynes Boone has more than 600 lawyers, including nearly 20 restructuring practitioners and 100 energy lawyers and landmen serving clients across the globe.
MICHAEL FREEMANPartner, [email protected]
JAMES MARKUSPartner, [email protected]
TIM JOHNSTONPartner, [email protected]
ELLEN CONLEYAssociate, [email protected]
BUDDY CLARKPartner, [email protected]
JEFF NICHOLSPartner, [email protected]
KRAIG GRAHMANNPartner, [email protected]
M. SCOTT HELBINGPartner, [email protected]
GIL PORTERPartner, New [email protected]
JOHN FOGNANIPartner, [email protected]
MICHAEL COOPERCounsel, [email protected]
AUSTIN ELAMPartner, [email protected]
BRAD RICHARDSPartner, [email protected]
VIKKI MARSHAssociate, [email protected]
KIM MAIAssociate, [email protected]
ALEXANDER WILLIAMSAssociate, [email protected]
CHRIS REAGENAssociate, [email protected]
REEM ABDELRAZIKAssociate, [email protected]
11

AUSTIN600 Congress AvenueSuite 1300Austin, TX 78701United States of AmericaT +1 512.867.8400F +1 512.867.8470
CHARLOTTE620 S. Tryon StreetSuite 375Charlotte, NC 28202 United States of AmericaT +1 980.771.8200F +1 980.771.8201
CHICAGO180 N. LaSalle StreetSuite 2215Chicago, IL 60601United States of AmericaT +1 312.216.1620F +1 312.216.1621
DALLAS2323 Victory AvenueSuite 700Dallas, TX 75219United States of AmericaT +1 214.651.5000F +1 214.651.5940
DALLAS ‐ NORTH6000 Headquarters Dr.Suite 200Plano, TX 75024United States of AmericaT +1 972.739.6900F +1 972.680.7551
DENVER1050 17th StreetSuite 1800 Denver, CO 80265United States of AmericaT +1 303.382.6200F +1 303.382.6210
FORT WORTH301 Commerce StreetSuite 2600 Fort Worth, TX 76102 United States of AmericaT +1 817.347.6600F +1 817.347.6650
HOUSTON1221 McKinney StreetSuite 4000Houston, TX 77010United States of AmericaT +1 713.547.2000F +1 713.547.2600
LONDON1 New Fetter Lane London, EC4A 1AN United KingdomT +44 (020) 8734 2800F +44 (020) 8734 2820
MEXICO CITYTorre Esmeralda I, Blvd.Manuel Ávila Camacho #40Despacho 1601Col. Lomas de Chapultepec, DF 11000 Mexico City, MexicoT +52.55.5249.1800F +52.55.5249.1801
NEW YORK30 Rockefeller Plaza26th FloorNew York, NY 10112United States of AmericaT +1 212.659.7300F +1 212.918.8989
ORANGE COUNTY600 Anton BoulevardSuite 700Costa Mesa, CA 92626United States of AmericaT +1 949.202.3000F +1 949.202.3001
PALO ALTO525 University AvenueSuite 400Palo Alto, CA 94301United States of AmericaT +1 650.687.8800F +1 650.687.8801
SAN ANTONIO112 East Pecan StreetSuite 1200San Antonio, TX 78205United States of AmericaT +1 210.978.7000F +1 210.978.7450
SAN FRANCISCO201 Spear StreetSuite 1750San Francisco, CA 94105United States of AmericaT +1 415.293.8900 F
+1 415.293.8901
SHANGHAIShanghai International Finance Center, Tower 2 Unit 3620, Level 368 Century Avenue, Pudong Shanghai 200120, P.R. ChinaT +86.21.6062.6179F +86.21.6062.6347
THE WOODLANDS10001 Woodloch Forest Dr.Suite 200The Woodlands, TX 77380United States of AmericaT +1 713.547.2100F +1 713.547.2101
WASHINGTON, D.C.800 17th Street NWSuite 500Washington, D.C. 20006United States of AmericaT +1 202.654.4500F +1 202.654.4501
OFFICE LOCATIONS