Master Bond-EP21TDC-2LO-Adhesive Optical Components Laser ...
Oil & Gas Sector Primer 2016

Oil & Gas Field Service Industry Primer
1 Sector Overview
The oil and gas field services industry plays a significant role in the production of oil and gas by providing valuable services to upstream oil and gas companies, and the largest companies in this sector typically sell products that oil and gas field operators use to explore for and develop oil and gas reserves. Industry demand is highly volatile and largely dependent on oil and gas prices. Operators in this sector have experienced volatile market conditions over the past five years due to the downturn in commodity prices during the economic recession.
2 Valuation
The Index chosen to value the oil and gas field service sector is the PHLX Oil Service Sector Index (OSX). OSX is a price weighted index composed of 15 companies involved in the oil services sector. The OSX was set to an initial value of 75 on December 31, 19961.
Figure 1 OSX vs. S&P - P/E
Figure 2 OSX vs. S&P - P/B

Figure 3 OSX vs. S&P - EV/EBITDA
Figure 4 OSX vs. S&P - EV/Sales
Figure 5 OSX vs. S&P - P/Cash Flow

Through comparison of S&P 500 in Figure 1-4, the ratios for OSX are below that of S&P’s at least since September of last year—this means the oil and gas field sector is currently undervalued.
3 Industry Key Defining Characteristics
3.1 Technology and Scale Effect are key
The four biggest companies in this sector are Schlumberger Ltd. (11.6%), Halliburton Company (9.9%), and Baker Hughes, Inc. (8.3%). The concentration level in this sector is low—the three biggest companies count less than 30% in the market and therefore the competition level is high. The profitability of individual companies depends on technical expertise and efficiency of operations. Large companies can offer a broad range of services. Small firms can compete effectively by specializing in a particular type of service or geographic area5.
Hydraulic fracturing and horizontal drilling have been the key technologies in the oil and gas field service sector and have spurred high levels of production and investment in this sector, and these technologies will continue to bolster demand for the industry’s services. Companies with exposure to these technologies are expected to perform well in this sector.
3.2 High Revenue Volatility
The key customer of the oil and gas field service sector is the oil drilling and gas extraction industry. The oil and gas field service sector is $100.2 billion in total in the U.S. as of September, 2015. As for major market segmentation, oil and gas extractors account for 94% of the industry revenue (69% of the sector is oil extractors and 25% is gas extractors. The other segments are: coal mining industry—3%, metallic ore mining industry—2% and nonmetallic ore mining industry—1%), compared with an estimated 86% five years ago2.
Many oil field services are provided on a contract basis, often with fixed-price contracts. Demand for oil and gas field support services depends on spending by oil and gas producers. Due to the large exposure to the oil drilling and gas extraction, the sector’s demand is highly dependent on oil and natural gas prices, therefore the revenue volatility of this sector is high. Severe weather during certain times of the year can also limit contract opportunities and cause uneven cash flow for support service providers.
3.3 OFS Companies Early Cycle Exposure
During periods of low oil and gas prices, upstream oil and gas companies typically curtail production on their highest cost extraction sites—this reduces demand for oil and gas field services. However, since outsourcing support services is typically more affordable for downstream companies than maintaining in-house drilling and support operations, operators are actually able to sustain demand for field services even when downstream companies experience stagnant performance.
During periods of price recovery, a higher oil price can materialize into new investments, which will benefit the oil and gas field service sector. Land-drillers, companies with pressure pumping technology, will have more early-cycle exposure3. Seismic, Well Services and Commodities may experience the first positive growth already in 2016 according to Rystad Energy4.
3.4 OSX moves with Oil/Gas Price and the Change in Rig Counts
As shown in Figure 6, OSX has strong correlation with Oil/Gas Prices as discussed above, but very little correlation with rig counts, with is a fundamental indicator of the oil and gas extracting activities. OSX does relate to the changes in the rig counts, as shown in Figure 7.

Source: BMO Capital Markets
Figure 6: OSX, WTI, and U.S. Land Rig Count
Source: BMO Capital Markets
Figure 7: 8-Week Moving Avg. Weekly Change in U.S. Land Rig Count, PTEN/OSX Relative Performance
4 Key Points in this Cycle
4.1 Oil Price is Unsustainably Low at This Point
Assuming no voluntary supply cuts, Rystad Energy estimates that an oil price of 60 USD/bbl for 2015 will take down the supply growth in the second half of 2015 which in turn would lead the market to balance in 2016. Based on this, Rystad Energy expects the oil price to climb towards 70 real USD/bbl in 2016 and 80 real USD/bbl in 2017, which would ignite new investments. According to Rystad Energy, onshore could increase somewhat into 2016 as any signs of a higher oil price can materialize into new investments the same year. Offshore will have a comeback in 2017, when it is expected that new offshore resources are vital to meet the demand for liquids. Offshore oil drilling will likely experience weak growth over the next few years due to stringent permitting for new drilling rigs.
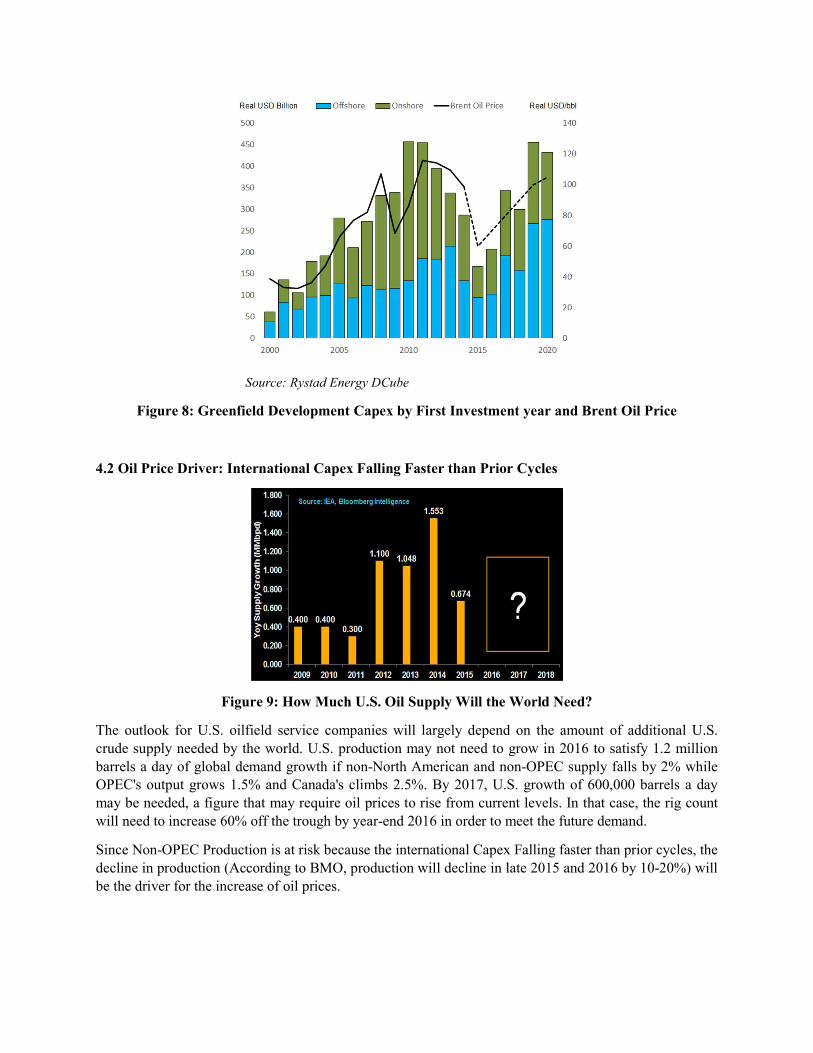
Source: Rystad Energy DCube
Figure 8: Greenfield Development Capex by First Investment year and Brent Oil Price
4.2 Oil Price Driver: International Capex Falling Faster than Prior Cycles
Figure 9: How Much U.S. Oil Supply Will the World Need?
The outlook for U.S. oilfield service companies will largely depend on the amount of additional U.S. crude supply needed by the world. U.S. production may not need to grow in 2016 to satisfy 1.2 million barrels a day of global demand growth if non-North American and non-OPEC supply falls by 2% while OPEC's output grows 1.5% and Canada's climbs 2.5%. By 2017, U.S. growth of 600,000 barrels a day may be needed, a figure that may require oil prices to rise from current levels. In that case, the rig count will need to increase 60% off the trough by year-end 2016 in order to meet the future demand.
Since Non-OPEC Production is at risk because the international Capex Falling faster than prior cycles, the decline in production (According to BMO, production will decline in late 2015 and 2016 by 10-20%) will be the driver for the increase of oil prices.

4.3 Early-Cycle Stocks are Key to Outperformance
As shown in Table 1, a large percentage of outperformance is typically generated during the first 90 days of a cycle. Since the U.S. has become the effective “swing” producer to balance the global oil market, shorter cycle times to U.S. production of 9-12 months should therefore likely dictate the duration of the OFS cycle.
Table 1: Subsector Performance Following the Bottom in OSX
Source: BMO Capital Markets
5 Sector Outlook
Demand for oil and gas field services is projected to rise over the next five years as the global economy recovers. However, low oil prices will likely continue to constrain growth in this sector. Stringent regulations in offshore drilling in the Gulf Coast will also offset some revenue gains derived from the recovery of oil prices.
The oilfields services have been hit significantly as oil prices crashed by 45 per cent last year. Nevertheless, the prices of crude oil and natural gas are anticipated to recover over the next five years. In the five years to 2020, industry revenue is forecast to increase at an average annual rate of 4.3% in the U.S5.

References
1 https://indexes.nasdaqomx.com/Index/Overview/OSX Nasdaq Global Indexes. 2Oil and Gas Field Service in the US Industry Report, IBIS World, September 2015. 3 Daniel Boyd. From Bust to Boom and Back Again[R]. BMO Capital Markets, February 2015. 4 Oil Field Service Newsletter[R], Rystad Energy, January 2015: http://www.rystadenergy.com/AboutUs/NewsCenter/Newsletters/OfsArchive/ofs-january-2015 5 Industry Profile- Oil & Gas Field Services, First Research, September 2015.


![VebraAlto.com - Agency Cloud · 0dhv\ukdi &urvv+dqgv /odqhool 6$ /7 5hgxfhgwr %hgurrp6hpl'hwdfkhg+rxvh &rqyhqlhqwo\/rfdwhg 2lo&hqwudo+hdwlqj x39&'rxeoh*od]lqj](https://static.fdocuments.in/doc/165x107/5e6023d69e022f322203ddf2/-agency-cloud-0dhvukdi-urvvdqgv-odqhool-6-7-5hgxfhgwr-hgurrp6hplhwdfkhgrxvh.jpg)


![3 primaria 1INGLES · 2017-09-04 · ,qjopv 3ulpduld 5hsdvr 3ulphu 7ulphvwuh 'd\v ri wkh zhhn 5hdg dqg frpsohwh 1rpeuh bbbbbbbbbbbbbbbbbbbbbbbbbbbbbbbb &hold 5rgutjxh] 5xl] 7rgd\](https://static.fdocuments.in/doc/165x107/5b88b93c7f8b9a435b8e5c7f/3-primaria-1ingles-2017-09-04-qjopv-3ulpduld-5hsdvr-3ulphu-7ulphvwuh-dv.jpg)