OIL & GAS & P Is Management Compensation Rewarding the...
4
ONTARIO TEACHERS’ PENSION PLAN OIL & GAS E XPLORATION & P RODUCTION Is Management Compensation Rewarding the Right Behavior? MANAGING DISRUPTION AND THE TRANSITION TO A LOWER CARBON ECONOMY
Transcript of OIL & GAS & P Is Management Compensation Rewarding the...

O N T A R I O T E A C H E R S ’ P E N S I O N P L A N
O I L & G A S E X P L O R AT I O N & P R O D U C T I O N
Is Management Compensation Rewarding the Right Behavior?
MANAGING DISRUPTION AND THE TRANSITION TO A LOWER CARBON ECONOMY

Managing disruption and the transition to a lower carbon economy
Since 2012 E&Ps have underperformed the broader market by over 160%As of the beginning of 2012, this E&P universe returned a cumulative -21% to shareholders relative to returns of over 140% to the broader market.
In both high and low oil prices, E&Ps have earned below market returnsWhile it is easy to attribute the underperformance to low oil prices, E&Ps have been underperforming the market in
both high (2012-2014) and low (2015-2017) oil price environments.
Furthermore, during peak market conditions, the E&Ps reported returns on equity (ROE) between 4-11%, underperforming the S&P by over 500 basis points (bps). Once in the down-cycle the ROE gap widened to 4000 bps before recovering now to negative 1400 bps. For our latest data period in Q317, E&Ps on average were not generating a positive return.
E&Ps are trading at a growing discount to the broader marketThe underperformance is also visible in company valuations. On one-year forward consensus EV/EBITDA estimates, the 45 E&Ps trade at a six multiple point discount to the S&P 500, with considerable de-rating occurring in 2017.
The Exploration & Production (E&P) industry is facing disruption risks from a number of factors. First andforemost is the impact on future oil and gas demand from the ongoing transition to a lower carbon economy.
Investors have concerns regarding carbon taxation, market access, electric vehicle adoption and stranded asset possibilities to name a few. They are also becoming increasingly focused on the long-term effi cacy of the E&P business model and ensuring that all relevant stakeholders benefi t from the industry implementing best practices in sustainability.
With this in mind, we examined 45 large and mid-cap North American E&P companies with a total enterprise value of over $US 600 billion. We looked at their performance and incentive structures through the most recent energy business cycle (2012-2017) and came to some key conclusions.
The E&P business model is facing challenges
160% E&P Underperformance 2012-2017
300
250
200
150
100
50
2012 S&P 500 E&P Companies TSR Index
Bloomberg data
2013 2014 2015 2016 2017
E&P Multiples E&P Discount to S&P 500Bloomberg data
E&P EV/EBITDA Discount to the Market is Growing
10.0x8.0x6.0x4.0x2.0x0.0x
-2.0x-4.0x-6.0x-8.0x
2012 2013 2014 2015 2016 20172017
E&P Return on Equity and Discount to S&P 500
20%
10%
0%
-10%
-20%
-30%
-40%2012 2013 2014 2015 2016
E&P Returns E&P Underperformance to S&P 500Bloomberg data

Managing disruption and the transition to a lower carbon economy
In addition to economic returns, investors expect meaningful improvements in E&P operations over time. This is generally refl ected in changes to production and reserves. While E&Ps have continued to grow production, since 2012, shareholders are entitled to almost 10% less on a per share basis.
The same is true for proven reserves, which are down over 20% on a per share basis as new debt and equity invested in the downturn failed to earn an economic return on capital. As expected, debt adjusted, per share operating metrics, and total shareholder returns are correlated.
Why is this underperformance occurring? Our analysis suggests that management compensation is not rewarding the right behaviour, for three main reasons:
1. Management pay and company performance often divergeManagement compensation is not highly correlated with total shareholder return performance. Since 2012, management compensation for the 45 E&Ps fl uctuated between $0.8 and $1 billion annually, averaging $0.9 billion, with annual changes typically under 10%. Shareholder returns in comparison often fl uctuated by 20-50% or more in any year.
2. Management compensation is often tied to absolute growth targets in the short termOf the 45 E&Ps we examined, we found 31 had absolute production targets and 19 had absolute reserve targets. This creates a potential alignment issue with shareholders as management is incentivized to deploy incremental equity and debt capital, or engage in acquisitions
irrespective of economic cost. This may lead to sub optimal capital allocation, low economic returns, discounted valuations and negative total shareholder returns through the cycle.
3. Management long-term compensation is often tied to relative performance and not absolute returns Our fi nal observation is that 38 of the 45 E&Ps we studied had management
long term compensation tied to relative total share price returns. With this framework management is rewarded not for enriching shareholders, but for outperforming its peers, regardless of absolute share price performance. This incentive structure can lead to large management rewards even when shareholders don’t earn a positive return.
Is management compensation rewarding the right behaviour?
On a per share basis, production and reserves are declining
E&P Proved Reserves and Proved Reserves Per DAS (Index = 100)
2011 2012 2013 2014 2015 2016
Proved Reserves Per DAS 100.00 96.96 101.84 102.75 83.82 79.54
Proved Reserves 100.00 103.39 111.53 119.43 106.20 104.67
Total Shareholder Returns 100.00 91.61 128.37 103.16 71.44 95.24Bloomberg data
E&P Production and Production per Debt Adjusted Share (DAS)
130
120
110
100
90
80
702012
Production Production Per Debt Adjusted ShareBloomberg data
2013 2014 2015 2016 2017
E&P Companies TSR Index (LHS)
$ Compensation (Millions, RHS)
$ Average Compensation (Millions, RHS)
Bloomberg dataCompany Reports
Management compensation has been steady despite E&P underperformance
240
220
200
180
160
140
120
100
80
60
40
$1,000
$800
$600
$400
$200
$02012 20172013 2014 2015 2016
Published March 2018
For questions and comments on this report, please contact:Jim Sikora, [email protected], 416-730-5120 or Paul Schneider, [email protected], 416-730-5307
Download this report at www.otpp.com/corporategovernance
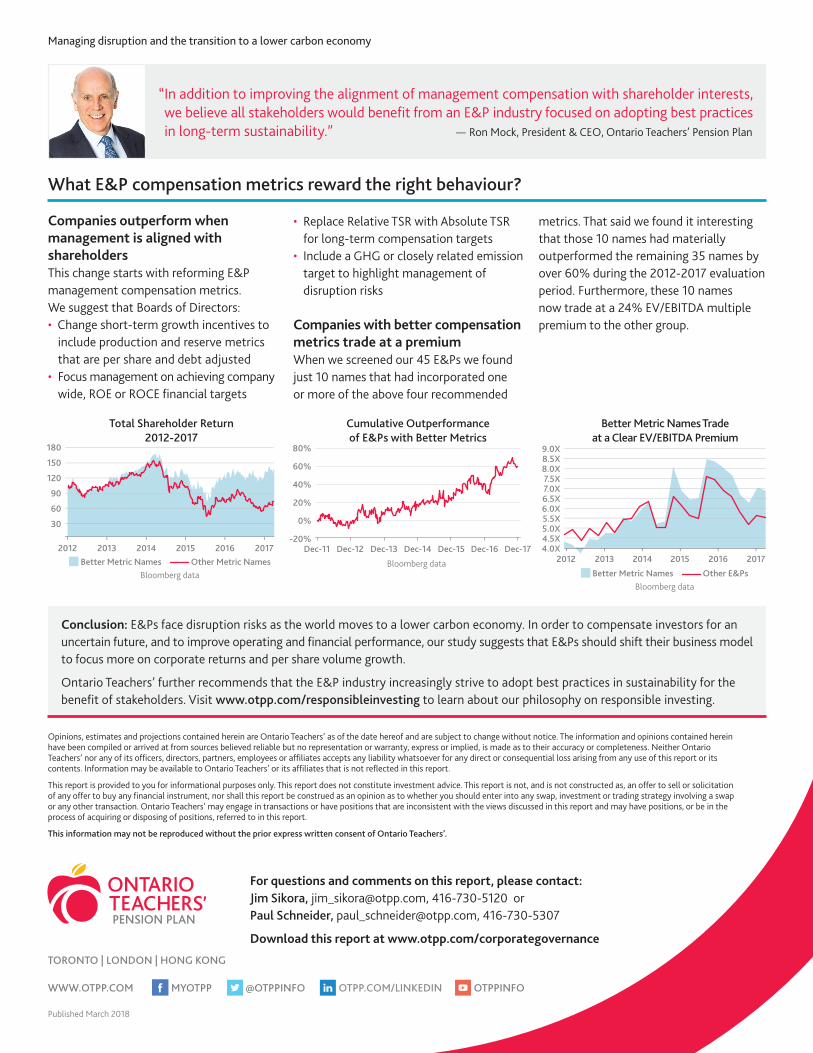
Companies outperform when management is aligned with shareholdersThis change starts with reforming E&P management compensation metrics. We suggest that Boards of Directors:• Change short-term growth incentives to
include production and reserve metrics that are per share and debt adjusted
• Focus management on achieving company wide, ROE or ROCE fi nancial targets
• Replace Relative TSR with Absolute TSR for long-term compensation targets
• Include a GHG or closely related emission target to highlight management of disruption risks
Companies with better compensation metrics trade at a premiumWhen we screened our 45 E&Ps we found just 10 names that had incorporated one or more of the above four recommended
metrics. That said we found it interesting that those 10 names had materially outperformed the remaining 35 names by over 60% during the 2012-2017 evaluation period. Furthermore, these 10 names now trade at a 24% EV/EBITDA multiple premium to the other group.
Managing disruption and the transition to a lower carbon economy
What E&P compensation metrics reward the right behaviour?
“ In addition to improving the alignment of management compensation with shareholder interests, we believe all stakeholders would benefi t from an E&P industry focused on adopting best practices in long-term sustainability.” — Ron Mock, President & CEO, Ontario Teachers’ Pension Plan
Conclusion: E&Ps face disruption risks as the world moves to a lower carbon economy. In order to compensate investors for an uncertain future, and to improve operating and fi nancial performance, our study suggests that E&Ps should shift their business model to focus more on corporate returns and per share volume growth.
Ontario Teachers’ further recommends that the E&P industry increasingly strive to adopt best practices in sustainability for the benefi t of stakeholders. Visit www.otpp.com/responsibleinvesting to learn about our philosophy on responsible investing.
Total Shareholder Return2012-2017
180
150
120
90
60
30
2012 Better Metric Names Other Metric Names
Bloomberg data
2013 2014 2015 2016 20172012 2013 2014 2015 2016 2017
Better Metric Names Other E&PsBloomberg data
Better Metric Names Tradeat a Clear EV/EBITDA Premium
9.0X8.5X8.0X7.5X7.0X6.5X6.0X5.5X5.0X4.5X4.0X
Cumulative Outperformance of E&Ps with Better Metrics
80%
60%
40%
20%
0%
-20%Dec-11 Dec-12 Dec-13 Dec-14 Dec-15 Dec-16 Dec-17
Bloomberg data
Opinions, estimates and projections contained herein are Ontario Teachers’ as of the date hereof and are subject to change without notice. The information and opinions contained herein have been compiled or arrived at from sources believed reliable but no representation or warranty, express or implied, is made as to their accuracy or completeness. Neither Ontario Teachers’ nor any of its offi cers, directors, partners, employees or affi liates accepts any liability whatsoever for any direct or consequential loss arising from any use of this report or its contents. Information may be available to Ontario Teachers’ or its affi liates that is not refl ected in this report.
This report is provided to you for informational purposes only. This report does not constitute investment advice. This report is not, and is not constructed as, an offer to sell or solicitation of any offer to buy any fi nancial instrument, nor shall this report be construed as an opinion as to whether you should enter into any swap, investment or trading strategy involving a swap or any other transaction. Ontario Teachers’ may engage in transactions or have positions that are inconsistent with the views discussed in this report and may have positions, or be in the process of acquiring or disposing of positions, referred to in this report.
This information may not be reproduced without the prior express written consent of Ontario Teachers’.