Oil & Gas NOVEMBER 2011 - IBEF · PDF fileIOCL - Haldia-Barauni/Paradip Barauni 11 1,302 IOCL...
40
1 1 For updated information, please visit www.ibef.org Oil & Gas NOVEMBER 2011
Transcript of Oil & Gas NOVEMBER 2011 - IBEF · PDF fileIOCL - Haldia-Barauni/Paradip Barauni 11 1,302 IOCL...

1 1 For updated information, please visit www.ibef.org
Oil & Gas NOVEMBER
2011

2 2
Contents
Advantage India
Market overview and trends
Growth drivers
Success stories: ONGC, Reliance Industries
Opportunities
Useful information
For updated information, please visit www.ibef.org
Oil & Gas NOVEMBER
2011

3 3
Oil & Gas
For updated information, please visit www.ibef.org ADVANTAGE INDIA
Advantage India
NOVEMBER
2011
Advantage India
• India is the world’s fifth-largest energy consumer; oil accounts for 30 per cent of the total energy consumption
• Buoyant economic growth is the main factor driving the country’s energy requirements
• About 130,000 people were employed in the petroleum industry during 2009–10
• The University of Petroleum and Energy Studies in Dehradun, Uttarakhand, is Asia’s first and only energy university
• 100 per cent Foreign Direct Investment (FDI) is allowed in upstream and private sector refining projects
• The FDI limit for public sector refining projects has been raised to 49 per cent
• Government has enacted various policies [such as the New Exploration Licensing Policy (NELP) and Coal Bed Methane (CBM) policy] to encourage investments across the industry’s value chain
Oil demand – 4 million B/D; Gas
demand – 105.0 BCM
2015E
Oil demand – 3 million B/D; Gas
demand – 41.3 BCM
2008
Source: Business Monitor International (BMI), Aranca research Notes: B/D – barrels per day, BCM – billion cubic meters
Growing demand Skilled workforce
Supportive FDI guidelines Accommodating Policies

4 4
Contents
Advantage India
Market overview and trends
Growth drivers
Success stories: ONGC, Reliance Industries
Opportunities
Useful information
For updated information, please visit www.ibef.org
Oil & Gas NOVEMBER
2011

5 5 For updated information, please visit www.ibef.org MARKET OVERVIEW AND TRENDS
In India, oil and gas is dominated by state-owned entities
Oil & Gas NOVEMBER
2011
→ India is the fifth-largest energy consumer in the world
→ The country has 5.8 billion barrels of proven oil reserves with an average oil production of 815,000 B/D
→ India has 1,115 BCM of gas reserves, which produce 39.3 BCM annually
Indian oil and gas sector
• The upstream segment is dominated by the state-owned ONGC
• It is the largest upstream company in the exploration and production (E&P) segment, accounting for approximately 75 per cent of the country’s total oil output
Upstream segment - Exploration and
production
Midstream segment – Storage and
transportation
Downstream segment – Refining, processing
and marketing
• IOCL operates a 10,329 km network of crude and product pipelines with a capacity of 1.4 million B/D
• This is around 75 per cent of the nation’s total domestic oil pipeline network
• IOCL is the largest company, operating 10 out of 19 Indian refineries
• Reliance launched India’s first privately-owned refinery in 1999, and has gained a considerable market share (41 per cent – 2Q 2011)
Source: BP Statistical Review, June 2010, BMI Forecasts Note: BCM – Billion Cubic Meters; Barrel/Day – B/D, ONGC – Oil and Natural Gas
Corporation of India, IOCL – Indian Oil Corporation Limited

6 6 For updated information, please visit www.ibef.org
Oil supply and demand in India … (1/2)
MARKET OVERVIEW AND TRENDS
Oil & Gas NOVEMBER
2011
→ Oil consumption is estimated to rise from 3 million b/d in 2009 to 4 million b/d by 2015
→ Owing to growth in demand, dependency on imports is expected to increase
Growth in demand has outpaced supply expansion
5,650
5,700
5,750
5,800
5,850
5,900
5,950
6,000
6,050
0
500
1,000
1,500
2,000
2,500
3,000
3,500
4,000
4,500
2008 2009 2010E 2011F 2012F 2013F 2014F 2015F
Oil Consumption ('000b/d) Proven Oil Reserves (mn bbl) - RHS
Source: BMI Forecasts - 2Q 2011 Notes: b/d – Barrel/Day, mn bbl – million barrel

7 7 For updated information, please visit www.ibef.org MARKET OVERVIEW AND TRENDS
Oil & Gas NOVEMBER
2011
Oil supply and demand in India … (2/2)
→ Imports currently account for approximately 75 per cent of the total demand
→ Backed by new oil fields, the domestic oil output is anticipated to grow to 925,000 b/d by 2015
Imports form a substantial portion of total oil supply (‘000 b/d)
0
500
1,000
1,500
2,000
2,500
3,000
3,500
4,000
4,500
2008 2009 2010E 2011F 2012F 2013F 2014F 2015F
Oil Production ('000b/d) Oil Imports ('000b/d)
Source: BMI Forecasts - 2Q 2011

8 8 For updated information, please visit www.ibef.org
Gas supply and demand in India … (1/2)
MARKET OVERVIEW AND TRENDS
Oil & Gas NOVEMBER
2011
→ With India developing gas-fired power stations, consumption is up more than 160 per cent since 1995
Demand expected to rise at a CAGR of 12 per cent (2009–15) (BCM)
1,090 1,115 1,120 1,250 1,300 1,500 1,600 1,600
41.3 51.9 55.0 67.2
76.3
85.5 97.7 105.0
2008 2009 2010E 2011F 2012F 2013F 2014F 2015F
Proven Gas Reserves Gas Consumption
Source: BMI Forecasts - 2Q 2011 Note: BCM – Billion Cubic Meters

9 9 For updated information, please visit www.ibef.org MARKET OVERVIEW AND TRENDS
Oil & Gas NOVEMBER
2011
Gas supply and demand in India … (2/2)
→ The gas imports account for approximately 25 per cent of the total demand
Domestic production contributes to most of the supply (BCM)
30.5 39.3 45.0 50.0 57.0 60.0
70.0 73.0 10.8 12.6
10.0 17.2
19.3 25.5
27.7 32.0
2008 2009 2010E 2011F 2012F 2013F 2014F 2015F
Gas Production Gas Imports
Source: BMI Forecasts - 2Q 2011 Note: BCM – Billion Cubic Meters

10 10 For updated information, please visit www.ibef.org
Upstream segment – Crude oil and gas production … (1/2)
MARKET OVERVIEW AND TRENDS
Oil & Gas NOVEMBER
2011
→ Total crude production stood at 33.3 MMT during FY11
→ ONGC accounted for 73 per cent of the total production
Crude oil production (MMT)
Note: MMT – Million Metric Tonne
26.1 25.9 25.4 24.9 24.4
3.1 3.1 3.5 3.6 3.7
4.8 5.1 4.6 5.0 5.2
FY07 FY08 FY09 FY10 FY11
ONGC OIL Private/JV
Source: Company reports, www.petroleum.nic.in, Aranca Research

11 11 For updated information, please visit www.ibef.org
Upstream segment – Crude oil and gas production … (2/2)
MARKET OVERVIEW AND TRENDS
Oil & Gas NOVEMBER
2011
→ Total gas production was 52.2 BCM during FY11
→ The contribution from Private/JV has drastically increased in the last couple of years as the development of the Reliance - Krishna Godavari (KG) basin commenced
Annual gas production (BCM)
22.4 22.3 22.5 23.1 23.1
2.3 2.3 2.3 2.4 2.6 7.1 8.4 8.1
22.0 26.5
FY07 FY08 FY09 FY10 FY11
ONGC OIL Private/JV
Source: Company reports, www.petroleum.nic.in, Aranca Research

12 12 For updated information, please visit www.ibef.org MARKET OVERVIEW AND TRENDS
→ During FY10, 428,000 meters of wells were being explored and developed in India
→ The total number of wells drilled in the country during the same period was 1,019,000 metres
→ Most upstream drilling and exploration work is undertaken by state-owned oil companies
→ The leader in the upstream segment is ONGC, which accounts for 70 per cent of the total crude oil output in India
Exploration activities (FY10) (‘000 meter)
Source: www.dghindia.org
Upstream segment – Exploration and development activities
Oil & Gas NOVEMBER
2011
110
298 34
128
Wells Metreage
Onshore Offshore
Development drilling activities (FY10) (‘000 meter)
Source: www.dghindia.org
236
470 48
123
Wells Metreage
Onshore Offshore

13 13 For updated information, please visit www.ibef.org MARKET OVERVIEW AND TRENDS
Midstream segment – Storage and transportation
Oil & Gas NOVEMBER
2011
→ The total length of crude oil pipelines in India is 6,235 kilometers (km) with a total capacity of 92.6 million metric tonnes per annum (MMTPA)
→ ONGC contributes 47.3 per cent to the Indian crude pipeline capacity with a 673 km long pipeline network across the country
→ IOCL accounts for 43.6 per cent of the country’s crude pipeline capacity with its 4,366 km long network of crude pipelines
→ OIL accounts for the remaining share of crude pipeline capacity; it owns the 1,193 km long Duliajan-Digboi-Bongaigaon-Barauni pipeline with a capacity of 8.4 MMTPA
Name of the pipeline Capacity (MMTPA)
Length (km)
OIL - Duliajan-Digboi-Bongaigaon-Barauni 8.4 1,193
IOCL - Salaya-Mathura-Panipat Pipeline 21 1,870
IOCL - Haldia-Barauni/Paradip Barauni 11 1,302
IOCL - Mundra-Panipat 8.4 1,194
ONGC - Mumbai High-Uran 15.6 204
ONGC - Heera-Uran 11.5 81
ONGC - Kalol-Nawagam-Koyali 8.5 129.31
ONGC - MHN-NGM 2.2 77
ONGC - CTF, Ank to Koyali (AKCL) 2 94.8
ONGC - Lakwa-Moran 1.5 18
ONGC - Geleki-Jorhat 1.5 48.47
ONGC - NRM to CPCL 0.7 6
ONGC - KSP-WGGS to TPK refinery 0.08 13.5
ONGC - GMAA EPT to S. Yanam unloading terminal 0.09 4
Total 92.6 6,235
Source: Basic Statistics Report, Indian Petroleum & Natural Gas – www.petroleum.nic.in

14 14 For updated information, please visit www.ibef.org MARKET OVERVIEW AND TRENDS
Refinery crude throughput (MMT)
Source: www.petroleum.nic.in
Downstream segment – Refinery crude throughput … (1/2)
→ State-controlled entities dominate the downstream segment as well
→ In total, India has 20 refineries, 17 in the public sector and 3 in the private sector
→ Public sector refineries accounted for 70 per cent of the total refinery crude throughput
Oil & Gas NOVEMBER
2011
97 108 113 112 112
33 38
44 49 48
2006 2007 2008 2009 2010
Public Sector Private Sector

15 15 For updated information, please visit www.ibef.org MARKET OVERVIEW AND TRENDS
Total installed capacity (MMT)
Source: www.petroleum.nic.in
→ The total crude throughput rose from 130 MMT during 2006 to 160 MMT by 2010
→ In 2010, the sector’s total installed capacity also increased to 184 MMT from 178 MMT in 2009
→ In 2009, Reliance emerged as the largest domestic refiner with a capacity of 62 MMT (Jamnagar Refinery)
Oil & Gas NOVEMBER
2011
Downstream segment – Refinery crude throughput … (2/2)
105 112
73 73
2009 2010
Public Sector Private Sector
Note: MMT – Million Metric Tonne

16 16 For updated information, please visit www.ibef.org MARKET OVERVIEW AND TRENDS
Petroleum products from crude oil (MMT)
Source: www.petroleum.nic.in
Downstream segment – Petroleum products
→ Petroleum products produced during 2010 amounted to 151.9 MMT (including 2.2 MMT of LPG from natural gas)
→ Petroleum products derived from crude oil include light distillates such as LPG, naphtha, natural gas liquids (NGL); middle distillates such as kerosene; and heavy ends such as furnace and lube oils, bitumen, petroleum coke, paraffin wax
→ Production of petroleum products is expected to reach 904.8 MMT by the end of the Eleventh Plan Period
Oil & Gas NOVEMBER
2011
32.4 38.1 40.1 40.2 40.4
64.4 71.2 76.6 80.3 79.4
22.9 25.9
28.2 30.0 29.9
2006 2007 2008 2009 2010
Light Distillates Middle Distillates Heavy Ends
Petroleum products from natural gas (MMT)
Source: www.petroleum.nic.in
2.2
2.1
2.1
2.2
2.2
2006 2007 2008 2009 2010
LPG

17 17 For updated information, please visit www.ibef.org MARKET OVERVIEW AND TRENDS
Petroleum products from crude oil (‘000 tonne)
Source: Basic Statistics Report, Indian Petroleum & Natural Gas – www.petroleum.nic.in
Downstream segment – Distribution and marketing
→ Total sales of petroleum products by companies was 138.2 MMT in 2009–10, which was 3.6 per cent higher than the previous year (133.4 MMT)
→ IOC had the maximum retail outlets in the country at 51.1 per cent, followed by HPCL at 25 per cent and BPCL at 23.8 per cent; remaining outlets were owned by private firms
→ Total number of retail outlets of public sector oil marketing companies (OMCs) increased to 36,462 in April 2010 from 34,948 in 2009
→ The number of LPG distributors in India were 9,686 as on 1 April 2010
Oil & Gas NOVEMBER
2011
0
30,000
60,000
90,000
120,000
150,000
2006 2007 2008 2009 2010
Product Pipeline LPG Pipeline Crude Pipeline
Pipeline Capacity (MMTPA)
As of 2010 Length (km) As of 2010
Product Pipeline 65.9 10,616
LPG Pipeline 3.9 2,252
Crude Pipeline 92.6 6,235
Total 162.5 19,103

18 18 For updated information, please visit www.ibef.org MARKET OVERVIEW AND TRENDS
Consumption pattern in 2010
Source: BMI Report, June 2011 Note: # Other sources includes nuclear power as well
India’s energy consumption mix … (1/2)
→ In 2010, coal accounted for more than 50 per cent of the total primary energy demand
→ Energy demand in Asia Pacific region is expected to reach 5,496 million TOE over the next five years (20.6 per cent growth compared to 2010)
→ India’s share is forecasted to increase from 11.3 per cent to 11.8 per cent during the same period
Note: TOE – Tonne of oil equivalent
Oil & Gas NOVEMBER
2011
51%
31%
10%
6%
2%
Coal
Oil
Gas
Hydro Power
Others#
19 19 For updated information, please visit www.ibef.org MARKET OVERVIEW AND TRENDS
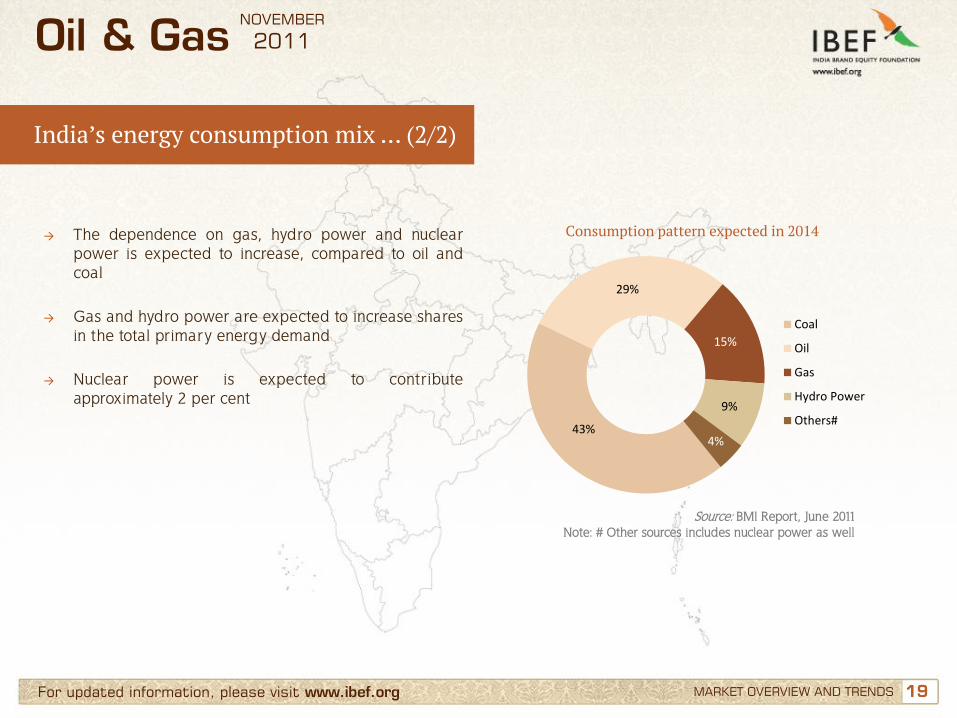
Consumption pattern expected in 2014
Source: BMI Report, June 2011 Note: # Other sources includes nuclear power as well
→ The dependence on gas, hydro power and nuclear power is expected to increase, compared to oil and coal
→ Gas and hydro power are expected to increase shares in the total primary energy demand
→ Nuclear power is expected to contribute approximately 2 per cent
Oil & Gas NOVEMBER
2011
India’s energy consumption mix … (2/2)
43%
29%
15%
9%
4%
Coal
Oil
Gas
Hydro Power
Others#

20 20 For updated information, please visit www.ibef.org MARKET OVERVIEW AND TRENDS
Key domestic companies – Indian oil and gas sector
Source: Company Reports
Oil & Gas NOVEMBER
2011
Company Ownership (%) Turnover 2010–11
(USD million)
Indian Oil Corporation Limited 89% state-owned 68,488
Reliance Industries Public Listed 53,886
Bharat Petroleum Corporation Limited 66% state-owned 34,591
Hindustan Petroleum Corporation
Limited 51% state-owned 27,812
ONGC 74% state-owned 13,782
GAIL India Limited 57% state-owned 6,762
Oil India Limited 98.1% state-owned 1,730

21 21 For updated information, please visit www.ibef.org MARKET OVERVIEW AND TRENDS
Key international companies – Indian oil and gas sector
Oil & Gas NOVEMBER
2011
Company Ownership (%) Turnover FY10 (USD million)
Cairn Energy India Pty Ltd Private Sector 340
Shell Private Sector 278,200
BG Group Private Sector 16,100
BP Private Sector 239,300
Source: Company Reports

22 22 For updated information, please visit www.ibef.org MARKET OVERVIEW AND TRENDS
Key trends in the sector – Alternative fuels
Oil & Gas NOVEMBER
2011
• Government approved the CBM policy in 1997 to boost the development of clean and renewable energy resources
• CBM is an eco-friendly natural gas (methane), which is absorbed in coal and lignite seams
• CBM policy was designed to be liberal and investor friendly; the first commercial production of CBM was initiated in July 2007 at about 72,000 cubic metres per day
• The technology was first widely used in the US in the 1800s, and in India (Kolkata and Mumbai) in the early 1900s
• UCG is currently the only feasible technology available to harness energy from deep unmineable coal seams economically in an eco-friendly manner
• Reduces capital outlay, operating costs and output gas expenses by 25–50 per cent, vis-à-vis surface gasification
Underground coal gasification (UCG)
• The government initiated the National Gas Hydrate Programme (NGHP), a consortium of national E&P companies and research institutions, to map gas hydrates for use as an alternate source of energy
• Bio-fuels (bio-ethanol and bio-diesel) are alternate sources of energy from domestic renewable resources; these have lower emissions compared to petroleum or diesel
Gas hydrates and bio-fuels
Coal bed methane (CBM)

23 23
Contents
Advantage India
Market overview and trends
Growth drivers
Success stories: ONGC, Reliance Industries
Opportunities
Useful information
For updated information, please visit www.ibef.org
Oil & Gas NOVEMBER
2011

24 24 For updated information, please visit www.ibef.org GROWTH DRIVERS
Persistent domestic demand to drive the market
Oil & Gas NOVEMBER
2011
Strong
government
support
Inviting Resulting in
Growing demand Policy support Increasing investments
India is fifth largest energy
consumer
Supportive FDI policies
FDI grew 111 per cent y-o-y in 2011
Rise in population and economic growth to fuel
demand
Promoting of investments in the
sector
Cumulative FDIs in oil & gas totalled USD3,159 million
Increasing industrialisation
and usage of gas
Introducing policies such as CBM and NELP
Huge investments planned under Eleventh Plan

25 25 For updated information, please visit www.ibef.org
Growth drivers … (1/2)
GROWTH DRIVERS
Oil & Gas NOVEMBER
2011
Robust domestic market; expected to expand
• India is the fifth-largest energy consumer in the world
• Oil consumption is expected to rise 42.5 per cent during 2010–20
• The country’s gas demand is approximately 11.2 per cent of the total Asia Pacific regional demand
Increasing demand for natural gas
• Several industries are increasing the usage of natural gas in operations; this has boosted natural gas demand in India
• Some of the main industries that use natural gas - pulp and paper, metals, chemicals, glass, plastic and food processing
Abundant raw material
• The nation has large coal, crude oil and natural gas reserves
• Crude oil reserves rose from 775 MMT in 2009 to 1,201 MMT in 2010
• Natural gas reserves increased from 1,074 BCM in 2009 to 1,437 BCM in 2010
Favourable policies
• 100 per cent FDI allowed in E&P projects/companies; 49 per cent allowed in refining
• Policies to promote investments in the industry such as NELP and CBM
Source: BMI, www.petroleum.nic.in, Aranca Research

26 26 For updated information, please visit www.ibef.org GROWTH DRIVERS
Oil & Gas NOVEMBER
2011
Growth drivers … (2/2)
Huge investments
• Investments worth USD563 billion is expected across the oil and gas value chain under the Eleventh Plan (2007–12)
• Since 2005, FDI worth USD2,214 million was invested in the petroleum and natural gas sectors in India
Skilled labour
• The nation offers abundant skilled labour at much competitive wages compared to other countries
• The University of Petroleum and Energy Studies in Dehradun, Uttarakhand, is Asia’s first and only energy university
Natural gas discoveries
• Several domestic companies (such as ONGC, Reliance and Gujarat State Petroleum) have reportedly found natural gas in deep waters
• This offers significant expansion opportunity for the next decade
Source: BMI, www.petroleum.nic.in, Aranca Research
27 27 For updated information, please visit www.ibef.org
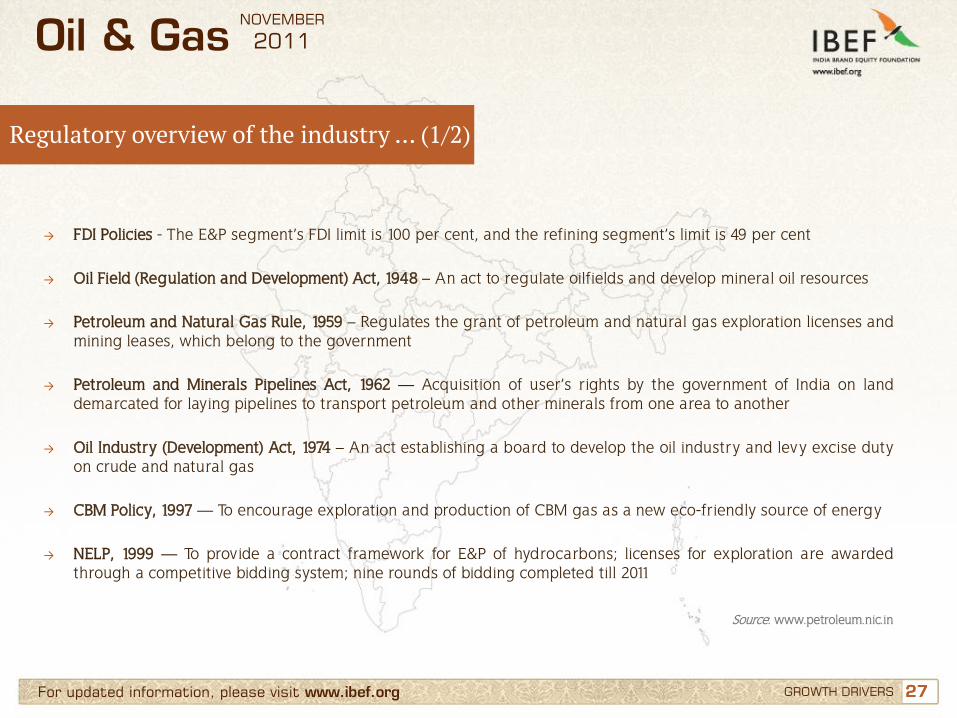
Regulatory overview of the industry … (1/2)
GROWTH DRIVERS
→ FDI Policies - The E&P segment’s FDI limit is 100 per cent, and the refining segment’s limit is 49 per cent
→ Oil Field (Regulation and Development) Act, 1948 – An act to regulate oilfields and develop mineral oil resources
→ Petroleum and Natural Gas Rule, 1959 – Regulates the grant of petroleum and natural gas exploration licenses and mining leases, which belong to the government
→ Petroleum and Minerals Pipelines Act, 1962 — Acquisition of user’s rights by the government of India on land demarcated for laying pipelines to transport petroleum and other minerals from one area to another
→ Oil Industry (Development) Act, 1974 – An act establishing a board to develop the oil industry and levy excise duty on crude and natural gas
→ CBM Policy, 1997 — To encourage exploration and production of CBM gas as a new eco-friendly source of energy
→ NELP, 1999 — To provide a contract framework for E&P of hydrocarbons; licenses for exploration are awarded through a competitive bidding system; nine rounds of bidding completed till 2011
Oil & Gas NOVEMBER
2011
Source: www.petroleum.nic.in
28 28 For updated information, please visit www.ibef.org GROWTH DRIVERS
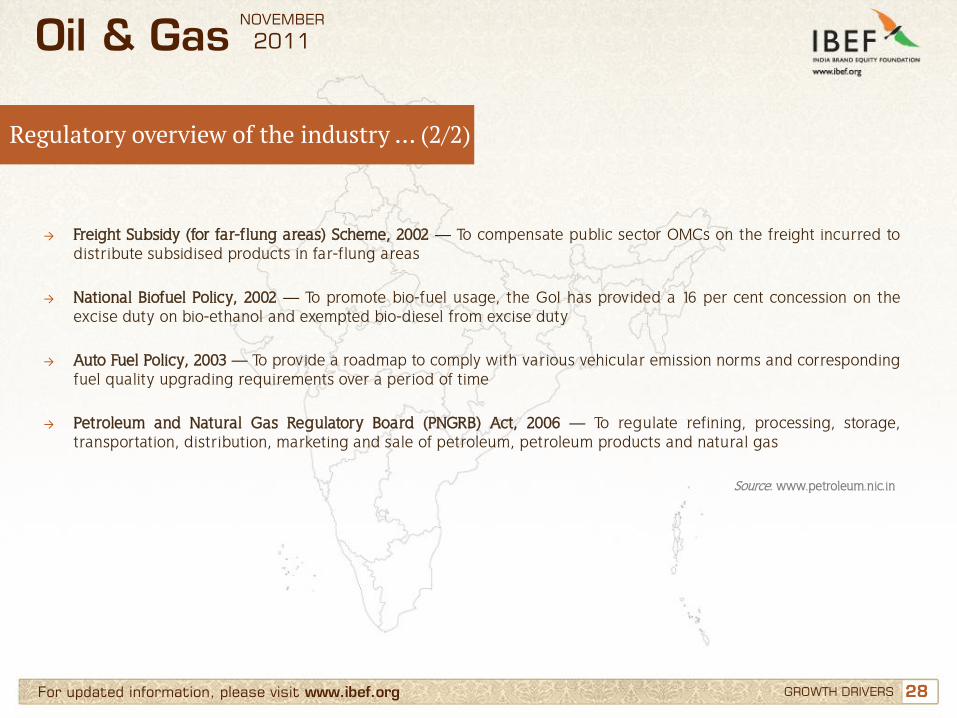
→ Freight Subsidy (for far-flung areas) Scheme, 2002 — To compensate public sector OMCs on the freight incurred to distribute subsidised products in far-flung areas
→ National Biofuel Policy, 2002 — To promote bio-fuel usage, the GoI has provided a 16 per cent concession on the excise duty on bio-ethanol and exempted bio-diesel from excise duty
→ Auto Fuel Policy, 2003 — To provide a roadmap to comply with various vehicular emission norms and corresponding fuel quality upgrading requirements over a period of time
→ Petroleum and Natural Gas Regulatory Board (PNGRB) Act, 2006 — To regulate refining, processing, storage, transportation, distribution, marketing and sale of petroleum, petroleum products and natural gas
Oil & Gas NOVEMBER
2011
Regulatory overview of the industry … (2/2)
Source: www.petroleum.nic.in
29 29 For updated information, please visit www.ibef.org
FDI investments in petroleum and gas in India
GROWTH DRIVERS
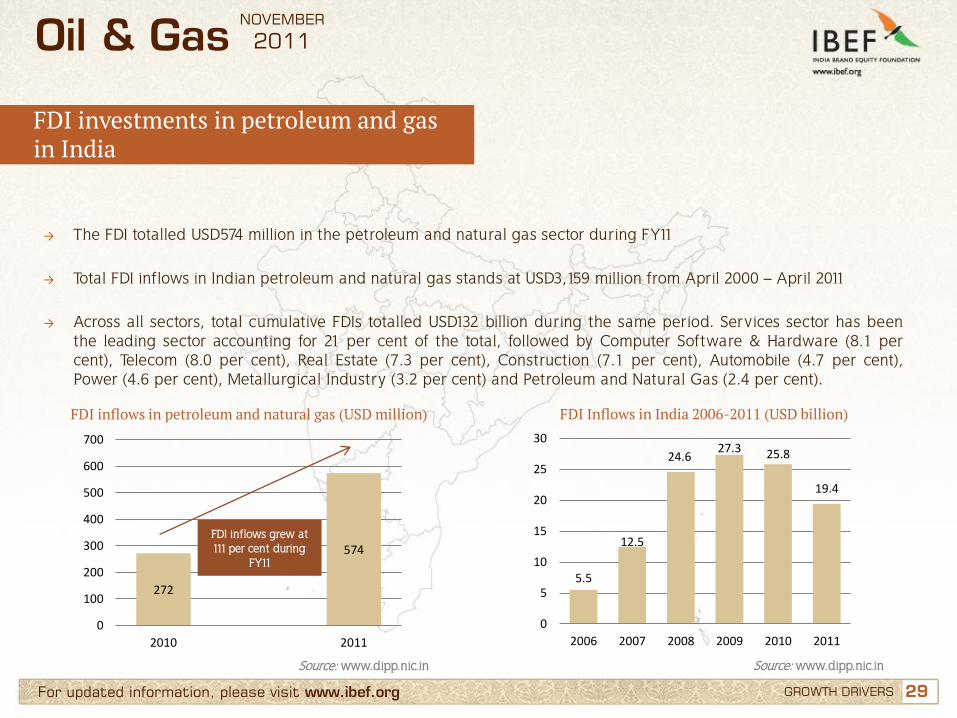
→ The FDI totalled USD574 million in the petroleum and natural gas sector during FY11
→ Total FDI inflows in Indian petroleum and natural gas stands at USD3,159 million from April 2000 – April 2011
→ Across all sectors, total cumulative FDIs totalled USD132 billion during the same period. Services sector has been the leading sector accounting for 21 per cent of the total, followed by Computer Software & Hardware (8.1 per cent), Telecom (8.0 per cent), Real Estate (7.3 per cent), Construction (7.1 per cent), Automobile (4.7 per cent), Power (4.6 per cent), Metallurgical Industry (3.2 per cent) and Petroleum and Natural Gas (2.4 per cent).
FDI inflows in petroleum and natural gas (USD million)
Source: www.dipp.nic.in
Oil & Gas NOVEMBER
2011
272
574
0
100
200
300
400
500
600
700
2010 2011
FDI inflows grew at 111 per cent during
FY11
FDI Inflows in India 2006-2011 (USD billion)
Source: www.dipp.nic.in
5.5
12.5
24.6 27.3 25.8
19.4
0
5
10
15
20
25
30
2006 2007 2008 2009 2010 2011
30 30 For updated information, please visit www.ibef.org GROWTH DRIVERS
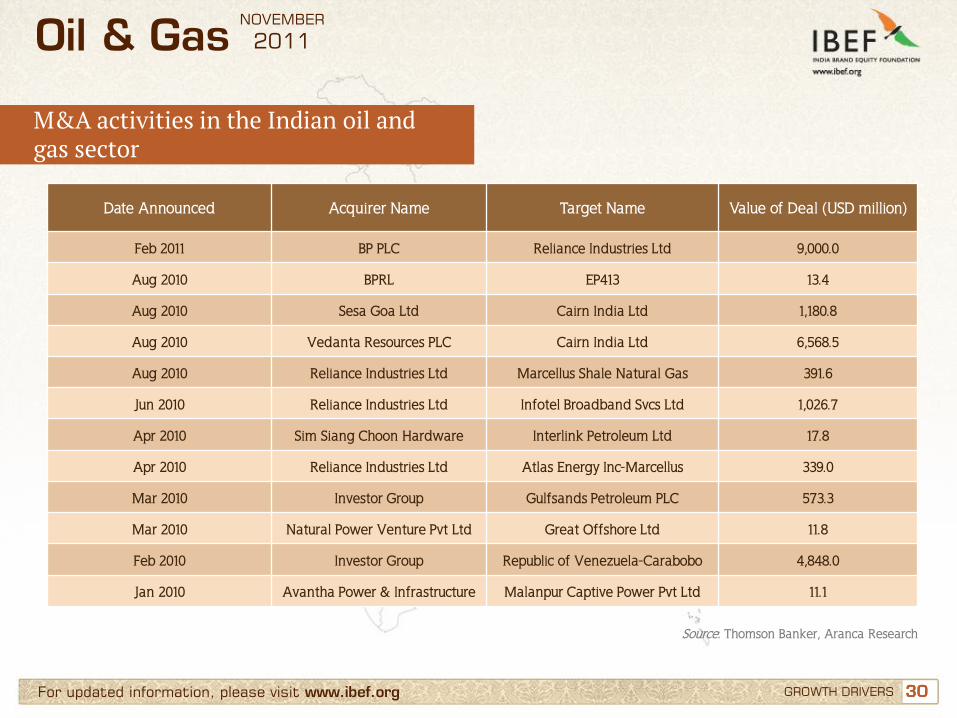
M&A activities in the Indian oil and gas sector
Oil & Gas NOVEMBER
2011
Date Announced Acquirer Name Target Name Value of Deal (USD million)
Feb 2011 BP PLC Reliance Industries Ltd 9,000.0
Aug 2010 BPRL EP413 13.4
Aug 2010 Sesa Goa Ltd Cairn India Ltd 1,180.8
Aug 2010 Vedanta Resources PLC Cairn India Ltd 6,568.5
Aug 2010 Reliance Industries Ltd Marcellus Shale Natural Gas 391.6
Jun 2010 Reliance Industries Ltd Infotel Broadband Svcs Ltd 1,026.7
Apr 2010 Sim Siang Choon Hardware Interlink Petroleum Ltd 17.8
Apr 2010 Reliance Industries Ltd Atlas Energy Inc-Marcellus 339.0
Mar 2010 Investor Group Gulfsands Petroleum PLC 573.3
Mar 2010 Natural Power Venture Pvt Ltd Great Offshore Ltd 11.8
Feb 2010 Investor Group Republic of Venezuela-Carabobo 4,848.0
Jan 2010 Avantha Power & Infrastructure Malanpur Captive Power Pvt Ltd 11.1
Source: Thomson Banker, Aranca Research

31 31
Contents
Advantage India
Market overview and trends
Growth drivers
Success stories: ONGC, Reliance Industries
Opportunities
Useful information
For updated information, please visit www.ibef.org
Oil & Gas NOVEMBER
2011
32 32 For updated information, please visit www.ibef.org SUCCESS STORIES: ONGC, RELIANCE INDUSTRIES
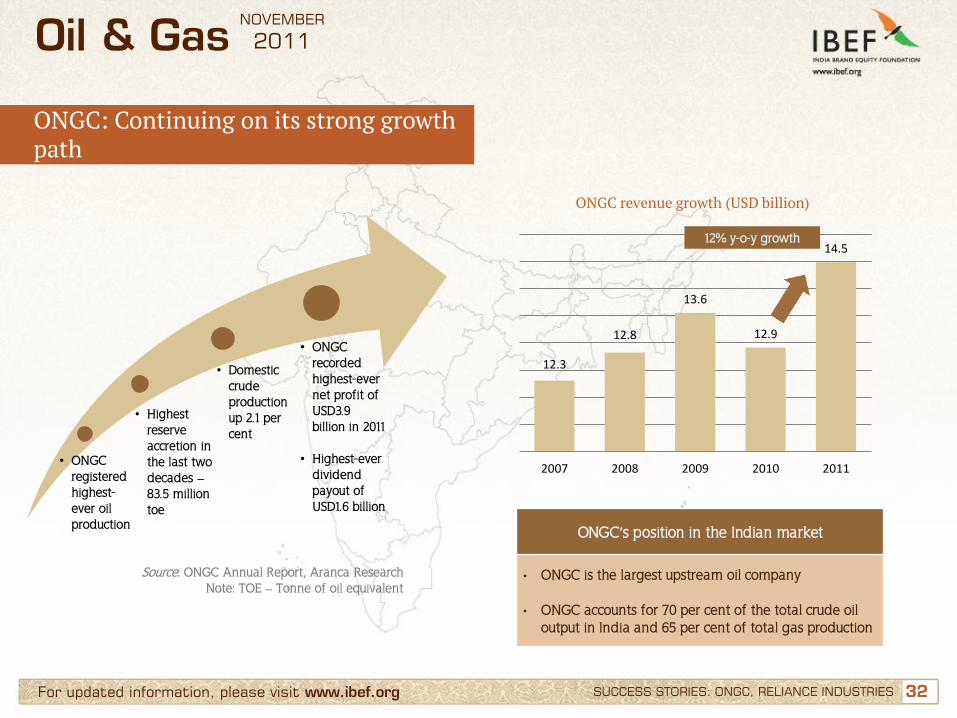
ONGC: Continuing on its strong growth path
Oil & Gas NOVEMBER
2011
• ONGC registered highest-ever oil production
• Highest reserve accretion in the last two decades – 83.5 million toe
• Domestic crude production up 2.1 per cent
• ONGC recorded highest-ever net profit of USD3.9 billion in 2011
• Highest-ever dividend payout of USD1.6 billion
ONGC revenue growth (USD billion)
12.3
12.8
13.6
12.9
14.5
2007 2008 2009 2010 2011
12% y-o-y growth
ONGC’s position in the Indian market
• ONGC is the largest upstream oil company
• ONGC accounts for 70 per cent of the total crude oil output in India and 65 per cent of total gas production
Source: ONGC Annual Report, Aranca Research Note: TOE – Tonne of oil equivalent

33 33 For updated information, please visit www.ibef.org
Reliance Industries: Well positioned for growth
Oil & Gas NOVEMBER
2011
SUCCESS STORIES: ONGC, RELIANCE INDUSTRIES
→ Reliance Industries is a leading company in the petrochemical, refining and oil & gas industry
→ Reliance Industries Limited has uniquely positioned itself to pursue organic and inorganic growth opportunities
→ In FY11, the company recorded the crude throughput at 66.6 million tonnes and also notified six discoveries (five of oil and one of gas) to the Directorate General of Hydrocarbons (DGH)
FY10
Net Profit USD3.4 billion USD4.2 billion
EBITDA USD6.9 billion USD8.6 billion
Turnover USD41.8 billion USD53.9 billion
FY11
• Volume growth in the refining, and oil and gas businesses
• Turnover increased by 29.1 per cent during FY11
• Significant improvement in net profit due to improved refining and petrochemical margins
• Recorded one of the highest profit growths in FY11
• Net profit rose 25 per cent to USD4.2 billion Reliance Industries has entered into JVs with various companies across segments to
align growth opportunities; it signed JVs with Atlas, Pioneer, Carrizo SIBUR, and D.E. Shaw as well as entered into a strategic alliance with BP during FY11
34 34
Contents
Advantage India
Market overview and trends
Growth drivers
Success stories: ONGC, Reliance Industries
Opportunities
Useful information
For updated information, please visit www.ibef.org
Oil & Gas NOVEMBER
2011
35 35 For updated information, please visit www.ibef.org OPPORTUNITIES
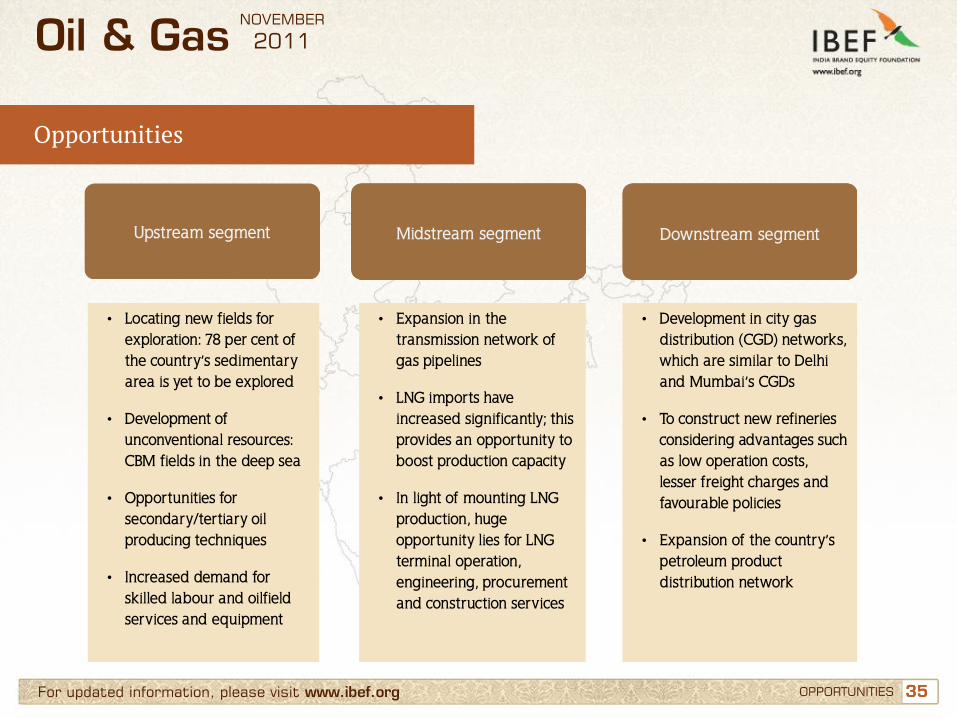
Opportunities
Oil & Gas NOVEMBER
2011
• Locating new fields for exploration: 78 per cent of the country’s sedimentary area is yet to be explored
• Development of unconventional resources: CBM fields in the deep sea
• Opportunities for secondary/tertiary oil producing techniques
• Increased demand for skilled labour and oilfield services and equipment
• Expansion in the transmission network of gas pipelines
• LNG imports have increased significantly; this provides an opportunity to boost production capacity
• In light of mounting LNG production, huge opportunity lies for LNG terminal operation, engineering, procurement and construction services
• Development in city gas distribution (CGD) networks, which are similar to Delhi and Mumbai’s CGDs
• To construct new refineries considering advantages such as low operation costs, lesser freight charges and favourable policies
• Expansion of the country’s petroleum product distribution network
Upstream segment Midstream segment Downstream segment

36 36
Contents
Advantage India
Market overview and trends
Growth drivers
Success stories: ONGC, Reliance Industries
Opportunities
Useful information
For updated information, please visit www.ibef.org
Oil & Gas NOVEMBER
2011

37 37 For updated information, please visit www.ibef.org USEFUL INFORMATION
Industry Associations
Oil & Gas NOVEMBER
2011
Name Address Contact person Telephone E-mail
Oil Industry Development Board (OIDB)
301, World Trade Centre, Babar Road, New Delhi – 110001
Mr T S Balasubramanian, Financial Adviser and Chief Accounts Officer
91-11- 23413298 91-11- 23414692
Petroleum Conservation Research Association (PCRA)
Sanrakshan Bhavan, 10 Bhikaji Cama Place, New Delhi – 110066
Mr Arun Kumar, ED 91-11- 26198799 Ext.301 [email protected]
Bureau of Energy Efficiency (BEE)
Ministry of Power, 4th floor, SEWA Bhawan, RK Puram, New Delhi – 110066
Dr Ajay Mathur, Director General
91-11- 26178316, 91-11- 26179699
[email protected], [email protected]
Oil Industry Safety Directorate
Ministry of Petroleum & Natural Gas, 7th floor, “New Delhi House”, 27 Barakhamba Road, New Delhi – 110001
Mr J B Verma, ED 91-11- 23316798 [email protected]
Petroleum Planning and Analysis Cell (PPAC)
Ministry of Petroleum & Natural Gas, 2nd floor, Core-8, SCOPE Complex, 7 Institutional Area, Lodhi Road, New Delhi – 110003
Dr Basudev Mohanty, Director
91-11- 24362501, 91-11- 24361380
-
Directorate General of Hydrocarbons
Ministry of Petroleum & Natural Gas, C-139, Sector 63, Noida – 201301
Mr S K Srivastava, Director General
0120 - 4029401 [email protected]

38 38 For updated information, please visit www.ibef.org
Glossary … (1/2)
→ B/D: Barrels per day
→ BCM: Billion Cubic Metres
→ CBM: Coal bed methane
→ CGD: City gas distribution
→ E&P: Exploration and production
→ FDI: Foreign direct investment
→ FY: Indian financial year (April to March) → So FY10 implies April 2009 to March 2010
→ GoI: Government of India
→ INR: Indian Rupee
→ LNG: Liquefied natural gas
→ MMT: Million Metric Tonne
USEFUL INFORMATION
Oil & Gas NOVEMBER
2011

39 39 For updated information, please visit www.ibef.org
Glossary … (2/2)
→ NELP: New Exploration Licensing Policy
→ TOE: Tonnes of oil equivalent
→ USD: US Dollar
→ Conversion rate used: USD1= INR48
→ Wherever applicable, numbers have been rounded off to the nearest whole number
USEFUL INFORMATION
Oil & Gas NOVEMBER
2011
40
India Brand Equity Foundation (IBEF) engaged Aranca to prepare this presentation and the same has been prepared by Aranca in consultation with IBEF. All rights reserved. All copyright in this presentation and related works is solely and exclusively owned by IBEF. The same may not be reproduced, wholly or in part in any material form (including photocopying or storing it in any medium by electronic means and whether or not transiently or incidentally to some other use of this presentation), modified or in any manner communicated to any third party except with the written approval of IBEF. This presentation is for information purposes only. While due care has been taken during the compilation of this
presentation to ensure that the information is accurate to the best of Aranca and IBEF’s knowledge and belief, the content is not to be construed in any manner whatsoever as a substitute for professional advice. Aranca and IBEF neither recommend nor endorse any specific products or services that may have been mentioned in this presentation and nor do they assume any liability or responsibility for the outcome of decisions taken as a result of any reliance placed on this presentation. Neither Aranca nor IBEF shall be liable for any direct or indirect damages that may arise due to any act or omission on the part of the user due to any reliance placed or guidance taken from any portion of this presentation.
Disclaimer
For updated information, please visit www.ibef.org DISCLAIMER
Oil & Gas NOVEMBER
2011