Oil & Gas Journal’s 2018 Worldwide Pipeline Outlook · Oil & Gas Journal’s 2018 Worldwide...
28
Oil & Gas Journal’s 2018 Worldwide Pipeline Outlook Christopher E. Smith Managing Editor, Technology NACE – Houston Section Feb. 13, 2018
Transcript of Oil & Gas Journal’s 2018 Worldwide Pipeline Outlook · Oil & Gas Journal’s 2018 Worldwide...
Oil & Gas Journal’s 2018 Worldwide Pipeline Outlook
Christopher E. SmithManaging Editor, Technology
NACE – Houston SectionFeb. 13, 2018
OGJ special reports
• Annual Forecast & Review (Jan. 1) • Conglin Xu and Laura Bell
• Worldwide Pipeline Construction (Feb. 5)• Chris Smith
• Midyear Forecast (Jul. 2) • Conglin Xu and Laura Bell
• Pipeline Economics (Oct. 1)
• Chris Smith
Market summary
• OPEC cuts buoyed market (despite US shale)
• Activity recovered onshore. Starting to see signs offshore.
• But abundance still dominates the market
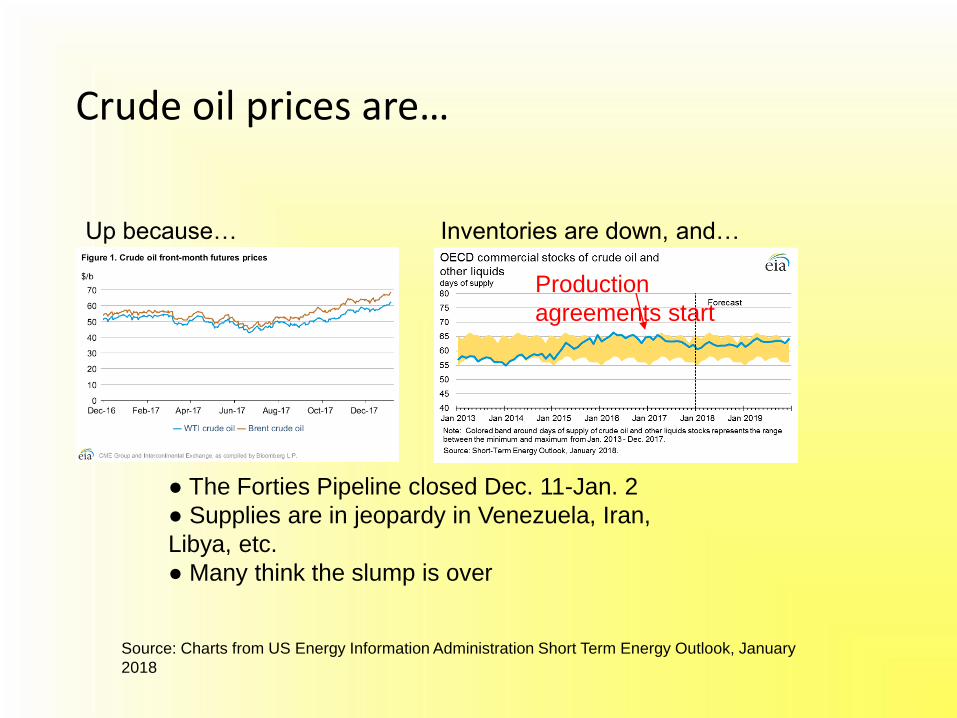
Crude oil prices are…
Up because… Inventories are down, and…
● The Forties Pipeline closed Dec. 11-Jan. 2
● Supplies are in jeopardy in Venezuela, Iran,
Libya, etc.
● Many think the slump is over
Production
agreements start
Source: Charts from US Energy Information Administration Short Term Energy Outlook, January
2018

Geopolitical variables in the oil price
• Developments that would lower supply and increase the crude price:• Iraq disrupts pipeline exports from Kurdistan
• Iranian protests spread to oil fields
• Venezuela collapses
• Nigerian militancy resumes (as Niger Delta Avengers promise)
• Libya sinks further into civil conflict
• Saudi-Iranian conflict escalates, by proxy or otherwise
• Development that would raise supply and lower the crude price:• Saudi Arabia abandons supply restraint because it…
• Uses confiscated wealth instead of Aramco IPO to finance economic reform
• Sees strategic advantage in lowering crude price to weaken Iran and Russia

OGJ F&R: US gas outlook 2018 (tcf)
Consumption 27.594 +2.4%
Production 31.000 +7.6%
Imports 2.864 -3.8%
Exports 3.778 +19.0%
Not shown: supplemental gas, losses, storage
Gas trade
IMPORTS EXPORTS
Canada 2.785 -3.9% LNG 1.113 +56.4%
Mexico .001 0 Pipeline 2.665 +8.1%
LNG 0.078 +1.8%

US LNG is changing the global market
• Price linked to Henry Hub rather than indexed to oil
• Contracts free of destination restrictions
• Combines with new supply from Australia, imminent supply from East Africa, small FLNG increment in West Africa, elsewhere to challenge traditional trade dominated by Qatar
• Competitive so far in Middle East, North Africa, Asia, South America
• Struggling to compete in Europe vs. pipeline gas from Russia• Gazprom dropped price to as low as $4/MMbtu in 2016; now ~$5/MMbtu
• US LNG in Europe: ˃$6/MMbtu ($3/MMbtu Henry Hub + ˃$3/MMbtu for
liquefaction, transportation, regasification)*
*Center for Strategic and International
Studies, October 2017

OGJ pipeline construction: 2018 only (miles)*
• Global - 14,657 miles, +89%
Return to 2013 levels
• US, Canada - 3,596 miles, +49%
Natural gas = 2,824 (78.5%)
Land pipeline construction costs:
2017, $5.94-million/mile
2016, $7.65-million/mile
*Projects planned to be completed in 2018.
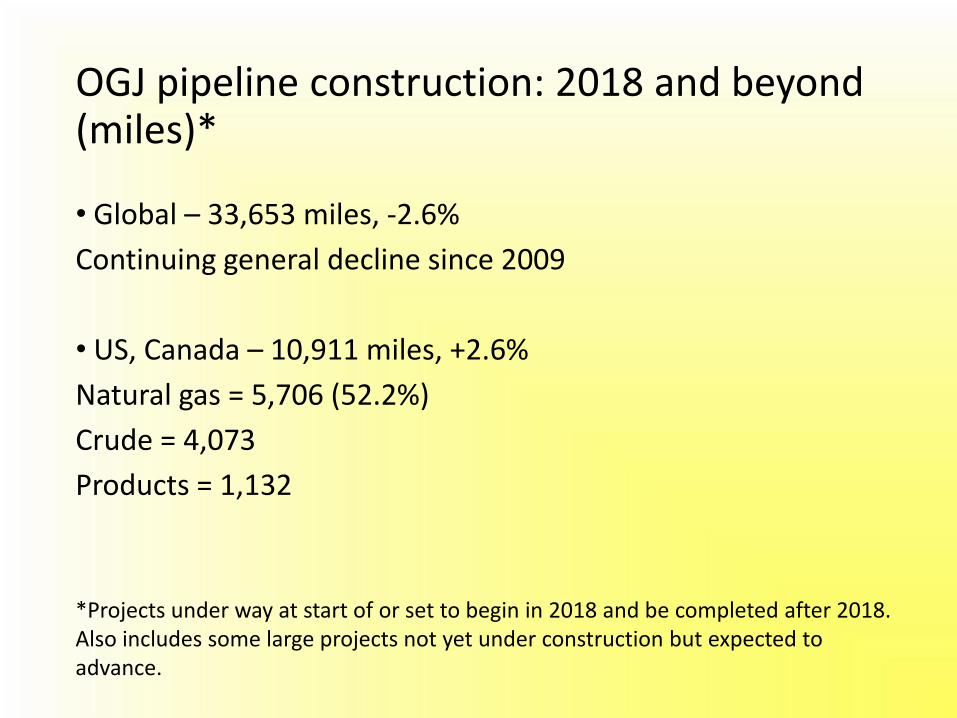
OGJ pipeline construction: 2018 and beyond (miles)*
• Global – 33,653 miles, -2.6%
Continuing general decline since 2009
• US, Canada – 10,911 miles, +2.6%
Natural gas = 5,706 (52.2%)
Crude = 4,073
Products = 1,132
*Projects under way at start of or set to begin in 2018 and be completed after 2018.Also includes some large projects not yet under construction but expected to advance.

Approvals one year ago (Jan.-Feb. 2017)…
• Northern Access (97 miles, Pennsylvania-NY)
• Atlantic Sunrise (200 miles, Marcellus-market)
• Rover (511 miles, Pennsylvania-Ontario)
• Rayne Xpress (adding HP Kentucky-Louisiana)
• Leach Xpress (160 miles, WV-Southern Ohio)

…and status now
• Northern Access – blocked by New York state
• Atlantic Sunrise – under construction (Spring 2014)• Rover – ongoing delays, but being built• Leach Xpress – started service Jan. 1, 2018
Delay updates!• NEXUS (Enbridge), 255 miles, 1.5 bcfd, Ohio-Michigan
- being built, still local delays, year-end 2018 in-service
• PennEast, 115 miles, 36-in., Pennsylvania-NJ- NJ Attorney General rejected easement offers
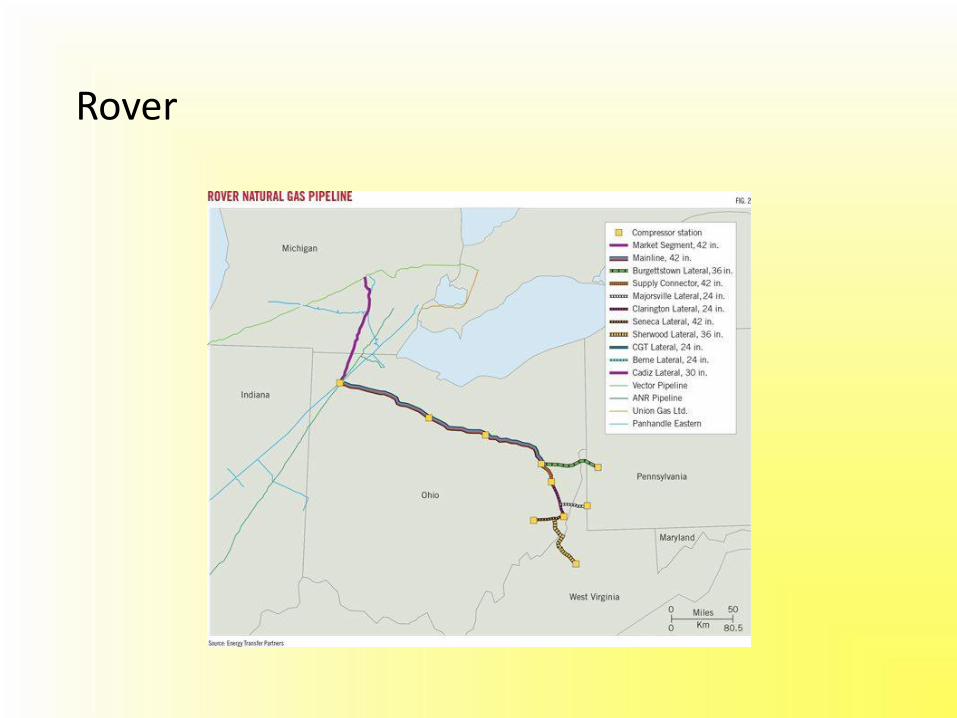
Rover
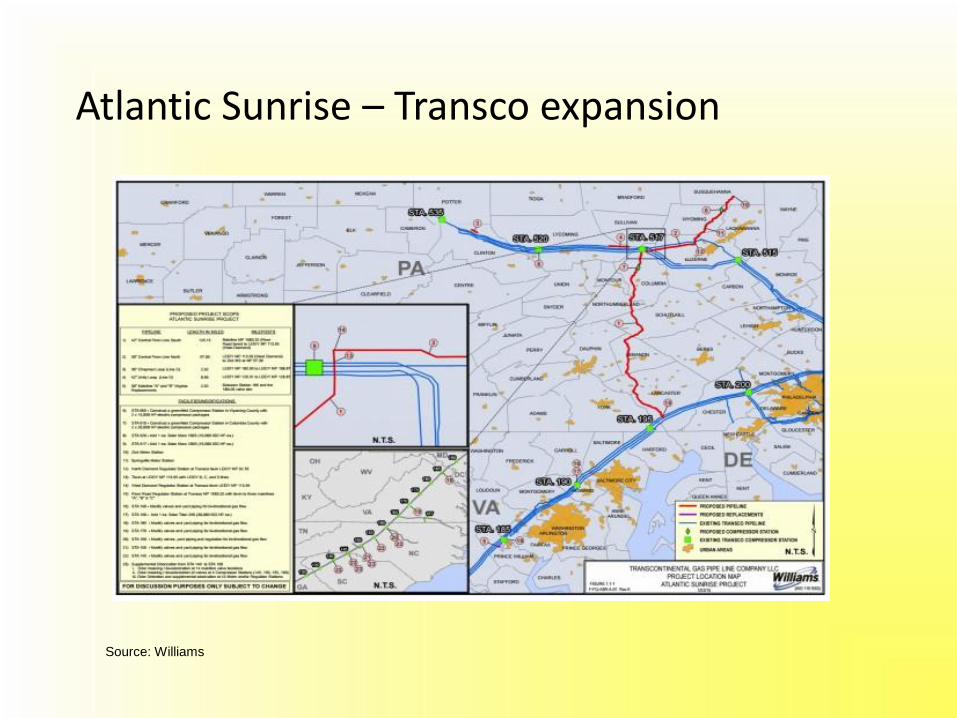
Atlantic Sunrise – Transco expansion
Source: Williams

NEXUS
Source: Nexus Gas Transmission

Escape from the Permian
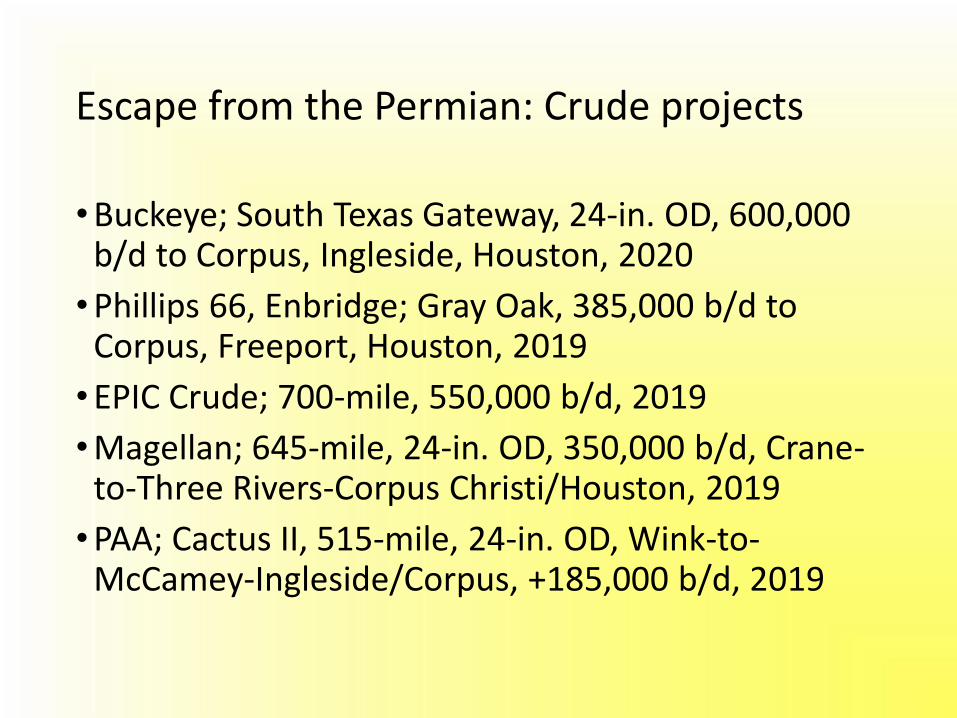
Escape from the Permian: Crude projects
• Buckeye; South Texas Gateway, 24-in. OD, 600,000 b/d to Corpus, Ingleside, Houston, 2020
• Phillips 66, Enbridge; Gray Oak, 385,000 b/d to Corpus, Freeport, Houston, 2019
• EPIC Crude; 700-mile, 550,000 b/d, 2019
• Magellan; 645-mile, 24-in. OD, 350,000 b/d, Crane-to-Three Rivers-Corpus Christi/Houston, 2019
• PAA; Cactus II, 515-mile, 24-in. OD, Wink-to-McCamey-Ingleside/Corpus, +185,000 b/d, 2019

Buckeye South Texas Gateway

EPIC Crude and Y-Grade Pipelines
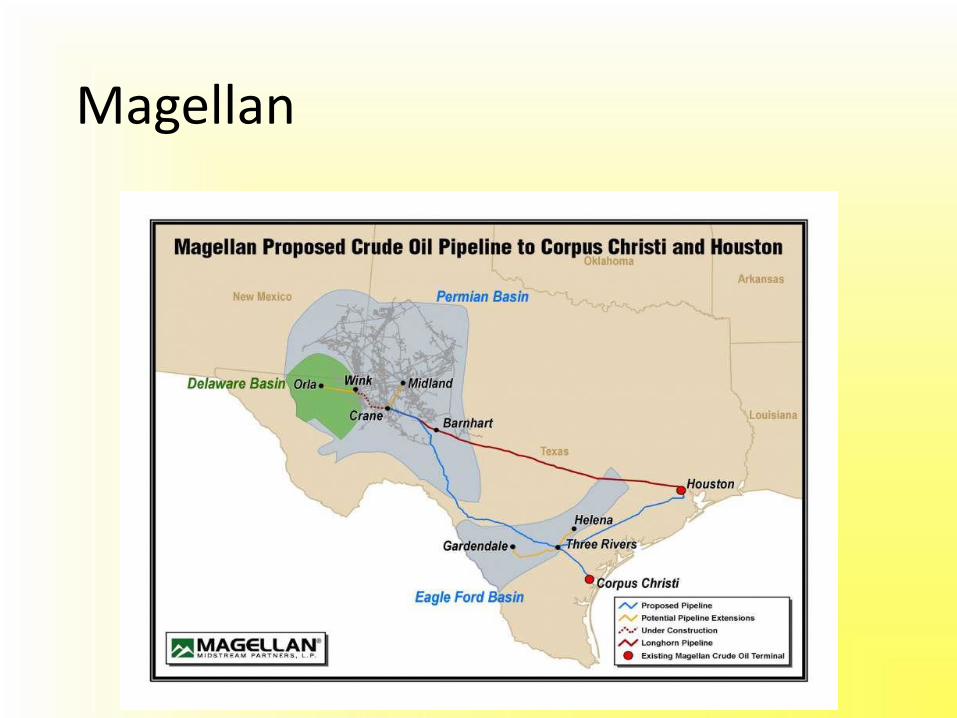
Magellan
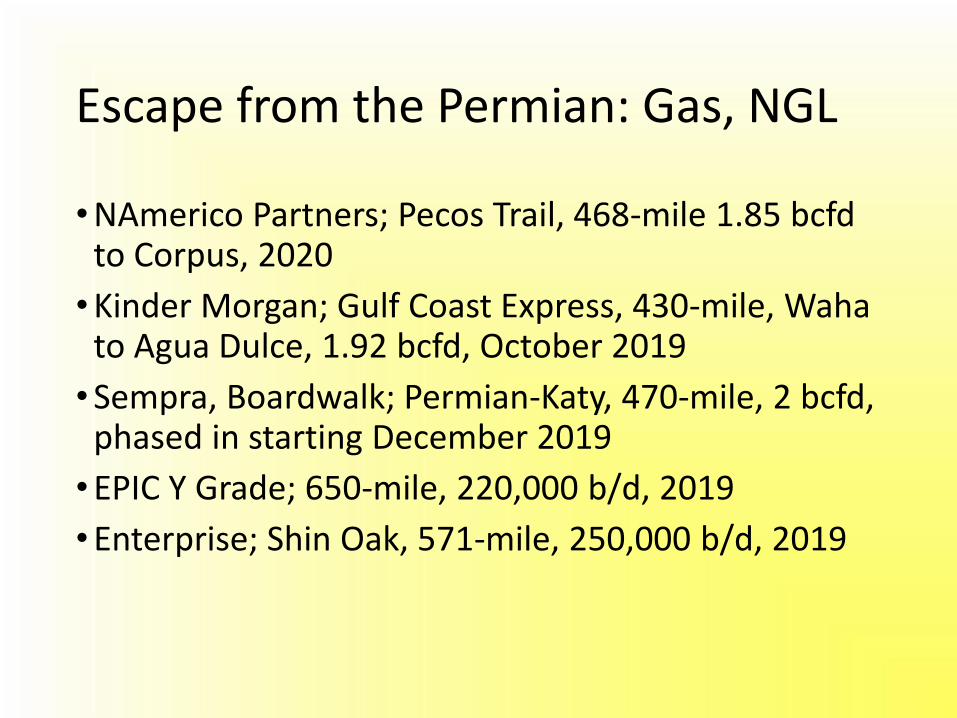
Escape from the Permian: Gas, NGL
• NAmerico Partners; Pecos Trail, 468-mile 1.85 bcfd to Corpus, 2020
• Kinder Morgan; Gulf Coast Express, 430-mile, Waha to Agua Dulce, 1.92 bcfd, October 2019
• Sempra, Boardwalk; Permian-Katy, 470-mile, 2 bcfd, phased in starting December 2019
• EPIC Y Grade; 650-mile, 220,000 b/d, 2019
• Enterprise; Shin Oak, 571-mile, 250,000 b/d, 2019

Kinder Morgan Gulf Coast Express

Permian-to-Katy (P2K)

Permian-to-Gulf NGL pipelines

Global crude
• Caspian-Xinjiang – Kazakh crude to China – 1,384 miles, 2018
•Basra-Aqaba – Export Iraqi crude –1,043 miles, 2020
• Uganda-Indian Ocean – roughly 930 miles, 2020

Global natural gas projects
•SCP/TAP/TANAP (Shah Deniz II) – Caspian to Europe• SCP (expansion) = 441 km, 56-in. OD, 2017• TANAP = 1,800 km, 48- and 56-in., 2018• TAP = 800 km, incl. 115 offshore, 2020
•Power of Siberia (CNPC, Gazprom) – Russian gas to China – 2,465 miles, 2019
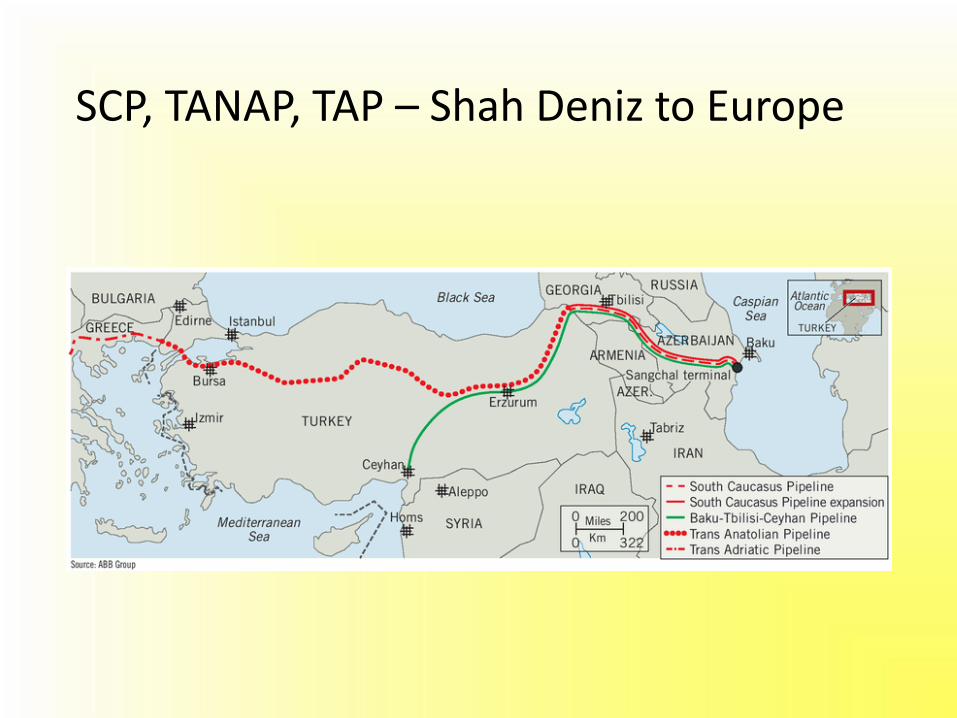
SCP, TANAP, TAP – Shah Deniz to Europe

Russian gas pipelines, Power of Siberia

Contact information
Chris Smith
Oil & Gas Journal
713.963.6211
To subscribe:
800 633 1656