OIL AND NATURAL GAS CORPORATION...
130
OIL AND NATURAL GAS CORPORATION LIMITED Environmental Impact Assessment Report for Installation of Dual Sub-sea Pipeline and Umbilical for Odalarevu Facility, East Godavari District, Andhra Pradesh EIA Report MAY 2013 Asian Consulting Engineers Private Limited, New Delhi
Transcript of OIL AND NATURAL GAS CORPORATION...

OIL AND NATURAL GAS CORPORATION LIMITED
Environmental Impact Assessment Report for Installation of Dual
Sub-sea Pipeline and Umbilical for Odalarevu Facility, East Godavari
District, Andhra Pradesh
EIA Report
MAY 2013
Asian Consulting Engineers Private Limited, New Delhi

EIA Report for installation of dual 14” sub-sea pipeline and umbilical for Odalarevu facility
Asian Consulting Engineers Pvt. Ltd. i
TABLE OF CONTENTS
EXECUTIVE SUMMARY
CHAPTER-1: INTRODUCTION
1.1 BACKGROUND …………………………………………………………………………………... 1-1
1.1.1 Project Benefits and Objectives …………………………………………………………. 1-3
1.1.2 Project Proponent ………………………………………………………………………... 1-3
1.1.3 EIA Consultant …………………………………………………………………………... 1-3
1.2 DESCRIPTION OF THE DUAL SUBSEA PIPELINES ……..…………………………………… 1-4
1.3 LEGAL AND OTHER REQUIREMENTS …………………..…………………………………… 1-4
1.4 SCOPE OF THE EIA STUDY ……………………………………………………….……………. 1-5
1.5 APPROACH & METHODOLOGY OF EIA STUDY …………………………………………….. 1-8
1.5.1 Approach of the EIA Study ……………………………………...………………………. 1-8
1.5.2 Establishment of Baseline Environmental Status …………………..……………………. 1-8
1.5.3 Field Study/Monitoring for Generation of Primary Data ………………………………... 1-8
1.5.4 Environmental Impact Assessment ……………………………………………………… 1-8
1.6 STRUCTURE OF THE REPORT …………………………………………………………………. 1-12
CHAPTER-2: PROJECT DESCRIPTION
2.1 KEY BLOCK INFORMATION …………………………………………………………………… 2-1
2.2 PROJECT OBJECTIVES ………………………………………………………………………...... 2-1
2.3 PIPELINE AND SUBSEA STRUCTURES …………………………….......................................... 2-1
2.3.1 Subsea Structures and their Arrangement ……………………………………………….. 2-3
2.4 DESIGN DETAILS OF VASHISHTA AND S-1 PRODUCTION PIPELINES ………………….. 2-4
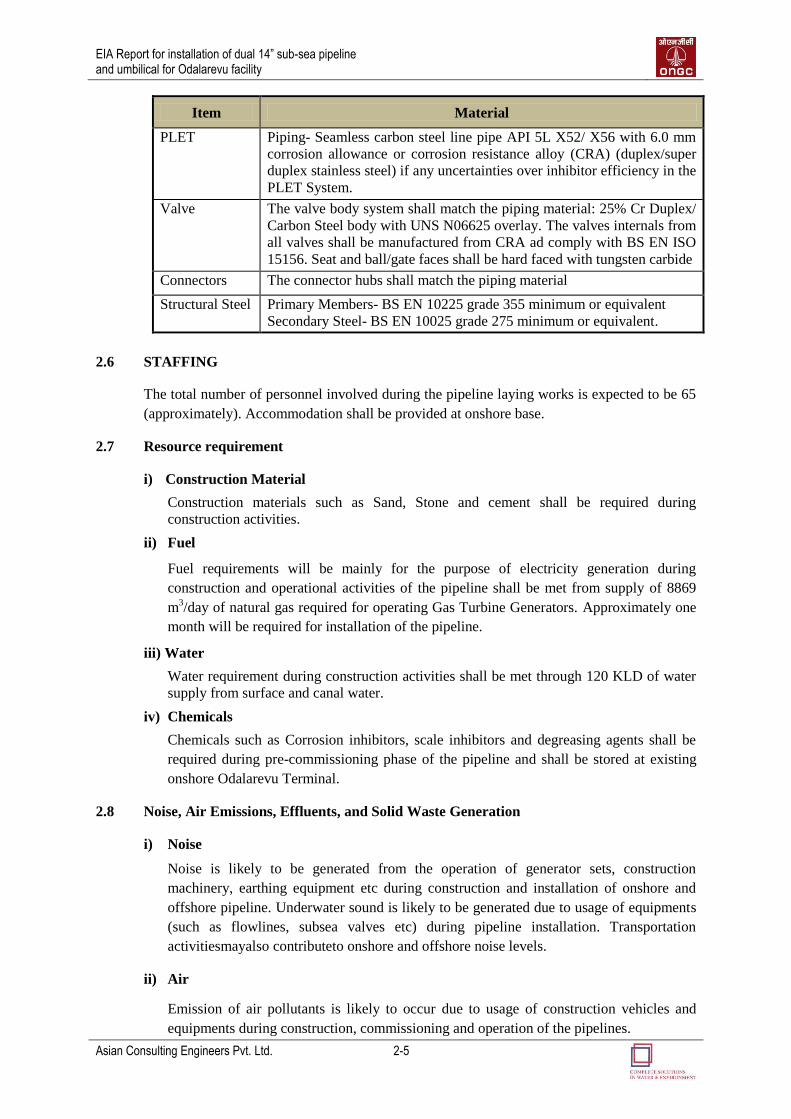
2.5 PIPELINE MATERIAL DETAILS ………………………………………………………………... 2-4
2.6 STAFFING ………………………………………………………………………………………… 2-5
2.7 RESOURCE REQUIREMENT ….…………………...…….………………………..……………. 2-5
2.8 NOISE, AIR EMISSIONS, EFFLUENTS, AND SOLID WASTE GENERATION ………........... 2-5
CHAPTER-3: DESCRIPTION OF THE ENVIRONMENT
3.1 INTRODUCTION …………………………………………..……………………………………... 3-1
3.2 STATE OF THE ENVIRONMENT ……….………………………………………………………. 3-3
3.2.1 Seismic Considerations…………………………………………………………………... 3-3
3.2.2 Climate and Meteorology ……….……………………………………………………..... 3-4
3.2.3 Micro-Meteorology ……………...………………………………………………………. 3-4
3.2.4 Bathymetry and Seabed Topography…………………………………………………….. 3-5
3.2.5 Waves and Tides.…………………………………………………………………….…... 3-6
3.2.6 Cyclones………….……………………………………………………………………..... 3-6
3.2.7 Circulation……….. …………………………………………………………………….... 3-7
3.2.8 Land Use………...……………………………………………………………………...... 3-8
3.3 MARINE ENVIRONMENT ………………………..…………………………............................... 3-9
3.3.1 Marine Water Quality ….………………………………………………………………… 3-9
3.3.1.1 Physico-chemical characteristic...………….………….………........................ 3-11
3.3.1.2 BOD and COD ………….………….………….………….………................... 3-11
3.3.1.3 Heavy Metals ……..….………….………….………….………….………...... 3-11
3.3.1.4 PAHs 3-12
3.3.2 Sediments Quality ……………………………………………………………………...... 3-12
3.3.2.1 Sediments quality monitoring results…..…….………….………..................... 3-13
3.3.3 Biological
Characteristics……………………………………………………………........ 3-14
3.3.3.1 Primary productivity and phytoplankton…….………….………..................... 3-15
3.3.3.2 Zooplankton… ………….………….………….………….………................... 3-20
3.3.3.3 Benthos……. ……..….………….………….………….………….………...... 3-23
3.3.3.4 Fisheries ……………………………………………………………………… 3-24
3.4 TERRESTRIAL ENVIRONMENT ……………………………………………………………...... 3-24
3.4.1 Soil Characteristics … ………………………………………………………………........ 3-24
EIA Report for installation of dual 14” sub-sea pipeline and umbilical for Odalarevu facility
Asian Consulting Engineers Pvt. Ltd. ii
3.4.2 Water Environment ……. ……………………………………………………………….. 3-29
3.4.3 Air Environment ……………………………………………………………………........ 3-35
3.4.4 Noise Environment…………………….. ………………………………………….......... 3-39
3.4.5 Biological Characteristics……….……………………………………………….............. 3-43
3.5 SOCIO-ECONOMIC ENVIRONMENT ………………………………………………………...... 3-46
3.5.1 Demography………………………...………………………………………………......... 3-48
3.5.2 Occupation ………………………………………………………………………………. 3-49
3.5.3 Livestock ………………………………………………………………………………… 3-54
3.5.4 Educational Facilities ……………………………………………………………………. 3-54
3.5.5 Health Care Facilities ……………………………………………………………………. 3-55
3.5.6 Drinking Water Facility …………………………………………………………………. 3-56
3.5.7 Communication Facility …………………………………………………………………. 3-56
3.5.8 Post, Telephone & Electricity Facilities …………………………………………………. 3-56
3.5.9 Architectural Monuments ………………………………………………………………... 3-57
3.5.10 Environmental Concern ………………………………………………………………….. 3-58
3.5.11 Man Animal Conflict ……………………………………………………………………. 3-58
CHAPTER-4: ANTICIPATED ENVIRONMENTAL IMPACTS & MITIGATION MEASURES
4.1 INTRODUCTION …………………………………………………….…….………….………….. 4-1
4.2 IMPACT PREDICTION …………………………….…….………….……………….……............ 4-2
4.2.1 Air Environment ….………….………….………….………….………….………........... 4-2
4.2.2 Impact on Noise Quality …….………….………….………….………….……..…......... 4-3
4.2.3 Impact on Water Quality ….………….………….………….……………..……..……… 4-3
4.2.4 Impact on Sediment and Soil Quality ……….………….……………..……..…….......... 4-4
4.2.5 Ecological Impacts ……………………….……………..……..……..……..……........... 4-4
4.2.6 Impact on CRZ ………………….………….………….……………..……..…………. 4-5
4.2.7 Socio-Economic Environment ...….………….………….……………..……..…………. 4-7
4.3 IMPACT EVALUATION …….………….………….………….………….…………..……..…… 4-8
4.4 IMPACT SIGNIFICANCE …….………….………….……………..….………………..…..…...... 4-9
4.5 IMPACT MITIGATION MEASURES …….………….………….……………..……………........ 4-10
4.5.1 Air Environment …………………………………………………………………………. 4-10
4.5.2 Water Environment ……………………………………………………………………… 4-10
4.5.3 Noise Quality ……………………..…….………………………………………………... 4-10
4.5.4 Subsea Infrastructure………………………………..………………………………...... 4-11
4.5.5 Impact on Ecological Environment …………………………………………………….. 4-11
4.5.6 Waste Generation and Management …………………………………………………….. 4-11
CHAPTER-5: ENVIRONMENTAL MONITORING PROGRAM
5.1 INTRODUCTION …………………………………………………….…….………….………….. 5-1
CHAPTER-6: ADDITIONAL STUDIES
6.1 INTRODUCTION ………………………………………………………..……………….……...... 6-1
6.2 SUBSEA PIPELINE AND ONSHORE PIPELINE ………………………..……………….…… 6-2
6.3 RISK ASSESSMENT …………………………………………..……………….…………………. 6-3
6.3.1 Hazards --Nature and sensitivity of impact zones ……………………………………….. 6-3
6.3.2 Failure Scenarios (Likely) ……….………….……………………………………............ 6-5
6.3.3 Sensitive Receptors and Impact ……….………….……………………………………... 6-11
6.3.4 Subsea Pipeline layout impacts…… ….…………………………………………………. 6-11
6.3.5 Onshore Pipeline Installation Impact Zone ……………………………………………... 6-11
6.3.6 Control Measures for Major Hazards …………..……….………….………………….. 6-11
6.3.7 Fire Fighting Facility …….………….………………………………………………...... 6-11
6.3.8 Occupational Health …….………….………………………………………………...... 6-12
6.4 DISASTER MANAGEMENT PLAN AND EERGENCY RESPONSE PLAN …………………... 6-13
6.4.1 Emergency Classification ………………………………………………………………... 6-14
6.5 EMERGENCY RESPONSE PLAN ……………………………………………………………...... 6-15
6.5.1 On Scene Coordinator ………………………………………………………………….... 6-16
6.5.2 Site Control Room ………………………………………………………………….......... 6-17

EIA Report for installation of dual 14” sub-sea pipeline and umbilical for Odalarevu facility
Asian Consulting Engineers Pvt. Ltd. iii
6.5.3 Communication ………………………………………………………………….............. 6-17
6.5.4 Communicating with Employees ………………………………………………………... 6-19
6.5.5 Communicating with Media ……………………………………………………………... 6-20
6.5.6 Warning System …………………………………………………………………………. 6-20
6.5.7 Emergency Procedures …………………………………………………………………... 6-20
6.5.8 Accident site cleanup ……………………………………………………………………. 6-21
6.5.9 Emergency response personal safety …………………………………………………….. 6-21
6.5.10 All Clear Signal and Public Statement …………………………………………………... 6-21
CHAPTER-7: PROJECT BENEFITS
7.1 PROJECT BENEFITS …………………………………………………………............................... 7-1
CHAPTER-8: ENVIRONMENTAL MANAGEMENT PLAN
8.1 PURPOSE AND OBJECTIVES OF THE EMP …………………………………………….…...... 8-1
8.2 WASTE MANAGEMENT PLAN …………………………………….………………………….. 8-5
8.3 CAPITAL AND RECURRING COST FOR POLLUTION CONTROL MEASURES ……........... 8-6
8.4 ENVIRONMENTAL AWARENESS TRAINING ………………………………………………... 8-7
CHAPTER-9: SUMMARY AND CONCLUSION
9.1 SUMMARY AND CONCLUSION ………………………………………………………….......... 9-1
CHAPTER 10: DISCLOSURE OF CONSULTANTS ENGAGED
10.1 INTRODUCTION …………………………………………………………………………………. 10-1
10.2 QUALITY OF SERVICES …………………………………….…………………………………... 10-1
10.3 AREA OF SPECIALIZATION …………………………………………………………….……… 10-1
10.4 RESOURCES …………………………………………………………………………….………... 10-2
ANNEXURE - I……………………………………………………………………………………………..……….
ANNEXURE - II…………………………………………………………………………………………….……….
ANNEXURE - III…………………………………………………………………………………………...……….
ANNEXURE - IV…………………………………………………………………………………………...………..
ANNEXURE - V…………………………………………………………………………………………….……….
ANNEXURE - VI…………………………………………………………………………………………...………..
ANNEXURE - VII……………………………………………………………………………………….....………..
ANNEXURE - VIII………………………………………………………………………………………………….
ANNEXURE - IX…………………………………………………………………………………………...………..
ANNEXURE - X…………………………………………………………………………………………….……….
ANNEXURE - XI…………………………………………………………………………………………...………..
ANNEXURE - XII…………………………………………………………………………………………..……….
ANNEXURE – XIII………………………………………………………………………………………...………..
ANNEXURE – XIV...………………………………………………………………………………………………..

EIA Report for installation of dual 14” sub-sea pipeline and umbilical for Odalarevu facility
Asian Consulting Engineers Pvt. Ltd. iv
LIST OF TABLES
Table No. Title Page No.
Table 1.1 Applicable Acts and Guidelines ………………………………………………........ 1-4
Table 1.2 TOR Compliance Status …………………………………………………………… 1-8
Table 3.1 Key Location Distances …………………………….……………………………… 3-2
Table 3.2 Major Earthquakes Recorded ……………………………………………………… 3-3
Table 3.3 Meteorological Data of Area of Proposed Onshore Pipeline ……………………… 3-4
Table 3.4 Historical records of severe Cyclones/Tsunami which formed in the Bay of
Bengal ……………………………………………………………………………… 3-7
Table 3.5 Land Use Distribution of the Onshore Pipeline Section ………………………….. 3-8
Table 3.6 Water Quality Monitoring Results……..…………………………………………... 3-10
Table 3.7 Depth of Sampling Locations………………………………………….…………... 3-12
Table 3.8 Sediments Quality Monitoring Results……………..……………………………... 3-13
Table 3.9 Concentration of Chlorophyll from 2002 to 2011…………………………………. 3-15
Table 3.10 Observed Values of Chlorophyll……….………..…………………......................... 3-27
Table 3.11 Identified phyto-planktons in Offshore Pipeline Section ……………….…………. 3-28
Table 3.12 Identified Zooplanktons in Offshore Pipeline Section …………………………...... 3-20
Table 3.13 Identified Benthos in Offshore Pipeline Section ……………………………......... 3-23
Table 3.14 Soil Quality Sampling Locations………..……………………….......................... 3-25
Table 3.15 Standards Soil Classification……………………………………………………… 3-26
Table 3.16 Analysis Results of Soil Sampling………………………………............................ 3-27
Table 3.17 Location of the Sampling Stations for Surface Water & Ground Water.................... 3-31
Table 3.18
(a) Surface Water Quality in the Study Area…………………………........................... 3-32
Table 3.18
(b) Ground Water Quality in the Study Area………….……………………….............. 3-32
Table 3.19 Summary of PM10 Levels Monitored in the Study Area………………………....... 3-37
Table 3.20 Summary of PM2.5 Levels Monitored in the Study Area.....………………………... 3-37
Table 3.21 Summary of SO2 Levels Monitored in the Study Area……….……………………. 3-38
Table 3.22 Summary of NOx Levels in the Study Area…………….………………………...... 3-38
Table 3.23 Summary of HC Levels in the Study Area…………………………………….…… 3-39
Table 3.24 Summary of VOC Levels in the Study Area……….………………………………. 3-39
Table 3.25 Locations of the Noise Monitoring Stations….………………….............................. 3-40
Table 3.26 Ambient Noise Quality Standards………………..………………………................ 3-42
Table 3.27 Summary of Ambient Noise Levels Monitored in the Study Area............................ 3-42
Table 3.28 Fauna Species Existing within the Surrounding Study Area…………………....... 3-45
Table 3.29 Mandals with the number of habitations under the Study Area................................. 3-46
Table 3.30 Revenue Villages and habitations under the Study Area........................................... 3-47
Table 3.31 Summary of Demographic Profile of Revenue Villages under the Study Area........ 3-49
Table 3.32 Area under Crops of the Study Area (Mandal-wise)................................................. 3-50
Table 3.33 Inland Fish Production of East Godavari.........……………...................................... 3-51
Table 3.34 Marine Fish Production of East Godavari District..................................................... 3-51
Table 3.35 Area under Fish & Prawn Culture…..………............................................................ 3-53
Table 3.36 Mandal-Wise Livestock and Poultry Population – 2007…………………………… 3-54
Table 3.37 Schools in Mandals………………………………………………………………… 3-54
Table 3.38 Medical Facilities in Mandals……………………………………………………… 3-55
Table 3.39 Drinking Water Facilities in Mandals…………………………………………….... 3-56
Table 3.40 Post Offices in Mandals……………………………………………………………. 3-57
Table 3.41 Telephone Connections in Mandals………………………………………………... 3-57
Table 3.42 Environmental Concerns………….………………………………………………... 3-58
Table 3.43 Man-Animal Conflict…………….………………………………………………... 3-58
Table 4.1 Identification of Potential Impacts: Activities – Impacts/Risks Interaction ……… 4-1
Table 4.2 Shoreline shift near Project Site from 1977 to 2009……………………………….. 4-6
Table 4.3 Impact Significance Criteria ……………………………………………………….. 4-9
Table 4.4 Potential Environmental Impacts of Proposed Project Activity (Without
Mitigation Measures) ……………………………………………………………… 4-10
Table 4.5 Potential Environmental Impacts of Proposed Project Activity (With Mitigation
Measures) ………………………………………………………………………….. 4-11
Table 5.1 Recommended Environmental Monitoring/Audit Protocol During site preparation
and Installation of Pipeline……………….............................................................. 5-1

EIA Report for installation of dual 14” sub-sea pipeline and umbilical for Odalarevu facility
Asian Consulting Engineers Pvt. Ltd. v
Table 6.1 Occupational Health Hazards and Mitigating Measures …………………………... 6-13
Table 8.1 Environmental Management Plan - Mitigation Management Matrix (onshore and
offshore pipeline installation and operation) …………………............................ 8-1
Table 8.2 Waste Management Plan …………………………………………………………... 8-6
LIST OF FIGURES
Figure No. Title Page No.
Figure 1.1 Project Location of Proposed Peipeline ……………................................................ 1-2
Figure 2.1 Pipeline Layout Map ………………………………..………………....................... 2-2
Figure 3.1 Location Map of Project Site …………………………………................................ 3-1
Figure 3.2 Layout Map of Pipeline Route …………………………………………………… 3-2
Figure 3.3 Seismic Zoning Map of India ………………………………………………........... 3-3
Figure 3.4 Sea Surface Temperature………………. …………………………………………. 3-4
Figure 3.5 Wind-Rose Diagram …………………………….................................................... 3-5
Figure 3.6 Bathymetry Map with proposed pipeline route………………………….............. 3-6
Figure 3.7 Wind and Cyclone Hazard Map – Andhra Pradesh.................................................. 3-7
Figure 3.8 Land Use and Land Cover of the Study Area ……………………………………... 3-8
Figure 3.9 Pipeline route with sampling locations.................................................................... 3-9
Figure 3.10 Sampling Locations of Phytoplanktons, Zooplanktons and Benthos …………….. 3-14
Figure 3.11 Concentration of chlorophyll in study area from 2002 to 2011 …………………… 3-16
Figure 3.12 Sampling Locations in the Study Area ……………………………………………. 3-25
Figure 3.13 Triangular Classification of Soil …..………………………………………………. 3-28
Figure 3.14 Water Sampling Locations ……………………………………..………………….. 3-31
Figure 3.15 Air Monitoring Location Map……………………………………………………... 3-35
Figure 3.16 Noise Sample Location Map……………………………………………………….. 3-40
Figure 3.17 Ambient Noise Levels Monitored in the Study Area (Day Time)............................ 3-42
Figure 3.18 Ambient Noise Levels Monitored in the Study Area (Night Time)......................... 3-43
Figure 3.19 Aerial distance between Odalarevu facility and Coringa National Park.......……… 3-44
Figure 3.20 Location of Villages in the Study Area..................................................................... 3-47
Figure 3.21 Fish Landing Centres in the study region.................................................................. 3-53
Figure 3.22 Aerial distance between Buddha Stupa and Odalarevu facility ...................……… 3-57
Figure 4.1 Stallite Images Showing the Shoreline of the Project Site in 1977-1989, 1989-
2000 and 2000-2009 ……………………………………………..……….............. 4-7
Figure 6.1 Layout of the Proposed Pipeline Route ……………………………….................... 6-1
Figure 6.2 Actions taken during Emergencies ………………………………………............... 6-15
Figure 6.3 Communication Flow Chart (First Information) …………………………............... 6-18
Figure 6.4 Offshore communication flow chart……………..………………………............... 6-19
LIST OF ACRONYMS AND ABBREVIATIONS
AAS Atomic Absorption Spectrometry
ACE Asian Consulting Engineers
BBL Barrels
BCM Billion Cubic Meter
BOD Biochemical Oxygen Demand
BWPD Barrel Water Per Day
CEC Chief Executive Coordinator
COD Chemical Oxygen Demand
CPCB Central Pollution Control Board
CSR Corporate Social Responsibility
DG Diesel Generators
DMP Disaster Management Plan
ECR Emergency Control Room
EQ Earthquake
ERP Emergency Response Plan
GDP Gross Domestic Product
HC Hydrocarbon
EIA Report for installation of dual 14” sub-sea pipeline and umbilical for Odalarevu facility
Asian Consulting Engineers Pvt. Ltd. vi
Hmax Maximum Wave Height
Hs Significant Wave Height
HSD High Speed Diesel
HSE Health, Safety and Environment
IS Indian Standard
KG Krishna-Godavari
KLD Kilo Litres Per Day
LFP Land Fall Point
MEQ Milliequivalent
MMSCM Million Standards Cubic Meter
MMSCMD Million Standards Cubic Meter Per Day
MODU Mobile Offshore Drilling Unit
MoEF Ministry of Environment and Forest
MPN Most Probable Number
NGL Natural Gas Liquid
NTU Nephelometric Turbidity Unit
OISD Oil Industry Safety Directorate
ONGC Oil and Natural Gas Corporation
OSC On-Scene Commander/Coordinate
PAH Poly Aromatic Hydrocarbon
PLEM Pipeline End Manifold
PLET Pipeline End Termination
PM Particulate Matter
PPM Parts Per Million
QRA Quantitative Risk Assessment
SCR Site Control Room
SITREPS Situation Reports
STEL Short Term Exposure Limit
TDS Total Dissolved Solids
TSS Total Suspended Solids
TUTU Terminal Umbilical Termination Unit
VOC Volatile Organic Compound

EIA Report for installation of dual 14” sub-sea pipeline and umbilical for Odalarevu facility
Asian Consulting Engineers Pvt. Ltd. 1-1
INTRODUCTION
1.1 BACKGROUND
The Krishna Godavari Basin is a proven petroliferous basin of continental margin located on
the east coast of India. The basin area covers an area of 15000 sq.km and the offshore part
covers an area of 25,000 sq.km up to 1000 m isobath. ONGC is currently involved with the
exploration in several deep sea fields off the East Coast of India in water depth from 250
meters and up to 3000 meters. Exploration of area to the east and south of G-1 filed in KG
offshore had resulted in discovery of hydro-carbons (natural gas) bearing sands in Vashishta
and S-1 prospects in the year 2005 and 2006 respectively.
Vashishta field is located at a distance of 35 km off Amalapuram Coast in water depth
ranging between 500-700m on the southern plunge of the rollover structure and located south
of G-1 field and comprises a vertically stacked channel system. The well VA-DA and VA-DB
have encountered the gas reservoir developed in Godavari clay of Pliocene age. The survey
shows different gas water contacts for VA-DA and VA-DB wells suggesting both the wells
are in different blocks.
S-1 field, located in Bay of Bengal at a water depth of approximately 250m - 600m, is 26
kilometers from onshore terminal and East of G-1 field.
Geological & Geophysical studies (G&G studies) were carried out and static/dynamic models
were generated. Based on the models, in-place hydrocarbon volumes have been estimated to
the tune of 23.29 BCM and production profiles generated. Based on these GIIP, the envisaged
cumulative gas production from both the fields at the end of nine years, works out to 15.8
BCM with a peak gas rate of 5.75 MMSCMD for a period of first five years and overall
recovery factor envisaged as around 68%.
As the development of these fields entails the entire spectrum of activities from drilling to
production and setting up of facilities, various options were analyzed by internationally
reputed integrated consultant (M/s Pegasus International) for each of the major components of
the facilities i.e. Drilling & Completion, Subsea System & Controls, Well Fluid Pipelines
(offshore & onshore) up to Onshore Terminal at Odalarevu and Onshore Terminal Facilities
and the development scheme was firmed up.
The salient features of the proposed development scheme are as under:
1. Expansion of onshore terminal at Odalarevu to handle VA and S-1 well fluids.
2. Drilling, re-entry and completion of 4 wells in Vashishta and S-1 fields.
3. Sub-sea tie back of these four wells to onshore terminal with 14 inch dual pipeline
through a daisy chain architecture.
Based on above development strategy EIA and RA studies were carried out in three volumes
(Vol-I, Vol-II & Vol-III). Present studies (Vol-III) are for installation for dual 14 inch sub-sea
pipelines, which are used to evacuate production fluids from VA and S-1 fields to proposed
onshore terminal at Odalarevu. The length of the pipeline (Onshore and Offshore section) is
approximately 45 km. Figure 1.1 shows the project location map.
1

EIA Report for installation of dual 14” sub-sea pipeline and umbilical for Odalarevu facility
Asian Consulting Engineers Pvt. Ltd. 1-2
Figure 1: Project Location and Proposed Pipeline
Based on the details of the CAPEX (accuracy +25%) indicated by the Integrated Consultant in
its report, the total capital cost of the project (including marine survey, consultancy, PMC,
TPI, service tax, etc.) for the integrated development of Vashishta and S-1 fields works out to
be USD 724.93 million (including the costs associated with the expansion of onshore terminal
at Odalarevu and offshore drilling works).
Based on the aggregated OPEX per annum estimated by Integrated Consultant, the operating
expenditure including service tax has been worked out to USD 18.03 million per annum.
Design of all facilities required for the Vashishta and S-1 development shall be carried out in
accordance with all recognised applicable international industry codes, standards &
guidelines, local regulations, safety and environmental stipulations.

EIA Report for installation of dual 14” sub-sea pipeline and umbilical for Odalarevu facility
Asian Consulting Engineers Pvt. Ltd. 1-3
1.1.1 Project Benefits and Objectives
As per International Energy Outlook 2010, the GDP of India will grow from 2918 Billion
USD in 2007 to 4847 Billion USD in 2015. To sustain the growth, the consumption of
petroleum products will also increase. As per the estimate by the same agency, the demand of
Natural Gas in India will increase from 116 MMSCMD in 2007 to 240 MMSCMD in 2015.
However, the current indigenous production of gas is 140 MMSCMD.
Petroleum, especially gas, being a swing fuel, any shortfall in production of other energy
resources like coal, hydro or nuclear power could increase the demand for petroleum
products.
In view of above, there will be a gap between domestic production of gas and actual
requirement of natural gas. To reduce this gap, production from some discovered oil/gas fields
and through additional development of existing fields are being contemplated. On this
backdrop, the present proposal for the integrated development of VA & S-1 fields is being
contemplated.
India is net importer of oil and is energy deficient country. As natural gas is relatively clean
fuel, so production of gas from VA & S-1 fields will reduce the dependence on imports to the
extent of such production.
The implementation of the project will also benefit the area around Odalarevu by way of
creation of attendant infrastructure facilities like roads, drainage, etc and also by providing
direct/indirect employment to the local population.
1.1.2 Project Proponent
Oil & Natural Gas Corporation Limited (ONGC), a premier Govt. of India Undertaking and
the major National Oil Company, is a vertically integrated company producing crude oil,
natural gas and value added products like LPG, NGL, Petrol, HSD etc. Operations of ONGC
extend over both onshore as well as offshore within India and outside India. ONGC has a
strong and experienced management and technical expertise and has already built a portfolio
of onshore, offshore and international assets (through ONGC Videsh Ltd.).
ONGC’s domestic production stands at 26.92 MMT of crude and 25.51 BCM of gas during
FY 2011-12 with an annual turnover of Rs. 76130 crore with a net profit of Rs. 25123 crore.
1.1.3 EIA Consultant
ONGC now proposes for development of Vashishta and S-1 field of KG Offshore and
Expansion of Odalarevu Onshore Terminal. In line with the industry’s best practices and the
regulatory obligations on environmental protection, ONGC has proposed to conduct
Environmental Impact Assessment (EIA) for the proposed project, for which it has engaged
Asian Consulting Engineers Private Limited to carry out Environmental Impact
Assessment (EIA) and Environmental Management Plan (EMP) studies.
This report pertains to the EIA study for Installation of Dual 14” Subsea Pipelines from
Vashishta and S-1 development to the new onshore gas processing facility at Odalarevu.
Asian Consulting Engineers Pvt. Ltd. (ACE) is QCI-NABET accredited EIA consulting
organization (Certificate No.: NABET/EI/1013/012) for varied sectors including offshore and
onshore oil and gas exploration, development, production & oil and gas transportation

EIA Report for installation of dual 14” sub-sea pipeline and umbilical for Odalarevu facility
Asian Consulting Engineers Pvt. Ltd. 1-4
pipelines. The Quality Management system of ACE is ISO 9001:2008 Certified. ACE has
provided its consulting services and has successfully completed projects in India and other
countries including Mongolia, U.A.E., Vietnam, etc. ACE has carried out EIA and EMP
studies for Oil & Gas, infrastructure and industrial developmental sectors; HSE compliance
audits; and has also been involved in design of water supply, wastewater management,
industrial waste treatment, solid wastes and hazardous wastes management systems.
1.2 DESCRIPTION OF THE DUAL SUBSEA PIPELINES
Sub-sea tieback to onshore Odalarevu Terminal has been proposed by installation of dual
pipelines (2x14” pipelines of approximately 45 km), designed to transport 10 MMSCMD of
gas with suitable infield sub-sea architecture including subsea umbilical. The current field
architecture provides suitable tie-in locations at both S-1 and Vashishta locations.
The pipeline has been split into two sections for determination of wall thickness: subsea
(355.6mm OD x 20.6mm WT) and landfall (365.2mm OD x 25.4mm WT). The landfall
section of pipe has higher integrity requirements and therefore higher wall thickness.
Maintaining a constant bore throughout the pipeline is preferable to allow for pigging. Hence,
pipe with non-standard outer diameter is selected for the landfall sections, with bore matched
to the subsea section.
1.3 LEGAL AND OTHER REQUIREMENTS
ONGC activities will conform to all National and International legislations, regulations,
conventions, etc., relating to aspects of hydrocarbon operations in India. The project shall
abide by the Oil Industry Safety Directorate (OISD) guidelines and standards.
Recognizing the need of environmental safety, operator has established an HSE Policy
towards environmental protection. A list of applicable Acts and Rules is described in Table
1.1.
Table 1.1: Applicable Acts and Guidelines
Issues Applicable Legislation
Hazardous
Substances &
Wastes
1) The Environment (Protection) Act, 1986 and Rules there under -
a) Hazardous Wastes (Management, Handling and Trans-boundary
Movement) Rules, 2008 and amendments thereafter;
b) Guidelines for disposal of solid wastes by Oil Drilling and Gas
Extraction industry as notified, vide notification dated GSR 546
(E) August2005;
c) Manufacture Storage and Import of Hazardous Chemicals 1989
and amendments thereafter.
2) The Public Liability Insurance Act, 1991 and Rules 1991
Water 3) The Water (Prevention and Control of Pollution) Act, 1974, and
amendments thereafter
4) The Environment Protection Act, 1986 - Standards for liquid
discharge by Oil Drilling and Gas Extraction industry as notified
vide notification dated GSR 176 (E) April 1996.
Air 5) The Air (Prevention and Control of Pollution) Act, 1981 and
amendments thereafter.
6) The Environment Protection Act, 1986 – Guidelines for discharge

EIA Report for installation of dual 14” sub-sea pipeline and umbilical for Odalarevu facility
Asian Consulting Engineers Pvt. Ltd. 1-5
Issues Applicable Legislation
for gaseous emissions by Oil Drilling and Gas Extraction industry
as notified vide notification dated GSR 176 (E) April 1996
7) The Environment (Protection) Second Amendment Rules, 2002 –
Emission Standards for New Generator Sets.
8) The Factories Act, 1948 and amendments thereafter.
Noise 9) The Environment (Protection) Second Amendment Rules, 2002
(Noise Limits for New Generator Sets).
10) The Noise (Regulation & Control) Rules, 2000.
Safety and
Protection
against Pollution
of Environment
11) Oil Mines Regulations, 1984.
12) Oil Field (Regulation and Development) Act 1948 and The
Petroleum & Natural Gas Rules, 1959 and amendments thereafter.
The EIA process has been undertaken to meet the requirements of Ministry of Environment
and Forests, Government of India.
1.4 SCOPE OF THE EIA STUDY
The scope of the EIA study includes detailed characterization of the existing status of the
water and biological environment within the block area, identification of the potential
environmental impacts of the project and formulation of an effective Environmental
Management Plan (EMP) to prevent, control & mitigate the adverse environmental impacts,
and ensuring environmental compliance. The terms of reference for this project were
approved by MOEF vide J-11011/591/2012-IA II (I) dated 4th June, 2012 as given below:
The Committee prescribed the following TORs for the preparation of EIA/EMP report:
1. Executive summary of the project.
2. Details of existing and proposed activities in tabulated form including drilling
wells/Pipeline subsea/Onshore Gas Terminal.
3. No. of development wells for which environmental clearance is accorded and No. of new
wells proposed during expansion. Status and No. of the wells which are completed and
closed.
4. Compliance to the conditions stipulated in environmental clearance accorded for existing
project along with point-wise compliance report.
5. Point-wise compliance reports to the ‘Consent to Establish’, ‘Consent to Operate’ and
‘Authorization’ for the existing units along with all the necessary annexure.
6. Project description for all the on-shore and off-shore activities proposed and Project
Benefits.
7. Site details including satellite imagery for 10 km area. Details of National Park/Wildlife
Sanctuary/ Eco-sensitive area/ Reserve forests.
8. Permission and recommendation for National Board of wildlife and Chief Wildlife
Warden regarding Coringa Forest should be included.
9. Forest Clearance in case the forest land is involved.
10. CRZ Clearance for subsea pipelines from offshore to onshore terminal.
11. Land-use along with maps and cropping pattern, vegetation ecology, Flora& Fauna.
12. Demography and Socio-economics of the area.

EIA Report for installation of dual 14” sub-sea pipeline and umbilical for Odalarevu facility
Asian Consulting Engineers Pvt. Ltd. 1-6
13. Design details of well head platform, PLQP, Offshore pipeline from PLQP to landfall
point (LFP), onshore pipeline for LFP to onshore gas terminal and Onshore Gas terminal
including process flow diagram.
14. Baseline data for land subsidence measurement should be incorporated.
15. Baseline data collection for air, water and soil for one season leaving the monsoon
season in an area of 10 km radius from onshore and offshore activity.
Action Plan to control ambient air quality as per NAAQES Standards notified by the
ministry on 16th September, 2009 at various locations.
Ambient air quality monitoring at 8 locations for PM10, SO2, NOX.
Background levels of hydrocarbons as HC (Methane and Non Methane) and VOC (5
Samples).
Soil Sample analysis at 10 locations.
Baseline underground and surface water quality in the vicinity of 10 km area.
Climatology & Meteorology including wind speed, wind direction, temperature,
rainfall etc.
Measurement of noise levels at 10 locations in the Block
16. Quantity and source of water supply. Permission for the drawl of water from the
competent authority. Detailed water balance, wastewater generation, treatment and
discharge. Details of treatment scheme for process effluent, utility wastewater, sewage
etc along with process flow diagram and characteristics of influent and effluent.
17. Treatment and utilization of produced water.
18. Detailed solid waste generation, collection, segregations, its recycling and reuse,
treatment and disposal
19. Estimation and computation of air emissions resulting out of offshore, OGT etc.
20. Assessment of impact on air, water, soil, solid/hazardous waste and noise levels.
21. Evaluation of the adequacy of the proposed pollution control measures to meet the air
quality emission standards, water discharge norms, solid/ hazardous waste generation
and disposal.
22. Estimation of noise level due to operation of drilling, process machine, its associated
equipments and vehicular movement & prediction and evaluation of impacts due to
increase in noise levels arising out of the proposed activities on the surrounding
environment. Proposed mitigation measures for noise pollution
23. Storage of chemicals at the site, proposed preventive measures for spillage and
accidents
24. Environmental Management Plan
25. Risk Assessment and Disaster Management Plan
Identification of Hazards
Consequence Analysis
Risk Presentation and proposed mitigation measures for risk reduction
Disaster Management Plan (DMP)
Oil Spill Contingency Plan and Emergency Response Plan
26. H2S emissions control plans.
27. Details of all environment and safety related documentation within the company in the
form of guidelines, manuals, monitoring programmes including Occupational Health
Surveillance Programme etc.

EIA Report for installation of dual 14” sub-sea pipeline and umbilical for Odalarevu facility
Asian Consulting Engineers Pvt. Ltd. 1-7
28. Restoration plans and measures to be taken for decommissioning of the rig and
restoration of on-shore support facilities on land. Measures for decommissioning of the
rigs and projects.
29. Post project closure and Monitoring Programme.
30. Documentary proof for membership of TSDS for disposal of Hazardous waste, if any.
31. Details of proposed occupational Health Surveillance program for the employees and
other labour.
32. Environmental Monitoring program while operation is undertaken.
33. Any issue related to land subsidence.
34. Total Capital and recurring cost/ annum for environmental pollution control measures.
35. Any litigation pending against the project or any directions/order passed by any Court of
Law against the project. If so, details thereof.
36. Public hearing issues raised and commitments made by the project proponent on the
same should be included separately in EIA/EMP Report in the form of Tabular Chart
with financial budget for complying with the commitments made.
The following general points should be noted:
(i) All documents should be properly indexed, page numbered.
(ii) Period/date of data collection should be clearly indicated.
(iii) Authenticated English translation of all material provided in Regional languages.
(iv) The letter/application for EC should quote the MOEF file No. and also attach a copy
of the letter.
(v) A copy of the letter received from the Ministry should be also attached as an
annexure to the final EIA-EMP Report.
(vi) The final EIA-EMP report submitted to the Ministry must incorporate the issues in
this letter. The index of the final EIA-EMP report must indicate the specific chapter
and page no. of the EIA-EMP Report where the above issues have been incorporated.
(vii) Certificate of Accreditation issued by the QCI to the environmental consultant should
be included.
The present scope of the EIA will describe various components of the environment of the
area(s) to be affected or created by the alternatives under consideration. The studies carried
out within 10 km study area of onshore pipeline and also along the proposed offshore pipeline
route. The onshore section studies include collection of soil, surface & ground water samples
and air & noise quality monitoring and stakeholder consultations at different places within 10
km study area.
The offshore section studies include samples of sea water, sediments, phytoplanktons,
zooplanktons and benthos collection along the proposed offshore pipeline route. Also, the
analysis of chlorophyll concentration at different sampling points of proposed pipeline route.
Based on the collection of baseline data and analyses in the EIA will be commensurate with
significance of the impact. The EIA will include discussions of direct effects and their
significance; indirect effects and their significance and conservation potential of alternatives
and mitigation measures. For each significant adverse impact, the studies will identify
proposed mitigation measures and suggest required management and monitoring plan.
1.5 APPROACH & METHODOLOGY OF EIA STUDY
1.5.1 Approach of the EIA Study

EIA Report for installation of dual 14” sub-sea pipeline and umbilical for Odalarevu facility
Asian Consulting Engineers Pvt. Ltd. 1-8
The EIA study basically includes establishment of the present environmental scenario within
the study area. EIA report consists of study of the specific activities related to the project and
evaluation of the probable environmental impacts, thus, leading to the recommendations of
necessary environmental pollution control measures. The entire EIA study has been carried
out on the basis of the applicable environmental legislation, regulations and guidelines of
MoEF.
1.5.2 Establishment of Baseline Environmental Status
A comprehensive database on the baseline environmental status/conditions of the study area has
been established through review, compilation & analysis of:
Existing published secondary data/ literature/ information collected, and
Primary data generated/ collected through field study, survey and monitoring.
1.5.3 Field Study/Monitoring for Generation of Primary Data
The collected secondary data has been appropriately supplemented by conducting the
necessary primary data generation/ collection through field study/monitoring. The field
monitoring has been carried out as per the guidelines of CPCB & BIS and requirement of the
MoEF.
Water Quality Monitoring: For drawing up the baseline data on water quality, water quality
monitoring has been conducted at representative locations in the study area. Water samples
have been collected and analyzed for important relevant physical and chemical parameters.
Ecological survey: Survey which will includes terrestrial flora and fauna and following
marine classes of organisms: Phytoplankton, Zooplankton, Macro benthos and Marine
mammals including fishes.
1.5.4 Environmental Impact Assessment
This will include collection of primary data through field investigations, environmental
monitoring and secondary data from sources like maps, reports, scientific literatures etc. The
collected data will be then analyzed for identification of impacts and to arrive at cost effective
mitigation measures. The environmental impact assessment has been conducted in accordance
with the norms and guidelines of the Govt. of India.
Table 1.2: TOR Compliance Status
S. No Terms of Reference Status
1. Executive Summary of the Project Prepared
2. Details of existing and proposed activities in
tabulated form including drilling wells/Pipeline
subsea/Onshore Gas Terminal.
Chapter 2, section 2.1
3. No. of development wells for which
environmental clearance is accorded and No. of
new wells proposed during expansion. Status and
No. of the wells which are completed and closed.
Covered in EIA report of
drilling and completion
operations (Vol-II); Chapter 2,
section 2.1.
4. Compliance to the conditions stipulated in
environmental clearance accorded for existing
project along with point-wise compliance report.
Environment Clearance for
existing G-1 and GS-15
facilities are attached as
Annexure-VII.

EIA Report for installation of dual 14” sub-sea pipeline and umbilical for Odalarevu facility
Asian Consulting Engineers Pvt. Ltd. 1-9
S. No Terms of Reference Status
5. Point-wise compliance reports to the ‘Consent to
Establish’, ‘Consent to Operate’ and
‘Authorization’ for the existing units along with
all the necessary annexures.
CFE, CFE extension and CFO
copies for existing G-1 and GS-
15 facilities are attached as
Annexure-VI (a), VI (b) and VI
(c) respectively.
6. Project description for all the on-shore and off-
shore activities proposed and Project Benefits.
Chapter 2, section 2.3; Chapter
7, section 7.1.
7. Site details including satellite imagery for 10 km
area. Details of National Park/Wildlife Sanctuary/
Eco-sensitive area/ Reserve forests.
Chapter 3, section 3.1. There are
no national park/wildlife
sanctuary/ eco-sensitive area/
reserve forests within 10 km
study area.
8. Permission and recommendation for National
Board of wildlife and Chief Wildlife Warden
regarding Coringa Forest should be included
Chapter 3, section 3.4.5. The
aerial distance between Coringa
Forest and Project Site is
approximately 51 km.
9. Forest Clearance in case the forest land is
involved.
Chapter 3, section 3.2.8. Copy
of proof of application for
diversion of forest land for
pipeline is attached as
Annexure-V.
10. CRZ Clearance for subsea pipelines from
offshore to onshore terminal.
Chapter 4, section 4.2.6
11. Land-use along with maps and cropping pattern,
vegetation ecology, Flora & Fauna.
Chapter 3, section 3.2.8; section
3.4.5.
12. Demography and Socio-economics of the area. Chapter 3, section 3.5
13. Design details of well head platform, PLQP,
Offshore pipeline from PLQP to landfall point
(LFP), Onshore pipeline for LFP to onshore gas
terminal and Onshore Gas terminal including
process flow diagram.
Chapter 2, section 2.3 and 2.4
14. Baseline data for land subsidence measurement
should be incorporated.
Covered in EIA report of
onshore terminal (Vol-I);
Chapter 3, section 3.3.7.
15. Baseline data collection for air, water and soil for
one season leaving the monsoon season in an area
of 10 km radius from onshore and offshore
activity.
Action Plan to control ambient air quality as
per NAAQES Standards notified by the ministry
on 16th September, 2009 at various locations.
Ambient air quality monitoring at 8
locations for PM10, SO2, NOx.
Background levels of hydrocarbons as HC
(Methane and Non Methane) and VOC (5
Chapter 3, section 3.2.2 &
section 3.2.3 and section 3.4.1,
3.4.2, 3.4.3, 3.4.4.

EIA Report for installation of dual 14” sub-sea pipeline and umbilical for Odalarevu facility
Asian Consulting Engineers Pvt. Ltd. 1-10
S. No Terms of Reference Status
Samples).
Soil Sample analysis at 10 locations.
Baseline underground and surface water
quality in the vicinity of 10 km area.
Climatology & Meteorology including wind
speed, wind direction, temperature, rainfall etc.
Measurement of noise levels at 10 locations
in the Block.
16. Quantity and source of water supply. Permission
for the drawl of water from the competent
authority. Detailed water balance, wastewater
generation, treatment and discharge. Details of
treatment scheme for process effluent, utility
wastewater, sewage etc. along with process flow
diagram and characteristics of influent and
effluent.
Chapter 2, section 2.8. Chapter
4, section 4.5.2.
17. Treatment and utilization of produced water. Covered in expansion of
onshore terminal (Vol-I);
Chapter 2, section 2.3.2; section
2.3.4.7; section 2.5.
18. Detailed solid waste generation, collection,
segregations, its recycling and reuse, treatment
and disposal
Chapter 2, section 2.8.
No hazardous solid waste is
envisaged to be generated.
Small quantity of used papers,
cartons, etc shall be generated
which will be disposed off
through proper recyclers.
19. Estimation and computation of air emissions
resulting out of offshore, OGT etc.
Chapter 4, section 4.2.1
20. Assessment of impact on air, water, soil,
solid/hazardous waste and noise levels.
Chapter 4, section 4.2.
21. Evaluation of the adequacy of the proposed
pollution control measures to meet the air quality
emission standards, water discharge norms, solid/
hazardous waste generation and disposal.
Chapter 4, section 4.5.
22. Estimation of noise level due to operation of
drilling, process machine, its associated
equipment and vehicular movement & prediction
and evaluation of impacts due to increase in noise
levels arising out of the proposed activities on the
surrounding environment. Proposed mitigation
measures for noise pollution.
Chapter 4. Section 4.2.2.
23. Storage of chemicals at the site, proposed
preventive measures for spillage and accidents.
Chapter 2, section 2.7; Chapter
8, section 8.1.
24. Environmental Management Plan Chapter 8

EIA Report for installation of dual 14” sub-sea pipeline and umbilical for Odalarevu facility
Asian Consulting Engineers Pvt. Ltd. 1-11
S. No Terms of Reference Status
25. Assessment and Disaster Management Plan
Identification of Hazards
Consequence Analysis
Risk Presentation and proposed mitigation
measures for risk reduction.
Disaster Management Plan (DMP)
Oil Spill Contingency Plan and Emergency
Response Plan
Chapter 6, section 6.3; section
6.4; section 6.5.
26. H2S emissions control plans. Covered in EIA report of
drilling and completion
operations (Vol-II); Chapter 6,
section 6.3.5.4.
27. Details of all environment and safety related
documentation within the company in the form of
guidelines, manuals, monitoring programmes
including Occupational Health Surveillance
Programme etc.
HSE guideline given in Chapter
8, section 8.4. ONGC policy for
periodic medical examination is
attached as Annexure-XI.
28. Restoration plans and measures to be taken for
decommissioning of the rig and restoration of on-
shore support facilities on land. Measures for
decommissioning of the rigs and projects.
Covered in EIA report of
drilling and completions
operations (Vol-II); Chapter 8,
section 8.5.
29. Post project closure and Monitoring Programme. Chapter 5, Section 5.1.
30. Documentary proof for membership of TSDS for
disposal of Hazardous waste, if any.
As no solid waste is being
generated in the Odalarevu
Plant, TSDF membership is not
required at this moment.
31. Details of proposed occupational Health
Surveillance program for the employees and other
labor.
Chapter 6, section 6.3.8.
32. Environmental Monitoring program while
operation is undertaken.
Chapter 5
33. Any issue related to land subsidence. Covered in EIA report of
onshore terminal (Vol-I);
Chapter 3, section 3.3.7.
34. Total Capital and recurring cost/ annum for
environmental pollution control measures.
Chapter 8. Section 8.3
35. Any litigation pending against the project or any
directions/order passed by any Court of Law
against the project. If so, details thereof.
No litigation or court case is
pending against this particular
proposal as on date. However,
there is a separate writ petition
filed by an NGO in the High
Court of Andhra Pradesh on the
problem of land subsidence and
other hazards due to large scale
exploitation in KG Basin.

EIA Report for installation of dual 14” sub-sea pipeline and umbilical for Odalarevu facility
Asian Consulting Engineers Pvt. Ltd. 1-12
S. No Terms of Reference Status
36. Public hearing issues raised and commitments
made by the project proponent on the same
should be included separately in EIA/EMP
Report in the form of Tabular Chart with
financial budget for complying with the
commitments made.
Public hearing report for
existing G-1 and GS-15
facilities at Odalarevu is
attached as Annexure–XII.
1.6 STRUCTURE OF THE REPORT
Chapter 1 : Introduction - Provides a background to the project, the project
proponent and environmental legislations /
permits applicable to the project; TOR for the
EIA study - provides the terms of reference for
the Environmental Impact Assessment study for
the proposed project.
Chapter 2 : Project Description - Describes the operations associated with the
project.
Chapter 3 Description of the
Environment
- Describes the background environmental
characteristics and the other economic activities
in the area.
Chapter 4 : Anticipated
Environmental
Impacts &
Mitigation Measures
- Identifies potential environmental impacts due to
the Proposed Project and applicable mitigation
measures.
Chapter 5 : Environmental
Monitoring
Programme
- Describes the mechanism to address the adverse
environmental impacts during different phases
of the project.
Chapter 6 : Additional Studies - This chapter includes Risk assessment and
Disaster Management Plan. Risk assessment
section will accentuate the types of risks
associated with exploratory drilling operations
and their assessment. Disaster management
section illustrates about the emergency
preparedness and disaster management plan.
Chapter 7 : Project Benefits - This chapter details the benefits associated with
the project to the local community as well as to
the nation.
Chapter 8 : Environment
Management Plan
- Provides delivery mechanism to address the
potential environmental impacts.

EIA Report for installation of dual 14” sub-sea pipeline and umbilical for Odalarevu facility
Asian Consulting Engineers Pvt. Ltd. 1-13
Chapter 9 : Summary &
Conclusion
- This chapter summarizes justification for
implementation of the project with mitigation
measures.
Chapter 10 : Disclosure of
Consultants engaged
- The name of the Consultants engaged with their
brief resume and nature of consultancy engaged.

EIA Report for installation of dual 14” sub-sea pipeline and umbilical for Odalarevu facility
Asian Consulting Engineers Pvt. Ltd. 2-1
PROJECT
DESCRIPTION
2.1 KEY PIPELINE INFORMATION
Name of the Project : Installation of dual 14” sub-sea pipeline and umbilical
for Odalarevu facility
Location : Odalarevu, Andhra Pradesh
Size of the project : Proposed sub-seapipeline length is approx 45 km.
Onshore section of pipeline is approx. 4km
Existing Pipeline Facility : Dual 10 inch sub-sea pipeline to evacuate production
fluid from G-1 and GS-15 fields to existing onshore
terminal.
Length: 25 km approx.
Proposed Pipeline Facility : Dual 14 inch sub-sea pipeline to evacuate production
fluid from Vashishta and S-1 Fields to Proposed
Onshore Terminal.
Length: 45 km approx.
Expected Cost of the Project : USD 354.57 million (INR 1666Crores @ Rs 47/$)
2.2 PROJECT OBJECTIVES
ONGC plans to develop Vashishta& S1 gas fields for which dual 14 inch subsea pipelines are
to be laid to evacuate production fluid from Vashishta and S-1 fields to proposed onshore
terminal at Odalarevu. A control umbilical also needs to be laid for injection of chemicals for
inhibition of hydrates, scale & corrosion in the pipelines and to exercise control over the
subsea production system.
2.3 PIPELINE AND SUBSEA STRUCTURES
The proposed project of Vashishta and S1 development comprises of four production wells:
VA-DA and VA-DB at the Vashishta field and S1-A and S1-B at the S1 development.
Production fluids shall be evacuated to the onshore processing facilities via dual14 inch
nominal bore (NB) production pipelines in a daisy chain arrangement between the onshore
terminal and the four wells. The dual pipeline shall tie-in to the new onshore terminal at the
South side and will be routed to the East at a location that will allow them to cross and run
parallel (on the Northward side) to the existing G1 and GS-15 pipelines and follow the
existing route to the landfall location. The pipeline layout map is shown in Figure 2.1.
2

EIA Report for installation of dual 14” sub-sea pipeline and umbilical for Odalarevu facility
Asian Consulting Engineers Pvt. Ltd. 2-2
Figure 2.1: Pipeline Layout Map
The approximate length of the pipeline between the VA-DA well (approx. 550 m depth) and
landfall is 38.7km. The onshore section of pipeline betweenlandfall and the terminal ESDVs
is approximately 4km. The pipelines shall extend between VA-DA and the VA-DB well
location, approximately 4.4km distant in 700m water depth. At the S1 field location, within
each of the dual pipelines, inline tees shall be installed to facilitate tie-in of the S1-A and S1-
B wells and to provide for potential future expansion of the S1 field.
The proposed pipeline has been split into two sections for determination of wall thickness:
subsea (355.6mm OD x 20.6mm WT) and landfall (365.2mm OD x 25.4mm WT). The
landfall section of pipe has higher integrity requirements and therefore higher wall thickness.
Constant bore has been maintained through the pipeline to allow pigging. Pipe with non-

EIA Report for installation of dual 14” sub-sea pipeline and umbilical for Odalarevu facility
Asian Consulting Engineers Pvt. Ltd. 2-3
standard outer diameter is selected for the landfall sections, with bore matched to the subsea
section.
2.3.1 Subsea Structures and their Arrangement
The major subsea equipment/facilities, other than the pipeline include: Subsea tees, On
tree flow meters (multiphase), Subsea Controls (comprising of Subsea Distribution Unit
(SDU’s), Umbilical Termination Assemblies (UTA’s),Onshore ENS, HDU, Master
Control System (MCS)/Electric Power Unit (EPU) and Topside Umbilical Termination
Unit (TUTU), Main and infield umbilical and Diver less connectors.
Inline tees shall be installed as part of the pipeline, at the S1-A and S1-B locations and
shall facilitate tie-in of the S1 wells. Spare inline tees between S1-A and S1-B wells will
be provided to allow future expansion.
At VA-DA location the main dual pipelines shall terminate with Pipeline End
Terminations (PLETs), 14 inch NB spools shall facilitate connection between the PLETs
on the main dual pipelines and PLETs on dual extension pipelines to the VA-DB location.
The PLETs at VA-DA shall also facilitate tie-in of the VA-DA well.
At VA-DB location the 14 inch dual extension pipelines shall terminate at PLETs, which
are connected by 14 inch tie-in spools to a Pipeline End Manifold (PLEM). The PLEM
will provide a means of round trip-pigging of the pipelines and allow for potential future
expansion of the pipeline system. Provision will be made in PLEM at VA-DB for adding
any future well in the area through an infield pipeline. The PLETs at VA-DB shall
facilitate tie-in of the VA-DB.
The tie-back distance between landfall and the VA-DA location is approximately 38.7km.
The tie-back distance between VA-DA and VA-DB is approximately 4.4km. There is also
an approximately 4km onshore section of pipeline between landfall and ESDVs.
All tees and PLEM shall allow for the production fluids from the associated well to be
diverted to either, or both of the dual pipelines. All infield jumper spools between PLETs,
PLEM, tees and wells shall be rigid 6 inch pipe, with the exception of the VA-DA spools
where 8 inch NB pipe shall be required. All connections shall be via vertical diverless
connectors.
Master control system (MCS), Hydraulic Power Units (HPU), Electrical Power Unit
(EPU) and Chemical Injection System shall be provided at the onshore terminal. These
components shall be connected to the subsea system via a static umbilical, approximately
33 km long, and terminated in an Umbilical Termination Distribution Assembly (UTDA)
at Vashishta well cluster.
A main umbilical shall be installed from the onshore terminal at Odalarevu to an SDU
located at the S1 field centre, approximately 28.3km. A further umbilical shallextend
from the S1 SDU to a second SDU located at the VA field centre,approximately 9.8km.
Infield umbilicals (each approximately 2.3km) shall connect the VA SDU to the VA-DA
and VA-DB Xmas trees. Hydraulic flying leads shall connect the VA-DA wellhead to the
VA-DA PLETs and VA-DB wellhead to the VA-DB PLETs, and from VA-DB to PLEM.
Infield umbilicals and flying leads for connection of the S1 wells aredetailed.
All subsea umbilical and flying lead connections shall be diverless make-up.

EIA Report for installation of dual 14” sub-sea pipeline and umbilical for Odalarevu facility
Asian Consulting Engineers Pvt. Ltd. 2-4
2.4 Design Detailsof Vashishta and S-1 Production pipelines
Vashishta and S-1shall be produced via 14 inch NB dual pipelines routed from VA- DA
to terminal.
Pipeline Design Conditions- The pipelines shall be designed according the following
parameters:
Parameter Vashishta/S-1
Water Depth Max (m) 689
Water Depth Min (m) 0
Pipeline Length (m) 42,700
Maximum Design Temperature ( C) 65
Minimum Design Temperature ( C) -75
Design Pressure (barg) 255
Pre-trenching; burial along with concrete weight coatingfor protection of pipeline shall be
done as follows:
- 2.5 metres burial for the onshore section.
- 2.5 metres burial and 60mm concrete coating up to 27 metres water depth. This will be
approximately up to two thirds of the way along the first leg of the pipeline.
- 1.0 metre burial and 60mm concrete coating up to 79 metres water depth. This shall be
just after the first deviation away from the G-1 pipelines.
- 30mm concrete coating up to 200 metres water depth.
- Three layer polypropylene (3LPP) coating and surfaced laid for the remainder of the
development.
The pipelines shall be protected from external corrosion by a combination of coatings and
cathodic protection via bracelet anodes, fitted along the length of the pipeline. A 3LPP is
the recommended anti-corrosion coating for the gas production pipeline.
The corrosion inhibitor selected shall achieve a minimum of 95% inhibitorefficiency for
the basic process condition of Vashishta and S1 produced fluids andcompatibility with
MEG injection shall be ensured.
Vashishta and S1 pipelines shall be designed to permit the use of pigs, with
dueconsideration to be taken of transitions in bore between the flowline, pipelines and
manifold piping. Any tees within the main production flowline system shall be piggable
with the inclusion of pigging bars and any bends shall have a minimum radius of 5D.
2.5 Pipeline Material Details
Item Material
Gas Production
Flowline
Linepipe- Seamless carbon steel line pipe API 5L X52/ X56 with 3.0
mm corrosion allowance.
Tie-in spools Linepipe/Bends- UNS S32760 or equivalent super dulex with 1.0 mm
corrosion allowance.
PLEM Piping System- Seamless carbon steel line pipe API 5L X52/ X56 with
6.0 mm corrosion allowance or corrosion resistance alloy (duplex/super
duplex stainless steel) if any uncertainties over inhibitor efficiency in the
PLEM System.
EIA Report for installation of dual 14” sub-sea pipeline and umbilical for Odalarevu facility
Asian Consulting Engineers Pvt. Ltd. 2-5
Item Material
PLET Piping- Seamless carbon steel line pipe API 5L X52/ X56 with 6.0 mm
corrosion allowance or corrosion resistance alloy (CRA) (duplex/super
duplex stainless steel) if any uncertainties over inhibitor efficiency in the
PLET System.
Valve The valve body system shall match the piping material: 25% Cr Duplex/
Carbon Steel body with UNS N06625 overlay. The valves internals from
all valves shall be manufactured from CRA ad comply with BS EN ISO
15156. Seat and ball/gate faces shall be hard faced with tungsten carbide
Connectors The connector hubs shall match the piping material
Structural Steel Primary Members- BS EN 10225 grade 355 minimum or equivalent
Secondary Steel- BS EN 10025 grade 275 minimum or equivalent.
2.6 STAFFING
The total number of personnel involved during the pipeline laying works is expected to be 65
(approximately). Accommodation shall be provided at onshore base.
2.7 Resource requirement
i) Construction Material
Construction materials such as Sand, Stone and cement shall be required during
construction activities.
ii) Fuel
Fuel requirements will be mainly for the purpose of electricity generation during
construction and operational activities of the pipeline shall be met from supply of 8869
m3/day of natural gas required for operating Gas Turbine Generators. Approximately one
month will be required for installation of the pipeline.
iii) Water
Water requirement during construction activities shall be met through 120 KLD of water
supply from surface and canal water.
iv) Chemicals
Chemicals such as Corrosion inhibitors, scale inhibitors and degreasing agents shall be
required during pre-commissioning phase of the pipeline and shall be stored at existing
onshore Odalarevu Terminal.
2.8 Noise, Air Emissions, Effluents, and Solid Waste Generation
i) Noise
Noise is likely to be generated from the operation of generator sets, construction
machinery, earthing equipment etc during construction and installation of onshore and
offshore pipeline. Underwater sound is likely to be generated due to usage of equipments
(such as flowlines, subsea valves etc) during pipeline installation. Transportation
activitiesmayalso contributeto onshore and offshore noise levels.
ii) Air
Emission of air pollutants is likely to occur due to usage of construction vehicles and
equipments during construction, commissioning and operation of the pipelines.

EIA Report for installation of dual 14” sub-sea pipeline and umbilical for Odalarevu facility
Asian Consulting Engineers Pvt. Ltd. 2-6
iii) Effluent and Solid Waste
Water generated from hydraulic testing of pipelines shall be reused for multiple tests.
In case of discharged into sea, discharge of water shall be ensured at a suitable
location to minimise adverse impacts.
Sewage- Sewage generated shall be treated in the Effluent Treatment Plant (ETP).
The treated effluent shall be reused for the purpose of irrigation within and around the
plant area.
Construction waste- Solid waste consisting of recyclable waste and non recyclable
generated from construction activities, shall be segregated in appropriated bins and
shall be disposed off to approved contractors for their final disposal.
Solid waste including domestic waste (from kitchen, gallery, laundries etc),
combustible and recyclable waste generated shall be collected, segregated and stored
in specified containers and shall be transferred to authorized contractors for its
disposal.
Hazardous wastes such as waste lube/system oil from machinery, used oil from D.G
set (in case of operation) are likely to be generated. The waste shall be handled as per
Hazardous Wastes (Management, Handling and Trans-boundary Movement) Rules,
2008. The waste will be carefully stored in drums and transported to MoEF approved
recyclers for its final disposal. All precautions will be taken to avoid spillage from the
storage.

EIA Report for installation of dual 14” sub-sea pipeline and umbilical for Odalarevu facility
Asian Consulting Engineers Pvt. Ltd. 3-1
DESCRIPTION OF THE
ENVIRONMENT
3.1 INTRODUCTION
This chapter presents an overview of the aspects of the environment related to the proposed
dual subsea pipeline route from Vashishta and S-1 field to proposed onshore terminal at
Odalarevu in East Godavari District of Andhra Pradesh (India). Knowledge of the
characteristics of the local biological environment allows an understanding of the potential for
the operations to interact with the flora and fauna so that appropriate controls can be adopted
to mitigate negative impacts. Figure 3.1 shows the location map of dual sub-sea pipelines
from Vashishta and S-1 fields to Odalarevu onshore facility.
Figure 3.1: Location Map of Proposed Project
The baseline description includes collection of primary and secondary data through field
investigations, environmental monitoring and secondary sources viz. maps, reports, scientific
literatures, etc. The obtained data has been analyzed for identification of impacts and arrive at
3
EIA Report for installation of dual 14” sub-sea pipeline and umbilical for Odalarevu facility
Asian Consulting Engineers Pvt. Ltd. 3-2
mitigation measures for minimizing any environmental impact due to the project activities.
The activities that are likely to be studied for each environmental component are described in
subsequent sections.
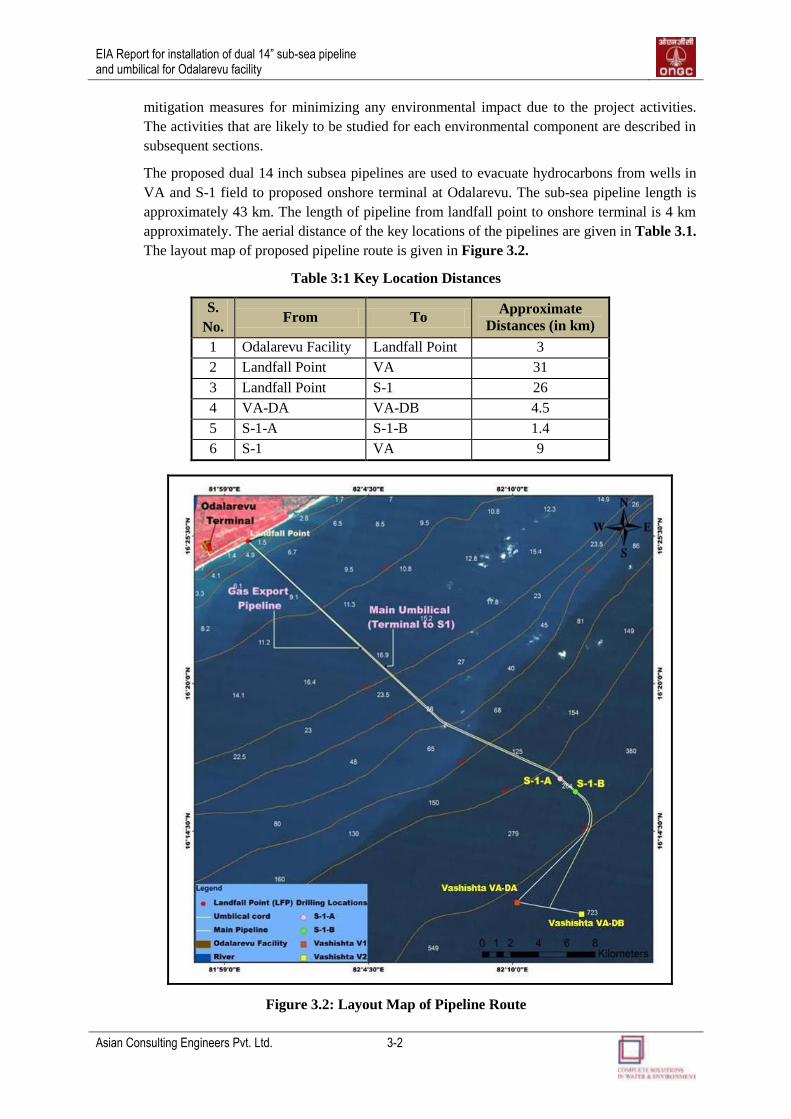
The proposed dual 14 inch subsea pipelines are used to evacuate hydrocarbons from wells in
VA and S-1 field to proposed onshore terminal at Odalarevu. The sub-sea pipeline length is
approximately 43 km. The length of pipeline from landfall point to onshore terminal is 4 km
approximately. The aerial distance of the key locations of the pipelines are given in Table 3.1.
The layout map of proposed pipeline route is given in Figure 3.2.
Table 3:1 Key Location Distances
S.
No. From To
Approximate
Distances (in km)
1 Odalarevu Facility Landfall Point 3
2 Landfall Point VA 31
3 Landfall Point S-1 26
4 VA-DA VA-DB 4.5
5 S-1-A S-1-B 1.4
6 S-1 VA 9
Figure 3.2: Layout Map of Pipeline Route

EIA Report for installation of dual 14” sub-sea pipeline and umbilical for Odalarevu facility
Asian Consulting Engineers Pvt. Ltd. 3-3
3.2 STATE OF THE ENVIRONMENT
The environmental status of the proposed project includes the studies of both onshore and
offshore section of environment (Terrestrial and Marine Environment) and has been studied
during the months of September, October and November 2012 and the details are given in the
following sub-sections:
3.2.1 Seismic Considerations
According to the Seismic-zoning Map of India [IS 1893: 2002], the state of Andhra Pradesh
lies in Zones II and III. The onshore section of pipeline falls in Zone III of the seismic zoning
map of India. The Seismic Zoning Map is shown in Figure 3.3.
Study of Historical records of the Earthquakes in Andhra Pradesh shows that it is a
continuous board of mild earthquakes. The major earthquakes that affected Andhra Pradesh in
the past are listed in Table 3.2 below.
Source: http://ndma.gov.in/ndma/disaster/earthquake/eq-india.pdf)
Figure 3.3: Seismic Zoning Map of India
Table 3.2: Major Earthquakes recorded
S.
No.
Name of the
Earthquake Magnitude Occurrence
1. Vizianagaram EQ 5.5 17 April, 1917
2. Ongole, Prakasam EQ 5.4 27 March, 1967
3. Bhadrachalam EQ 5.7 13 April, 1969
Source: http://disastermanagement.ap.gov.in/website/100yrs%20eq.htm

EIA Report for installation of dual 14” sub-sea pipeline and umbilical for Odalarevu facility
Asian Consulting Engineers Pvt. Ltd. 3-4
3.2.2 Climate and Meteorology
The climate is mainly governed by the presence of Bay of Bengal. The climate of the area is
hot and humid.
Presence of sea also plays a significant role resulting diurnal variation of climatic condition.
The landward sea breeze in the evening keeps the temperature at a pleasant range. The
meteorological data during the study period is given in Table 3.3. Sea surface temperature
along the Indian coastline is given in Figure 3.4.
Table 3.3: Meteorological Data of the Area of Proposed Onshore Pipeline
S.
No Month Year
Mean
Temperature
(°C)
Max.
Temperature
(°C)
Min.
Temperature
(°C)
Precipitation
(mm)
1 September 2012 29.06 38 25 0.40
2 October 2012 28.44 36 24 0.18
3 November 2012 26.64 34 21 0.92
Source: Amalapuram, worldweatheronline.com
Figure 3.4: Sea Surface Temperature
3.2.3 Micro-Meteorology
The meteorological data of Amalapuram town, which is approx. 10 km far from onshore
pipeline section is used for interpretation of the baseline information as well as input for air
quality simulation models. The hourly based meteorological data during the study period is
given in Annexure-I.
The wind rose diagram for the study area of onshore pipeline section is shown in Figure 3.5.
The analysis of the average wind pattern shows predominant winds blowing from SW to NE.
The calm wind (wind speed < 3.39 m/s) conditions prevailed for 3.80 % of the total time.

EIA Report for installation of dual 14” sub-sea pipeline and umbilical for Odalarevu facility
Asian Consulting Engineers Pvt. Ltd. 3-5
Figure 3.5: Wind rose Diagram
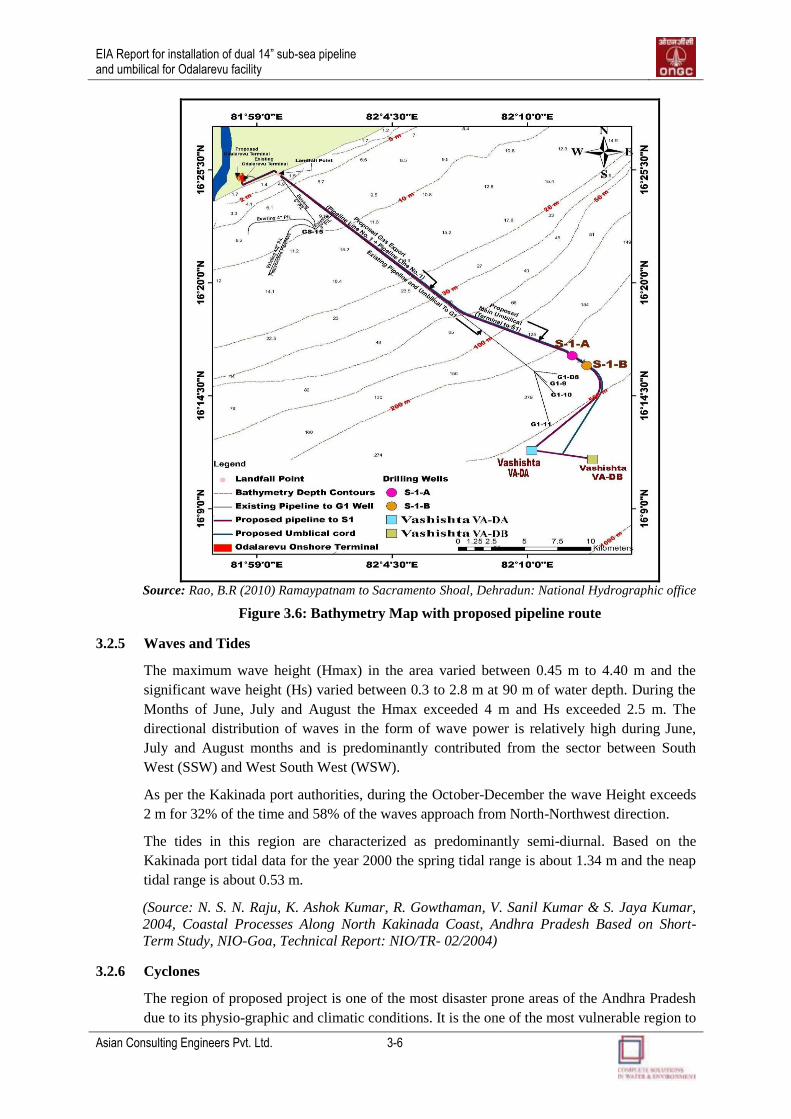
3.2.4 Bathymetry and Seabed Topography
The proposed dual sub-sea pipeline route off the river of Godavari-Vashistha having a
maximum bathymetry up to 700 m. Geologically, the area is characterized by major NE-SW
running fault. The northern boundary of the fault is same extension of Ponnamanda-
Adavipalem fault.
The pipeline route falls in the Bay of Bengal off the east coast of India in East Godavari
district of Andhra Pradesh State. The approximately length of pipelines between the VA-DA
is 38.7 km distant in approx. 550 m water depth. The pipeline shall extend between VA-DA
to VA-DB well location, approximately 4.4 km (approx. 700m water depth). The detailed
bathymetry of study area with the pipeline route is shown in Figure 3.6.
EIA Report for installation of dual 14” sub-sea pipeline and umbilical for Odalarevu facility
Asian Consulting Engineers Pvt. Ltd. 3-6
Source: Rao, B.R (2010) Ramaypatnam to Sacramento Shoal, Dehradun: National Hydrographic office
Figure 3.6: Bathymetry Map with proposed pipeline route
3.2.5 Waves and Tides
The maximum wave height (Hmax) in the area varied between 0.45 m to 4.40 m and the
significant wave height (Hs) varied between 0.3 to 2.8 m at 90 m of water depth. During the
Months of June, July and August the Hmax exceeded 4 m and Hs exceeded 2.5 m. The
directional distribution of waves in the form of wave power is relatively high during June,
July and August months and is predominantly contributed from the sector between South
West (SSW) and West South West (WSW).
As per the Kakinada port authorities, during the October-December the wave Height exceeds
2 m for 32% of the time and 58% of the waves approach from North-Northwest direction.
The tides in this region are characterized as predominantly semi-diurnal. Based on the
Kakinada port tidal data for the year 2000 the spring tidal range is about 1.34 m and the neap
tidal range is about 0.53 m.
(Source: N. S. N. Raju, K. Ashok Kumar, R. Gowthaman, V. Sanil Kumar & S. Jaya Kumar,
2004, Coastal Processes Along North Kakinada Coast, Andhra Pradesh Based on Short-
Term Study, NIO-Goa, Technical Report: NIO/TR- 02/2004)
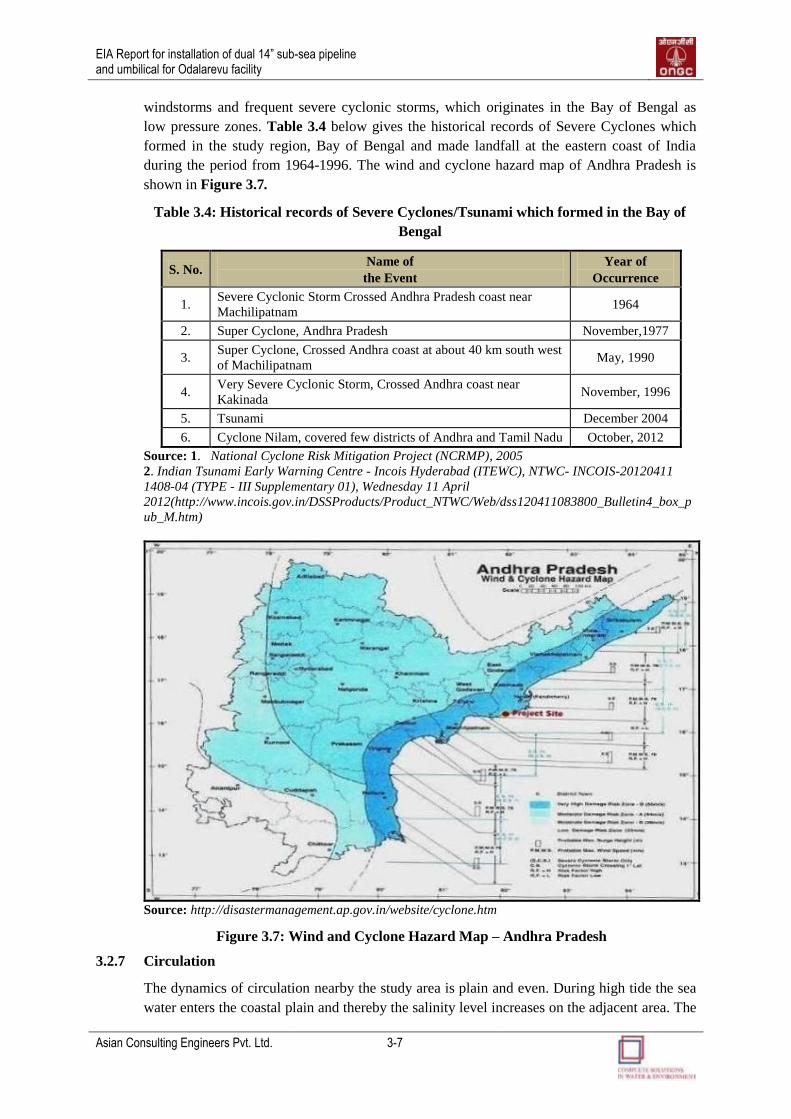
3.2.6 Cyclones
The region of proposed project is one of the most disaster prone areas of the Andhra Pradesh
due to its physio-graphic and climatic conditions. It is the one of the most vulnerable region to
EIA Report for installation of dual 14” sub-sea pipeline and umbilical for Odalarevu facility
Asian Consulting Engineers Pvt. Ltd. 3-7
windstorms and frequent severe cyclonic storms, which originates in the Bay of Bengal as
low pressure zones. Table 3.4 below gives the historical records of Severe Cyclones which
formed in the study region, Bay of Bengal and made landfall at the eastern coast of India
during the period from 1964-1996. The wind and cyclone hazard map of Andhra Pradesh is
shown in Figure 3.7.
Table 3.4: Historical records of Severe Cyclones/Tsunami which formed in the Bay of
Bengal
S. No. Name of
the Event
Year of
Occurrence
1. Severe Cyclonic Storm Crossed Andhra Pradesh coast near
Machilipatnam 1964
2. Super Cyclone, Andhra Pradesh November,1977
3. Super Cyclone, Crossed Andhra coast at about 40 km south west
of Machilipatnam May, 1990
4. Very Severe Cyclonic Storm, Crossed Andhra coast near
Kakinada November, 1996
5. Tsunami December 2004
6. Cyclone Nilam, covered few districts of Andhra and Tamil Nadu October, 2012
Source: 1. National Cyclone Risk Mitigation Project (NCRMP), 2005
2. Indian Tsunami Early Warning Centre Incois Hyderabad (ITEWC), NTWC- INCOIS-20120411
1408-04 (TYPE - III Supplementary 01), Wednesday 11 April
2012(http://www.incois.gov.in/DSSProducts/Product_NTWC/Web/dss120411083800_Bulletin4_box_p
ub_M.htm)
Source: http://disastermanagement.ap.gov.in/website/cyclone.htm
Figure 3.7: Wind and Cyclone Hazard Map – Andhra Pradesh
3.2.7 Circulation
The dynamics of circulation nearby the study area is plain and even. During high tide the sea
water enters the coastal plain and thereby the salinity level increases on the adjacent area. The

EIA Report for installation of dual 14” sub-sea pipeline and umbilical for Odalarevu facility
Asian Consulting Engineers Pvt. Ltd. 3-8
hinterland is protected with the recently laid tar road from the waves during monsoon. Some
tidal creeks are also present. Casurina plantations are present for certain stretch of this
coastline. During the spring at low tide time the bay is exposed, the continental shelf off the
bay area is dominantly silted till 1.8 m depth.
3.2.8 Land Use
The 10 km study area of proposed onshore pipeline section is dominated by agricultural fields
and plantation. The proposed pipeline (Onshore Section) passes through forest area in
Odalarevu for a stretch of only 245m, on the south western fringe. ONGC has applied to the
state forest department for diversion of 0.44 hectares of forest land for laying of pipeline.
Copy of application is given in Annexure V.
The land use within the study area of proposed pipeline route (onshore section) have been
studied and it can be broadly classified into seven major categories viz., plantation, mangrove,
water, agriculture, aquaculture, fallow land and built up using IRS LISS III satellite image .
The land use distribution in the study area is as follows in Table 3.5 and Figure 3.8.
Table 3.5: Land Use Distribution of the Onshore Pipeline Section
S. No. Land Use Area (sq km) Percentage
1 Plantation 59.68 31.11
2 Mangrove 1.03 0.54
3 Water 13.61 7.09
4 Agriculture 52.93 27.59
5 Aquaculture 56.65 29.53
6 Built Up 3.36 1.75
7 Fallow Land 4.57 2.38
Total 191.81 100
Figure 3.8: Land Use Land Cover of the Onshore Pipeline Section

EIA Report for installation of dual 14” sub-sea pipeline and umbilical for Odalarevu facility
Asian Consulting Engineers Pvt. Ltd. 3-9
3.3 MARINE ENVIRONMENT
Sea Water and Sediments quality sampling was carried out to study the water and sediment
quality at proposed sub-sea pipeline route, which are shown in Figure 3.9.
Figure 3.9: Pipeline route with sampling locations
3.3.1 Marine water quality
The area of the pipeline is largely oceanic and therefore not expected to undergo significant
changes in water quality, temporally as well as spatially. The sampling points at offshore
pipeline route as surveyed by ACE are considered to represent the baseline for the offshore
section. The sea water quality data is given in Table 3.6. Photo Plate 3.1 shows the water and
sediments collection along the proposed pipeline route.
Photo Plate 3.1: Sea water collection at different points of proposed pipeline route

EIA Report for installation of dual 14” sub-sea pipeline and umbilical for Odalarevu facility
Asian Consulting Engineers Pvt. Ltd. 3-10
Table 3.6: Sea Water Quality Monitoring Results
S.
No. Parameter Unit
Sampling Points Minimum
Detection
Limit
Instrument
Used
Methods
for
Analysis SWS
-1
SWS
-2
SWS
-3
SWS
-4
SWS
-5
SWS
-6
SWS
-7
SWS
-8
SWS
-9
SWS
-10
SWS
-11
SWS
-12
SWS
-13
1. Turbidity NTU <2.0 <2.0 <2.0 <2.0 <2.0 <2.0 <2.0 <2.0 <2.0 <2.0 <2.0 <2.0 <2.0 2.0 Turbidity Meter IS:3025
(P-47)
2. pH - 7.8 7.36 7.81 7.92 7.81 7.66 7.86 7.24 7.9 7.16 7.69 6.83 7.86 - pH meter IS:3025
(P-49)
3.
Total
Hardness
(as CaCO3)
mg/l 5852 6297 6489 5935 6421 6515 6119 6672 5978 6316 6076 5921 5883 1.0 Titration apparatus IS:3025
(P-52)
4. Iron (as Fe) mg/l 0.30 0.21 0.19 0.21 0.20 0.19 2.56 0.18 0.24 0.23 0.25 0.19 0.22 0.1 AAS IS:3025
(P-55)
5. Chloride
(as CI) mg/l 16596 17794 18396 19796 9547 13195 11196 11396 14994 16194 10596 11646 12396 1.0
Titration
apparatus
IS:3025
(P-23)
6. Fluoride (as
F-) mg/l 2.74 2.01 2.16 2.14 2.59 2.71 2.56 2.89 1.76 2 2.74 2.68 2.38 0.6 Spectrophotometer
IS:3025
(P-54)
7. Copper (as
Cu) mg/l <0.05 <0.05 <0.05 <0.05 <0.05 <0.05 <0.05 <0.05 <0.05 <0.05 <0.05 <0.05 <0.05 0.05 AAS
IS:3025
(P-41)
8. Lead (as Pb) mg/l <0.05 <0.05 <0.05 <0.05 <0.05 <0.05 <0.05 <0.05 <0.05 <0.05 <0.05 <0.05 <0.05 0.05 AAS IS:3025
(P-58)
9. Zinc (as Zn) mg/l <0.5 <0.5 <0.5 <0.5 <0.5 <0.5 <0.5 <0.5 <0.5 <0.5 <0.5 <0.5 <0.5 0.5 AAS IS:3025
(P-44)
10.
Chromium
Total
(asCr+6)
mg/l <0.05 <0.05 <0.05 <0.05 <0.05 <0.05 <0.05 <0.05 <0.05 <0.05 <0.05 <0.05 <0.05 0.05 AAS IS:3025
(P-39)
11. Aluminium
(as Al) mg/l <0.03 <0.03 <0.03 <0.03 <0.03 <0.03 <0.03 <0.03 <0.03 <0.03 <0.03 <0.03 <0.03 0.03 AAS
APHA -
2520 B
12. Alkalinity(as
CaCO3) mg/l 315 375 281 351 389 392 373 384 379 311 361 377 383 1.0 Titration apparatus
IS:3025
(P-48)
13. Nickel (as
Ni) mg/l <1.0 <1.0 <1.0 <1.0 <1.0 <1.0 <1.0 <1.0 <1.0 <1.0 <1.0 <1.0 <1.0 1.0 AAS
APHA -
6440 B
14. Cadmium
(as Cd) mg/l <0.01 <0.01 <0.01 <0.01 <0.01 <0.01 <0.01 <0.01 <0.01 <0.01 <0.01 <0.01 <0.01 0.01 AAS
IS:3025
(P-47)
15. COD (as 02) mg/l 12.5 11.8 10.7 13.5 9.1 10.7 13.3 11.5 13.2 11.9 13.2 12.5 9.9 0.2 Titration apparatus IS:3025
(P-49)
16.
BOD (3
days at 27
deg. C)
mg/l 6.2 5.2 4.9 5.2 5.2 4.9 5 5.3 4.6 4.1 3.7 4.8 4.6 0.2
Titration
apparatus,
BOD incubator
IS:3025
(P-52)
17. Oil &Grease mg/l <4.0 <4.0 <4.0 <4.0 <4.0 <4.0 <4.0 <4.0 <4.0 <4.0 <4.0 <4.0 <4.0 4.0 Gravimetry IS:3025

EIA Report for installation of dual 14” sub-sea pipeline and umbilical for Odalarevu facility
Asian Consulting Engineers Pvt. Ltd. 3-11
S.
No. Parameter Unit
Sampling Points Minimum
Detection
Limit
Instrument
Used
Methods
for
Analysis SWS
-1
SWS
-2
SWS
-3
SWS
-4
SWS
-5
SWS
-6
SWS
-7
SWS
-8
SWS
-9
SWS
-10
SWS
-11
SWS
-12
SWS
-13
(P-55)
18. Salinity mg/l 36530 36518 36390 36250 37160 36460 36670 37440 39510 37860 37650 37930 35890 - Salinometre IS:3025
(P-23)
19. Mercury (as
Hg) mg/l <0.001 <0.001 <0.001 <0.001 <0.001 <0.001 <0.001 <0.001 <0.001 <0.001 <0.001 <0.001 <0.001 0.001 AAS
IS:3025
(P-54)
20. PAH mg/l <0.1 <0.1 <0.1 <0.1 <0.1 <0.1 <0.1 <0.1 <0.1 <0.1 <0.1 <0.1 <0.1 0.1 Gas
Chromatography
IS:3025
(P-41)
3.3.1.1 Physico-chemical characteristic
The observed pH value in the along the proposed offshore pipeline route during the period of study is in the range of 6.83 to 7.92. The changes in pH are
marginal as expected for natural marine waters sustaining low primary productivity. The total hardness of water in all the sample is in the range of 5852 to
6672 mg/L. The turbidity of water were below detectable limit in all the samples. The observed salinity in the range of 35890 to 39510 mg/L. The observed
values showed that all the sampling locations revealed narrow variation in the level of salinity content. The value of alkalinity (as CaCO3) was in the range
of 281 to 392 mg/l.
The concentrations of Chloride and Fluoride in all the sample were in the range of 9547 to 19796 mg/L and 1.76 to 2.89 mg/L respectively. The contents of
oil & grease in all sample was below the detectable limit in all the sampling locations.
3.3.1.2 BOD and COD
The BOD and COD were in the range of were in the range of 3.7 to 6.2 and 9.1to 13.3 mg/L.
3.3.1.3 Heavy Metals
Heavy metals namely mercury, chromium, lead, cadmium, aluminum, copper and chromium were below the detectable range in all the
sampling locations. The concentration of iron was detectable in all the sampling locations, which was in the range of 0.18 to 2.56 mg/L.

EIA Report for installation of dual 14” sub-sea pipeline and umbilical for Odalarevu facility
Asian Consulting Engineers Pvt. Ltd. 3-12
3.3.1.4 PAHs
Poly Aromatic Hydrocarbons (PAHs) namely, acenaphthylene, bromo-naphthalene,
acenaphthene, fluorene, pyrene, benzo(a)pyrene, dibenzo(a,h)anthracene and indeno (1,2,3)
pyrene were found to be below detectable range in the water collected from all the sampled
locations.
3.3.2 Sediments Quality
Sediment Sample were collected using van-veen grab sampler. The grab is lowered vertically
from the stationary boat till it touches the bottom. Sediment sample were collected and
preserved for sediment texture analysis and physico-chemical analysis. Photo Plate 3.2
shows the collection of sediment at different locations of pipeline route. Table 3.7 shows the
depth of sampling locations. Sediments Quality Monitoring Results is given in Table 3.8.
Photo Plate 3.2: Sediments sample collections at different sampling locations
Table 3.7: Depth of Sampling Locations
S.No. Sampling Locations Depth (in meters)
1 SSS-1 9.9
2 SSS-2 8.5
3 SSS-3 11
4 SSS-4 19
5 SSS-5 29.5
6 SSS-6 49
7 SSS-7 99
8 SSS-8 175
9 SSS-9 205
10 SSS-10 243

EIA Report for installation of dual 14” sub-sea pipeline and umbilical for Odalarevu facility
Asian Consulting Engineers Pvt. Ltd. 3-13
Table 3.8: Sediments Quality Monitoring Results
S.No. Parameter Unit SSS-1 SSS-2 SSS-3 SSS-4 SSS-5 SSS-6 SSS-7 SSS-8 SSS-9 SSS-10 Test Method
1 pH - 8.10 8.12 8.08 7.76 7.24 7.86 7.28 7.18 7.24 7.31 IS-2720 (Part 26)
2 EC µS/cm 1121 1075 989 653 547 672 608 515 535 621 IS-2720 (Part 21)
3 Phosphorous (as P) mg/100gm 6.64 8.29 6.46 6.67 6.08 7.43 7.30 7.11 7.34 7.83 Lab SOP-SOIL-S/41
4 Total Khejdal Nitrogen % by Mass 0.67 0.1 0.84 0.74 0.68 0.66 0.74 0.92 0.81 0.76 Lab SOP-SOIL-S/36
5 Potassium (as K) mg/100gm 4.1 6.1 4.2 3.8 4.6 4.9 4.51 4.62 4.18 5.72 Lab SOP-SOIL-S/38
6 Texture
Sand %by Mass 14 74 13 12 44 27 35 41 38 48 TM-S/32
Clay %by Mass 10 16 11.2 11 29 43 47 24 19 14 TM-S/32
Silt %by Mass 76 10 75.8 77 27 30 18 35 43 38 TM-S/32
7 Particle Size (<0.002mm) % by Weight 10 16 11.2 11 29 43 47 24 19 14 TM-S/49
8 Particle Size (2.0-0.05) mm % by Weight 14 74 13 12 44 27 35 41 38 48 TM-S/49
9 Particle Size (0.005-0.002 mm) % by Weight 76 10 75.8 77 27 30 18 35 43 38 TM-S/49
10 Iron (as Fe) mg/Kg 10.4 11.7 8.5 7.6 12.7 8.3 11.44 9.35 8.36 12.87 USEPA-SW-846
11 Zinc (as Zn) mg/Kg 8.48 7.6 6.8 5.9 8.1 8 9.33 7.48 6.49 8.36 USEPA-SW-846
12 Lead (as Pb) mg/Kg <10.0 <10.0 <10.0 <10.0 <10.0 <10.0 <10.0 <10.0 <10.0 <10.0 USEPA-SW-846
13 Nickel (as Ni) mg/Kg <1.0 <1.0 <1.0 <1.0 <1.0 <1.0 <1.0 <1.0 <1.0 <1.0 USEPA-SW-846
14 Chromium Total (as Cr) mg/Kg <0.1 <0.1 <0.1 <0.1 <0.1 <0.1 <0.1 <0.1 <0.1 <0.1 USEPA-SW-846
15 Cadmium (as Cd) mg/Kg <0.1 <0.1 <0.1 <0.1 <0.1 <0.1 <0.1 <0.1 <0.1 <0.1 USEPA-SW-846
16 Aluminum (as Al) mg/Kg <0.1 <0.1 <0.1 <0.1 <0.1 <0.1 <0.1 <0.1 <0.1 <0.1 TM-S/25
3.3.2.1 Sediments quality monitoring results
The sediments are loam in nature along the sampling locations, which is evident from textural analysis.
The value of pH is in the range of 7.18 to 8.12.
The value of EC is in the range of 515 to 1121 µS/cm.
The content of total phosphorous and potassium were in the range of 6.08 to 8.29 and 3.8 to 6.1 mg/100g respectively.

EIA Report for installation of dual 14” sub-sea pipeline and umbilical for Odalarevu facility
Asian Consulting Engineers Pvt. Ltd. 3-14
The concentration of total khejdal nitrogen was in the range of 0.1 to 0.92 %.
The concentrations of heavy metals namely, Cadmium, Chromium, lead, Nickel and
Aluminum is found to be below detectable limit in all sampling locations. The content of
Iron and Zinc were in the range of 7.6 to 12.87 and 5.9 to 9.33 mg/Kg of soil respectively.
3.3.3 Biological Characteristics
The occurrence of marine species - both plants and animals has largely been controlled by the
physico-chemical properties of ocean water. Water discharges from the surrounding river
catchments carry huge influx of sediments full of nutrients to the Bay, particularly along the
near shore region. This has turned the Bay into a fertile marine fishing ground of the region.
The near-shore up-welling zone not only has a high yield of nutrients, but also is a high
primary production area for the phytoplankton and related zooplankton zones. The Bay of
Bengal, harbour a variety of ecosystems and habitats, such as estuaries; intertidal foreshore-
rocky, sandy and muddy areas; coastal lagoons and backwaters; coral reefs and patchy corals;
seagrass beds; continental and deltic islands; neritic and oceanic regions extending through
bathyal, abyssal and hadal depths.
In view of wide variations in biological production in a marine ecosystem, the biological
parameters considered for the present evaluation are phytoplankton (pigments, population and
dominant genera), zooplankton (biomass, population and faunal groups), macro benthos
(biomass, population and faunal groups), status of mangroves, seaweeds and sea grasses,
corals, fishery, marine reptiles, mammals and birds. Figure 3.10 shows the sampling
locations of phytoplanktons, zooplanktons and benthos along the proposed offshore pipeline
route.
Figure 3.10: Sampling Locations of Phytoplanktons, Zooplanktons and Benthos

EIA Report for installation of dual 14” sub-sea pipeline and umbilical for Odalarevu facility
Asian Consulting Engineers Pvt. Ltd. 3-15
3.3.3.1 Primary productivity and phytoplankton
Primary productivity, which involves conversion of inorganic materials into living biomass, is the foundation block of all the processes in the biosphere. The
eastern part of the Bay of Bengal including the area of sub-sea pipeline route is one of the high productive zones. Table 3.9 presents a annual average of
chlorophyll concentration in the surface layer of the offshore pipeline route from 2002 to 2010, which are also shown in Figure 3.11.
Table 3.9: Concentration of Chlorophyll (mg/m3) in Offshore Pipeline Section from 2002 to 2011
Sampling Locations
Chlorophyll Content (mg/m3)
Year
2002
Year
2003
Year
2004
Year
2005
Year
2006
Year
2007
Year
2008
Year
2009
Year
2010
Year
2011
1 3.80438 4.38197 2.82293 3.35177 4.13524 4.11238 3.89812 3.34586 4.05393 3.91478
2 3.00267 3.79827 2.33132 2.67459 3.40499 3.55239 3.19306 2.56419 3.48609 3.44298
3 2.47991 3.05362 1.54919 2.13829 2.81668 3.33558 2.40975 1.78892 2.65707 2.57136
4 1.7513 2.5381 1.23481 1.63834 2.44364 2.82044 1.98888 1.49944 2.78956 1.96244
5 0.87348 1.59369 0.75903 0.86664 1.39436 1.648 0.96432 0.96672 2.78956 0.87359
6 1.06773 1.70081 0.75903 0.71914 1.22831 1.19235 0.91618 0.83694 2.21391 0.63338
7 1.06773 1.70081 0.57379 0.71914 1.22831 1.14244 0.66235 0.74238 1.86564 0.4983
8 0.62903 1.0051 0.4824 0.81078 1.08204 0.96155 0.66235 0.73523 1.52538 0.49602
9 0.62903 1.0051 0.4307 0.76126 0.94488 0.96155 0.52488 0.73523 1.25563 0.49602
10 0.62903 1.0051 0.4307 0.76126 0.94488 0.96155 0.52488 0.73523 1.25563 0.49602
11 0.5349 0.79367 0.41101 0.74946 0.78533 0.89634 0.5124 0.53436 1.02939 0.48481
12 0.42625 0.67373 0.41341 0.56405 1.11567 0.46462 0.40802 0.43787 0.6448 0.36166
13 0.38926 0.64206 0.40523 0.45972 0.76646 0.44356 0.40819 0.41768 0.4927 0.25122

EIA Report for installation of dual 14” sub-sea pipeline and umbilical for Odalarevu facility
Asian Consulting Engineers Pvt. Ltd. 3-16
Figure 3.11: Concentration of chlorophyll in Offshore Pipeline Section from 2002 to 2011

EIA Report for installation of dual 14” sub-sea pipeline and umbilical for Odalarevu facility
Asian Consulting Engineers Pvt. Ltd. 3-17
MODIS Data products of chlorophyll-a concentration [CHL, mg/m3] in the surface layer of
the global ocean have been obtained for the period of 2002 to 2011 (annual composite) from
the Ocean Color Web of the National Aeronautics and Space Administration (NASA) of the
United States.
Spatial resolution of the MODIS instruments is 4km. Of the 36 spectral bands, 9 were
customized for the ocean, with higher sensitivity and digitization bits and a narrow band at
678-nm is used to detect chlorophyll fluorescence. Band ratios between 443, 488, and 551-nm
are used to derive CHL empirically.
The observed Chlorophyll a content varies along the proposed offshore pipeline route from
range of 0.310-5.146 mg/m3 (given in Table 3.10).
The analysis of diversity of species is based on Shannon‟s Diversity Index. The Shannon
diversity index (H) that is commonly used to characterize species diversity in a community.
s
H = ∑ - (Pi * ln Pi)
i=1 where:
H = the Shannon diversity index
Pi = fraction of the entire population made up of species i
S = numbers of species encountered
∑ = sum from species 1 to species S
To calculate the index:
1. Divide the number of individuals of species #1 you found in your sample by the
total number of individuals of all species. This is Pi.
2. Multiply the fraction by its natural log (P1 * ln P1)
3. Repeat this for all of the different species that you have. The last species is
species “s”
4. Sum all the - (Pi * ln Pi) products to get the value of H
Phyto-Planktons
The diversity index value of phytoplankton varies in the range of 3.1 to 4.7. The
phytoplankton density (i.e. individual / litre) varied widely from 194 to 410 individual /litre.
Observed detail values are in the Table 3.11 along with identified phytoplankton along the
proposed offshore pipeline route.
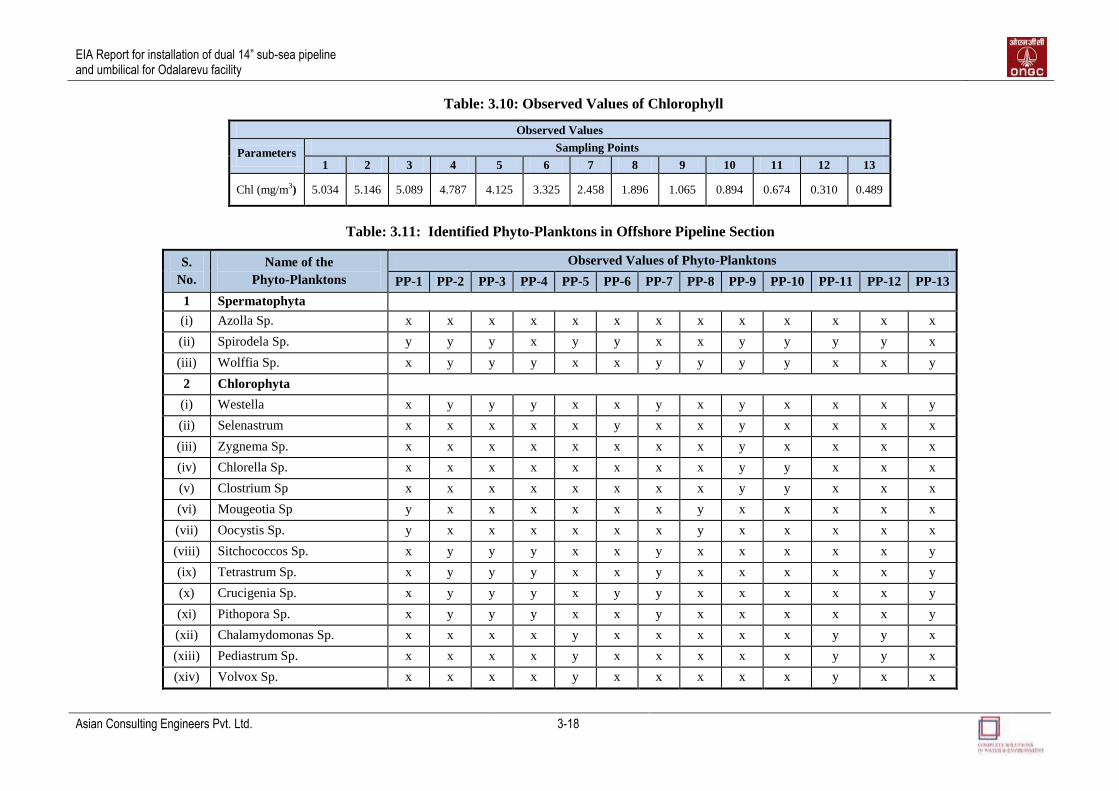
EIA Report for installation of dual 14” sub-sea pipeline and umbilical for Odalarevu facility
Asian Consulting Engineers Pvt. Ltd. 3-18
Table: 3.10: Observed Values of Chlorophyll
Observed Values
Parameters Sampling Points
1 2 3 4 5 6 7 8 9 10 11 12 13
Chl (mg/m3) 5.034 5.146 5.089 4.787 4.125 3.325 2.458 1.896 1.065 0.894 0.674 0.310 0.489
Table: 3.11: Identified Phyto-Planktons in Offshore Pipeline Section
S.
No.
Name of the
Phyto-Planktons
Observed Values of Phyto-Planktons
PP-1 PP-2 PP-3 PP-4 PP-5 PP-6 PP-7 PP-8 PP-9 PP-10 PP-11 PP-12 PP-13
1 Spermatophyta
(i) Azolla Sp. x x x x x x x x x x x x x
(ii) Spirodela Sp. y y y x y y x x y y y y x
(iii) Wolffia Sp. x y y y x x y y y y x x y
2 Chlorophyta
(i) Westella x y y y x x y x y x x x y
(ii) Selenastrum x x x x x y x x y x x x x
(iii) Zygnema Sp. x x x x x x x x y x x x x
(iv) Chlorella Sp. x x x x x x x x y y x x x
(v) Clostrium Sp x x x x x x x x y y x x x
(vi) Mougeotia Sp y x x x x x x y x x x x x
(vii) Oocystis Sp. y x x x x x x y x x x x x
(viii) Sitchococcos Sp. x y y y x x y x x x x x y
(ix) Tetrastrum Sp. x y y y x x y x x x x x y
(x) Crucigenia Sp. x y y y x y y x x x x x y
(xi) Pithopora Sp. x y y y x x y x x x x x y
(xii) Chalamydomonas Sp. x x x x y x x x x x y y x
(xiii) Pediastrum Sp. x x x x y x x x x x y y x
(xiv) Volvox Sp. x x x x y x x x x x y x x

EIA Report for installation of dual 14” sub-sea pipeline and umbilical for Odalarevu facility
Asian Consulting Engineers Pvt. Ltd. 3-19
S.
No.
Name of the
Phyto-Planktons
Observed Values of Phyto-Planktons
PP-1 PP-2 PP-3 PP-4 PP-5 PP-6 PP-7 PP-8 PP-9 PP-10 PP-11 PP-12 PP-13
(xv) Zygnema Sp. x x x x y x x x x y y x x
(xvi) Ulothrix Sp. x x x x y x x x x x y y x
(xvii) Dictyosphaerium Sp. x x x x x y x x x x x y x
(xviii) Schizomeris Sp. x x x x x y x x x x x x x
(xix) Euastrum Sp. x x x x x x x x x y x x x
(xx) Actinastrum Sp. x x x x x x x x x y x x x
(xxi) Nitella Sp. x x x x x x x x x x x y x
3 Cyanophyta
(i) Gloetrichia Sp. x x x x x y x x y x y x x
(ii) Phormidium Sp. y y y y y x y y y y x y y
(iii) Lingbya Sp. x y y y y x y x y y x y y
(iv) Oscillatoria Sp. y y y y y x y y y y y y y
(v) Fragelira Sp. y x x x x x x y x x x x x
(vi) Althrospira Sp. y x x x y x x y x x x y x
(v) Cylindrospermum Sp. x y y y x x y x x y x x y
(vi) Anabena Sp. x x x x x x x x x x y x x
(vii) Anacystis Sp. x x x x x x x x x x y x x
4 Diatoms (Bacillareophyceae)
(i) Tabellaria Sp. y y y y y y y y y y y y y
(ii) Synedra Sp. y y y y y y y y y y y y y
5 Chrysophyta
(i) Cocconeis Sp. y y y y y y y y y y y y y
(ii) Achnanthes Sp. y y y y y y y y y y y y y
(iii) Cyclotella Sp. y y y y y y y y y y y y y
(iv) Rhizosolenia Sp. y y y y y y y y y y y y y
6 Xanthothytea
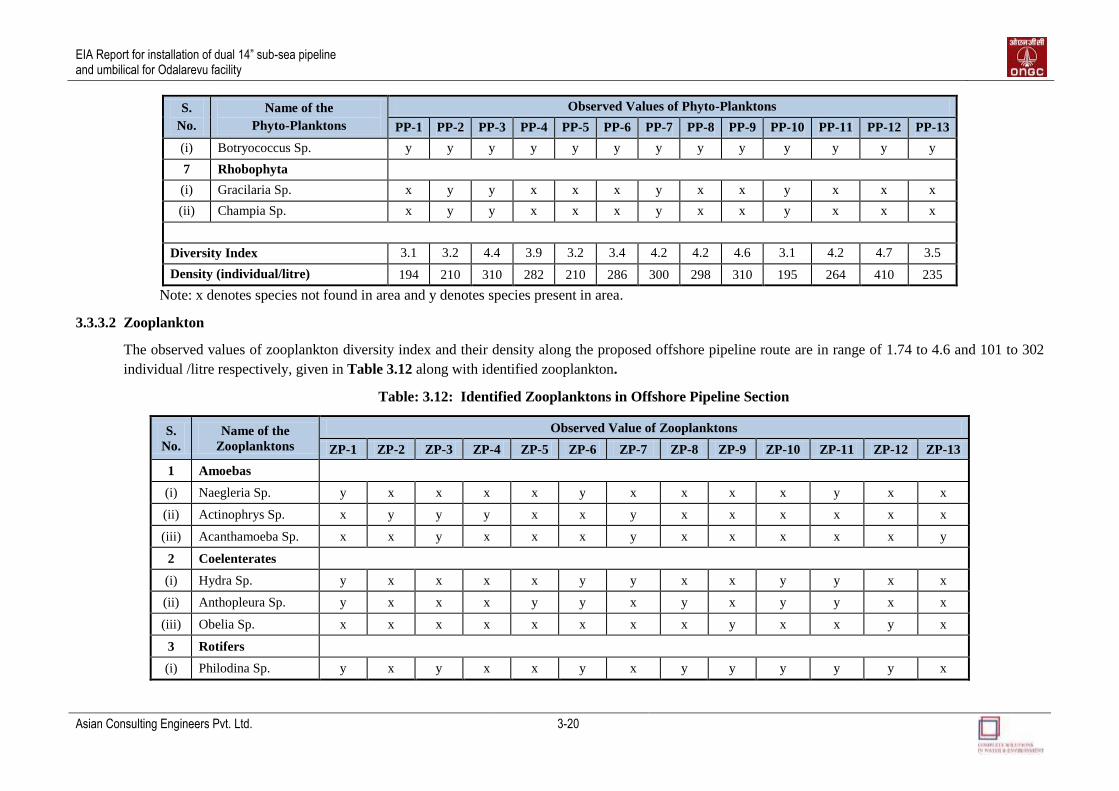
EIA Report for installation of dual 14” sub-sea pipeline and umbilical for Odalarevu facility
Asian Consulting Engineers Pvt. Ltd. 3-20
S.
No.
Name of the
Phyto-Planktons
Observed Values of Phyto-Planktons
PP-1 PP-2 PP-3 PP-4 PP-5 PP-6 PP-7 PP-8 PP-9 PP-10 PP-11 PP-12 PP-13
(i) Botryococcus Sp. y y y y y y y y y y y y y
7 Rhobophyta
(i) Gracilaria Sp. x y y x x x y x x y x x x
(ii) Champia Sp. x y y x x x y x x y x x x
Diversity Index 3.1 3.2 4.4 3.9 3.2 3.4 4.2 4.2 4.6 3.1 4.2 4.7 3.5
Density (individual/litre) 194 210 310 282 210 286 300 298 310 195 264 410 235
Note: x denotes species not found in area and y denotes species present in area.
3.3.3.2 Zooplankton
The observed values of zooplankton diversity index and their density along the proposed offshore pipeline route are in range of 1.74 to 4.6 and 101 to 302
individual /litre respectively, given in Table 3.12 along with identified zooplankton.
Table: 3.12: Identified Zooplanktons in Offshore Pipeline Section
S.
No.
Name of the
Zooplanktons
Observed Value of Zooplanktons
ZP-1 ZP-2 ZP-3 ZP-4 ZP-5 ZP-6 ZP-7 ZP-8 ZP-9 ZP-10 ZP-11 ZP-12 ZP-13
1 Amoebas
(i) Naegleria Sp. y x x x x y x x x x y x x
(ii) Actinophrys Sp. x y y y x x y x x x x x x
(iii) Acanthamoeba Sp. x x y x x x y x x x x x y
2 Coelenterates
(i) Hydra Sp. y x x x x y y x x y y x x
(ii) Anthopleura Sp. y x x x y y x y x y y x x
(iii) Obelia Sp. x x x x x x x x y x x y x
3 Rotifers
(i) Philodina Sp. y x y x x y x y y y y y x
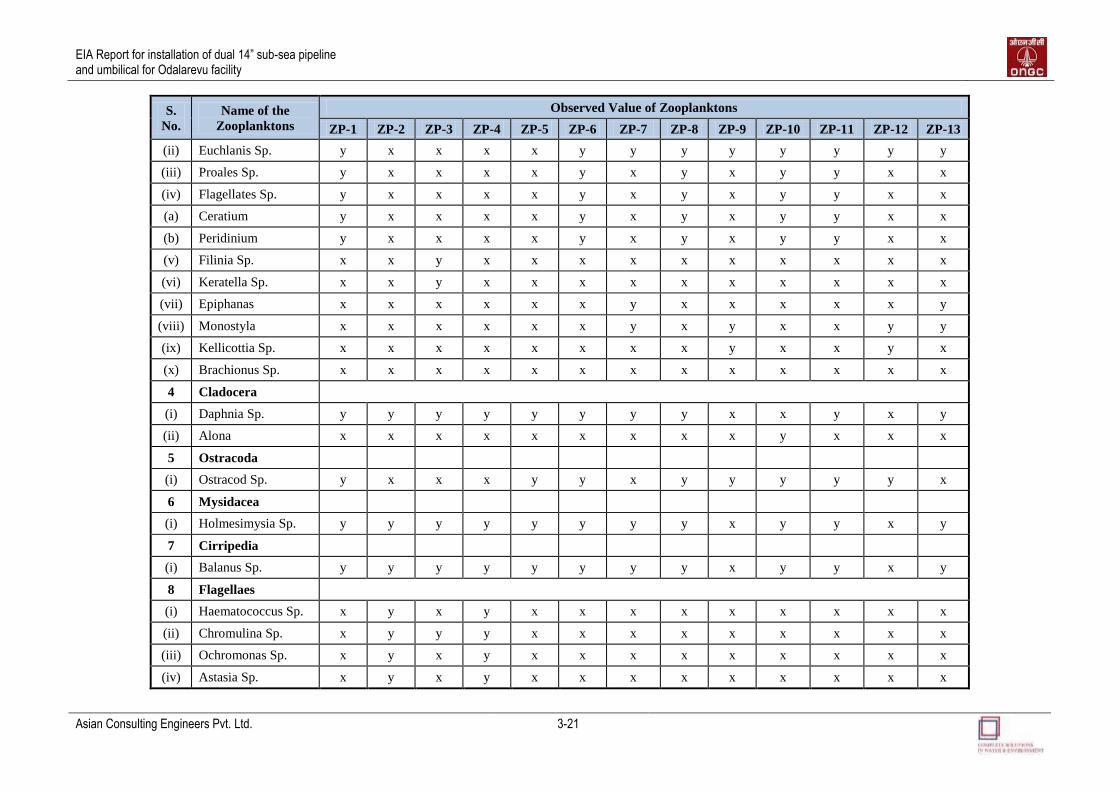
EIA Report for installation of dual 14” sub-sea pipeline and umbilical for Odalarevu facility
Asian Consulting Engineers Pvt. Ltd. 3-21
S.
No.
Name of the
Zooplanktons
Observed Value of Zooplanktons
ZP-1 ZP-2 ZP-3 ZP-4 ZP-5 ZP-6 ZP-7 ZP-8 ZP-9 ZP-10 ZP-11 ZP-12 ZP-13
(ii) Euchlanis Sp. y x x x x y y y y y y y y
(iii) Proales Sp. y x x x x y x y x y y x x
(iv) Flagellates Sp. y x x x x y x y x y y x x
(a) Ceratium y x x x x y x y x y y x x
(b) Peridinium y x x x x y x y x y y x x
(v) Filinia Sp. x x y x x x x x x x x x x
(vi) Keratella Sp. x x y x x x x x x x x x x
(vii) Epiphanas x x x x x x y x x x x x y
(viii) Monostyla x x x x x x y x y x x y y
(ix) Kellicottia Sp. x x x x x x x x y x x y x
(x) Brachionus Sp. x x x x x x x x x x x x x
4 Cladocera
(i) Daphnia Sp. y y y y y y y y x x y x y
(ii) Alona x x x x x x x x x y x x x
5 Ostracoda
(i) Ostracod Sp. y x x x y y x y y y y y x
6 Mysidacea
(i) Holmesimysia Sp. y y y y y y y y x y y x y
7 Cirripedia
(i) Balanus Sp. y y y y y y y y x y y x y
8 Flagellaes
(i) Haematococcus Sp. x y x y x x x x x x x x x
(ii) Chromulina Sp. x y y y x x x x x x x x x
(iii) Ochromonas Sp. x y x y x x x x x x x x x
(iv) Astasia Sp. x y x y x x x x x x x x x

EIA Report for installation of dual 14” sub-sea pipeline and umbilical for Odalarevu facility
Asian Consulting Engineers Pvt. Ltd. 3-22
S.
No.
Name of the
Zooplanktons
Observed Value of Zooplanktons
ZP-1 ZP-2 ZP-3 ZP-4 ZP-5 ZP-6 ZP-7 ZP-8 ZP-9 ZP-10 ZP-11 ZP-12 ZP-13
(v) Lobomonas Sp. x x y x x x x x x x x x x
(vi) Petromonas Sp. x x x x x x x x x x x x x
(vii) Non Pigmented Sp. x x x x x x x x x x x x x
(a) Dinomonas Sp. x x x x x x x x x x x x x
9 Leptostraca
(i) Epinebalia Sp. x y x y y x x y x x x x y
10 Cumacea
(i) Oxyurostylis Sp. x y y y y x y y x x x x y
11 Ciliates
(i) Lionotus Sp. x y x y y x x x y x x y y
(ii) Pleuronenema Sp. x y x y y x x x y x x y y
(iii) Colpoda Sp. x y x y y x x x x x x x y
(iv) Aspidisca Sp. x y x y y x x x x x x x y
12 Cladophora x x x x x x x x y x x y x
13 Copepoda
(i) Diaptomus y x x x x x x x y x x y x
14 Crustacea
(i) Daphnia Sp. x x x x x x x x y x x y x
(ii) Cyclops Sp. x x x x x x x x y x x y x
Diversity Index 3.4 2.93 3.46 2.93 4.6 3.24 4.46 2.74 2.68 3.1 3.24 2.74 1.74
Density (individual/litre) 291 101 302 101 468 276 459 176 168 280 276 194 206
Note: x denote species not found in area and y denote species present in area

EIA Report for installation of dual 14” sub-sea pipeline and umbilical for Odalarevu facility
Asian Consulting Engineers Pvt. Ltd. 3-23
3.3.3.3 Benthos
Benthos, the seafloor biota, contributes substantially to the secondary production as also to the potential and sustainability of demersal or near bottom living
fishable resources. The sub tidal benthic standing stock in terms of diversity index and density varied from 1.02 to 1.57 and 95 to 253 individual /litre
respectively, given in Table 3.13 along with identified benthos along the proposed offshore pipeline route.
Table: 3.13: Identified Benthos in Offshore Pipeline Section
S.
No.
Name of the
Benthos
Observed Values of Benthos
BS-1 BS-2 BS-3 BS-4 BS-5 BS-6 BS-7 BS-8 BS-9 BS-10
1 Decapods y y x y x y y y x y
2 Bivalvos y x x y y y y x x y
3 Polychaetos
(i) Nameneris quadraticeps Sp. y x y y y y y y y x
(ii) Nephthys oigobranchia Sp. y x y y y x x x x x
(iii) Nereis lamellose Sp. x x x x x y y y x x
4 Amphipods y x y y y y y y y y
5 Gastopods
(i) Bellamya Crassa Sp. y y y y y x y x y y
(ii) Bellamya bengalensis Sp. x x x x y y y x y y
6 Prionospio y y y x y x x x x x
7 Ostrecods y y y y y y y x y y
8 Cermaceans y y y y y y y y x x
9 Microbenthos
(i) Nitzschia Sp. y x y y x y x y y y
(ii) Navicula Sp. y x x y y y y x x y
(iii) Thalassiosira Sp. x x y x y x x y y x
(iv) Pleurosigma Sp. x x y y x y y y y x
10 Macrobenthos
(i) Tonne Sp. y x x y x y x x x y

EIA Report for installation of dual 14” sub-sea pipeline and umbilical for Odalarevu facility
Asian Consulting Engineers Pvt. Ltd. 3-24
S.
No.
Name of the
Benthos
Observed Values of Benthos
BS-1 BS-2 BS-3 BS-4 BS-5 BS-6 BS-7 BS-8 BS-9 BS-10
(ii) Turritella Sp. y x x x x x x y x x
(iii) Catelysica Sp. x y y x x x x x x y
(iv) Amussium Sp. x x x y x y y x x x
11 Codentrates x y x x x x x y x y
12 Diaparta naepolitane x x x y x x x x x x
Diversity Index 1.57 1.02 1.5 1.4 1.17 1.42 1.56 1.45 1.38 1.52
Density (individual/litre) 222 95 173 186 147 230 253 205 190 207
Note: x denote species not found in area and y denote species present in area
3.3.3.4 Fisheries
The region of offshore pipeline route is endowed with rich Marine inland and Brackish Water Fishery Resources. Apart from this, in these areas prawn seed
resources in general and those of P. monodon and P. indlcus in particular are abundantly available. Post-larvae of these species are commercially exploited
in various places such as Ichapuram (Srikakulam District), Vakapadu (Visakhapatnam District), Kakinada and adjacent mangrove areas of Godavari estuary
(East Godavari District), Perumpalom (West Godavari District), Kruthivenu and Machilipatnam (Krishna District) and Repalle (Guntur District). The marine
species in KG basin coastal stretch listed in Annexure – IV.
3.4 TERRESTRIAL ENVIRONMENT
Soil, Water, Air and Noise quality sampling was carried out with 10 km study area of proposed onshore pipeline. Also, the status of existing flora and fauna
and stakeholder consultations were also be done.
3.4.1 Soil Characteristics
Soil samples were collected from the field to assess its physico-chemical characteristics in the study area of onshore pipeline section. The sampling locations
are given in Table 3.14 which can also be seen in Figure 3.12. Table 3.15 shows the standard classification of soil by Indian Council of Agricultural
Research (ICAR). The monitoring results in Table 3.16. Photo Plates 3.3 to 3.6 shows the soil sample collections at different locations.

EIA Report for installation of dual 14” sub-sea pipeline and umbilical for Odalarevu facility
Asian Consulting Engineers Pvt. Ltd. 3-25
Figure 3.12: Soil Quality Sampling Locations
Methodology
The soil samples at all location were collected at the depth of 0.5 to 1.0 meters. A number of
parameters were determined which are indicative of physical, chemical and fertility
characteristics. The soil samples were analysis as per established standards and procedure
prescribed in IS: 2720.
The soil samples were collected from following places and labeled accordingly:
Table 3.14: Soil Quality Sampling Locations
S.No. Sampling Locations Code
1 Odalarevu SS-1
2 Existing Pipeline Route SS-2
3 Proposed Facility Expansion Area SS-3
4 Komaragiripatnam SS-4
5 Makanapalem SS-5
6 Turupalem SS-6
7 Karavaka SS-7
8 Allavaram SS-8
9 Challapalle SS-9
10 Godilanka SS-10
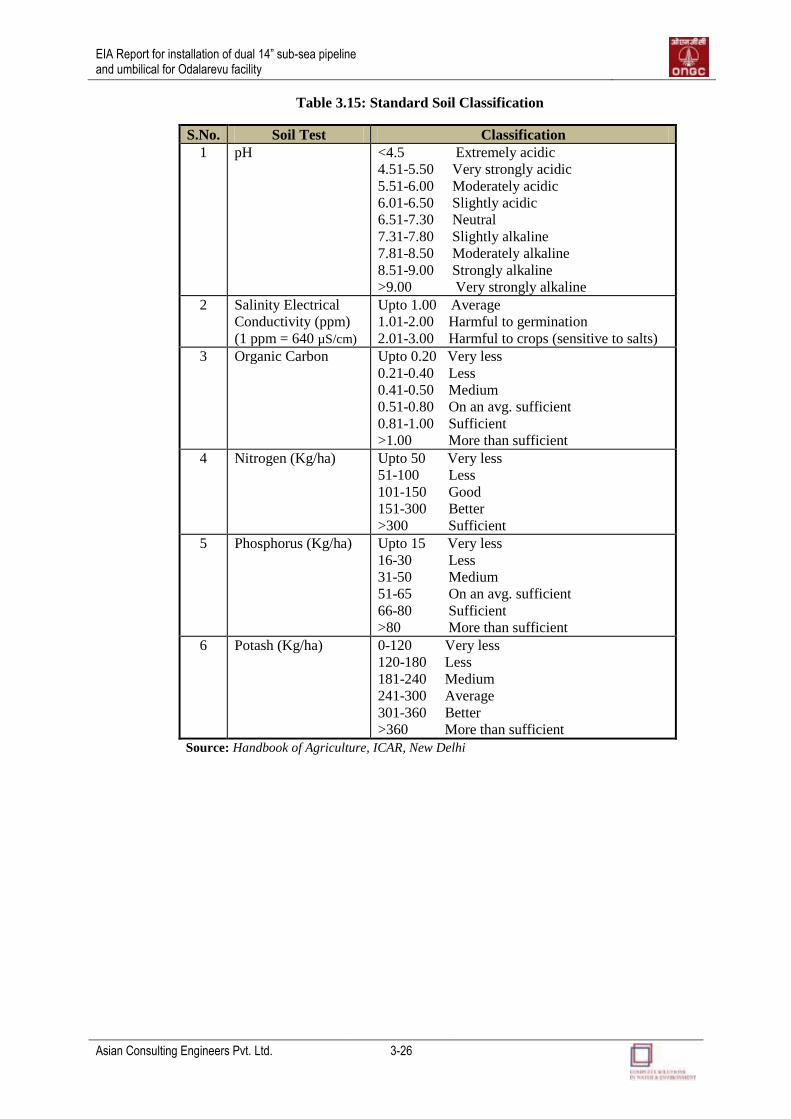
EIA Report for installation of dual 14” sub-sea pipeline and umbilical for Odalarevu facility
Asian Consulting Engineers Pvt. Ltd. 3-26
Table 3.15: Standard Soil Classification
S.No. Soil Test Classification
1 pH <4.5 Extremely acidic
4.51-5.50 Very strongly acidic
5.51-6.00 Moderately acidic
6.01-6.50 Slightly acidic
6.51-7.30 Neutral
7.31-7.80 Slightly alkaline
7.81-8.50 Moderately alkaline
8.51-9.00 Strongly alkaline
>9.00 Very strongly alkaline
2 Salinity Electrical
Conductivity (ppm)
(1 ppm = 640 µS/cm)
Upto 1.00 Average
1.01-2.00 Harmful to germination
2.01-3.00 Harmful to crops (sensitive to salts)
3 Organic Carbon Upto 0.20 Very less
0.21-0.40 Less
0.41-0.50 Medium
0.51-0.80 On an avg. sufficient
0.81-1.00 Sufficient
>1.00 More than sufficient
4 Nitrogen (Kg/ha) Upto 50 Very less
51-100 Less
101-150 Good
151-300 Better
>300 Sufficient
5 Phosphorus (Kg/ha) Upto 15 Very less
16-30 Less
31-50 Medium
51-65 On an avg. sufficient
66-80 Sufficient
>80 More than sufficient
6 Potash (Kg/ha) 0-120 Very less
120-180 Less
181-240 Medium
241-300 Average
301-360 Better
>360 More than sufficient
Source: Handbook of Agriculture, ICAR, New Delhi

EIA Report for installation of dual 14” sub-sea pipeline and umbilical for Odalarevu facility
Asian Consulting Engineers Pvt. Ltd. 3-27
Table 3.16: Analysis Results of Soil Quality Sampling
S. No. Parameter Unit SS-1 SS-2 SS-3 SS-4 SS-5 SS-6 SS-7 SS-8 SS-9 SS-10 Test Method
1 pH - 8.0 8.24 8.23 7.28 7.34 7.88 7.32 7.86 6.94 7.1 IS-2720 (Part
26)
2 Color - Light
Brown
Light
Brown
Light
Brown Brown Brown Brown Brown
Light
Brown Brown
Dark
Brown TM-S/23
3 EC µS/cm 945 1070 1015 545 643 683 579 665 495 527 IS-2720 (Part
21)
4 Organic
Carbon % by Mass 0.64 0.78 0.64 0.84 1.06 0.94 1.04 0.92 0.87 1.14
IS-2720 (Part
22)
5 Phosphorous mg/100gm 6 5.92 5.65 8 7.1 6.46 5.22 6.89 7.43 8.02 Lab SOP-
SOIL-S/41
6 Total Khejdal
Nitrogen % by Mass 0.94 0.90 0.84 0.89 0.96 0.84 0.84 0.83 0.97 0.91
Lab SOP-
SOIL-S/36
7 Calcium mg/100gm 164 181 176.8 154 201.6 194 256.7 230.4 216.8 269.7 Lab SOP-
SOIL-S/39
8 Magnesium mg/100gm 31.8 32.6 31 27.8 41 38 43.7 52.3 41 39.4 Lab SOP-
SOIL-S/40
9 Potassium
(as K) mg/100gm 6.4 6.3 5.8 4.6 5.8 5.2 7.4 8 7.1 7.2
Lab SOP-
SOIL-S/38
10 Sodium mg/100gm 18.6 18.4 18.9 11.8 15 17.4 14.6 17.3 18.9 15.9 Lab SOP-
SOIL-S/37
11
Cation-
Exchanged
capacity (CEC)
meq/100g 0.89 0.83 0.75 0.73 0.99 0.94 0.88 0.85 0.93 0.76 TM-S/14
12 Texture
Sand % by Mass 74 88 82 30 64 60 71.2 82 79 74 TM-S/32
Clay % by Mass 18 8 10 16 12 30 12.4 10 13 15 TM-S/32
Silt % by Mass 8 4 8 54 24 10 16.4 8 8 11 TM-S/32
13 Particle Size
(2.0-0.05) mm % by Weight 74 88 82 30 64 60 71.2 82 79 74 TM-S/49
14 Particle Size
(0.005-0.002 mm) % by Weight 8 4 8 54 24 10 16.4 8 8 11 TM-S/49
15 Particle Size
(<0.002mm) % by Weight 18 8 10 16 12 30 12.4 10 13 15 TM-S/49

EIA Report for installation of dual 14” sub-sea pipeline and umbilical for Odalarevu facility
Asian Consulting Engineers Pvt. Ltd. 3-28
Photo Plate 3.5: Soil Sample Collection at
Komarigipatnam Village
Photo Plate 3.6: Soil Sample collection at
Proposed Facility Expansion Area
Figure 3.13: Triangular Classification of Soil
The soil samples collected from the study area reveal sandy loam characteristics which can be
determined by correlating the results of soil samples (as given in Table 3.16) with the given
„Triangular Classification of Soil‟ (as depicted in Figure 3.13). It has neutral pH and
brownish appearance. The following conclusions could be made from the data generated
above.
Photo Plate 3.3: Soil Sample Collection at
Turupalem Village
Photo Plate 3.4: Soil Sample Collection at
Odalarevu Village

EIA Report for installation of dual 14” sub-sea pipeline and umbilical for Odalarevu facility
Asian Consulting Engineers Pvt. Ltd. 3-29
Soil pH varied in the range 6.94 to 8.24, which was neutral in the nature. The soil of the
study area is sandy loam. The soil sample collection from location near the shoreline,
namely SS-1, SS-2 and SS-3 were slightly alkaline in nature. This might be due to
proximity to the marine water, which is saline in nature.
Electrical conductivity was in the range of 495 to 1070 µS/cm. Soil collected from SS-
1(945 µS/cm), SS-2 (1070 µS/cm) and SS-3 (1015 µS/cm) locations had high range of
EC, due to its saline nature.
The organic carbon and total khejdal nitrogen in the soil of study area was in the range of
0.64 to 1.14% and 0.84 to 0.94 % respectively.
The available phosphorous, potassium, magnesium, calcium and sodium in the range of
5.22 to 8.02, 4.6 to 7.4, 27.8 to 52.3, 154 to 269.7 and 11.8 to 18.6 mg/100 gm
respectively.
The cation exchanged ration (CEC) was in the range of 8.3 to 14.2 meq/100g and was
found to be high in SS-1, SS-2 and SS-3 locations, which denote the saline nature of the
soil.
3.4.2 Water Environment
The water resources, both surface and groundwater plays an important role in the
development of an area. Likewise, the water resources of the area have been studied to
establish the current status of water quality in the area.
Surface Water
River Vainateya, one of the branches of Godavari River is present within the study area. The
river discharges their silt into the Bay of Bengal. Several irrigation and drainage canals flow
through study area, which are used for irrigating the agriculture fields. Five surface water
samples were collected from different places within the study area. Photo Plates 3.7 to 3.10
shows the surface water collections at different locations.
Photo Plate 3.7: Water Sample Collection
from drain at Komaragiripatnam Village
Photo Plate 3.8: Water Sample Collection
from drain at T. Challapalle Village
Photo Plate 3.9: Water Sample Collection
from drain at Makanapalem Village
Photo Plate 3.10: Water Sample Collection
from drain at Kesanapalli Village

EIA Report for installation of dual 14” sub-sea pipeline and umbilical for Odalarevu facility
Asian Consulting Engineers Pvt. Ltd. 3-30
Ground Water
Ground water is an important source of water for the villages in the study area. It is utilized
by the villagers for cooking, washing and other purpose. The ground water is seldom used for
drinking purpose owing to its saline nature. However, there are a few villages in the study
area which consume ground water for drinking purpose. Generally, every village has hand
pumps and few open wells to draw water for domestic use. The villages receive water from
the Panchayat supply and in case of non-availability of water; tankers are sent by the
corporation to fulfill the water demand. Ground water samples were collected from seven
locations. Photo Plates 3.11 to 3.14 shows the ground water sample collections at different
locations.
Photo Plate 3.11: Ground water sample
collection at Odalarevu village
Photo Plate 3.12: Ground water sample
collection at Karavaka village
Water Quality Assessment & Methodology
Water samples were collected from ground and surface waters within the study area as shown
in Figure 3.14. A total of eleven samples were taken from different locations including
surface and ground water bodies. The samples were analyzed for physio-chemical parameters.
The sampling and analysis of water were carried out as per standard methods of water and
waste water analysis in IS: 3025. The results of water analysis have been compared with IS:
10500-1993 drinking water standard to assess their suitability for drinking purpose. Sampling
locations for water samples are detailed in Table 3.17 below and the analytical results of the
water samples are shown in Table 3.18 (a) & Table 3.18 (b).
Photo Plate 3.13: Ground water sample
collection at Adurru village
Photo Plate 3.14: Ground water sample
collection at Kesanapalli village

EIA Report for installation of dual 14” sub-sea pipeline and umbilical for Odalarevu facility
Asian Consulting Engineers Pvt. Ltd. 3-31
Figure 3.14: Water Quality Sampling Locations
Table 3.17: Water Quality Sampling Locations
Station No Name of the Sampling Location
Surface Water Samples
SW1 Vainateya River
SW2 Komaragiripatnam
SW3 Challapalle
SW4 Makanapalem
SW5 Kesanapalli
Ground Water Samples
GW1 Odalarevu
GW2 Karavaka
GW3 Kesanapalli
GW4 Mulkipalli
GW5 Adurru
GW6 Komaragiripatnam
GW7 Allavaram

EIA Report for installation of dual 14” sub-sea pipeline and umbilical for Odalarevu facility
Asian Consulting Engineers Pvt. Ltd. 3-32
Table 3.18 (a): Surface Water Quality Monitoring Results
S.No. Parameter Unit SW-1 SW-2 SW-3 SW-4 SW-5 Test
Method
Desirable Limits as
per IS:10500
1 Color Hazen <5.0 <5.0 <5.0 <5.0 <5.0 IS:3025 (P-4) 5.0-25
2 pH - 7.81 6.93 6.84 7.29 6.86 IS:3025 (P-11) 6.5 – 8.5
3 Total Hardness (as
CaCO3)
mg/L 304 172 102 132 156 IS:3025 (P-21) 300-600
4 Calcium (as Ca) mg/L 48.1 30.5 22.4 28.9 34.5 IS:3025 (P-40) 75-200
5 Chloride (as CI-) mg/L 419.85 234.9 76.0 92.5 147.8 IS:3025 (P-32) 250-1000
6 Fluoride (as F-) mg/L <0.6 <0.6 <0.6 <0.6 <0.6 IS:3025 (P-60) 0.6-1.2
7 Total Dissolved Solids mg/L 920 482 242 180 123 IS:3025 (P-16) 500-1000
8 Manganese (as Mn) mg/L <0.1 <0.1 <0.1 <0.1 <0.1 IS:3025 (P-59) 0.10-0.30
9 Nitrate (as NO3-) mg/L 1.16 0.64 0.94 1.16 1.08 IS:3025 (P-34) 45
10 Phenoic Compounds mg/L <0.001 <0.001 <0.001 <0.001 <0.001 IS:3025 (P-43) 0.001-0.002
11 Mercury (as Hg) mg/L <0.001 <0.001 <0.001 <0.001 <0.001 IS:3025 (P-48) 0.001
12 Alkalinity(as CaCO3) mg/L 170.4 136 108 112.4 132.8 IS:3025 (P-23) 200-600
13 Potassium (as K) mg/L 9.98 7.5 2.9 1.94 4.75 IS:3025 (P-45) --
14 Sodium (as Na) mg/L 112.9 41.8 20.5 19.35 33.2 IS:3025 (P-45) --
15 BOD (3 days at 27 deg. C) mg/L 8.8 7.1 7.4 8.0 8.2 IS:3025 (P-45) --
16 Oil & Grease mg/L <4.0 <4.0 <4.0 <4.0 <4.0 IS:3025 (P-39) --
17 Total Suspended Solids mg/L 14.6 13.2 9.8 11.4 13.8 IS:3025 ﴾P-17﴿ --
18 Coliforms MPN/100 ml 73 20 15 17 22 IS:5401 (P-2) --
Table 3.18 (b): Ground Water Quality Monitoring Results
S.No. Parameter Unit GW-1 GW-2 GW-3 GW-4 GW-5 GW-6 GW-7 Test Method Desirable Limits
as per IS:10500
1 Color Hazen <5.0 <5.0 <5.0 <5.0 <5.0 <5.0 <5.0 IS:3025 (P-4) 5.0-25
2 pH - 8.28 7.92 8.19 7.76 7.68 7.84 7.76 IS:3025 (P-11) 6.5 – 8.5

EIA Report for installation of dual 14” sub-sea pipeline and umbilical for Odalarevu facility
Asian Consulting Engineers Pvt. Ltd. 3-33
S.No. Parameter Unit GW-1 GW-2 GW-3 GW-4 GW-5 GW-6 GW-7 Test Method Desirable Limits
as per IS:10500
3 Total Hardness (as
CaCO3)
mg/L 712 682 641 372 412 743 380 IS:3025 (P-21) 300-600
4 Calcium (as Ca) mg/L 124.2 148.1 136.3 78.9 82.1 140.9 70.9 IS:3025 (P-40) 75-200
5 Chloride (as CI-) mg/L 439.9 409 599.8 219.9 177.9 339.9 163.9 IS:3025 (P-32) 250-1000
6 Fluoride (as F-) mg/L <0.6 <0.6 <0.6 <0.6 <0.6 <0.6 <0.6 IS:3025 (P-60) 0.6-1.2
7 Total Dissolved Solids mg/L 1480 806 1580 1360 1508 640 668 IS:3025 (P-16) 500-1000
8 Manganese (as Mn) mg/L <0.1 <0.1 <0.1 <0.1 <0.1 <0.1 <0.1 IS:3025 (P-59) 0.10-0.30
9 Nitrate (as NO3-) mg/L 0.98 0.84 0.81 0.74 0.46 0.38 0.39 IS:3025 (P-34) 45
10 Phenoic Compounds mg/L <0.001 <0.001 <0.001 <0.001 <0.001 <0.001 <0.001 IS:3025 (P-43) 0.001-0.002
11 Mercury (as Hg) mg/L <0.001 <0.001 <0.001 <0.001 <0.001 <0.001 <0.001 IS:3025 (P-48) 0.001
12 Alkalinity(as CaCO3) mg/L 415 480 428 246 280 348 236 IS:3025 (P-23) 200-600
13 Potassium (as K) mg/L 52.7 60.7 40.1 11.1 12.6 60.8 14.6 IS:3025 (P-45) --
14 Sodium (as Na) mg/L 468.5 380 365.2 130.8 154 310 168 IS:3025 (P-45) --
15 BOD (3 days at 27 deg. C) mg/L <0.2 <0.2 <0.2 <0.2 <0.2 <0.2 <0.2 IS:3025 (P-45) --
16 Oil & Grease mg/L <4.0 <4.0 <4.0 <4.0 <4.0 <4.0 <4.0 IS:3025 (P-39) --
17 Total Suspended Solids mg/l 7.1 5.3 6.6 5.4 4.2 5.1 6.4 IS:3025 ﴾P-17﴿ --
18 Coliforms MPN/100 ml Absent Absent Absent Absent Absent Absent Absent IS:5401 (P-2) --

EIA Report for installation of dual 14” sub-sea pipeline and umbilical for Odalarevu facility
Asian Consulting Engineers Pvt. Ltd. 3-34
Monitoring Results
Surface water quality in the Study Area- The data can be summarized as follows:
The samples of surface water shall be taken from Vaniteya River and drains flows
through the study area. The surface water is commonly used for irrigation purpose.
All the water samples had less than 5 Hazen units, which is within the desirable limit.
pH of all samples was in the range of 6.84 to 7.81, which is within the desirable limit.
SW-1 is located near the mouth of Vaniteya River and SW-2 is located near the coast,
hence the TDS, Chloride, Potassium and Sodium values were higher in these stations,
when compared with other locations.
Hardness of the samples is found in the range of 132 to 304 mg/L, which is also
within the desirable limit.
Chloride values of the samples range from 76.0 to 419.85 mg/L, which are under the
desirable limit.
Calcium values varied in a significantly wide range of 22.4 to 48.1 mg/L.
Total Dissolved Solids in the samples vary from 123 to 920 mg/L. which are under
the desirable limit.
Total Suspended Solids values were in the range of 9.8 to 14.6 mg/L.
The value of Coliforms varied in the range of 15 to 73 MPN/100ml.
Alkalinity of the samples is found in the range of 108 to 170.4 mg/L, which is within
the desirable limit.
Fluoride, Phenloic compounds, Manganese, Mercury and Oil & Grease content of all
samples was in below detection limit.
Sodium, Potassium and Nitrate is found to be in the range of 19.35 to 112.9, 1.94 to
9.98 and 0.64 to 1.16 mg/l respectively.
BOD was in the range of 7.1 to 8.8 mg/l.
Ground Water Quality Monitoring: The data can be summarized as follows:
The water samples have less than 5 Hazen units, which is within the desirable limit.
GW-1, GW-2, GW-3 and GW-6 are located on the coastal area, hence the value of
pH, TDS, Chloride, Sodium and Potassium were higher in these stations, when
compared with other stations.
pH of the samples was in the range of 7.68 to 8.28, which is within the desirable
limit.
Hardness of the samples is found in the range of 372 to 743 mg/l. The TDS value is
above the desirable limits at the locations of GW-1 (712 mg/l), GW-2 (682 mg/l),
GW-3 (641 mg/l) and GW-6 (743 mg/l), due to the coastal region.
Total dissolved solids and Alkalinity of the samples also found to be above the
desirable limits in Odalarevu, Kesanapalli, Mulkipalli and Adurru village.
Total Suspended Solids values were in the range of 4.2 to 7.1 mg/L.
The Coliforms were found to be absent in all the samples.
Chloride and Calcium are also under the desirable limit.
Fluoride, Manganese, Phenloic compounds, Mercury, BOD and Oil & Grease content
of all samples are below detection limit.
Nitrate, Potassium and Sodium are in the range of 0.38 to 0.98, 11.1 to 60.8 and 130.8
to 468.5 mg/L.

EIA Report for installation of dual 14” sub-sea pipeline and umbilical for Odalarevu facility
Asian Consulting Engineers Pvt. Ltd. 3-35
3.4.3 Air Environment
Ambient Air Quality Monitoring
Eight monitoring stations were set up for this purpose to monitor ambient air quality. In
selecting the monitoring stations, the main considerations were the ready accessibility,
topography, security, availability of reliable power supply, dominant wind direction and even
distribution of sampling locations in the Study Area. The main sources of air pollution in the
study area are vehicular emission, fuel burning for domestic requirements and burning of
agriculture fields for next crop. Based on the above, eight (8) sampling locations were
selected which are Odalarevu, Allavaram, Makanapalem, Murgmullu, Adurru, Karavaka,
Challapalle and Kesanapalli. The AAQM sampling locations are shown in Figure 3.15.
Photo Plates 3.15 to 3.22 show the air quality monitoring at different locations.
Figure 3.15: Air Quality Monitoring Location Map
Photo Plate 3.15: Installation of Air monitoring
sampler at Allavaram village
Photo Plate 3.16: RDS sampler reading noted
at Adurru Village
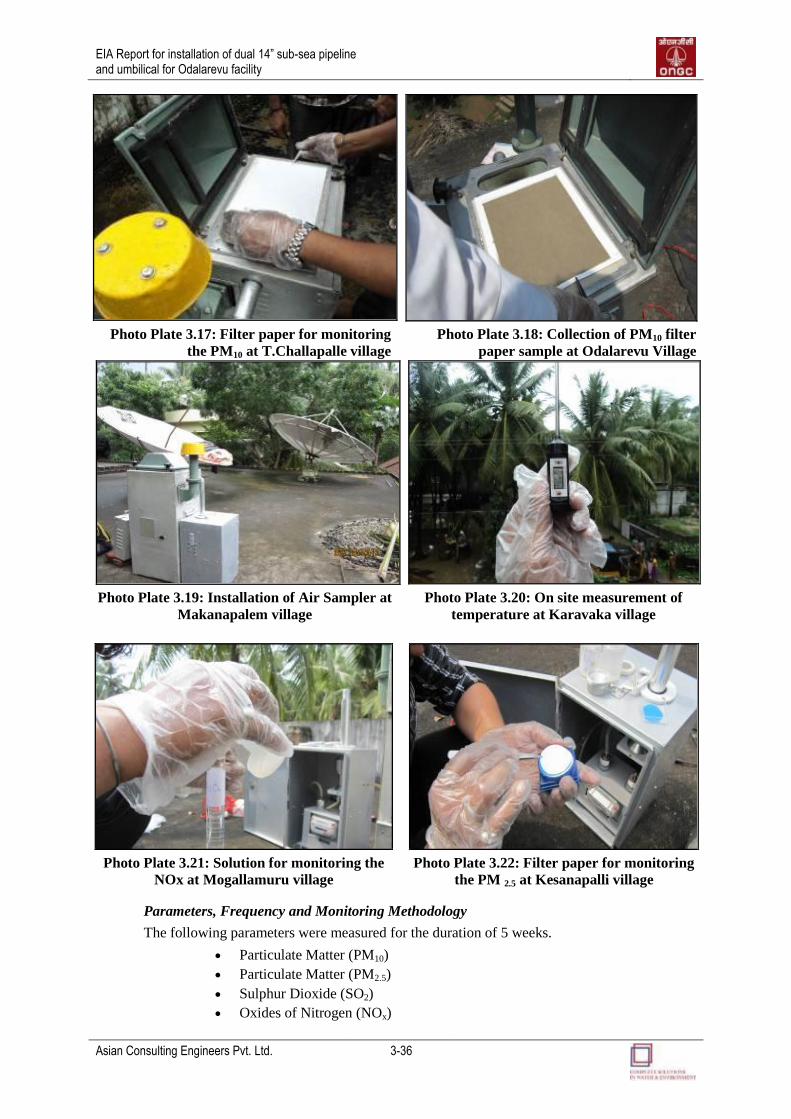
EIA Report for installation of dual 14” sub-sea pipeline and umbilical for Odalarevu facility
Asian Consulting Engineers Pvt. Ltd. 3-36
Photo Plate 3.17: Filter paper for monitoring
the PM10 at T.Challapalle village
Photo Plate 3.18: Collection of PM10 filter
paper sample at Odalarevu Village
Photo Plate 3.19: Installation of Air Sampler at
Makanapalem village
Photo Plate 3.20: On site measurement of
temperature at Karavaka village
Photo Plate 3.21: Solution for monitoring the
NOx at Mogallamuru village
Photo Plate 3.22: Filter paper for monitoring
the PM 2.5 at Kesanapalli village
Parameters, Frequency and Monitoring Methodology
The following parameters were measured for the duration of 5 weeks.
Particulate Matter (PM10)
Particulate Matter (PM2.5)
Sulphur Dioxide (SO2)
Oxides of Nitrogen (NOx)

EIA Report for installation of dual 14” sub-sea pipeline and umbilical for Odalarevu facility
Asian Consulting Engineers Pvt. Ltd. 3-37
Ambient air quality monitoring for the above parameters was conducted over five weeks
(September 2012 to October 2012) at a frequency of twice a week at each station adopting a
24-hours schedule. Methods suggested by CPCB, New Delhi, were used (IS: 5182,
Gravimetric and Digital Gas analyzer) for sample collection and analysis. Respirable dust
samplers and impingers with absorbing solution were used to collect samples.
Monitoring and analysis of hydrocarbons (methane and non-methane) and VOC were
conducted for five samples as per the TOR approved by the MoEF.
Monitoring Results
The monitoring results of PM10, PM2.5, SO2, and NOx are presented in Annexure-II.
Monitoring station-wise statistical analysis (minimum, maximum, average) for measured
level of PM10, PM2.5, SO2, NOx , HC (Methane & Non-Methane) and VOC in the study area
are tabulated in Table 3.19 to 3.24.
Ambient Air Quality in the Study Area
Particulate Matter (PM 10 and PM 2.5)
The 24-hourly average of PM10 and PM2.5 levels varied station wise between 48.4 µg/m3
-
95.3 µg/m3
and 24.5 µg/m3
– 46.0 µg/m3
respectively. The overall ranges of values for the
entire period of measurement are well within the prescribed limits. The summary of PM10 and
PM2.5 levels monitored in the study area has been given in Table 3.19 and 3.20.
Table 3.19: Summary of PM10 Levels Monitored in the Study Area
Location
Code Station Location
Area
Category
24-hourly Average PM10 (μg/m3)
Min Max Average Limit as per
NAAQS
AS1 Odalarevu Residential 54.3 110.3 82.3 100
AS2 Allavaram Residential 62.3 128.3 95.3 100
AS3 Makanapalem Residential 39.5 84.3 62 100
AS4 Murgmullu Residential 57.8 119.3 88.5 100
AS5 Adurru Residential 34.5 62.3 48.4 100
AS6 Karavaka Residential 44.3 117.5 76 100
AS7 Challapalle Residential 54.3 107.8 81 100
AS8 Kesanapalli Residential 41.3 113.5 77.4 100
Table 3.20: Summary of PM2.5 Levels Monitored in the Study Area
Location
Code Station Location
Area
Category
24-hourly Average PM2.5 (μg/m3)
Min Max Average Limit as per
NAAQS
AS1 Odalarevu Residential 21.3 42.3 31.8 60
AS2 Allavaram Residential 24.3 55.4 39.8 60
AS3 Makanapalem Residential 29.8 62.3 46.05 60
AS4 Murgmullu Residential 25.4 58.9 42.1 60
AS5 Adurru Residential 19.4 43.2 31.3 60
AS6 Karavaka Residential 16.8 31.5 24.5 60
AS7 Challapalle
Residential 21.4 48.7 35.0 60
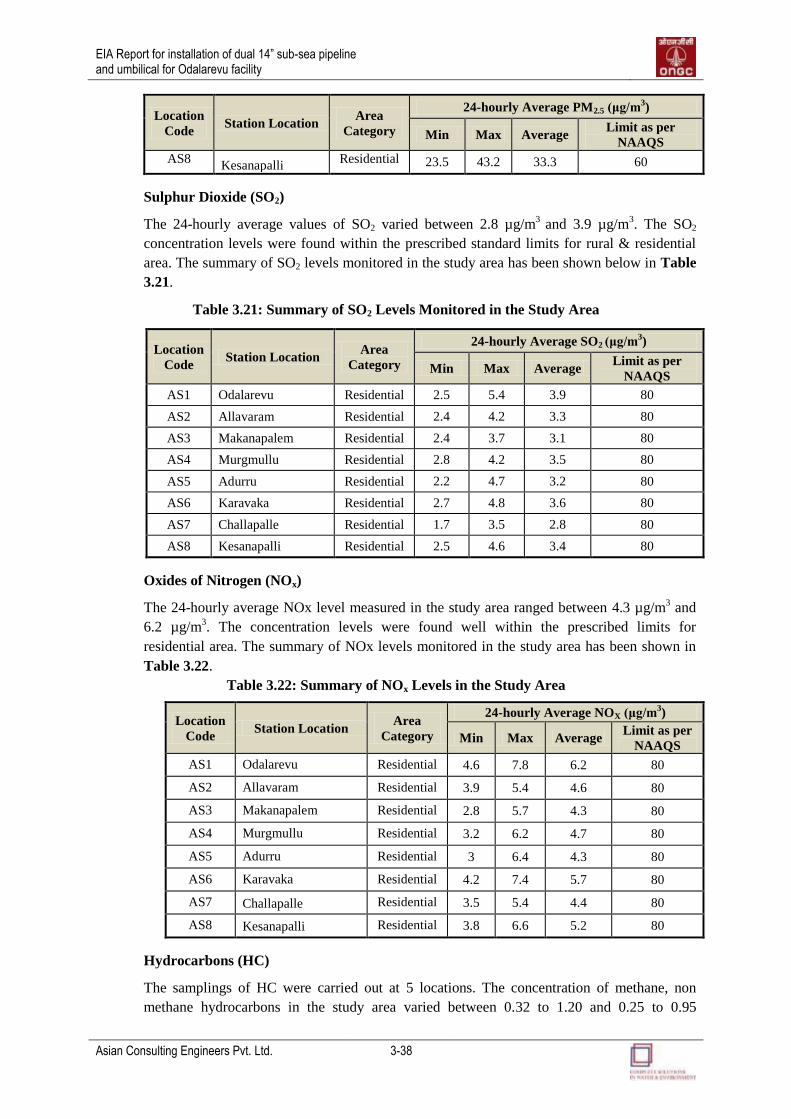
EIA Report for installation of dual 14” sub-sea pipeline and umbilical for Odalarevu facility
Asian Consulting Engineers Pvt. Ltd. 3-38
Location
Code Station Location
Area
Category
24-hourly Average PM2.5 (μg/m3)
Min Max Average Limit as per
NAAQS
AS8 Kesanapalli
Residential 23.5 43.2 33.3 60
Sulphur Dioxide (SO2)
The 24-hourly average values of SO2 varied between 2.8 µg/m3
and 3.9 µg/m3. The SO2
concentration levels were found within the prescribed standard limits for rural & residential
area. The summary of SO2 levels monitored in the study area has been shown below in Table
3.21.
Table 3.21: Summary of SO2 Levels Monitored in the Study Area
Location
Code Station Location
Area
Category
24-hourly Average SO2 (μg/m3)
Min Max Average Limit as per
NAAQS
AS1 Odalarevu Residential 2.5 5.4 3.9 80
AS2 Allavaram Residential 2.4 4.2 3.3 80
AS3 Makanapalem Residential 2.4 3.7 3.1 80
AS4 Murgmullu Residential 2.8 4.2 3.5 80
AS5 Adurru Residential 2.2 4.7 3.2 80
AS6 Karavaka Residential 2.7 4.8 3.6 80
AS7 Challapalle Residential 1.7 3.5 2.8 80
AS8 Kesanapalli Residential 2.5 4.6 3.4 80
Oxides of Nitrogen (NOx)
The 24-hourly average NOx level measured in the study area ranged between 4.3 µg/m3 and
6.2 µg/m3. The concentration levels were found well within the prescribed limits for
residential area. The summary of NOx levels monitored in the study area has been shown in
Table 3.22.
Table 3.22: Summary of NOx Levels in the Study Area
Location
Code Station Location
Area
Category
24-hourly Average NOX (μg/m3)
Min Max Average Limit as per
NAAQS
AS1 Odalarevu Residential 4.6 7.8 6.2 80
AS2 Allavaram Residential 3.9 5.4 4.6 80
AS3 Makanapalem Residential 2.8 5.7 4.3 80
AS4 Murgmullu Residential 3.2 6.2 4.7 80
AS5 Adurru Residential 3 6.4 4.3 80
AS6 Karavaka Residential 4.2 7.4 5.7 80
AS7 Challapalle Residential 3.5 5.4 4.4 80
AS8 Kesanapalli Residential 3.8 6.6 5.2 80
Hydrocarbons (HC)
The samplings of HC were carried out at 5 locations. The concentration of methane, non
methane hydrocarbons in the study area varied between 0.32 to 1.20 and 0.25 to 0.95

EIA Report for installation of dual 14” sub-sea pipeline and umbilical for Odalarevu facility
Asian Consulting Engineers Pvt. Ltd. 3-39
respectively, which is depicted in Table 3.23 below. The detection limit of the instrument
used for analyzing the samples has 1.0 ppm as its lowest detection limit.
Table 3.23: Summary of HC Levels in the Study Area
Location
Code
Area
Category
HC (in PPM)
Methane Non-Methane
AS1 Residential 1.20 0.95
AS2 Residential 0.44 0.31
AS3 Residential 0.46 0.34
AS4 Residential 0.32 0.25
AS5 Residential 0.48 0.42
VOC
The samplings for VOC were carried out at 5 locations. The concentration observed was
below 0.1 µg/m3 level in all the sampling stations which is depicted in Table 3.24 below. The
detection limit of the instrument used for analyzing the samples has 0.1 µg/m3 as its lowest
detection limit
Table 3.24: Summary of VOC Levels in the Study Area
Location
Code
Area
Category
VOC
(μg/m3)
AS1 Residential <0.1
AS2 Residential <0.1
AS3 Residential <0.1
AS4 Residential <0.1
AS5 Residential <0.1
BDL: Below Detection Limit
3.4.4 Noise Environment
Major sources of noise in the study area:
Noise made by normal human activities;
Noise made by vehicles, carts, etc.;
Noise made by occasional movement of machineries, operation of pumps, etc; and
Natural noise, consisting of sounds made by birds, animals and insects.
The purpose of noise monitoring at different locations is to obtain baseline noise levels for
future reference.
Ambient Noise Monitoring
Ambient noise monitoring was conducted to assess the background noise levels in the study
area. A total of 13 locations within the study were selected for the measurement of ambient
noise levels. Noise monitoring was carried out on a 24-hour basis to assess the baseline noise-
levels and to evaluate the impact, if any. The locations selected for the study are given in
Table 3.25 and Figure 3.16. Photo Plate 3.23 to Photo Plate 3.26 shows the noise
monitoring at different locations. The national ambient air quality standards in respect of
noise are given in Table 3.26. The monitoring results are given in Table 3.27, followed with
the graphical representation in Figure 3.17 and 3.18.

EIA Report for installation of dual 14” sub-sea pipeline and umbilical for Odalarevu facility
Asian Consulting Engineers Pvt. Ltd. 3-40
Table 3.25: Location of the Noise Quality Monitoring Stations
Monitoring
Location Name of the Location
Project w.r.t Project Site
Direction Distance (km)
NS-1 Odalarevu N 0.809
NS-2 Allavaram N 9.74
NS-3 Mogallamuru WSW 6.06
NS-4 Kesanapalli N 7.20
NS-5 Makanapalem NW 8.90
NS-6 Mulkipalli NW 8.80
NS-7 Adurru NW 7.29
NS-8 Turupalem WSW 8.56
NS-9 T.Challapalle NNE 11.73
NS-10 Komaragiripatnam NNE 3.65
NS-11 Godilanka N 6.65
NS-12 Entrance Gate of Existing facility - 0
NS-13 Existing Pipeline Route E 2.40
Figure 3.16: Noise Quality Sampling Locations

EIA Report for installation of dual 14” sub-sea pipeline and umbilical for Odalarevu facility
Asian Consulting Engineers Pvt. Ltd. 3-41
Photo Plate 3.23: On site noise monitoring at
Makanapalem Village
Photo Plate 3.24: On site noise monitoring at
Mulkipalli Village
Photo Plate 3.25: On site noise monitoring T.
Challapalle Village
Photo Plate 3.26: On site noise monitoring at
Kesanapalli Village
Methodology
Ambient noise level or sound pressure levels (SPL) were measured by a portable sound level
meter having built in facilities to read noise level directly in dB (A). A-weighted equivalent
continuous sound pressure level (Leq) values were computed from the values of A-weighted
SPL measured with the help of noise meter. Noise Measurement was carried as per IS: 4954
standards as given by Central Pollution Control Board (CPCB). At each location, noise
monitoring was conducted continuously over a period of twenty-four hours to obtain Leq
values at uniform time intervals of one hour.
Day time Leq has been computed from the hourly Leq values between 6.00 a.m. and 10.00 p.m.
and night time Leq from the hourly Leq values between 10.00 p.m. and 6.00 a.m. using the
following formula:
Where, Li = Leq value of the ith hourly time interval
Area category: I-Industrial, C-Commercial, R-Residential, S-Silence zone
Day time: 6.00 a.m. to 10.00 p.m. Night time: 10.00 p.m. to 6.00 a.m.
Permissible Ambient noise standards in dB (A):
16
1
101016
1log10
i
L
eq
i
dayL
8
1
10108
1log10
i
L
eq
i
nightL
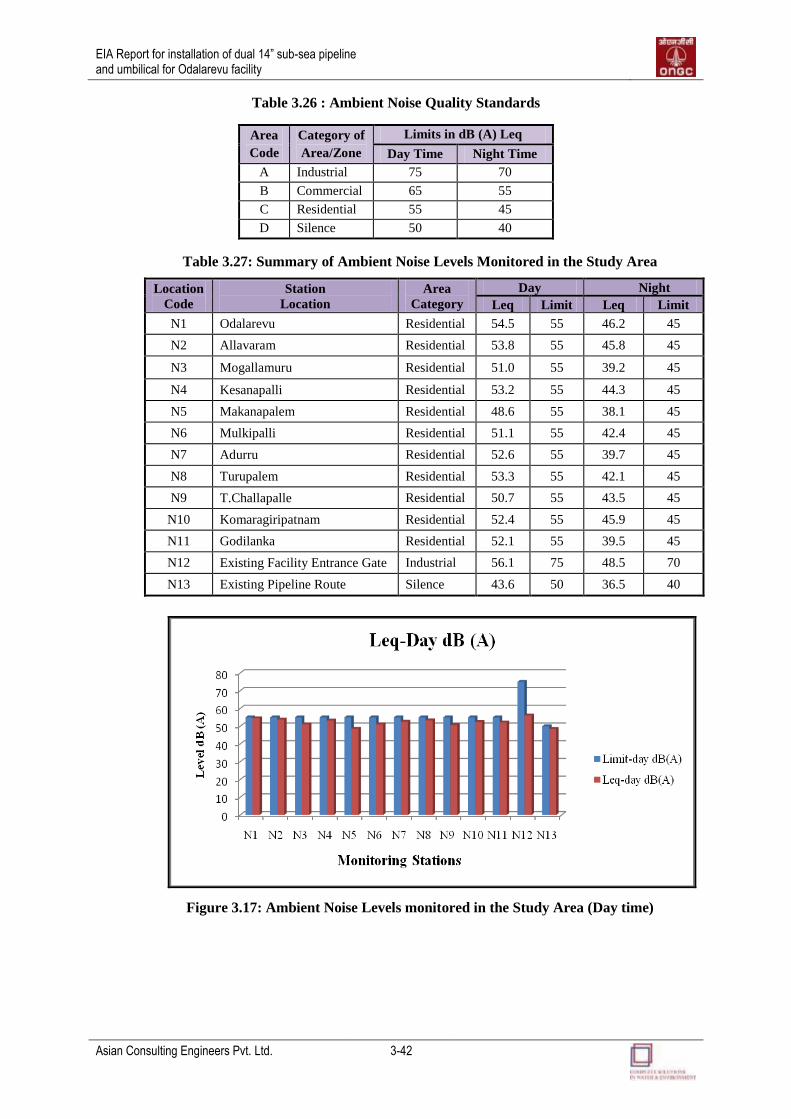
EIA Report for installation of dual 14” sub-sea pipeline and umbilical for Odalarevu facility
Asian Consulting Engineers Pvt. Ltd. 3-42
Table 3.26 : Ambient Noise Quality Standards
Area
Code
Category of
Area/Zone
Limits in dB (A) Leq
Day Time Night Time
A Industrial 75 70
B Commercial 65 55
C Residential 55 45
D Silence 50 40
Table 3.27: Summary of Ambient Noise Levels Monitored in the Study Area
Location
Code
Station
Location
Area
Category
Day Night
Leq Limit Leq Limit
N1 Odalarevu Residential 54.5 55 46.2 45
N2 Allavaram Residential 53.8 55 45.8 45
N3 Mogallamuru Residential 51.0 55 39.2 45
N4 Kesanapalli Residential 53.2 55 44.3 45
N5 Makanapalem Residential 48.6 55 38.1 45
N6 Mulkipalli Residential 51.1 55 42.4 45
N7 Adurru Residential 52.6 55 39.7 45
N8 Turupalem Residential 53.3 55 42.1 45
N9 T.Challapalle Residential 50.7 55 43.5 45
N10 Komaragiripatnam Residential 52.4 55 45.9 45
N11 Godilanka Residential 52.1 55 39.5 45
N12 Existing Facility Entrance Gate Industrial 56.1 75 48.5 70
N13 Existing Pipeline Route Silence 43.6 50 36.5 40
Figure 3.17: Ambient Noise Levels monitored in the Study Area (Day time)

EIA Report for installation of dual 14” sub-sea pipeline and umbilical for Odalarevu facility
Asian Consulting Engineers Pvt. Ltd. 3-43
Figure 3.18: Ambient Noise Levels Monitored in the Study Area (Night time)
The minimum and maximum sound levels at the existing site and the existing pipeline route
were recorded on a hand held sound level meter for five minutes during day time. The sound
level meter was held 1.2 to 1.5 m above ground level and at least 3m away from sound
reflecting sources like trees in the surrounding environment. Given below are the readings
observed:
Location
Code Location
Day time
Min. Max.
N12 Entrance gate of existing facility 42.3 67.8
N13 Existing pipeline route 31.5 52.3
Analysis of the Data
Assessment of noise level was carried out at various places to evaluate the ambient noise level
in the residential area as well as possible impact due to project activities. The values of noise
level, which are recorded lies between 48.6-54.5 dB (A) at day time and 38.1-46.2 (A) at
night time. The noise level in the day time as well as in night time within the permissible limit
except for the noise levels at N1, N2 and N-10 are slightly high in the night because of
cultural programme were taken place in the area.
The marine (sea-water, sediments and biological parameters) and terrestrial (air, noise, water
and soil) environment sample testing and analysis was carried out by EKO Pro Engineers Pvt.
Ltd. laboratory as per regulatory standards and norms. EKO Pro is QCI-NABET Accredited
laboratory located at Ghaziabad, Uttar Pradesh.
3.4.5 Biological Characteristics
There are no eco-sensitive or forest or wildlife sanctuaries within the 10km study area. The
Coringa Forest/National Park which is near to Kakinada is approximately 51 km (aerial
distance) far from Odalarevu onshore facility. The aerial distance of Coringa national park
and Odalarevu onshore terminal is shown in Figure 3.19.

EIA Report for installation of dual 14” sub-sea pipeline and umbilical for Odalarevu facility
Asian Consulting Engineers Pvt. Ltd. 3-44
Figure 3.19: Aerial distance between Odalarevu facility and Coringa national park
Flora
A floral enlistment of trees, shrubs and climbers with their scientific names, common names
and the family to which they belong is presented in Annexure -III. Also floral species
observed through quadrate sampling during field visit has been depicted under the Photo
Plate 3.27 to 3.29. A total of 272 plants species have been observed in the area. This includes
184 species of trees, 47 species of shrubs and 41 species of climbers. From all the species
observed in the area, Casuarina equisetifolia, Rhizophora mucronata and Grewia
populifolia are very common (Source: 1. Kakinada Forest Division, Forest Range Office, Wharf
Road.2. Local Enquiry and field investigation).
Photo Plate 3.27 : Quadrate study at
Odalarevu
Photo Plate 3.28 : Palm and Coconut Tree at
Bendamurulanka village

EIA Report for installation of dual 14” sub-sea pipeline and umbilical for Odalarevu facility
Asian Consulting Engineers Pvt. Ltd. 3-45
Photo plate 3.29 : Identification of floral species
Fauna
The area supports varied habitats viz. open space, agricultural fields, and human settlements.
The information on the fauna, which are present in and around the study area, is gathered
from various sources like interview with forest officials, local villagers, as well as by detail
survey of these areas by EIA study team. During the field survey fauna species were recorded
by direct observation as well as indirect evidences such as calls, nests, burrows, droppings,
scats, tracks etc., which confirms the presence of the animals in the area. A faunal enlisting of
invertebrates, mammals, birds, reptiles and amphibians with their scientific prepared from
various secondary sources as well as direct and indirect evidences by EIA team is presented in
Table 3.28.
Table 3.28: Fauna Species Existing Within the Surrounding Study Area
Sl. No. Common Name Scientific Name
1. Bonnet Macaque Macaca radiata
2. Common langur Semnopithecus
3. Common mongoose Herpestes edwardsii
4. Five striped palm squirrel Funambulus pennantii
5. Indian Hare Lepus nigricollis
6. Indian Bison/Gaur Bos gaurus
7. Mouse deer Tragulus meminna
8. Rhesus Macaque Macaca mulatta
9. Three striped squirrel Funambulus palmarum
10. House Sparrow Passer domesticus
11. Common Myna Acridotheres tristis
12. House Crow Corvus splendens
13. Bank Myna Acridotheres ginginianus
14. Black Headed Cuckoo Coracina melanoptera
15. Pigeon Columbidae
16. Crane Gruidae
17. Black Eagle Ictinaetus malayensis
18. Cobra Ophiophagus Hannah
19. Rat Snake Elaphe obsoleta
Source: 1. Kakinada Forest Division, Forest Range Office, Wharf Road.
2. Local Enquiry and field investigation

EIA Report for installation of dual 14” sub-sea pipeline and umbilical for Odalarevu facility
Asian Consulting Engineers Pvt. Ltd. 3-46
3.5 SOCIO-ECONOMIC ENVIRONMENT
The socio-economic profile of the study area is based on 2001 Census of India (As 2011
Census not available at the time of report preparation). The study of socio-economic
components of environment incorporates various features viz., demographic structure,
availability of basic amenities such as housing, education, medical facilities, drinking water
facilities, post, telegraph and telephone facilities, communication facilities, recreational,
cultural facilities, approach to villages etc. The study of these parameters helps in identifying,
predicting and evaluating the likely impacts due to the proposed project activity in that region.
The study area includes five mandals namely, Allavaram, Mamidikuduru, Malikipuram,
Razole and Uppalaguptam. The geographical area of mandals and the number of habitations
under the study area is given in Table 3.29. Mandals and their revenue villages with their
habitations found in the study area are as shown in Figure 3.20 and listed in Table 3.30.
Table 3.29: Mandals with the number of habitations under the Study Area
S. No. Mandals Geographical Area (Sq.Kms) Habitations under study area
1 Allavaram 105 25
2 Mamidikuduru 80 6
3 Malikipuram 90 2
4 Razole 77 4
5 Uppalaguptam 118 1
Total 470 38
Source: Hand Book of Statistics, East Godavari District, 2012
Figure 3.20: Locations of Villages in the Study Area

EIA Report for installation of dual 14” sub-sea pipeline and umbilical for Odalarevu facility
Asian Consulting Engineers Pvt. Ltd. 3-47
Table 3.30: Revenue Villages and habitations under the Study Area
Mandals Revenue Villages Habitations
Allavaram
Allavaram 1. Allavaram
Bendamurulanka
2. Rebbanapalli
3. Vodalarevu
4. Bendamurlanka
Devaguptam
5. D.Ravulapalem
6. Gundipudi
7. Devaguptam
Godi
8. Godipalem
9. Godithippa
10. Gopailanka
11. Godi
Godilanka 12. Godilanka
Komaragiripatnam
13. Lakshmaneswaram
14. Rameswaram
15. Thummalapalle
16. Komaragiripatnam
Mogallamuru
17. Rebabanapalli Peta
18. Sirigatlapalle
19. Mogallamuru
Rellugadda 20. Veluvalalanka
21. Rellugadda
Samanthakuru
22. Adiandhra Peta
23. Pallipalem
24. Samanthakuru
Thurupulanka 25. Thurupulanka
Mamidikuduru
Adurru 26. Adurru
27. Moripalem
Gogannamattam 28. Karavaka
Lutukurru 29. Lutukurru
Magatapalle 30. Magatapalle
Makanapalem 31. Makanapalem
Malikipuram Kesanapalle 32. Kesanapalli
33. Turpupalem
Razole
Mulikipalle 34. Mulikipalle
Ponnamanda
35. Giduguvaripalem
36. Merkapalem
37. Ponnamanda
Uppalaguptam T.Challapalle 38. T. Challapalle
Source: http://www.apagri.gov.in/villagedetails.htm
It is envisaged that the proposed project will have certain positive impacts and insignificant
negative impact as activities will be temporary on the surrounding areas with reference to
socio-economic environment due to influx of population and strain on existing infrastructure
for a short period of time. The data on baseline status of the study and basic information about
the socio-economic profile has also been collected during the site visit and from secondary
sources. Baseline information was collected to define the socio-economic profile of the study
area. The database, thus generated in the process includes:
Demographic structure;
Infrastructure base in the study area;
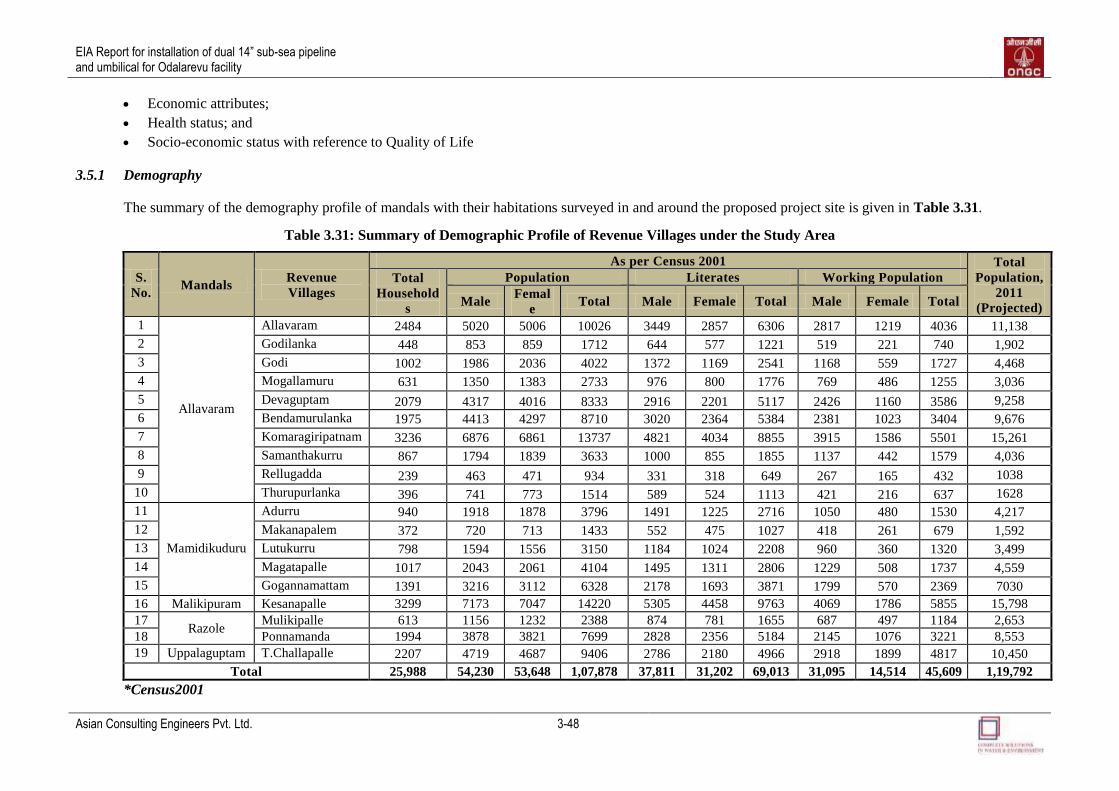
EIA Report for installation of dual 14” sub-sea pipeline and umbilical for Odalarevu facility
Asian Consulting Engineers Pvt. Ltd. 3-48
Economic attributes;
Health status; and
Socio-economic status with reference to Quality of Life
3.5.1 Demography
The summary of the demography profile of mandals with their habitations surveyed in and around the proposed project site is given in Table 3.31.
Table 3.31: Summary of Demographic Profile of Revenue Villages under the Study Area
S.
No. Mandals
Revenue
Villages
As per Census 2001 Total
Population,
2011
(Projected)
Total
Household
s
Population Literates Working Population
Male Femal
e Total Male Female Total Male Female Total
1
Allavaram
Allavaram 2484 5020 5006 10026 3449 2857 6306 2817 1219 4036 11,138
2 Godilanka 448 853 859 1712 644 577 1221 519 221 740 1,902
3 Godi 1002 1986 2036 4022 1372 1169 2541 1168 559 1727 4,468
4 Mogallamuru 631 1350 1383 2733 976 800 1776 769 486 1255 3,036
5 Devaguptam 2079 4317 4016 8333 2916 2201 5117 2426 1160 3586 9,258
6 Bendamurulanka 1975 4413 4297 8710 3020 2364 5384 2381 1023 3404 9,676
7 Komaragiripatnam 3236 6876 6861 13737 4821 4034 8855 3915 1586 5501 15,261
8 Samanthakurru 867 1794 1839 3633 1000 855 1855 1137 442 1579 4,036
9 Rellugadda 239 463 471 934 331 318 649 267 165 432 1038
10 Thurupurlanka 396 741 773 1514 589 524 1113 421 216 637 1628
11
Mamidikuduru
Adurru 940 1918 1878 3796 1491 1225 2716 1050 480 1530 4,217
12 Makanapalem 372 720 713 1433 552 475 1027 418 261 679 1,592
13 Lutukurru 798 1594 1556 3150 1184 1024 2208 960 360 1320 3,499
14 Magatapalle 1017 2043 2061 4104 1495 1311 2806 1229 508 1737 4,559
15 Gogannamattam 1391 3216 3112 6328 2178 1693 3871 1799 570 2369 7030
16 Malikipuram Kesanapalle 3299 7173 7047 14220 5305 4458 9763 4069 1786 5855 15,798
17 Razole
Mulikipalle 613 1156 1232 2388 874 781 1655 687 497 1184 2,653
18 Ponnamanda 1994 3878 3821 7699 2828 2356 5184 2145 1076 3221 8,553
19 Uppalaguptam T.Challapalle 2207 4719 4687 9406 2786 2180 4966 2918 1899 4817 10,450
Total 25,988 54,230 53,648 1,07,878 37,811 31,202 69,013 31,095 14,514 45,609 1,19,792
*Census2001

EIA Report for installation of dual 14” sub-sea pipeline and umbilical for Odalarevu facility
Asian Consulting Engineers Pvt. Ltd. 3-49
3.5.2 Occupation
The major occupation of surveyed population was involved in agriculture. The main crops of the area are Coconut and Paddy. Some people also work as
labourers in the agricultural field. The residents in the coastal villages were mainly occupied with fishing related activities, which was their main source of
income. Their main catch was white promfrets, prawns, crabs, ribbon fishes etc. Aquacultures are also prominent occupation in the survey area apart from
fishing and agriculture. Some of them involved in other activities like businesses (shop owners), service job, labour work etc.
a) Agriculture
The study area is dominated by agricultural fields. Main crops of the study area are paddy, coconut, food grains, food crops, pulses, black gram, non-food
crops, fresh & Dry Fruits. The mandal-wise area under the crops of the study area is given in Table 3.32. Photo Plate 3.30 and 3.31shows the agricultural
field in the study area.
Table 3.32: Area under Crops of the Study Area (Mandal-Wise)
S.
No. Crops
Area (In Hectares)
Mamidikuduru Razole Malikipuram Allavaram Uppalaguptam
Kharif Rabi Total Kharif Rabi Total Kharif Rabi Total Kharif Rabi Total Kharif Rabi Total
1 Rice 1799 493 2292 3413 1301 4714 1314 1070 2384 3859 2844 6703 5834 5429 11263
2 Green gram 0 110 110 0 150 150 0 146 146 0 161 161 0 120 120
3 Black gram 0 1236 1236 0 1210 1210 0 293 293 0 527 527 0 138 138
4 Red gram 0 62 62 0 18 18 0 50 50 0 1 1 0 75 75
5 Pulses 0 1408 1408 0 1378 1378 0 489 489 0 689 689 0 333 333
6 Total Food Grains 1799 1901 3700 3413 2679 6092 1314 1559 2873 3859 3533 7392 5834 5762 11596
7 Condiments and spices 0 0 0 4 0 4 0 0 0 0 0 0 0 0 0
8 Sugarcane 0 0 0 4 0 4 0 0 0 0 0 0 0 0 0
9 Fresh and Dry Fruits 232 0 232 117 0 117 364 0 364 151 82 233 1 0 1
10 Food Crops 2545 1901 4446 3566 2685 6251 1678 1559 3237 4010 3615 7625 5835 5762 11597
11 Groundnut 0 0 0 0 0 0 0 3 3 0 0 0 0 0 0
12 Coconut 4045 0 4045 2807 0 2807 3328 0 3328 2538 0 2538 994 0 994
13 Oil Seeds 4045 0 4045 2807 0 2807 3328 3 3331 2538 0 2538 994 0 994
14 Fodder Crops 0 0 0 0 0 0 0 457 457 0 110 110 0 0 0
15 Green Manure Crop 0 0 0 0 0 0 0 28 28 0 45 45 0 0 0
16 Non Food Crops 4050 0 4050 2808 0 2808 3438 488 3926 2647 155 2802 994 0 994
Total 18515 7111 25626 18939 9421 28360 14764 6145 20909 19602 11762 31364 20486 17619 38105
Source: Hand Book of Statistics, East Godavari District, 2010

EIA Report for installation of dual 14” sub-sea pipeline and umbilical for Odalarevu facility
Asian Consulting Engineers Pvt. Ltd. 3-50
Photo Plate 3.30: Paddy field at
Bendamurulanka village
Photo Plate 3.31: Coconut farm at
Kesanapalli village
b) Fishing activities
Fishermen of the study area were engaged in inland and marine fishing activity. Inland
Fisheries cover the river (Vaniteya), drains and village ponds. Marine Fisheries cover the
entire coastal area of Bay of Bengal. Fish landing centers in the study area are Odalarevu,
Karavaka and Turupalem. ACE team also cover the Antervedipali palem fish landing center
in Sakhinetipalle Mandal, which is out of the study area. The inland and marine fish
productions of East Godavari district are given in Table 3.33 and 3.34. Photo Plate 3.32 and
3.33 shows the fishing activities at different locations. The fish landing centres covered by
ACE Team during the stakeholder‟s consultation are shown in Figure 3.21.
Table 3.33: Inland Fish Production of East Godavari
S.
No.
Name of the
Species
Quantity (Tonnes)
2008-09 2009-10
1 Barbus 750.00 367.00
2 Carps (Catla/Rohu/Mrigal) 8800.50 8887.00
3 Cat Fishes 25.60 15.00
4 Common Carbs 0.00 0.00
5 Murrel 110.00 476.00
6 Mullets 1413.00 1475.00
7 Prawns 8889.11 6793.30
8 Hilsa 1029.00 195.00
9 Miscellaneous 3051.45 8354.00
Total 24068.66 26562.30
Source: Hand Book of Statistics, East Godavari District, 2010
Table 3.34: Marine Fish Production of East Godavari District
S.
No.
Name of the
Species
Production (in Tonnes)
2008-09 2009-10
1 Elasmorbranches
a) Sharks 2456.00 100.00
b) Skates 634.00 75.00
c) Rays 1640.00 110.00
2 Eels 2016.00 140.00
3 Cat Fish 2272.00 275.00
4 Clupeidaeis
a) Wolf Herrings 0.00 0.00
b) Sardines 2157.00 1428.00
c) Hilsa Shades 0.00 1857.00

EIA Report for installation of dual 14” sub-sea pipeline and umbilical for Odalarevu facility
Asian Consulting Engineers Pvt. Ltd. 3-51
S.
No.
Name of the
Species
Production (in Tonnes)
2008-09 2009-10
d) Anchovies 3096.00 1695.00
e) Other Clupeidaeis 1447.00 0.00
5 Bombay Duck 0.00 0.00
6 Half & Full Beaks 0.00 0.00
7 Flying Fish 0.00 0.00
8 Perches 2516.00 1250.00
9 Goat Fish 2362.00 0.00
10 Thread Fins 2237.00 0.00
11 Ribbon Fish 2081.00 2560.00
12 Carangids 2552.00 840.00
13 Silver Bellies 2253.00 0.00
14 Big Jawed Jumpet 0.00 0.00
15 Promfrets 4225.00 650.00
16 Mackerel
a) Kanagurta 2162.00 620.00
b) Other Mackerles 2169.00 850.00
17 Seer Fish 2253.00 1470.00
18 Tunnies 0.00 0.00
19 Baracudas 0.00 0.00
20 Mullets 2643.00 0.00
21 Flat Fish 0.00 300.00
22 Miscellaneous 9746.00 37937.00
Total 52914.00 52157.00
23 Shrimp
a) Panaeid Shrimp 9952.00 5445.00
b) Non-Panaeid Shrimp 2104.70 2756.00
Marine Shrimp 12056.70 8201.00
Marine Fish 52844.00 52157.00
Total 129871.40 120716.00
Source: Hand Book of Statistics, East Godavari District, 2010
Photo Plate 3.32: Fishing activities at
Karavaka village
Photo Plate 3.33: Odalarevu fish landing
centre

EIA Report for installation of dual 14” sub-sea pipeline and umbilical for Odalarevu facility
Asian Consulting Engineers Pvt. Ltd. 3-52
Figure 3.21: Fish Landing Centres in the study region
c) Fish & Prawn Culture
The local fishermen of the study area are also engaged in aquaculture. They have aquaculture
ponds which are being used for fish or prawn culture. Table 3.35 shows the mandal wise area
under the fish & prawn culture. Photo Plate 3.34 and 3.35 shows the aquaculture fields at
different locations.
Table 3.35: Area under Fish & Prawn Culture
S.
No. Mandals
Fish & Prawn
Culture
% to Geographical
Area
1 Mamidikuduru 251 3.10
2 Razole 0 0
3 Malikipuram 249 2.80
4 Allavaram 812 7.70
5 Uppalaguptam 767 6.50
Total 2079
Source: Hand Book of Statistics, East Godavari District, 2010

EIA Report for installation of dual 14” sub-sea pipeline and umbilical for Odalarevu facility
Asian Consulting Engineers Pvt. Ltd. 3-53
Photo Plate 3.34: Aquaculture farm at
Adurru Village
Photo Plate 3.35: Aquaculture farm at
Rameshwaram village
3.5.3 Livestock
The study area is dominated by domestic animals. Cattles, Buffaloes, Sheep, Goats, Pigs, and
Dogs are dominating animals at various places in study area. The livestock and poultry
population of mandals are given in Table 3.36.
Table 3.36: Mandal-Wise Livestock and Poultry Population – 2007
S.
No. Mandals Cattle Buffaloes Sheep Goats Horses Pigs Dogs Poultry Total
1 Mamidikuduru 3774 5509 2354 1593 1 428 225 23338 37222
2 Razole 3580 32096 3512 91 0 330 184 39207 79000
3 Malikipuram 6127 26166 2324 4015 0 161 446 69373 108612
4 Allavaram 3764 7197 5789 825 0 306 368 44276 62525
5 Uppalaguptam 4112 10669 2997 581 2 744 488 73971 93564
Total 21357 81637 16976 7105 03 1969 1711 250165 380923
Source: Hand Book of Statistics, East Godavari District, 2010
3.5.4 Educational Facilities
All the villages within the study area have primary educational facilities. Most of them have
the educational facilities upto primary. Within the study area, there is one engineer collage,
BVC Engineering Collage located in Odalarevu village. The management wise schools in
mandals are given in Table 3.37. Photo Plate 3.36 to 3.38 shows the educational institutes at
different locations.
Table 3.37: Schools in Mandals
S.
No. Mandals
Management Wise Schools
Mandal Parishad Private Aided Private Unaided State Govt. Total
P U.P H P U.P H P U.P H P U.P H
1 Mamidikuduru 61 1 12 1 0 0 2 1 3 0 0 0 81
2 Razole 64 5 9 0 0 0 3 6 4 0 0 1 92
3 Malikipuram 63 7 10 0 0 1 5 1 4 0 0 0 91
4 Allavaram 71 7 9 0 0 1 1 3 0 0 0 0 92
5 Uppalaguptam 74 5 7 0 0 0 1 3 0 0 0 0 90
Total 333 25 47 1 0 2 12 14 11 0 0 1 446
*P=Primary School, U.P=Upper Primary School, H=High School
Source: Hand Book of Statistics, East Godavari District, 2010

EIA Report for installation of dual 14” sub-sea pipeline and umbilical for Odalarevu facility
Asian Consulting Engineers Pvt. Ltd. 3-54
Photo Plate 3.36: BVC Engineering College at
Odalarevu village
Photo Plate 3.37: Primary School at
Makanapalem village
Photo Plate 3.38: High School at Poonamada village
3.5.5 Health Care Facilities
All the Revenue Villages have primary health care centre under National Rural Health
Mission (NRHM). Komarigipatnam village have homeopathy medical facility and there is one
animal hospital in Allavaram village. General ailments prevailing in the area are malaria, lung
infection, joints pain, fever, diarrhea etc. The medical facilities in mandals are given in Table
3.38.
Table 3.42: Medical facilities in Mandals
S.
No. Mandal
Medical Facilities
Hospitals P.H.Cs Govt.
Dispensaries Others Total Doctors Beds
1 Mamidikuduru 0 1 1 0 2 3 6
2 Razole 0 1 0 0 1 1 6
3 Malikipuram 0 1 0 0 1 2 6
4 Allavaram 0 1 1 0 2 6 6
5 Uppalaguptam 0 2 0 0 2 3 6
Total 0 6 2 0 8 15 30
Source: Hand Book of Statistics, East Godavari District, 2010

EIA Report for installation of dual 14” sub-sea pipeline and umbilical for Odalarevu facility
Asian Consulting Engineers Pvt. Ltd. 3-55
3.5.6 Drinking Water Facility
Drinking water facility provided by Municipal Corporation under the Rural Water Scheme
(RWS) and Panchayat Water Scheme (PWS). Some of the villages have ponds and open
wells, which are used for drinking water purpose. Kesanapalli village have RO plant, “Suzala
Jeevdhara” for providing safe drinking water within the village and their habitations. Drinking
water facilities in mandals is given in Table 3.39.
Table 3.39: Drinking Water Facility in Mandals
S.No. Mandal Drinking water facility
P.W.S Bore Wells Open Wells Others
1 Mamidikuduru 8 0 0 0
2 Razole 7 60 0 0
3 Malikipuram 0 0 0 0
4 Allavaram 5 17 2 0
5 Uppalaguptam 7 30 0 0
Total 27 107 2 0
Source: Hand Book of Statistics, East Godavari District, 2010
3.5.7 Communication Facilities
All the villages are accessible through roads, either pakka or kachha. Given below in Photo
Plate 3.43 is the usual construction of bus stops in the region while Photo plate 3.39 to 3.40
depicts the condition of majority of road condition in the area.
Photo Plate 3.39: Allavaram to Bendamurlanka
Village
Photo Plate 3.40: Road Conditions in
Mamidikuduru Mandal
3.5.8 Post, Telephone & Electricity Facilities
Most of the villages in the study area are connected with landline telecommunication facilities
and also they have the accessibility to cell phones. Post offices are available in almost every
village. Almost all the villages have the electricity. Every village in the study area face 50 to
60% power cut problem. The post offices and telephone connections in study area (mandal-
wise) is given in Table 3.40 and 3.41.

EIA Report for installation of dual 14” sub-sea pipeline and umbilical for Odalarevu facility
Asian Consulting Engineers Pvt. Ltd. 3-56
Table 3.40: Post Offices in Mandals
S.
No. Mandal
Post Offices
Head
Post Offices
Sub-
Offices
Branch
Office Total
1 Mamidikuduru 0 1 14 15
2 Razole 1 4 11 16
3 Malikipuram 0 2 12 14
4 Allavaram 0 3 13 16
5 Uppalaguptam 0 0 13 13
Total 1 10 63 74
Source: Hand Book of Statistics, East Godavari District, 2010
Table 3.41: Telephone Connections in Mandals
S.
No. Mandal
Telephones
Telephone
Connections
No. of
Exchange
1 Mamidikuduru 2562 3
2 Razole 3701 2
3 Malikipuram 3712 4
4 Allavaram 2197 3
5 Uppalaguptam 1912 4
Total 14084 16
Source: Hand Book of Statistics, East Godavari District, 2010
3.5.9 Architectural Monuments
The study area has one archaeological site, Buddha Stupa in Adurru Village. The stupa was
constructed during the time of Emperor Ashoka. In 1955, Buddha Stupa was declared as a
protected monument by Archaeological Department of India. The aerial distance between the
stupa and Odalarevu onshore facility is approximately 7 km which is shown in Figure 3.22.
Photo Plate 3.41 shows the Buddha Stupa in Adurru Village.
Figure 3.22: Aerial distance between the Buddha Stupa and Odalarevu onshore facility

EIA Report for installation of dual 14” sub-sea pipeline and umbilical for Odalarevu facility
Asian Consulting Engineers Pvt. Ltd. 3-57
Photo Plate 3.41: Buddha Stupa in Adurru Village
3.5.10 Environmental Concern
The ACE team through their field observations and public interactions found few minor
environmental concerns in the study area. It was observed that these concerns are more in the
coastal villages. They are listed in Table 3.42 below:
Table 3.42: Environmental Concerns
Comments Village Name
Degradation of air quality Mogallamuru, Odalarevu
Degradation of drinking water quality Karvaka, Antervedipalipalem, Mogallamuru, Odalarevu
Ground water is salty Makanapalem, Karavaka, Komaragiripatnam, Odalarevu
Soil Quality Degradation Karvaka, Komarigipatnam, Odalarevu
Decrease in fish catch Karvaka, Antervedipalipalem, Odalarevu
Source: Local Enquiry and field investigation
Based on the analytical results of air, soil, surface and ground water quality, it is observed that
the values of PM10, PM2.5, SOX and NOx) are within the prescribed standards, Hence, the
quality of air is better in the study area due to the absence of major emission source and the
area is well covered with plantation. The soil is moderately alkaline at coastal villages due to
proximity to the marine water. Similarly, the water quality in respect of total dissolved solids
and hardness is higher in those villages, which are located near to river & sea confluence
point and near to coast.
3.5.11 Man animal conflict
There is no such major incident of man-animal conflicts. Some instances of man-animal
conflict were discovered during the public interactions during the field visit. They are listed
below in Table 3.43.
Table 3.43: Man-Animal Conflict
Comments Village Name
Snake and scorpion bites during work in field Allavaram, Odalarevu, Mogallamuru, Adurru,
Turupalem, Komaragiripatnam, T.Challapalle,
Mulkipalli
Photo Plate 3.42 to 3.55 picturises the field surveys carried out in and around the study area
to assess and understand the baseline environment and socio-economic profile.

EIA Report for installation of dual 14” sub-sea pipeline and umbilical for Odalarevu facility
Asian Consulting Engineers Pvt. Ltd. 3-58
Photo Plate 3.42: Interaction with Fishermans
in Odalarevu Fish Landing Centre
Photo Plate 3.43: Discussion with Villagers in
Odalarevu Village
Photo Plate 3.44: Discussion with villagers in
Mogallamuru Village
Photo Plate 3.45: Interaction with
Fishermans in Antaravedi Pallipalem Village
Photo Plate 3.48: Discussion with
T.Challapalle Panchayat Members
Photo Plate 3.49: Discussion with
Komarigipatnam Panchayat Members
Photo Plate 3.46: Discussion with villagers in
Karavaka Village
Photo Plate 3.47: Interaction with villagers in
Turupalem Village

EIA Report for installation of dual 14” sub-sea pipeline and umbilical for Odalarevu facility
Asian Consulting Engineers Pvt. Ltd. 3-59
Photo Plate 3.50: Discussion with canal fishing
fishermen
Photo Plate 3.51: Discussion with Villagers in
N.Rameshwaram Village
Photo Plate 3.52: Interaction with villagers in
Mulkipalli Village
Photo Plate 3.53: Discussion with Kesanapalli
Panchayat Members
Photo Plate 3.54: Discussion with Villagers and
Village Revenue officer in Adurru Village
Photo Plate 3.55: Discussion with
Amalapuram revenue division office members

EIA Report for installation of dual 14” sub-sea pipeline and umbilical for Odalarevu facility
Asian Consulting Engineers Pvt. Ltd. 4-1
ANTICIPATED ENVIRONMENTAL
IMPACTS & MITIGATION
MEASURES
4.1 INTRODUCTION
This section presents the likely impacts identified and recommends mitigation measures based
on the analysis of the information collected from the following:
Project information provided by ONGC (described in Section 2)
Baseline information and reconnaissance visits of the area (described in Section 3)
ACE’s past experience in similar projects; and
Standard international environmental protection and management practices in Oil and
Gas sector.
Actual and foreseeable events, including operational events and typical events are discussed
in this section. Processes that may create risks to the natural environment are considered first
and are analysed in terms of key potential environmental impacts which are covered in this
chapter. Information is also provided on proven existing management techniques for
minimising the impact due to project activities.
The anticipated qualitative potential impacts related to the proposed project activities and risk
interaction based on the environmental sensitivities/ resources available in the project area
and surroundings has been provided in interactive matrices in this chapter.
The impact analysis performed is intended to cover the impacts due to installation and
operation of sub-sea and onshore pipeline for evacuation of gas from Vashishta and S-1 fields
to Odalarevu Terminal.
Based on the proposed project activities and the baseline information provided in Chapter 3,
the activities have potential to impact the following environmental resources:
Table 4.1: Identification of Potential Impacts: Activities –Impacts/Risks Interaction
Environmental Sensitivities
Physical Biological Socio-Economic
Impacts/ Risks
Activities
Air
Q
ual
ity
No
ise
Wat
er Q
ual
ity
So
il Q
ual
ity
Sed
imen
t Q
ual
ity
Ter
rest
rial
Flo
ra a
nd
Fau
na
Aq
uat
ic F
lora
an
d F
aun
a
Fis
her
y
Occ
up
atio
nal
Exp
osu
re &
Gen
eral
Saf
ety
Eco
no
my
Site Preparation & Pipeline Installation
Pipeline Operation
Atmospheric emissions
Noise levels
4

EIA Report for installation of dual 14” sub-sea pipeline and umbilical for Odalarevu facility
Asian Consulting Engineers Pvt. Ltd. 4-2
Environmental Sensitivities
Physical Biological Socio-Economic
Impacts/ Risks
Activities
Air
Q
ual
ity
No
ise
Wat
er Q
ual
ity
So
il Q
ual
ity
Sed
imen
t Q
ual
ity
Ter
rest
rial
Flo
ra a
nd
Fau
na
Aq
uat
ic F
lora
an
d F
aun
a
Fis
her
y
Occ
up
atio
nal
Exp
osu
re &
Gen
eral
Saf
ety
Eco
no
my
Wastewater generation Solid/Hazardous waste generation Transportation of personnel and material
Socio-economic impacts
Note: denotes likely impact denotes positive impact
Based upon the above interaction matrices following potential impacts have been identified:
A. Physical
Air Quality
Noise
Water Quality
Sediment and Soil Quality
B. Biological
Terrestrial Flora and Fauna
Aquatic Flora and Fauna
C. Socio-economic
Fishery
Occupational Exposure & General Safety
Economy
4.2 IMPACT PREDICTION
4.2.1 Air Environment
Construction Phase
The air environment is likely to get affected due to emission of particulate matter during pipe-
laying works (involving activities such as earth moving, excavation etc) on land, generator
sets and vehicles operating. However, the impacts due to construction phase shall be
temporary, marginal and shall be restricted to the construction site and immediate environs.
With increase in distance, these impacts shall be considered insignificant due to dilution of
finer particles and settlement of larger particulate matter.
Operation Phase
Air quality is likely to get affected due to emissions from generator sets and vehicles
operating during the maintenance period of the operational phase. Impact to the air quality
during operational phase of the pipeline may also be attributed to gas leakages from onshore

EIA Report for installation of dual 14” sub-sea pipeline and umbilical for Odalarevu facility
Asian Consulting Engineers Pvt. Ltd. 4-3
pipelines. However, adoption of good design, construction and operational practices shall
minimize the risk of gas leakages and reduction of air pollution.
4.2.2 Impact on Noise Quality
Construction Phase
Noise generated from the operation of generator sets, construction machinery, earth work
equipments, digging, pipe handling, vehicles movement etc during construction and
installation phase of onshore and offshore pipeline may affect the land environment.
However, impacts due to these activities have been envisaged to be local, marginal and shall
last for shorter duration of time. Impacts on marine fauna due to these sources shall be
insignificant. However, marine fauna has been envisaged to be temporarily and marginally
affected due to under water sound generated from the equipments such as flowlines and
subsea valves during installation phase of the offshore pipeline.
Operation Phase
Noise impacts due to movement of heavy vehicles, medium vehicles and automobiles during
operational phase of the pipeline shall be marginal to be considered for their impacts on
nearby human settlement. However, good conditions of road shall minimize the impact of
transportation generated noise.
Marine fauna is also likely to get affected due to noise generated from the transportation
vessels and ships. However, these impacts shall not cause any physical damage to the marine
organisms as the propagation of sound through water is generally affected by spreading
(distance) losses and attenuation (absorption) losses with sound energy decreasing with
increasing distance from the source. Moreover, it is also evident that marine organisms get
gradually accustomed to the predictable noise levels from ships and transportation vessels that
follow a constant source. Therefore, the impacts on the marine fauna shall be temporary and
low.
4.2.3 Impact on Water Quality
Construction Phase
Sources of surface and ground water contamination due to onshore pipeline installation and
operation may be attributed to discharge of construction wastewater, domestic wastewater
(sewage water, wastewater from kitchen, laundries, etc), surface run-off from construction
site and discharge of hydro test water utilized during precommissioning phase of pipeline.
However, it has been envisaged that water quality degradation due to these sources shall be
negligible as wastewater generated from construction activities; kitchen and toilets shall be
subjected to appropriate treatment to meet the stipulated standards prior to its final disposal.
The treated wastewater shall be used for irrigation purpose to the maximum extent.
Precautionary measures shall be adopted to mitigate the risk of water contamination due to
run off. Apart from this, hydro test water shall be collected and reused for multiple tests.
Offshore installation of pipeline has been envisaged to cause short term and local increase in
turbidity levels due to disturbance of seabed sediments. Displacement of sea bed sediments
may lead to oxidation of anoxic intertidal and offshore mud. This shall lead to local chemical
changes in water quality by a subsequent decrease in pH (due to oxidation of sulphides to
sulphate) and increase in BOD levels. However, these impacts have been envisaged to be
local and temporary and water is expected to regain its original characteristics.

EIA Report for installation of dual 14” sub-sea pipeline and umbilical for Odalarevu facility
Asian Consulting Engineers Pvt. Ltd. 4-4
Operation Phase
The potential impacts on water quality during operational phase of the pipeline may be
attributed to usage of maintenance and cleaning chemicals such as corrosion inhibitor, scale
inhibitors and mono-ethylene glyol, which shall be subjected into the pipeline at the platform
and will be discharged at the produced water discharge point from the gas terminal. The
anticipated extent of water pollution level in marine water through this discharge will be very
less. However, this risk shall be mitigated by formulation of waste management plan, wherein
wastewater generated from operational activities of the project shall be subjected to suitable
treatment prior to its final disposal.
4.2.4 Impact on Sediment and Soil Quality
Construction Phase
Temporary and short term disturbance to soil ecology and top soil loss may occur during land
clearance, earth works, site grading and other construction activities for onshore pipeline
installation. However, these impacts shall be minimized by separate stockpiling of top soil
layer, which shall be utilized in backfilling of the trench to restore the original soil conditions.
Contamination of soil environment may also result from release of hazardous wastes such as
leakage of diesel oil from generator sets and vehicular movement. However, suitable safety
and control measures shall be adopted to mitigate the risk of soil contamination from these
sources.
Impacts on marine sediments will be largely during installation of sub-sea pipeline.
Installation of pipeline shall cause localized disturbance to sea bed sediments. Physical
obstruction owing to installation of pipeline shall lead to local change in hydrology and sea
bed morphology.
Operation Phase
Operation phase of the pipeline is likely to cause contamination of soil and sediments due to
discharge of chemicals such as cleaning agents and degreasing solvents. However, these
impacts shall be reduced to minimal by ensuring appropriate collection and disposal methods.
4.2.5 4.2.5 Ecological Impacts
Construction Phase
Impact on terrestrial flora and fauna may occur due to changes in habitat or habitat
modification during land clearance activity in construction phase. However, this activity shall
be restricted to limited land area and therefore the impact shall be local and minimal.
Moreover, it was found during the survey that owing to be an expansion project, the site is
already clear from any type of wildlife habitation. Hence, reducing the possible impact on the
local environs. Emission of particulate matter during onshore construction activity is also
likely to impact terrestrial ecological environment. However, these impacts have been
envisaged to be low as the construction phase is a temporary phase. Impacts on terrestrial
environment due to emissions from operating generator sets and vehicles have been envisaged
to be negligible as suitable mitigation measures shall be adopted to minimize the impacts
from these sources.
Noise generated from construction activities, operation of equipments, machinery and
vehicles shall have negligible impacts on terrestrial fauna.

EIA Report for installation of dual 14” sub-sea pipeline and umbilical for Odalarevu facility
Asian Consulting Engineers Pvt. Ltd. 4-5
Significant impacts on terrestrial flora and fauna shall also occur due to dumping of solid
waste and wastewater discharges from construction and operation of the pipeline. However,
these impacts shall be minimized by adoption of waste management plan, wherein solid waste
and wastewater generated shall be subjected to appropriate treatment prior to their final
disposal.
Impacts to marine ecology are likely to occur during installation phase of the subsea pipeline.
Installation of the sub sea pipeline shall cause physical obstruction to marine organisms and
displacement of marine species in immediate vicinity leading to direct habitat loss and
modification of regional species. It may also affect the benthos in the vicinity leading to their
destruction, smothering or displacement. Although, impacts during initial phase of pipeline
installation have been envisaged to be significant but owing to adaptable nature of marine
organisms, the region is likely to regain its ecological stability within short span of time.
Marine fauna is also likely to get affected due to noise generated from the transportation
vessels and ships during installation and operational phase of the pipeline. However, it has
been envisaged that these impacts shall not cause any physical damage to the marine
organisms as the propagation of sound through water is generally affected by spreading
(distance) losses and attenuation (absorption) losses with sound energy decreasing with
increasing distance from the source. Moreover, it is also evident that marine organisms get
gradually accustomed to the predictable noise levels from ships and transportation vessels that
follow a constant source. Therefore, the impacts on the marine fauna shall be temporary and
low.
Operation Phase
Impacts on terrestrial environment due to emissions from operating generator sets and
vehicles during maintenance period have been envisaged to be negligible as these are
temporary and suitable mitigation measures shall be adopted to minimize the impacts from
these sources.
Gas leakages during pipeline operation may impose adverse impacts to the marine
environment. However, adoption of good design, construction and operation practices shall
mitigate the risk of gas leakages.
4.2.6 Impact on CRZ
The proposed pipeline route at Odalarevu, East Godavari District is near to shoreline and
comes under Coastal Regulation Zone. The project area is characterized by different coastal
geomorphological features like smaller spits, shoals, offshore bars etc. Shoreline is not a fixed
line and its position is dynamic as the change in the shoreline is a natural phenomenon
because of the suspension of sediment and transportation of the same due to current (littoral
drift) during the monsoon season and deposition in calm non-monsoon season. If this natural
cycle is disturbed by anthropogenic intervention, an unbalanced sediment transport cycle will
occur, which may lead to an unusual and irreversible shoreline dynamic.
Cyclones and storm surges frequently affect the district coastline accompiying with high rate
of erosion. Considering the total of 757 km coastline of AP is under accretion and out of 344
km of coastline is under erosion, 239 km is under low erosion and 105 km of the coastline
under high erosion.
[Source: 1. Ministry of Earth Sciences, ICMAM Project Directorate, Chennai and Indian
National Centre for Ocean Information Services (INCOIS), Hyderabad (October 2009) Report

EIA Report for installation of dual 14” sub-sea pipeline and umbilical for Odalarevu facility
Asian Consulting Engineers Pvt. Ltd. 4-6
on use of Satellite data for detection of violation of land use along the Coastal Regulation
Zone and Impact of Port structures on Shoreline changes
2. Kumari P. Dr. (2012) Shoreline morphometric change analysis using Remote sensing and
GIS in the coastal part of East Godavari District, Andhra Pradesh, India. International
Journal of Civil Engineering applications Research Volume 03 (Issue 02) 129-136]
The satellite imagery in the coastal stretch of study area was carried out for detailed analysis
of shoreline changes Asian Consulting Engineers Pvt. Ltd. for a period of 32 years (1977 to
2009). Objective was to assess the condition and nature of the shoreline in the project stretch.
The Shorelines are extracted using satellite imageries dated 1977 (LANDSAT MSS), 1989 &
2000(LANDSAT TM 4-5) and 2009 (LISS III). The comparative analysis of the
chronological study of shorelines reflects that the changes is inward i.e. erosion effect is
dominant for this area. After 1989, Accretion Effect is observed to the west of the river. But
the shoreline near the project site has been eroded and shoreline is shifted about 450-480 m
during the 32 years as shown in Figure 4.1. Table 4.2 shows the changes in shoreline for a
span of 32 years (1977 to 2009).
Figure 4.1: Satellite Images Showing the Shoreline of the Project Site
In 1977-1989, 1989-2000 and 2000-2009

EIA Report for installation of dual 14” sub-sea pipeline and umbilical for Odalarevu facility
Asian Consulting Engineers Pvt. Ltd. 4-7
Table 4.2: Shoreline shift (in Meters) near project site from 1977 to 2009
Year 1977 1989 2000 2009
1977 0 (+) 200 to
(+) 230 m
(+) 220 to
(+) 250 m
(+) 450 to
(+) 480 m
1989 0 (+)20 to
(+)25 m
(+) 220 to
(+) 250 m
2000 0 (+) 250 to
(+) 270 m
2009 0
*Erosion (+), Accretion (-)
4.2.7 Socio-Economic Environment
The proposed project is likely to have the following impacts on the existing socio-economic
profile of the area:
The proposed activity shall generate employment in the region due to the requirement of
workers for supply and transport of equipment, auxiliary and ancillary works etc. This
shall give temporary relief to the people of the locality and their socio-economic
conditions shall improve.
The activities shall also result in enhancement of the local skill levels through exposure to
project activities and technology and shall help in capacity building for future
employment opportunities.
The project shall facilitate infrastructure development, improvement of transportation and
communication facilities in the area, which will further improve the standard of living.
The project activities shall negatively affect the fish catch and fish quality of the region.
However, the impacts have been envisaged to be temporary and shall not irreversibly
hamper fish activity and fish quality of the region.
4.3 IMPACT EVALUATION
Emissions from the construction phase of proposed project shall be minimal and temporary
and therefore the impacts on air quality during this phase will not be of much significance.
Also, the net impacts of fugitive emissions from the generator sets and vehicular movement
has been anticipated to be marginal due to the adoption of suitable mitigation measures.
Moreover, the impacts due to secondary pollutants in the region have been envisaged to be
negligible as the terrain is plain and sufficient amount of atmospheric mixing is available in
the region. Thus, the point and fugitive emissions are not likely to affect human health and
vegetation.
The impact of noise on nearby villages due to proposed project activities shall be
insignificant as the nearest habitation is about 1km away from the site. Noise level during
construction activities has been envisaged to increase in and around the onshore project site
but the impacts shall be considered low as the construction phase is a temporary phase, which
shall last for shorter duration of time. Underwater noise is likely to be generated due to the
usage of equipments (such as flowlines and subsea valves) and movement of transportation
vessels and ships. However, the impact of noise on marine fauna is expected to be marginal
and local as the noise levels is likely decay with increasing distance from the source.
Moreover, the marine organisms show avoidance reaction to larger vessels and high noise

EIA Report for installation of dual 14” sub-sea pipeline and umbilical for Odalarevu facility
Asian Consulting Engineers Pvt. Ltd. 4-8
generating sources and therefore, are unlikely to intentionally approach towards them. Hence,
no physical damage has been anticipated on the marine organisms.
Impacts on surface and groundwater quality has been envisaged to be insignificant as the
wastewater and solid waste generated from the project activities shall be treated to meet
requirements of stipulated standards prior to its disposal. The treated water shall be reused to
maximum extent. It has also been envisaged that there will be no changes in groundwater
quality due to proposed facility as the ground water is already saline and not fit for drinking
purpose. Offshore installation of pipeline shall temporarily increase the turbidity levels of the
local marine environment. However, the region is expected to regain its original
characteristics in short span of time.
The proposed project shall temporarily affect the soil environment due to minimal land
clearance and other construction activities during onshore pipeline construction and
installation. However, suitable measures shall be adopted to restore the original site
conditions. Disturbance to sea bed sediments is also likely to occur during installation of
offshore pipeline. However, these impacts shall be temporary and the sea bed is likely to
regain its original stability in short span of time.
The net impacts on terrestrial ecology shall be minimal and of shorter duration, mainly likely
to result from habitat loss or modifications in habitat during onshore construction activities.
Initial impacts on local marine ecology due to offshore pipeline installation are likely to be
significant. However, owing to adaptable nature of marine organisms the affected region shall
regain its original stability.
The proposed project shall have limited and temporary effect on the fishing activity and
fishermen community. However, in long term it shall prove to be beneficial in terms of
generating employment opportunities and overall development of the area.
4.4 IMPACT SIGNIFICANCE
Evaluation of impacts signifies the potential impacts in terms of its likelihood nature as per
the following criteria:
a. The impacts are further classified based on their spatial distribution, i.e. local, when
impacting an area of approximately 1 km radius from the project area, moderate spread,
when impacting an area of 1 to 2 km radius and regional beyond 2 km;
b. The impacts are classified as short term, moderate term and long term in terms of their
existence in temporal scale. Impacts less than 1 year existence as short term, while those
with 1 to 3 years as moderate term and more than 3 years as long term;
c. The negative impacts are termed as adverse impacts while positive impacts as beneficial;
The significance of environmental impacts of various involved activities has been
evaluated based on the criteria outlined in Table 4.3.
Table 4.3: Impact Significance Criteria
Impact Significance Criteria
Major Adverse When the impact is of high intensity with high spread and high
duration or of high intensity with medium spread and medium
duration.
Moderate Adverse When the impact is of moderate intensity with high spread and high

EIA Report for installation of dual 14” sub-sea pipeline and umbilical for Odalarevu facility
Asian Consulting Engineers Pvt. Ltd. 4-9
Impact Significance Criteria
duration or of high intensity with low/ moderate spread and low
duration
Minor Adverse When the impact is of low intensity but with moderate spread and
moderate duration or of moderate intensity
Insignificant Adverse When the impact is of low intensity, low spread and low duration
Beneficial When the impacts are positive
Based on the above-specified criteria, Tables 4.4 and 4.5 describes potential environmental
impacts due to proposed expansion, with or without mitigation measures respectively. It is
important to note that one activity may have varying impacts on different receptors i.e.
different components of the environment. To avoid repetitions, this section describes various
activities, which may have wide impacts on many receptors. For example, waste generation
and disposal will have impacts on land, water bodies, odour nuisance etc, therefore, the
impacts of waste generation and disposal have been considered as one of the key areas of
impacts. Similarly, gaseous emissions may be adverse to air quality; which on exposure may
impact upon health of individuals and ecology in the surroundings.
Table 4.4: Potential Environmental Impacts of Proposed Project activity
(Without Mitigation Measures)
Environmental
Sensitivities
Nature of Likely Impacts Impact
Significance
Low
Inte
nsi
ty
Moder
ate
Inte
nsi
ty
Hig
h
Inte
nsi
ty
Loca
l
Moder
ate
Spre
ad
Reg
ional
Short
Ter
m
Moder
ate
Ter
m
Long T
erm
Adver
se
Ben
efic
ial
Insi
gnif
ican
t
Min
or
Moder
ate
Maj
or
Air Quality
Noise
Water Quality
Soil Quality
Sediment Quality
Terrestrial Flora& Fauna
Aquatic Flora and Fauna
Local Economy
Note: For colour coding refer Table 4.3
4.5 IMPACT MITIGATION MEASURES
4.5.1 Air Environment
Good operational controls and high level of monitoring shall be built into the design
operational aspects of the project.
Regular maintenance of engines and generators shall be done to keep the environment
impact minimum.
Dry and dusty materials shall be stored in the containers.
Emissions during transportation shall be minimized by ensuring regular maintenance of
vehicles and marine vessels.

EIA Report for installation of dual 14” sub-sea pipeline and umbilical for Odalarevu facility
Asian Consulting Engineers Pvt. Ltd. 4-10
4.5.2 Water Environment
Wastewater generated from the construction sites shall be treated as per industry norms.
Sewage generated from onshore facility shall be treated in the Effluent Treatment Plant
(ETP). The treated effluent shall be reused for the purpose of irrigation within and around
the plant area for green belt.
Water generated from hydraulic testing of pipelines shall be discharged into sea at a
suitable location to minimise adverse impacts.
4.5.3 Noise Quality
Good working practices shall be implemented to minimize the noise levels.
Generator sets, construction machinery and other equipments shall be provided with
acoustic enclosures.
Vehicles involved in transportation of personnel and material shall be maintained
regularly.
Mobile noise sources such vessels shall be routed in such a way that there is minimum
disturbance to receptors.
Vessels to be well maintained and idling of vessels or equipment shall be avoided when
not in use.
4.5.4 Subsea infrastructure
The layout of the subsea infrastructure shall be designed to avoid sea bed features
considered to be geo-hazards. This will also protect areas with potentially more diverse
habitats and species.
Most subsea flowlines shall be laid directly on the sea bed and flowline burial using
methods such as dredging and jetting shall be avoided.
4.5.5 Impact on Ecological Environment
All precautionary measures shall be adopted to minimize the disturbance to terrestrial and
aquatic flora and fauna due to construction and installation of onshore and offshore pipeline.
The baseline information on terrestrial and aquatic flora and fauna shall be obtained from
state/district/regional level authorities in an effort to reduce the potential adverse impacts of
the project and future activities on marine mammals.
4.5.6 Waste Generation and Management
The site would develop and adopt proper system for the management, storage and disposal of
the hazardous and non-hazardous waste, including measures such as:
Solid waste consisting of recyclable waste and non recyclable generated from
construction activities, shall be segregated in appropriate bins and shall be disposed off.
Solid waste including domestic waste (from kitchen, gallery, laundries etc), combustible
and recyclable waste generated shall be collected, segregated and stored in specified
containers and shall be transferred for its disposal.
Hazardous waste such as waste lube/system oil from machinery, used oil from D.G set (in
case of operation) is likely to be generated. The waste shall be handled as per Hazardous
Wastes (Management, Handling and Trans-boundary Movement) Rules, 2008. The waste

EIA Report for installation of dual 14” sub-sea pipeline and umbilical for Odalarevu facility
Asian Consulting Engineers Pvt. Ltd. 4-11
will be carefully stored in drums and transported to MoEF approved recyclers for its final
disposal. All precautions will be taken to avoid spillage from the storage.
Table 4.5: Potential Environmental Impacts of Proposed Project activity
(With Mitigation Measures)
Environmental
Sensitivities Nature of Likely Impacts
Impact
Significance
Lo
w
Inte
nsi
ty
Mo
der
ate
Inte
nsi
ty
Hig
h
Inte
nsi
ty
Lo
cal
Mo
der
ate
Sp
read
Reg
ion
al
Sho
rt T
erm
Mo
der
ate
Ter
m
Lo
ng
Ter
m
Ad
ver
se
Ben
efic
ial
Insi
gn
ific
an
t
Min
or
Mo
der
ate
Maj
or
Air Quality
Noise
Water Quality
Soil Quality
Sediment Quality
Terrestrial Flora &
Fauna
Aquatic Flora & Fauna
Local Economy
Note: For colour coding refer Table 4.3

EIA Report for installation of dual 14” sub-sea pipeline and umbilical for Odalarevu facility
Asian Consulting Engineers Pvt. Ltd. 5-1
ENVIRONMENT
MONITORING PROGRAM
5.1 INTRODUCTION
An environmental monitoring program provides a delivery mechanism to monitor any adverse
environmental impacts of a project during its execution/operation, to enhance project benefits,
and to introduce standards of good practices to be adopted for all project works. An
environmental monitoring program is important as it provides useful information and helps
to:
Assist in detecting the development of any unwanted environmental situation, and thus,
provides opportunities for adopting appropriate control measures;
Define the responsibilities of the project proponents, contractors and environmental
monitors and provides means of effectively communicating environmental issues among
them;
Define monitoring mechanism and identify monitoring parameters;
Evaluate the performance and effectiveness of mitigation measures proposed in the
Environment Management Plan (EMP) and suggest improvements, if required; and
Identify training requirement at various levels.
An environmental monitoring program is suggested to monitor environmental parameters
during the project period Table 5.1 below.
Table 5.1: Recommended Environmental Monitoring/Audit Protocol-During Site
Preparation and Installation of Pipeline
Receptor Location Monitoring
Mechanism
Monitoring and
Reporting
Frequency
Water
Quality Surface water and
ground water sources at
and nearby onshore
project site.
Marine water Quality at
every 3 km stretch along
the offshore pipeline
and locations within
1km radius of the
pipeline.
pH, conductivity, TSS,
TDS, heavy metals,
BOD, COD, Oil &
Grease etc.
Monthly
Noise
Levels
At project site and three
locations within 500 m of
the project site
Noise level
monitoring;
Machineries
maintenance;
Use of ear plug by
workforce
At hourly interval
for 24 hrs. Machine
maintenance may
be done once in a
week
5

EIA Report for installation of dual 14” sub-sea pipeline and umbilical for Odalarevu facility
Asian Consulting Engineers Pvt. Ltd. 5-2
Receptor Location Monitoring
Mechanism
Monitoring and
Reporting
Frequency
Soil
Quality
At Onshore project site pH, , moisture content,
Texture, oil & grease and
Organic matter
Monthly
Sediment
Quality
At offshore project site Texture, Organic matter,
Nitrogen, Phosphorous,
oil & grease and Heavy
metal concentration
Monthly
The post operational monitoring programme will be under the supervision of the ONGC and
the monitoring shall be get carried out by recognized laboratories/ institutions/by ONGC.

EIA Report for installation of dual 14‖ sub-sea pipeline
and umbilical for Odalarevu facility
Asian Consulting Engineers Pvt. Ltd. 6-1
ADDITIONAL STUDIES
6.1 INTRODUCTION
As discussed is earlier chapters, Oil & Natural Gas Corporation Limited (ONGC) is currently
involved with the exploration in several deep sea fields off the east coast of India. As a part of
the overall development plan, ONGC intends to develop the Vashishta and S-1 fields off the
east coast of India through development activity on an integrated basis to produce gas within
the shortest feasible time in the Krishna–Godavari (KG) Offshore Basin.
The gas from Vashishta and S-1 fields shall be transported through dual 14‖ subsea pipelines
to the new onshore terminal at Odalarevu. The new onshore processing terminal at Odalarevu
will be located adjacent to the existing onshore processing terminals. The layout of the
proposed pipeline route is given in Figure 6.1.
This chapter includes the studies of risk assessment, disaster management plan and
emergency response plan in following sections.
Figure 6.1: Layout of the proposed pipeline route
6
EIA Report for installation of dual 14‖ sub-sea pipeline
and umbilical for Odalarevu facility
Asian Consulting Engineers Pvt. Ltd. 6-2
6.2 Subsea Pipeline and Onshore Pipeline
a) Subsea pipe line for transfer of NG product from Wells to ‘landfall point’
Pipeline routing will follow the existing G1 pipeline system as much as possible and therefore
has a minimal impact on the seabed and surrounding environment. The system has been
designed so that pigging can be undertaken fromonshore; this negates the need to for offshore
intervention and therefore reduces the overall operating carbon footprint of the asset.
The use of horizontal trees means that a light intervention vessel is required for any well work
over rather than a drill rig. This saves on vessel mobilization and therefore assists in
maintaining a minimal carbon footprint.
Daisy chain development with midline tees and crossovers located at S1 wells, VA-DB and
PLETs at VA-DA. PLEM at VA-DB will allow pigging for future expansion.
The pipeline has been split into two sections for determination of wall thickness: subsea and
landfall. The landfall section of pipe has higher integrity requirements and therefore higher
wall thickness. Maintaining a constant bore through the pipeline (to allow for pigging) is
preferable. Hence, pipe with non-standard outer diameter is selected for the Subsea pipeline
(2 X 14‖ pipelines of 45 km long; including infield sub-sea architecture –subsea umbilical).
Subsea Pipeline details:
Pipeline Length (m) : ~43,000
Design Capacity : 6 MMSCMD
Maximum Design Temperature (oC) :65
Minimum Design Temperature (oC) : -75
Design Pressure (barg) : 255
Operating Pressure : ~ 60 bar G
b) Onshore Pipeline details:
Pipeline Length (m) : ~4,200
Pipeline Length (Dia. ’’) : 14
Design Capacity : 6 MMSCMD
Maximum Design Temperature (oC) : 30
Minimum Design Temperature (oC) : 15
Operating Pressure (Receiving) : ~ 9 to 24 bar G
Operating Pressure (Discharge) : ~ 67.5 bar G
2.5 meters burial and 60mm concrete coating up to 27 meters water depth. This
will be approximately up to two thirds of the way along the first leg of the
pipeline.
2.5 meter burial and 60mm concrete coating up to 79 meters water depth. This is
just after the first deviation away from the G-1 pipelines
30mm concrete coating up to 200 meters water depth.
3LPP coating and surfaced laid for the remainder of the development.
2.5 meters burial for the onshore section. [Additional precautions may be taken if
any railway or road crossings are involved.]

EIA Report for installation of dual 14‖ sub-sea pipeline
and umbilical for Odalarevu facility
Asian Consulting Engineers Pvt. Ltd. 6-3
For the first two stages, the pipeline is protected against the likely forms of risk (on shore-
surface movement of man/ vehicle; off shore- Coastal movement of crafts/fishing vessels). As
the water depth increases the protection provided is mainly against mechanical risks such as
fishing gear and dropped objects. Once the water depth is greater than 200metres the overall
risk to the field is as low as reasonably practicable and therefore no additional protection is
provided.
6.3 RISK ASSESSMENT
Hydrocarbon operations are generally hazardous in nature by virtue of intrinsic chemical
properties of hydrocarbons or their temperature or pressure of operation or a combination of
them. Fire, explosion, hazardous release or a combination of these are the hazardous
associated with hydrocarbon operations. These have resulted in the development of more
comprehensive, systematic and sophisticated methods of safety engineering such as
identification and analysis of hazards and Risk assessment to improve upon the integrity,
reliability and safety of hydrocarbon operations.
The RA studies are based on Quantative Risk assessment Analysis (QRA). The analysis based
on ALOHA (Aerial locations of Hazardous Atmosphere), which is developed jointly by
NOAA and the environment protection agency (EPA), US. ALOHA is a program designed to
model chemical release for emergency responders and planners. It can estimate how a toxic
cloud might disperse after a chemical release & also features served fires & explosions
scenarios. A sample sheet of QRA modeling analysis of S-1 and VA is given in Annexure-
XIV.
6.3.1 Hazards - Nature and sensitivity of impact zones
Subsea Pipeline:
1) Natural hazards - Landslides
The generation of landslides that could potentially affect the pipeline integrity has
beenqualitatively evaluated at the outset of the project for the entire pipeline route. It was
concluded that the pipelines are not threatened by landslide. The occurrence of a landslide is
due to the coexistence of various conditions such as:
Thick layers of very soft sediments lying on steep slopes
Slope angles able to trigger the development of soil instability
Triggering mechanisms causing the landslides (e.g. seismic loads, wave loads, rapid
accumulation of soft sediments)
No such conditions have been found along the pipeline routes. In addition the proposed
pipeline support system is designed after conducting on-bottom stability tests and maximum
free span lengths totake care of the subsea soil erosion (if any) and regular inspection of
pipeline route will caution of any likely damage.
2) Natural hazards - Extreme Storm
The following met ocean design conditions are used for the detailed design of the system
Seasonal and whole year directional extremes of wind, waves and currents
Directional significant wave height
Wave and current climate for fatigue analysis

EIA Report for installation of dual 14‖ sub-sea pipeline
and umbilical for Odalarevu facility
Asian Consulting Engineers Pvt. Ltd. 6-4
Air temperature extremes and climate at landfall locations
Persistence of storm and calm conditions for onsite operations
Variability of the sea level
Hydrological sea water parameters (temperature, salinity and density)
Bay of Bengal is known for rough weather; since the production operational system and
Subsea pipeline will be near the sea bottom, it is unlikely to be affected much with rough
weather.
3) Heavy Impact and Damage to pipeline due to dropping of heavy objects
A situation is considered for the risk assessment for the impacts on ―Subsea Pipeline‖ by
heavy falling objectsfrom otherdrill ships or other marine vessels working nearby or passing
by it.
The following possibilities have been taken into consideration:
Vessels which passes through the pipeline route may accidently release some heavy
objects/ anchors and it hits the Pipeline.
Consequences and Effects
The analysis of consequences is generally based on the principle of conservation ofenergy.
The impact of a complete contact with the object may however be more severe and may lead
to damage to the pipeline such as rupture or leak from the pipeline resulting in a process leak.
Risk Ranking
Likelihood Ranking - C
Consequence Ranking - 3
Risk Ranking - 3C (Medium)
KG Basin Operations:
Any heavy pipeline leakage (if occurs) at a depth of ~ 250 - 600 m and at maximum pressure
(nonoperation; design) of 3242 psia (220 atm.). This will cause tremendous stirring/ agitation
at sea bottom/may result in shock waves causing damage to adjoining (pipeline) installations
and also to nearby installations. The high pressure gas will be directed as jet in the direction
of leaky point and rise to the surface and will blow out as gas / water shower combination. It
may catch fire also (less likely as it is with sea water and cool) and burn. The gas rate can be
very large (depending well pressure and other pipeline /operational conditions)
Onshore Pipeline:
Onshore pipeline will be laid at a depth of ~ 2.5 m. The line may pass through inhabited areas
(uninhabited now but may get inhabited after some period) and also some road / railway
crossings may come later. Any opening in the operating pipe line (due to any damage or any
other cause) will result in gas leakage.
Leaking gas will come out at pressure from underground and disperse to surface in a wide
area. The area of dispersion will depend upon depth of pipeline and weather etc. If ignition
source is found it may catch fire.

EIA Report for installation of dual 14‖ sub-sea pipeline
and umbilical for Odalarevu facility
Asian Consulting Engineers Pvt. Ltd. 6-5
6.3.2 Failure Scenarios (Likely)
Subsea Pipeline
Subsea pipeline will be laid at sea surface at a depth varying from > 600 m to shore. The sea
water will exert pressure on the line which can be as high as 60 bars. Any opening in the
operating pipe line (due to any damage or any other cause) will result in gas leakage.
Leaking gas will disperse (to some extent) due to wave motion and come to surface in a wide
area. The area of dispersion will depend upon depth of pipeline, current / sea roughness,
weather etc. However for modeling (60 %) part of the leakage have been considered as
concentrated at one place and catch fire,
The rate of leakage will depend upon pipe line pressure, depth and opening size. Considering
these key parameters four scenarios /cases are envisaged.
Onshore Pipeline
Onshore pipeline will be 2.5 m buried. Additional precautions may be taken if any railway or
road crossings are involved. Any leakage in the pipeline (if small) will seep through soil and
come out and catch fire if any source of ignition is there. It may start domino effect if any
other inflammable material is there (dry grass or else). In case of major damage and
consequential fire the heat radiation zone can be large as given below.
For modeling purpose worst possible conditions (line pressure 220 atm. and 60 atm. is taken)
which may occur due to major system failure.
Scenario 1.
a. Pipe Line opening (Leakage source)~ 50% of inlet cross section; Vertical
b. Depth ~ 500 m
c. Line Pressure ~ 220 bar
Scenario 2.
a. Pipe Line opening ~ 50% of inlet cross section; Vertical
b. Depth ~ 500 m
c. Line Pressure ~ 220 bar
Scenario 3.
a. Pipe Line opening ~ 50% of inlet cross section; Vertical
b. Depth ~ 500 m
c. Line Pressure ~ 60 bar
Scenario 4.
a. Pipe Line opening ~ 50% of inlet cross section; Vertical
b. Depth ~ 300 m
c. Line Pressure ~ 60 bar
Scenario 5.
a. Pipe Line opening ~ 50% of inlet cross section; Vertical
b. Depth ~ 200 m
c. Line Pressure ~ 60 bar

EIA Report for installation of dual 14‖ sub-sea pipeline
and umbilical for Odalarevu facility
Asian Consulting Engineers Pvt. Ltd. 6-6
Scenario 6.
a. Pipe Line opening ~ 50% of inlet cross section; Vertical
b. Depth ~ 50 m
c. Line Pressure ~ 60 bar
Scenario 7.
a. Pipe Line opening ~ 50% of inlet cross section
b. Line Pressure ~ 25 bar
Scenario
No Scenario Impact Zone Remarks
1 Pipe Line opening ~ 50% of inlet cross
section Line Pressure ~ 220 bar [Release
Pressure—170 bar
Jet fire
96 m
1st degree
burn
2 Pipe Line opening ~ 50% of inlet cross
section Line Pressure ~ 220 bar [Release
Pressure—190 bar
Jet fire
101 m
1st degree
burn
3 Pipe Line opening ~ 50% of inlet cross
sectionLine Pressure ~ 60 bar [Release
Pressure—10 bar
Jet fire
26 m
1st degree
burn
4 Pipe Line opening ~ 50% of inlet cross
sectionLine Pressure ~ 60 bar [Release
Pressure—30 bar
Jet fire
42 m 1st degree
burn
5 Pipe Line opening ~ 50% of inlet cross
sectionLine Pressure ~ 60 bar [Release
Pressure—40 bar
Jet fire
48 m 1st degree
burn
6 Pipe Line opening ~ 50% of inlet cross
sectionLine Pressure ~ 60 bar [Release
Pressure—55 bar
Jet fire
56 m 1st degree
burn
7 Pipe Line opening ~ 50% of inlet cross
section; Line Pressure ~ 25 bar
Jet fire
38 m
1st degree
burn

EIA Report for installation of dual 14‖ sub-sea pipeline
and umbilical for Odalarevu facility
Asian Consulting Engineers Pvt. Ltd. 6-7
Scenario - 1
Scenario - 2

EIA Report for installation of dual 14‖ sub-sea pipeline
and umbilical for Odalarevu facility
Asian Consulting Engineers Pvt. Ltd. 6-8
Scenario – 3
Scenario - 4

EIA Report for installation of dual 14‖ sub-sea pipeline
and umbilical for Odalarevu facility
Asian Consulting Engineers Pvt. Ltd. 6-9
Scenario – 5
Scenario - 6

EIA Report for installation of dual 14‖ sub-sea pipeline
and umbilical for Odalarevu facility
Asian Consulting Engineers Pvt. Ltd. 6-10
Scenario – 7
6.3.3 Sensitive Receptors and Impact
Any adverse incident in the proposed Subsea and Onshore pipeline can have minor or major
damage to permanent receptors if the same are coming within the impact zone. Both subsea
pipeline and Onshore pipelines are coming in ―Coastal Regulation Zone (CRZ)‖ classified as
sensitive zone as per Environment Protection Act (1986).
6.3.4 Subsea Pipeline layout impacts
The fire may occur if gas comes in contact with source of ignition.Subsea pipeline do not
have any installation nearby. Coastal movement of small vessels/ fishing will be affected.
Any off shore equipment/structure or vessel is likely affected by the fire if happened to be
within impact zone. There can be domino effect if any sensitive system (fuel transporter or
any explosive/inflammable laden vessel) gets trapped in impact zone.
6.3.5 Onshore Pipeline installation Impact Zone
The impact due to accident in the pipeline will be restricted to 56 m (1st degree burn).
Terminal may be affected if the incident occurs near the terminal and may initiate a domino
effect. However accidents resulting due to domino effect can be more serious. Since the
terminal does not have any large storage of inflammable and explosive material there cannot
be any major incident. The inhabited areas are far away (> 500 m). Existing ONGC terminal
can also be adversely affected. Nearest village isOdalarevu at a distance of 630 m from
facility.
6.3.6 Control Measures for Major Hazards
The preventive control measures to prevent/avoid occurrence of hazardous stance are given
below:

EIA Report for installation of dual 14‖ sub-sea pipeline
and umbilical for Odalarevu facility
Asian Consulting Engineers Pvt. Ltd. 6-11
A Management Plan will be formulated and implemented to reduce
contactriskforconsequential fall of heavy objects,vessel–vessel contactand will address the
following:
Mandatory 500 m safety zone around well location;
Operational restrictions on visiting vessels in bad weather;
Defined vessel no-go areas within safety zone; and agreed approach procedures by
supply and safety vessels during laying of pipeline.
6.3.7 Fire Fighting Facility
Marine firefighting and medical facilities may be created and stationed at nearest port so as to
be available during emergency for offshore pipeline and other installations.
For onshore pipeline, fire engines with other safety devices like fire suits and breathing
apparatus/first aid etc. should be stationed at onshore terminal.
6.3.8 Occupational Health
The installation and operational activities of proposed pipeline and umbilical for onshore
facility at onshore and offshore section involves many occupational health hazards to the
workers at site. Work in offshore can involve exposure to hazardous substances, noise,
vibrations, hot or cold conditions, heavy manual handling activities (both at onshore and
offshore during the handling and laying of pipes) etc. Installations especially in deep water
drilling are isolated, workforce travels to work by helicopter/vessels and perform shift duties.
Extended long distance travelling, psychologicalstress resulting from physical isolation due to
remoteness of site and shift duty pattern, seasickness and exposure to extreme weather
conditions is other hazards. Harsh climate, parasitic diseases and infections may result in
respiratory tract diseases.
ONGC will take all health and safety measures in compliance with following rules and
procedures:
Storage and handling of Hazardous Materials
TAC 1998 – Fire Protection Manual (Internal Appliances, Fire Engines, Trailer
Pumps and Hydrant Systems)
Chief Controller of Explosive Guidelines
Static & Mobile Pressure Vessels Rules
Indian Factories Act 1948 / State Factories Regulations
Gas Cylinder Rules
Indian Electricity Act / Rules
Safety Code for Transportation of Hazardous Substances
Provincial Fire Codes for Buildings
Fire Protection Manual of Tariff Advisory Committee
Petroleum and Natural Gas Rules ( Safety in Offshore operations)
Rules 2008 and OISD 233 and 118 for fire and explosion risk assessment and fire
protection/fighting systems

EIA Report for installation of dual 14‖ sub-sea pipeline
and umbilical for Odalarevu facility
Asian Consulting Engineers Pvt. Ltd. 6-12
Health Hazard Control is done by adopting following measures:
Prioritize the health hazards based on their risk potential.
Identify specific work groups affected by each hazard.
Determine the controls required to manage these identified hazards. The cost of each
identified control versus benefits of its implementation may be evaluated.
Develop an action plan identifying work to be done.
On board qualified doctor is available 24 hrs on the vesselsduring laying period for the
immediate treatment and first aid. For serious injuries and diseases, patient is evacuated by
the emergency helicopter, exclusively meant for emergencies to the nearest base.
The health and hygiene of the personnel working at the vesselsfor long period will be
monitored through periodic health checks of the persons. All employees undergo a periodic
medical examination. The record of the health check-up will be maintained centrally off site
in confidential file by the medical section. The medical officer at base recommends
appropriate treatment for the persons found to be having any health problems requiring
attention.
Majority of the employees on the vessels are trained in first aid. Regular drills and lectures on
first aid are carried out at the vessels. Occupational Health Surveillance Program is
summarized in Table6.6.
Table 6.1: Occupational Health hazards and mitigating measures
Cause of health hazard Risk Mitigation Measures
Noise (Generators, Cranes,
Fire Water pump) Hearing loss
Use of PPEs in high noise area
and written operational
procedures to be followed.
Procedures to be followed as per
MSDS of all hazardous chemicals
for safe handling.
ERP/DMP to be followed. Ensure
the availability of medical
treatment on site and off site and
written procedure to be followed.
Handling of heavy equipment
and material (Manual handling
of material)
Back problem
Handling of lubricants and oils
Eye problems and
chemical ingestion,
Dermal effect
Process Leaks/Fire and
Explosion
Serious
Injuries/damage to
health
Occupational Health surveillance of workers shall be done on regular basis and records
maintained as per the Factory Act.
6.4 DISASTER MANAGEMENT PLAN AND EMERGENCY RESPONSE PLAN
For meeting the emergencies caused by major accidents, planning response strategies are
termed as Disaster Management Plans (DMPs). DMPs cannot be considered in isolation or
act as a substitute for maintaining good safety standards in a plant. The best way to protect
against major accidents occurrence is by maintaining very high levels of safety standards.
Generally, the following five phases are involved in an emergency:
EIA Report for installation of dual 14‖ sub-sea pipeline
and umbilical for Odalarevu facility
Asian Consulting Engineers Pvt. Ltd. 6-13
Discovery and Notification: An event with an imminent threat of turning into an
accident must first be discovered and the discoverer quickly notifies the same to the plant
safety officer and also Duty Officer on shore.
Evaluation and Accident Control Initiation: Based on the evaluation of available
information, the safety officer makes a rapid assessment of the severity of the likely
accident and initiates the best course of action. If required alert the personnel at shore
and Coast Guard.
Containment and Counter Measures: Action is first taken to contain and control the
accident by eliminating the causes which may lead to the spread of accident. Measures
are also taken to minimize the damage to personnel, property and environment.
Cleanup and Disposal: After the accident is effectively contained and controlled, the
cleanup of the site of the accident and safe disposal of waste generated due to the
accident are undertaken.
Documentation: All aspects of accidents, including the way it started and progressed as well
as the steps taken to contain and the extent of the damage and injury, must be documented for
subsequent analysis of accident for prevention in future, damage estimation, insurance
recovery and compensation payment. It may be noted that some aspects of documentation,
such as, photographs of the site of accident and main objects involved in the accident, survey
for damage estimation, etc. may have to be carried out before the cleanup and disposal phase.
However, the effort in all cases is to recommence the production as soon as possible.
6.4.1 Emergency Classification
Severity of accident and its likely impact area will determine the level of emergency and the
disaster management plan required for appropriate handling of an emergency. Emergency
levels and the action needed for each level are indicated below:
Level 1 Emergency
A local accident with a likely impact only to immediate surroundings of accident site, such as,
local fires and limited release of inflammable material. The impact distance may not be more
than 15 m from the site of primary accident and may require evacuation of the site area where
accident occurred and utmost the adjacent areas.
Level 2 Emergency
A major accident with potential threats to life and property up to 500 m distance requiring the
evacuation of all personnel from the threatened area except the emergency response
personnel. Larger fires, release of large quantities of inflammable materials may belong to
emergency level 2.
Level 3 Emergency
An accident involving a very serious hazard and with likely impact area is extending beyond
the operational area of ―off-shore and onshore pipeline‖, such as, major fire, very large
release of inflammable material and big explosion. Major fires will usually have the triggering
effect resulting in the propagation of explosion. In a level 3 emergency, evacuation
populations near the site area.

EIA Report for installation of dual 14‖ sub-sea pipeline
and umbilical for Odalarevu facility
Asian Consulting Engineers Pvt. Ltd. 6-14
On-site Disaster Management Plan (DMP) will meet the hazards created due to all Level 1
emergencies and most of the Level 2 emergencies. In addition to on-site DMP, off-site DMP
may also have to be put into operation for some Level 2 and all Level 3 emergencies.
6.5 EMERGENCY RESPONSE PLAN
In case of emergencies (fire/leakage/failure/other offshore exigencies), the Shift
Field/Plant Operator shall immediately inform Shift Console Operator and the Control
Room. The shift Console Operator shall inform Well Head Team Leader/ Shift-in-
Charge, Shift Maintenance Engineer and Fire Station and act on the basis information
received from Shift Operator. The Well Head Team Leader/Resident Engineer acts as On-
Scene Coordinator till the Head Operation reach the site.
If the emergencies requires shut down the platform/plant and activate Disaster Management
Plan (DMP)/Oil Spill Contingency Plan (OSCP). The Shift-in-Charge (Odalarevu) provides
all necessary information regarding safe shutdown of platform/platform and ensure the
availability of vessel/helicopter/fire fighting vessel/fire tender/ambulance depending on the
situation. Shift in Charge follow duties as per fire order and other requirements under the
direction of On Scene Coordinator. Shift Security officer inform central first aid facility and
control traffic. OSC shall coordinate with the Shift Security Supervisor and Resident Medical
Officer and coordinate the aid within ONGC and from outside agencies as per requirements.
Resident Medical officer ensure first aid facility and inform local doctors/hospitals to remain
in readiness for attending to serious burns and gas poisoning case.
The On-Scene Coordinator/Commander (OSC) shall maintain communication with Asset
Manager, which shall be the Chief Emergency Officer (CEC) and coordinates with I/C of
Safety, Fire and Security. The CEC coordinate with On-Scene Coordinator (OSC) and other
ECR (Emergency Control Room) members and inform the CMD, Director (HR)-CCEC,
Director-Concerned and Director-I/C HSE on the situation. If requires, CEC activate off-site
DMP and shall request the intervention of corporate crisis management group for activation
of corporate level DMP. The CEC give technical and management advice to other
coordinators and take the decision on partial or total evacuation of the site. The actions to be
taken during emergency are given in Figure 6.2.

EIA Report for installation of dual 14‖ sub-sea pipeline
and umbilical for Odalarevu facility
Asian Consulting Engineers Pvt. Ltd. 6-15
Figure 6.2: Actions taken during Emergencies
6.5.1 On Scene Coordinator
Initial Phase: In the initial phase someone close to the scene of emergency can exercise
emergency coordination. Accordingly Well head team leader or Resident Engineer will
assume the role of on scene Coordinator (OSC) till On Scene Commander takes over.
Intermediate Phase: The Chief Emergency Co-ordinator (CEC) at Asset level may
appoint a person, normally stationed at base to take over the task of OSC at Site Control
Room (SCR).
Shift Maintenance
Engineers
I/C Maintenance
Fire/Leakage/Failure/Other Offshore
Exigencies
Shift Field
Operator/Person Noticing
First
Shift-In-Charge/Well
Head Team Leader
Resident Engineer
Head Operations/On-
Scene Coordinator
Chief Emergency Coordinator-
Asset Manager
I/C Safety
I/C Security
Muster In charge
Shift-In-Charge
(Fire)
On Escalation – Offsite DMP will be
activated by CEC-AM
ECR (Offsite)
ECR (Onsite)
Medical Officer
Shift-In-Charge
(Security)
Actuate Platform
Shutdown, if
require

EIA Report for installation of dual 14‖ sub-sea pipeline
and umbilical for Odalarevu facility
Asian Consulting Engineers Pvt. Ltd. 6-16
Function: The OSC will make an assessment of the situation; the type and quantity of
assistance required and communicate the same to the Asset ECR. The OSC will mobilize
the resources available at scene, deal with the situation and take such actions as directed
by the Chief Emergency Coordinator at the Asset/ Basin/ Plant. He will transmit
situation reports (SITREPS) at regular interval prefixing a numerical sequence to each
message.
6.5.2 Site Control Room
This temporary centre shall be established at a suitable location at offshore on a nearby rig or
a vessel stationed nearby or in any building at the base by the Head operations, with the
assistance and advice from the Emergency Control Room. Head operations will be the on-
scene coordinator. Other Coordinators at the location will be the Fire Fighting, Safety,
Security and Maintenance Coordinators who will assist the On Scene Co Coordinator in
discharging his duties at the site of emergency.
6.5.3 Communication
As effective communication is crucial for the overall success of the operation, a
communication flow-chart for such scenario is outlined herewith. In the event of a terrorist
act, timely, accurate communications will be critical for the success and survival. Timely
response during emergency is extremely important. Flow chart for first information regarding
an emergency is given in the Figure 6.3 and 6.4.

EIA Report for installation of dual 14‖ sub-sea pipeline
and umbilical for Odalarevu facility
Asian Consulting Engineers Pvt. Ltd. 6-17
Figure 6.3: Communication Flow Chart (First Information)

EIA Report for installation of dual 14‖ sub-sea pipeline
and umbilical for Odalarevu facility
Asian Consulting Engineers Pvt. Ltd. 6-18
Figure 6.4: Offshore communication flow chart.
CEC at the work center must communicate immediately as per the flow chart for first
information in case any emergency is likely to come to the notice of media. This is to ensure
that the management has an authentic update of the emergency to reply to the media.
6.5.4 Communicating With Employees
The following shall be followed for internal communications Head Corporate Communication
shall on behalf of CCEC communicate with ONGC employees through intranet or any other
communication channel to apprise all ONGC employees on the status of the incident. Chief
ER on behalf of CCEC shall establish communication with the family members of the
affected employees and contractors.

EIA Report for installation of dual 14‖ sub-sea pipeline
and umbilical for Odalarevu facility
Asian Consulting Engineers Pvt. Ltd. 6-19
6.5.5 Communicating With Media
The following shall be followed while communicating with the media
CMD, CCEC or Head CC on their behalf shall interact with print/ electronic media.
Head CC with the approval of CCEC shall brief the press/ give press release.
No other official at corporate office will interact with Media/ Press unless approved
by CMD/ CCEC.
The main purpose of Crisis communication with the media will be
o Positive messages with a focus on action taking place
o Clarity in all messages delivered
o Consistency in all messages repeated
o Bias-free messages
o Correct any misinformation
6.5.6 Warning System
A high pitch warning system is available at site for announcing the emergency and giving the
all clear signals. SMC will declare the emergency level and operational personnel and, if
necessary, public in surrounding villages will be notified about the nature of the emergency
by using alarm system in the following manner:
Level 1 Emergency – Single beep every five seconds
Level 2 Emergency – Double beep every five seconds
Level 3 Emergency – Continuous wailing of alarm
6.5.7 Emergency Procedures
Level 1 Emergencies
Accident is small and isolated and does not require the shutdown of evacuation of production
fluids. Effort shall be made to arrest its propagation. Level 1 fire may be extinguished with
water, sand or fire extinguishers. Level 1 hazardous chemical release, if any, can be contained
and controlled quickly without requiring shut down the operation or the evacuation of persons
working in the affected area.
Level 2 Emergencies
The affected unit will be brought to a safe shut down while continuing emergency supplies of
water and power. Level 2 fires will be extinguished by mobilizing water and foam
extinguishers. Level 2 hazardous chemical release, if any, will require evacuation of
personnel including those working in downwind direction towards upwind or cross wind
direction to minimize the injurious effect of hazardous gas release.
Level 3 Emergencies
Level 3 emergencies are not applicable to off-shore and onshore pipeline.
6.5.8 Accident Site Clean Up
While cleaning the site after explosion and fire accidents, care shall be taken against the
probability of leaving any hazardous / or any other materials (which may be dangerous to
terrestrial and marine life or obstacle to terrestrial and marine operation) lying buried in the

EIA Report for installation of dual 14‖ sub-sea pipeline
and umbilical for Odalarevu facility
Asian Consulting Engineers Pvt. Ltd. 6-20
land and sea-bed. Information regarding the cleaning up of spills of hazardous materials, if
used, is available in material safety data sheets.
6.5.9 Emergency Response Personnel Safety
All emergency response personnel from the ONGC and outside agencies shall enter the
accident site under instruction of SIC. These persons shall invariably wear appropriate
protective gear, such as, fire suits, helmets, boots, respirators and gas masks, before entering
the accident site.
6.5.10 All Clear Signal and Public Statement
For Level 1 and 2 emergencies Site Main Controller will authorize an all clear signal in the
form of long high pitched alarm with intermittent pauses, say, two minutes alarm followed by
one minute pause repeatedly. Public statements regarding the emergency will be issued only
by SMC.
EIA Report for installation of dual 14” sub-sea pipeline and umbilical for Odalarevu facility
Asian Consulting Engineers Pvt. Ltd. 7-1
PROJECT BENEFITS
7.1 PROJECT BENEFITS
The proposed project for installation of dual sub-sea pipeline at Odalarevu will lead to the
following benefits:
The Project will enhance reliable gas supplies, which will inturn contribute to country’s
economy by enhancing energy security and reducing foreign exchange expenditure.
The project will reduce the gap between domestic production of natural gas and actual
requirement of natural gas.
The Project will result in the indirect employment opportunities to the unskilled/skilled
local people as well as increase in business opportunities.
The project will benefit the area around Odalarevu by way of creation and improvement
of infrastructure facilities like roads.
More assistance from ONGC towards corporate social responsibility (CSR).
7

EIA Report for installation of dual 14” sub-sea pipeline and umbilical for Odalarevu facility
Asian Consulting Engineers Pvt. Ltd. 8-1
ENVIRONMENT
MANAGEMENT PLAN
8.1 PURPOSE AND OBJECTIVES OF EMP
An Environmental Management Plan (EMP) provides a delivery mechanism to address the
adverse environmental impact of a project during its execution, to enhance project benefits,
and to introduce standards of good practice to be adopted for all projects works.
The primary objectives of the EMP are to:
Facilitate the implementation of the mitigation measures for the identified adverse
impacts;
Define the responsibilities of the project proponents and contractors in order to effectively
implement the environmental management plan;
Define a monitoring mechanism and identify monitoring parameters in order to:
o Ensure the complete implementation of all mitigation measures;
o Ensure the effectiveness of the mitigation measure;
o Provide a mechanism for taking timely action in the face of unanticipated
environmental situations;
Identify training requirements at various levels.
The Environmental management plan for the installation and operationof onshore and
offshore pipeline has beenoutlinedas follows:
Table 8.1: Environmental Management Plan - Mitigation Management Matrix
(Onshore and Offshore Pipeline Installationand Operation)
Hazard &
Effect(s) Proposed Mitigation Required Actions
Onshore Site
Acquisition
Ensure that all necessary protocols
are followed and legal
requirements implemented.
Adequate compensation will be
ensured to the affected
landowners.
Vessel
Mobilization
for offshore
Sea bed profile assessment in
will be conducted prior to
mobilization and installation.
Adequate training will be
provided to the operating
personnel.
Assessment of any aquatic
species migratory route or
feeding/ breeding ground.
Sea bed assessment will be
ensured prior to mobilization.
Adequate training sessions
will be ensured for personnel
prior to rig operations.
Consult with the fisheries
department and local NGO
working for the conservation of
aquatic species. Also to consult
the Navy, Coast guard officials
for sighting of any endangered
8

EIA Report for installation of dual 14” sub-sea pipeline and umbilical for Odalarevu facility
Asian Consulting Engineers Pvt. Ltd. 8-2
Hazard &
Effect(s) Proposed Mitigation Required Actions
species in that area.
Wastewater
and Effluent
Management
Wastewater including wastewater
generated from construction sites
and sewage wastewater will be
treated in treatment plant prior to
its disposal.
Hydro test water will be reused for
multiple tests. In case of offshore
discharge, it will be ensured at a
suitable location so as to minimize
adverse impacts.
Wastewater generated from
construction activities will be
treated in existing ETP of G-1
and GS-15 onshore terminal.
The treated wastewater will be
reused for the purpose of
watering green belt in the plant
area.
Reuse of the hydro test water
will be ensured to maximum
extent.
Maximum dilution and
dispersion will be ensured
during discharge of hydro test
water.
Hydro-test chemical cocktail
will be selected on the basis of
low ecotoxicity and within the
constraints of the function for
which they are required.
Chemicals,
lubricants
and fuel
management
All fuels, lubricants and chemicals
will be kept in a well-designed
storage facility with regular
inventory checking.
Delivery of fuel and chemicals will
be executed under strict
supervision and refueling
operations will be carried out in an
area with impervious flooring and
surface drainage with oil
interceptor.
Checklist of all drums and
containers located within
footprint of the storage area will
be ensured.
It will be ensured that storage of
chemicals required in the
facility will be below the
specified threshold for specified
storage permitted under the
Manufacture, Storage and
Import of Hazardous Chemical
rule.
An inventory of all fueling and
refueling operations will be
maintained.
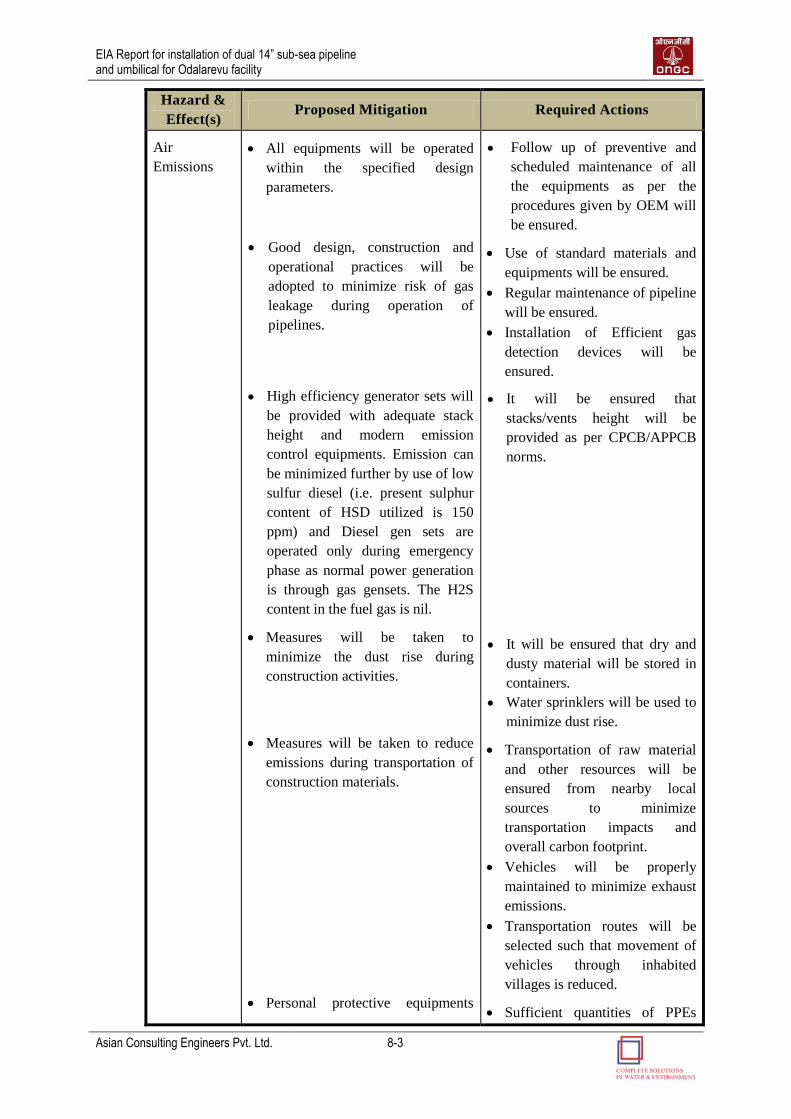
EIA Report for installation of dual 14” sub-sea pipeline and umbilical for Odalarevu facility
Asian Consulting Engineers Pvt. Ltd. 8-3
Hazard &
Effect(s) Proposed Mitigation Required Actions
Air
Emissions
All equipments will be operated
within the specified design
parameters.
Good design, construction and
operational practices will be
adopted to minimize risk of gas
leakage during operation of
pipelines.
High efficiency generator sets will
be provided with adequate stack
height and modern emission
control equipments. Emission can
be minimized further by use of low
sulfur diesel (i.e. present sulphur
content of HSD utilized is 150
ppm) and Diesel gen sets are
operated only during emergency
phase as normal power generation
is through gas gensets. The H2S
content in the fuel gas is nil.
Measures will be taken to
minimize the dust rise during
construction activities.
Measures will be taken to reduce
emissions during transportation of
construction materials.
Personal protective equipments
Follow up of preventive and
scheduled maintenance of all
the equipments as per the
procedures given by OEM will
be ensured.
Use of standard materials and
equipments will be ensured.
Regular maintenance of pipeline
will be ensured.
Installation of Efficient gas
detection devices will be
ensured.
It will be ensured that
stacks/vents height will be
provided as per CPCB/APPCB
norms.
It will be ensured that dry and
dusty material will be stored in
containers.
Water sprinklers will be used to
minimize dust rise.
Transportation of raw material
and other resources will be
ensured from nearby local
sources to minimize
transportation impacts and
overall carbon footprint.
Vehicles will be properly
maintained to minimize exhaust
emissions.
Transportation routes will be
selected such that movement of
vehicles through inhabited
villages is reduced.
Sufficient quantities of PPEs
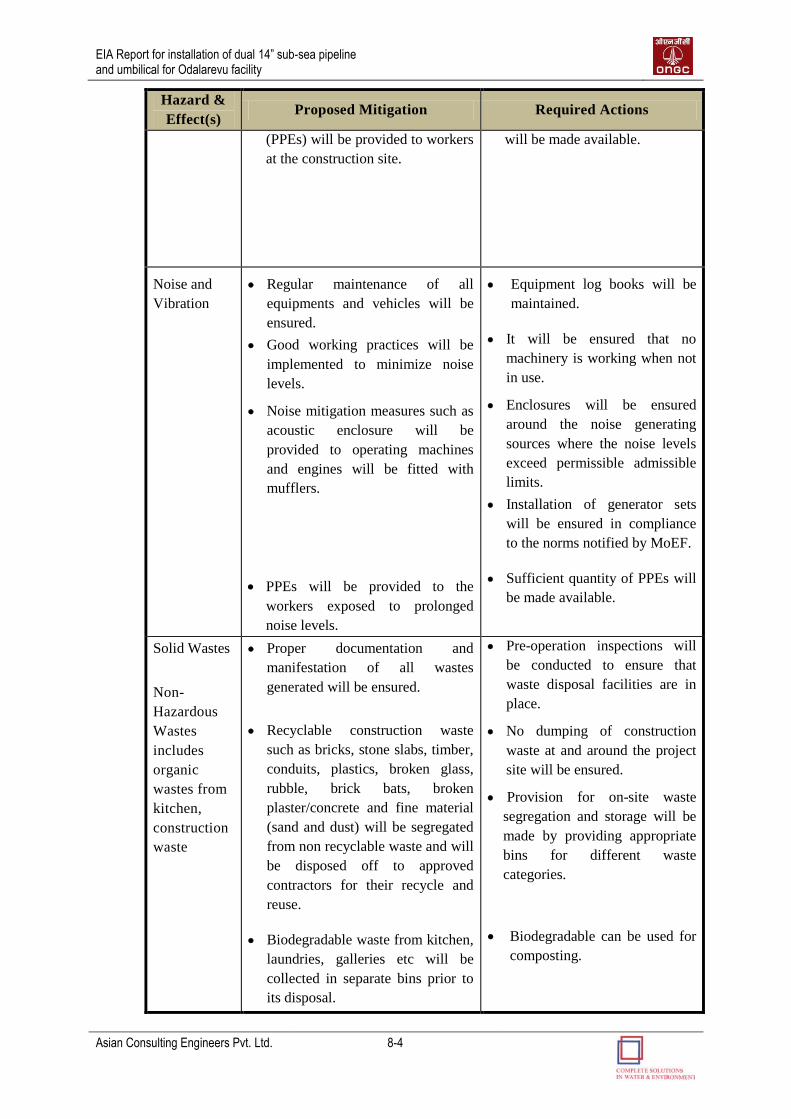
EIA Report for installation of dual 14” sub-sea pipeline and umbilical for Odalarevu facility
Asian Consulting Engineers Pvt. Ltd. 8-4
Hazard &
Effect(s) Proposed Mitigation Required Actions
(PPEs) will be provided to workers
at the construction site.
will be made available.
Noise and
Vibration
Regular maintenance of all
equipments and vehicles will be
ensured.
Good working practices will be
implemented to minimize noise
levels.
Noise mitigation measures such as
acoustic enclosure will be
provided to operating machines
and engines will be fitted with
mufflers.
PPEs will be provided to the
workers exposed to prolonged
noise levels.
Equipment log books will be
maintained.
It will be ensured that no
machinery is working when not
in use.
Enclosures will be ensured
around the noise generating
sources where the noise levels
exceed permissible admissible
limits.
Installation of generator sets
will be ensured in compliance
to the norms notified by MoEF.
Sufficient quantity of PPEs will
be made available.
Solid Wastes
Non-
Hazardous
Wastes
includes
organic
wastes from
kitchen,
construction
waste
Proper documentation and
manifestation of all wastes
generated will be ensured.
Recyclable construction waste
such as bricks, stone slabs, timber,
conduits, plastics, broken glass,
rubble, brick bats, broken
plaster/concrete and fine material
(sand and dust) will be segregated
from non recyclable waste and will
be disposed off to approved
contractors for their recycle and
reuse.
Biodegradable waste from kitchen,
laundries, galleries etc will be
collected in separate bins prior to
its disposal.
Pre-operation inspections will
be conducted to ensure that
waste disposal facilities are in
place.
No dumping of construction
waste at and around the project
site will be ensured.
Provision for on-site waste
segregation and storage will be
made by providing appropriate
bins for different waste
categories.
Biodegradable can be used for
composting.

EIA Report for installation of dual 14” sub-sea pipeline and umbilical for Odalarevu facility
Asian Consulting Engineers Pvt. Ltd. 8-5
Hazard &
Effect(s) Proposed Mitigation Required Actions
Soil and
Sediment
Quality
The top soil recovered during land
clearance will be stockpiled
separately and will be used for
backfilling the trench in order to
restore the original soil condition.
Wastewater discharges and solid
waste will be subjected to
appropriate treatment prior to the
disposal.
Measures will be taken to
minimize soil and sediment
contamination due to usage of
pipeline commissioning
chemicals.
Measures will be implemented
to minimize soil erosion and top
soil losses during construction
phase.
Implementation of waste
management plan (as described
in section 8.2) will be ensured.
Use of pipeline commissioning
chemicals will be minimized to
the extent possible.
Disposal of the chemical will be
ensured as per the engineering
package specifications for
contractors.
Ecological
Impacts
Measures will be taken to
minimize ecological impacts due
to air emissions and noise from
operation of machineries,
equipments and transportation
vehicles during construction and
operational phase of onshore and
offshore pipelines.
Waste management plan will be
implemented to mitigate adverse
impacts on the land and marine
environment.
Intimation to the Fisheries
Department in case of any unusual
phenomenon observed.
Intimation to the Fisheries
Department and/or Forest
Department in case any deceased
aquatic species is observed on the
sea surface or any behavioral
change observed in the avi-fauna.
Implementation of suitable
measures will be ensured.
Formulation and
implementation of waste
management plan (as described
in section 8.2) will be ensured.
Visual observations of the
aquatic flora & fauna will be
done in routine through the rig
and surveillance vessels on
round.
Same as above.
Socio-
Economic
Environment
Local people will be recruited
indirectly during project activities.
Record of all jobs will be
maintained. Monthly feedback
on jobs will be given to locals

EIA Report for installation of dual 14” sub-sea pipeline and umbilical for Odalarevu facility
Asian Consulting Engineers Pvt. Ltd. 8-6
Hazard &
Effect(s) Proposed Mitigation Required Actions
Vocational trainings will be
provided to local people to
enhance their skill and
employment opportunities.
Safety measures will be adopted to
minimize Occupation Health
Hazards during project activities.
Measures will be adopted to
minimize effects on fish catch of
the area.
Undertake social welfare projects
for the local communities through
well throughout CSR strategy.
reporting on job profile.
Provision for vocational
training programs will be
ensured.
Implementation of stringent
Health, Safety and
Environmental practices will be
ensured.
Installation of pipeline will be
ensured during non-fishing
season.
Implement social welfare project
as per Company’s CSR Policy.
8.2 WASTE MANAGEMENT PLAN
To facilitate field level implementation, a waste management plan is framed which will
be subject to fine tuning depending on site conditions. This Waste management plan is as
presented below in Table 8.2.
Table 8.2: Waste Management Plan
Waste
Category Waste Type Proposed Action
Construction
wastes
Recyclable waste (such
as bricks, stone slabs,
timber, conduits,
plastics, broken glass,
rubble, brick bats,
broken plaster / concrete
and fine material (sand
and dust), non recyclable
waste and wastewater
from construction
activities
Recyclable construction waste will be
segregated and stored in separate bins
from non recyclable waste and will be
disposed off to approved contractors for
its final disposal.
Wastewater generated from
construction activities will be treated in
existing ETP of G-1 and GS-15 facility.
The treated effluent will be reused for
the purpose of watering green belt in
the plant area.
Domestic
Wastes
Sewage
Sewage will be treated in effluent
treatment plant and the treated effluent
will be used for irrigation purpose
within and around the plant.

EIA Report for installation of dual 14” sub-sea pipeline and umbilical for Odalarevu facility
Asian Consulting Engineers Pvt. Ltd. 8-7
Waste
Category Waste Type Proposed Action
Combustible Waste
(Paper, Rags, Packing
material)
Waste will be properly segregated (no
plastics, metal, glass in it) and
transported to approved recycling
contractor.
Recyclable waste such as
Tin packs, plastic and
glass bottles etc.
Waste will be properly segregated and
stored for its transportation to approved
recycling contractor.
Hazardous
wastes
Waste lube/ system oil
from construction and
operational machineries,
used oil from D.G sets
Hazardous waste will be carefully
stored in drums and transported to
MoEF approved recyclers for its final
disposal. The handling, storage and
transportation of the waste will be in
accordance to Hazardous Wastes
(Management, Handling and Trans-
boundary Movement) Rules, 2008.
Pre-
Commissioni
ng Wastes
Hydro test water Hydro test water will be reused for
multiple tests. In case of offshore
discharge, it should be ensured at a
suitable location so as to minimize
adverse impacts.
8.3 CAPITALAND RECURRING COST FOR POLLUTIONCONTROL
MEASURES
Pollution control measures Total Capital
Cost
Recurring
Cost
Wastewater and Effluent Management
Water Quality Monitoring
8,00,000
Fuel, Lubricant and Chemical Management 2,50,00,000 25,00,000
Noise and Vibration Mitigation
Acoustic enclosure and Personal Protective equipments
Noise Monitoring
Maintenance cost of equipments
87,00,000
5,00,000
40,85,000
Solid Waste management 1,25,00,000
Air emission mitigation
Maintenance of D.G. sets
31,50,000
Flora & Fauna survey (both marine and terrestrial) 3,00,000
Soil & Sediment Quality 8,00,000
Training to staff 2,50,000
General awareness in local public 2,50,000
Total 4,62,00,000 1,26,35,000
The costs are calculated based on the current charges of an accredited
laboratory/consultant/ contractor to perform the above said work.

EIA Report for installation of dual 14” sub-sea pipeline and umbilical for Odalarevu facility
Asian Consulting Engineers Pvt. Ltd. 8-8
8.4 ENVIRONMENTAL AWARENESS TRAINING
Environmental Awareness training will help to ensure that the requirements of the EMP
are clearly understood and followed by all project personnel throughout the project period.
The primary responsibility for providing training as per HSE policy to all project
personnel will be that of the HSE Officer. The HSE policy includes following guidelines:
We are committed to maintain highest standards of occupational health, safety and
environment protection.
We will comply with all applicable codes and requirements to promote occupational
health, safety and environment protection.
We will be always alert, equipped and ready to respond to emergencies.
We will take all actions necessary to protect the integrity of the system in order to
avoid accidental release of hazardous substances.
We will enhance awareness and involvement in promotion of Occupational health,
safety and environment protection wherever we work and reside.
The HSE Officer will train the site staff, the drilling contractor, and other staff engaged
by ONGC for the project. Training will cover all staff levels, ranging from the
management and supervisory to the skilled and unskilled categories. The scope of the
training will cover the requirements of the EIA and the EMP, with special emphasis on
sensitizing the project staff to environmental, social, ethnic, and tribal context of the area.
The HSE Officer will conduct on-job live risk assessment trainings to the staff (including
HSE coordinator & Company man) and the contractor staff to better appreciate
environmental risks and their mitigation measures. This will be undertaken after
conducting audits on the operations.

EIA Report for installation of dual 14” sub-sea pipeline and umbilical for Odalarevu facility
Asian Consulting Engineers Pvt. Ltd. 9-1
SUMMARY AND
CONCLUSION
9.1 SUMMARY AND CONCLUSION
ONGC plan to develop Vashishta and S-1 gas field in the eastern offshore for which dual 14
inch sub-sea pipelines are to be laid to evacuate production fluid from Vashishta and S-1 field
to the onshore terminal at Odalarevu. The length of pipeline on land and sub-sea is about 4
km and 43 km approx. respectively.
The environment status of 10km study area of the onshore pipeline route and along the sub-
sea pipeline route is delineated with respect to air, noise, water, biological environment and
socio-economic. The different project activities in the construction and operation phase are
identified and evaluated on the basis of primary and secondary data collection through field
investigation, environment monitoring and from secondary sources viz. maps, reports,
scientific literatures etc. A summary of the identified impacts are given in the following
paragraphs.
In the construction phase the vehicular & vessel movement, pipe-laying works and operating
of generators will have maximum impact, especially on air, noise, vibration and ecological
environment. Water quality and geology/soil will be affected due to the discharge of
wastewater (construction and domestic) and leakage of oil etc; from generators and other
equipments. On the other hand, during the operation phase; usage of maintenance & cleaning
chemicals and risk of gas leakages will affect the water, air, noise and biological environment.
With respect to occupational health, impacts are anticipated on the health of the employees
during operation phase. Personnel working near the noise generating machines, DG sets and
handling of chemicals and lubricants are more susceptible of getting health hazards.
However, all these impacts can be overcome with the proposed mitigation measures proposed
in Chapter 4 and EMP. Overall, this project will bring economic benefits, increase energy
security of the country and generate employment opportunities.
9

EIA Report for installation of dual 14” sub-sea pipeline and umbilical for Odalarevu facility
Asian Consulting Engineers Pvt. Ltd. 10-1
DISCLOSURE OF
CONSULTANTS ENGAGED
10.1 INTRODUCTION
Asian Consulting Engineers Pvt. Ltd. (ACE) is an independent consulting company in the
field of water and environment engineering with its headquarters located in New Delhi, India.
ACE provides consulting services and sustainable solutions for infrastructure projects (roads,
railways, ports, hydropower, water resources and other urban infrastructural plan outs),
industrial projects (refineries, petrochemicals, gas pipelines, offshore and onshore oil & gas
exploration, fertilizers, steel plants, power plants, textiles, hotels, distilleries and tanneries)
and social development projects.
ACE is committed to provide consultancy services of international quality at local costs to
suit its client’s requirements. ACE believes that the key to success is the ability to work
effectively with clients to understand, define, and resolve their environmental concerns. ACE
offers technical talent, specialized expertise, physical resources, and requisite facilities that
are important in responding to water and environmental issues, the world faces today. The
quality of work and timely completion of project are of paramount importance in each
assignment that ACE undertakes.
We, at ACE, know what makes for a successful project. Clients turn to ACE because
We understand the issue at hand
Have the required experience and expertise to develop unique solutions
Complete work on time and within budget
Work towards client satisfaction as our ultimate goal
ACE offers this combination of quality and performance through its professionals, managers
and support personnel. Our people are equipped with state-of-the-art technologies and they
are motivated to implement the project to the satisfaction of the client.
10.2 QUALITY OF SERVICES
ACE is committed to providing a high quality consultancy service. As a recognition of same,
ACE has been awarded ISO 9001: 2008 certified (Certificate no: 22340/10/S) by RINA, to
provide consultancy services for water supply, waste water treatment, municipal solid waste
management, environment and social impact assessment, environment impact and audit,
remote sensing and geographical information systems. In addition to this, ACE is also
accredited with Quality Council of India for preparation of EIA of Onshore and offshore oil
and gas exploration and development and transportation of oil and gas through pipelines
(Category A).
10.3 AREA OF SPECIALIZATION
Water Resources Engineering
Water Supply
10
EIA Report for installation of dual 14” sub-sea pipeline and umbilical for Odalarevu facility
Asian Consulting Engineers Pvt. Ltd. 10-2
Wastewater Management
Urban Environment Improvement
Environmental Management
Social Development
GIS and Remote Sensing
10.4 RESOURCES
Panel of Experts
ACE has experts in the following specialized areas:
Water supply engineering
Water resources engineering
Wastewater engineering
Solid waste management
Public Health and Sanitation
Environmental Management
Forestry and Wildlife
Environmental modeling
Fisheries
Aquaculture
Social development
Infrastructural Resources
Following facilities are available with ACE:
Air quality models
Noise quality models
Water quality models
Water distribution analysis software
Sewer network analysis software
Software Availability
AERMODE
CALINE 4
Erdas Imagine
Arc GIS
AutoCAD
Map Info