OIL AND ITS IMPACT ON ECONOMICS AND FINANCIAL MARKETS
75
University of St.Gallen Master Thesis OIL AND ITS IMPACT ON ECONOMICS AND FINANCIAL MARKETS Compendium Christine Eva M¨ uller 03-606-340 Referee: Prof. Dr. Karl Frauendorfer August 2009
Transcript of OIL AND ITS IMPACT ON ECONOMICS AND FINANCIAL MARKETS

University of St.Gallen
Master Thesis
OIL AND ITS IMPACT ON ECONOMICS AND FINANCIAL
MARKETS
Compendium
Christine Eva Muller
03-606-340
Referee: Prof. Dr. Karl Frauendorfer
August 2009
Abstract
The steep increase of energy prices from 2003 to 2008 sparked renewed interest not only by
the wider public but also by academic research. A number of puzzling questions arose such
as the apperent global economic resilience to record high oil prices. These question lead
to a signficant amount of research which offered new insights and enhanced the existing
research body considerably. This thesis therefore undertakes an extensive review over the
research body of the last decades as well as a review of the latest contributions. It takes
into account the fundamentals of crude oil prices, gives an outline over research regarding
oil shocks, national and international transmission channels, and also over the connection
of oil and stock markets. Besides the U.S., additional evidence is given for UK, Germany,
and Japan.

Contents
1 Introduction 1
2 Oil Prices: Dynamics and Fundamentals 3
2.1 Supply and Demand . . . . . . . . . . . . . . . . . . . . . . . . . . . . . . . 5
2.2 Storage and Inventories . . . . . . . . . . . . . . . . . . . . . . . . . . . . . 8
2.3 Oil Futures Markets . . . . . . . . . . . . . . . . . . . . . . . . . . . . . . . 9
2.4 Foreign Exchange Rates . . . . . . . . . . . . . . . . . . . . . . . . . . . . . 10
2.5 Discussion of Oil Price Endogenity . . . . . . . . . . . . . . . . . . . . . . . 11
3 Oil and Economics: Oil Shock Research 13
3.1 Oil Shocks and Their Historical Context . . . . . . . . . . . . . . . . . . . . 13
3.2 Asymmetry . . . . . . . . . . . . . . . . . . . . . . . . . . . . . . . . . . . . 15
3.3 Nonlinear Measurement and Specification . . . . . . . . . . . . . . . . . . . 18
3.4 Differentiation of Shocks . . . . . . . . . . . . . . . . . . . . . . . . . . . . . 20
3.5 Size . . . . . . . . . . . . . . . . . . . . . . . . . . . . . . . . . . . . . . . . 22
4 Oil and Economics: Transmission Research 25
4.1 Direct Transmission Channels . . . . . . . . . . . . . . . . . . . . . . . . . . 26
4.1.1 Interest Rates . . . . . . . . . . . . . . . . . . . . . . . . . . . . . . . 26
4.1.2 Customer Expenditures . . . . . . . . . . . . . . . . . . . . . . . . . 26
4.1.3 Business Investment . . . . . . . . . . . . . . . . . . . . . . . . . . . 27
4.1.4 Industrial Production . . . . . . . . . . . . . . . . . . . . . . . . . . 29
4.1.5 Employment . . . . . . . . . . . . . . . . . . . . . . . . . . . . . . . 30
4.2 Indirect Transmission Channels . . . . . . . . . . . . . . . . . . . . . . . . . 31
4.2.1 Inflation . . . . . . . . . . . . . . . . . . . . . . . . . . . . . . . . . . 31
4.2.2 Stagflation . . . . . . . . . . . . . . . . . . . . . . . . . . . . . . . . 34
4.2.3 Monetary Policy . . . . . . . . . . . . . . . . . . . . . . . . . . . . . 35
5 Findings for UK, Japan, Germany 37
5.1 Importers vs. Exporters . . . . . . . . . . . . . . . . . . . . . . . . . . . . . 38
5.2 National Patterns . . . . . . . . . . . . . . . . . . . . . . . . . . . . . . . . . 39
5.3 Focus: Japan . . . . . . . . . . . . . . . . . . . . . . . . . . . . . . . . . . . 40
1

6 Oil and International Transmission 42
6.1 Terms of trade . . . . . . . . . . . . . . . . . . . . . . . . . . . . . . . . . . 42
6.2 Transmission Mechanisms . . . . . . . . . . . . . . . . . . . . . . . . . . . . 43
7 Oil and Stock Markets 45
7.1 Transmission Channels . . . . . . . . . . . . . . . . . . . . . . . . . . . . . . 47
7.1.1 Supply Side . . . . . . . . . . . . . . . . . . . . . . . . . . . . . . . . 47
7.1.2 Demand Side . . . . . . . . . . . . . . . . . . . . . . . . . . . . . . . 49
7.2 Nonlinearity . . . . . . . . . . . . . . . . . . . . . . . . . . . . . . . . . . . . 51
7.3 Asymmetry . . . . . . . . . . . . . . . . . . . . . . . . . . . . . . . . . . . . 52
7.4 Industrial Sector Specific Findings . . . . . . . . . . . . . . . . . . . . . . . 55
7.5 Oil Sensitivities of Firms Regarding Size . . . . . . . . . . . . . . . . . . . . 58
8 Conclusion 60
References 62
Internet Sources 69
2

List of Figures
2.1 Global Crude Oil Spot Prices . . . . . . . . . . . . . . . . . . . . . . . . . . 3
2.2 Global Oil Production . . . . . . . . . . . . . . . . . . . . . . . . . . . . . . 6
2.3 Global Oil Consumption . . . . . . . . . . . . . . . . . . . . . . . . . . . . . 7
3

List of Abbreviations
bbl . . . . . . . . . . . Barrel
BP . . . . . . . . . . . British Petroleum p.l.c.
CFTC . . . . . . . Commodity Futures Trading Commission
CPI . . . . . . . . . . Consumer Price Index
EIA . . . . . . . . . . Energy Information Administration (U.S. DOE)
EMU . . . . . . . . European Money Union
G7 . . . . . . . . . . . Canada, France, Germany, Italy, Japan, UK and U.S.
GDP . . . . . . . . . Gross Domestic Product
GNP . . . . . . . . . Gross National Product
IOC . . . . . . . . . International Oil Company
IP . . . . . . . . . . . Industrial Production
IPE . . . . . . . . . . International Petroleum Exchange
NAICS . . . . . . . North American Industrial Classification System
NOPI . . . . . . . . Net Oil Price Increase
NYMEX . . . . . New York Mercantile Exchange
OPEC . . . . . . . Organization of Petroleum Producing Countries
PPI . . . . . . . . . . Producer Price Index
SOPI . . . . . . . . Scaled Oil Price Increase
U.S. DOE . . . . U.S. Department of Energy
VAR . . . . . . . . . Vector Autoregression
VECM . . . . . . . Vector Error Correction Model
WTI . . . . . . . . . West Texas Intermediate
4

1 Introduction
Oil markets have proven exciting since decades. Everyone can ultimately feel the effects
of drastic oil price changes. This has been the case various times in the last decades.
Car-free sundays and wage-eroding inflation in the 1970s or record high gasoline prices
after hurricane Katrina 2005 and in summer 2008 are probably the most vividly remem-
bered examples. Naturally, the most reminded and cited relationship of oil prices and the
macroeconomy is a negative one. As stock markets are influenced to a significant amount
by expectations, common notions and the economic environment, it is straightforward to
assume the relation of oil and stock markets to be negative as well. However, research
overall often failed to find clear cut evidence leaving a fair amount of conundrum.
Oil prices and therefore oil shocks have been a popular topic in research due to various
reasons. First, oil shocks have broadly been assumed to be exogenous and were thus useful
to study transmission mechanisms for example in the field of monetary policy. Second,
oil shocks have broadly been assumed to be powerful factors for the macroeconomy such
as causing the stagflation in the 1970s. And third, oil dynamics changed considerably
during the last decades often exhibiting significant different behavior and circumstances
every decade or so. Hence, these developments had to be examined by research. Notably
so, research regarding the world of oil has rather been published in waves with a given
time lag to the events and only recently the volume picked up again with the run-up of
oil prices from 2003 on until prices plummeted in 2008 after nearly touching U.S. dollar
150/bbl, a record high even if adjusted for inflation.
During the time of writing some of the underlying questions for this thesis have
changed, too - given the density of extraordinary events since 2007. At first, the global
economy seemed resilient to ever rising oil prices. Inflation had picked up only late due
to buoyant energy and grains markets. Fueled by the boom in commodities from base
metals to grains, energy prices were rising steadily. The outlook of double digit emerging
market growth proved to be a powerful driver. Also, massive inflows of investment cap-
ital into crude oil and other commodity markets have been made responsible. However,
after the subprime bubble or more broadly, the securitized debt markets wreaked havoc
in 2007 and sent first the financial world into a tailspin, only to trickle into the global real
economy some time later, oil markets reversed its trend rapidly. The dooming scenario
1

CHAPTER 1. INTRODUCTION 2
of a global recession sent oil prices back to early 2007 levels and in fact as of July 2009,
the economic downturn freed up significant spare oil production capacity mostly in Saudi
Arabia, according to the EIA (2009, p.2).
This thesis covers an extensive overview over the relations of oil to national economics
and financial markets. Following a thorough introduction about oil price fundamentals,
it lays out three strands of academic research such as research on oil shocks, oil and
macroeconomics as well as oil and stock markets. Furthermore, international transmission
channels are addressed. As most research concentrates on U.S. data, additional evidence
ist given for some of the biggest global economies, UK, Germany and Japan.
Several issues and aspects surface either explicitly or implicitly throughout research
dealing with oil. One central issue, which is often part of the underlying rationale, is the
assumed asymmetric relationship of oil prices and economic or financial variables. Another
aspects is the persistence, both in data and in economic transmission of oil prices itself.
Effects often appear with some time lag. Also, there is an inherent conflict of research
with empirical evidence and the popular press (including the financial press). At some
points even research papers cite dated evidence, which has already been contradicted or
disproved. Popular notions, which have already been questioned, are reported perpetually.
One infamous incident is the stagflation in the U.S. during the 1970s, which is mostly and
only - but falsely - attributed to the coinciding oil price shocks.

2 Oil Prices: Dynamics and Fundamentals
This introductory chapter lays out the underlying complex of oil prices. First, I explain
supply and demand followed by a short section about inventories and storage, which
serve as intermediary and also market making mechanism between supply and demand.
Second, I turn to the financial market side of oil prices and epitomize the role of oil
futures and exchange rates in oil pricing mechanism. Lastly, I briefly discuss the question
of endogeneity of oil prices, which is of vital interest in research.
Oil prices, generally stated in barrel per U.S. Dollar, usually refer to crude oil prices
of the front month futures contract of the benchmark crude oil grades WTI (WTI; traded
at the NYMEX, New York) or Brent (traded at the IPE, London).
Figure 2.1: Global Crude Oil Spot Prices (Source: BP (2009))
!"#$!"#%!"%&!"%'!"%(!"%$!"%%!""&!""'!""(!""$!""%'&&&'&&''&&('&&$'&&%&
'&
(&
$&
%&
!&&
!'&
)*+,- ./012 345
67.8009
At the very end of factors influencing oil prices, the quality of crude oil determines the
price in relation to other qualities. Crude oil is graded along its sulphur content and its
density (viscosity), which define the respective oil grade depending on the geographical
location of its production. In general, the higher the sulphur content and the higher the
density, the higher is the price discount to other grades. Therefore Brent, which stems
from the North Sea, (normally) trades at a discount to WTI, which is lighter and less
sour than Brent. The reason lies in the refinery process, which yields a higher fraction of
high quality gasoline out of one barrel light and sweet crude oil. The residual is refined to
3

CHAPTER 2. OIL PRICES: DYNAMICS AND FUNDAMENTALS 4
heavier products such as kerosene, fuel oil, heating oil, and alkenes, which again are the
basis for the production of plastics (EIA, 2008a).
However, some anomalies arise in some instances, such as for example in the first half
year of 2007, Brent traded at a premium as inventory levels in Cushing, Oklahoma (USA),
were above normal. Refinery bottlenecks, which were caused by unplanned maintenance
and a number of accidents, let crude oil supplies rise while refined product inventories
were drawn during summer season. Therefore, comparatively ample WTI crude oil stocks
led to this anomaly (Reuters, 2009a). Furthermore, the matter of transport sometimes
also plays a role in that WTI is rather “tanker-driven” whereas Brent rather reacts to
“pipeline-events”.
The role of refinery capacity has also been explored lately in analyses looking to get
to the bottom of the oil price run up from 2003 to 2008. Papers such as Dees, Gasteuil,
Kaufmann, & Mann (2008) and Kaufmann, Dees, Gasteuil, & Mann (2008) include the
refining sector into their analyses. Yet, both papers stress the role of the refining sector
during the last years, but find that refinery utilization rates have in fact a negative rela-
tionship to crude oil prices. This counter-intuitive finding traces back to the technicalities
of oil grades and refining margins. As described above, refiners prefer lighter and sweeter
crude oil grades, which yield higher revenues. Also, producers favor pumping light sweet
oils first because of the price premium. However, refineries, which approach their capacity
at the margin, are squeezed to refine less preferred heavier oil grades. Hence, the prefer-
ence of refiners for light crude oil tends to lower crude oil prices of heavier grade. The
overall relationship as indicated by regression results is therefore negative (Dees et al.,
2008, p.17).
The role of refineries and refining margins might seem straightforward at first, but it
is important to note that regional differences are profound in refining margins and in the
state of the refineries themselves. It is thus problematic to deduct generalized findings.
The special dynamics of the U.S. refining sector during the last years for example has also
been influenced by natural disasters such as hurricane Katrina in 2005.
These aforementioned relations may, however, currently undergo a significant change.
Recent price developments of crude oil and oil products such as fuel oil testify that dynam-
ics indeed have changed. Spreads between heavy and light oil grades as well as between
heavy oil products and light oil grades narrowed significantly. The stark rise of oil prices

CHAPTER 2. OIL PRICES: DYNAMICS AND FUNDAMENTALS 5
from 2003 to 2008 sparked incentives to build up or modernize refinery capacity, mostly
driven by China and India, which again alters the demand mix of oil grades. The refinery
sector has traditionally been a low-margin business, it was notoriously underinvested and
consequences surfaced especially during the last years. Modern refineries work well with
sour and heavy oil grades and demand of light sweet oil grades is hence poised to fall, nar-
rowing price spreads significantly (Bayer, 2009). Previously common “laws” of oil prices
might therefore undergo some change in the future.
2.1 Supply and Demand
Hamilton (2009, p.196) summarizes the power game of oil as follows:
There was once a time in which a few oil companies played a big role in world
oil markets, that era is long past. ExxonMobil, the worlds largest private oil
company, produced 2.6 mb/d of oil in 2007, which is only 3.1% of the world
total. The combined market share of the 5 biggest private companies is less
than 12%. In the modern era, it is sovereign countries rather than private
companies who would be calling the shots.
The OPEC1 produced 44.8% or 36.705 million bbl/day of the global petroleum supply
in 2008, and its members control 76% of global proved reserves2. The residual produc-
tion stems from countries outside the OPEC, where (private) international oil companies
(IOC’s) have contracts with the respective government for resource extraction. However,
because nationalization of resources proves very attractive to governments, especially in
emerging markets, IOC’s are increasingly under pressure to develop new production sites.
These new production sites are often non-conventional in a way that they operate deep
sea, exploit oil sands (Athabasca, Canada and Orinoco, Venezuela) or push technological
boundaires due to extreme geographical conditions. These projects are infamous for their
very high development and production costs, as they are, for example, located in deep sea
on the shore of West Africa or near the polar circle (Sakhalin II project operated by Shell,1The OPEC is widely seen as a cartel formed by the states of Iran, Iraq, Kuwait, Qatar, Saudi Arabia,United Arab Emirates, Algeria, Libya, Angola, Nigeria, Indonesia and Venezuela. The organization hasits headquarters in Vienna. For more information see www.opec.org
2Data from the BP Statistical Review of World Energy 2009. Production and proved reserves data differsregarding the respective source. The most important data is published by the Energy Information Ad-ministration (U.S. DOE ), the International Energy Agency (established by the OECD), BP and energymarket intelligence agencies such as Platts or PFC Energy.

CHAPTER 2. OIL PRICES: DYNAMICS AND FUNDAMENTALS 6
Russia). In addition, oil fields face steady declines in production with increasing maturity,
which again adds additional pressure on supply. Spare production capacity functions as
buffer for demand growth or sudden supply shortages. Ample during the 1990s, these ca-
pacities have been squeezed since then (Interagency Task Force on Commodity Markets,
2008). Current significant spare capacity can mostly be attributed to Saudi Arabia. Other
traditional heavyweights such as Mexico, Iran or Venezuela have difficulties in maintaining
or adding production capacity.
In the popular press and in non-economic or non-academic discussion, the term of
“peak oil” is used often. Peak oil describes a thesis by which oil production peaks (or has
already peaked) at some point of time and keeps falling thereafter. This is supposed to
cause disastrous consequences for our economies and societies. Since this theory fails to
discuss important economic mechanisms, it found no support or attention in the academic
literature. Holland (2008) however picks up on that discussion and models peaking oil
supply with four different economic models which include the very important pricing
mechanism of oil. He finds that oil prices are generally a better indicator for imminent
scarcity than peaking production is. Also, peaking production can occur within the full
range of 0% to 100% of remaining deposits. These findings undermine the limitations
of popular arguments in the world of oil in that they often omit important allocation
mechanisms or omit central fundamentals.
Figure 2.2: Global Oil Production (Source: BP (2009))
0
5
10
15
20
25
30
35
40
1990 1992 1994 1996 1998 2000 2002 2004 2006 2008
Million bbl/day
OPEC Non-OPEC (excl. FSU) Former Soviet Union

CHAPTER 2. OIL PRICES: DYNAMICS AND FUNDAMENTALS 7
Demand growth has outpaced supply growth during the last years and provided in-
creasing pressure on spare production capacity and oil stocks (Interagency Task Force on
Commodity Markets, 2008). Both have been in decline. Robust global economic growth
until the third quarter in 2008 pushed demand by more than expected. China, India and
the Middle East have been accountable for two-thirds of the consumption increase since
2004. Albeit these countries start from very low levels of per capita consumption3 the aug-
mentation with industrialization and development in the future is palpable. Subsidized
refined oil products, such as gasoline in emerging and developing economies, contribute to
consumption growth and are artificial additional demand.
Figure 2.3: Global Oil Consumption (Source: BP (2009))
0
5
10
15
20
25
30
1990 1992 1994 1996 1998 2000 2002 2004 2006 2008
Million bbl/day
North America S. & Cent. America
Europe & Eurasia Middle East
As consequence to the above described supply and demand dynamics, both the demand
and the supply curve are very inelastic in the short run and more elastic in the long
run. According to Hamilton (2009), elasticity of income (GDP) relative to oil prices
even decreased since the 1980s. Increased oil price volatility in cases of demand shocks,
supply disruptions, geopolitical events and hazardous weather events again trace back to
the inelastic curves. Krichene (2006b) estimated quarterly elasticities from 1984Q1 to
2005Q2 for price (demand), income (economic growth on demand) and crude oil supply
price elasticity to be -0.02, 0.19 and 0.005 respectively.3The oil consumption in the U.S. is around 25 bbl/capita, in the Middle East 10 bbl/capita, in India andChina still below 3 bbl/capita respectively (Interagency Task Force on Commodity Markets, 2008).

CHAPTER 2. OIL PRICES: DYNAMICS AND FUNDAMENTALS 8
2.2 Storage and Inventories
Storage and inventories are an important element in oil price dynamics (EIA, 2008b).
Inventories are typically held either by countries such as the U.S. and Japan as strategic
oil reserves, which are only used in times of need, or by companies as a part of global oil
stocks and these inventories are commercially “available”. Relevant for crude oil prices are
only the latter, bar any exceptional events such as massive supply disruptions by weather
or geopolitical conditions. The U.S. DOE is the only government agency publishing weekly
inventory data and provides with this important information about short run supply and
demand in the U.S. The release of inventory data is a market making event, which causes
price moves every week, especially, in times of comparatively low inventories. Inventory
data exhibits seasonal patterns as oil stocks are usually drawn during the winter of the
northern hemisphere and during the U.S. driving season, when public and summer holidays
send people on the road. Moreover, refineries usually close for maintenance in late autumn.
The refining sector is also under scrutiny by financial markets since refineries may become
the bottle neck between ample unprocessed crude oil supplies and much needed refined
products such as gasoline. Hence, scarcity driving gasoline prices up may also feed back
into crude oil prices. Examples for this could be seen in summer 2007, when crude oil
prices were also driven up by gasoline prices and refinery capacity was previously shut in
due to unscheduled maintenance in spring 2007 (Reuters, 2009a).
Closely related to storage and inventories is the topic of the convenience yield and the
term structure of the oil futures curve. During times of comparatively high inventories, the
term structure is typically in contango showing lower prices for the nearer future than for
the longer term (other exogenous effects banned)4. Moreover, deeper near term oil prices
impose incentives on market participants to buy and store oil selling it later at a higher
price. This phenomenon again took place in late 2008/early 2009 when a steep contango
futures term structure let oil traders charter tankers in order serve as floating storage.
In June 2009, a good part of the stored oil was sold leveling out OPEC production cuts
(Reuters, 2009b).4The complementary shape of the term structure is known as backwardation, which signifies higher pricesfor the near future than for the longer term indicating scarcity and strong demand in the present. Con-tango indicates ample supply in the present relative to expected scarcity in the future.
CHAPTER 2. OIL PRICES: DYNAMICS AND FUNDAMENTALS 9
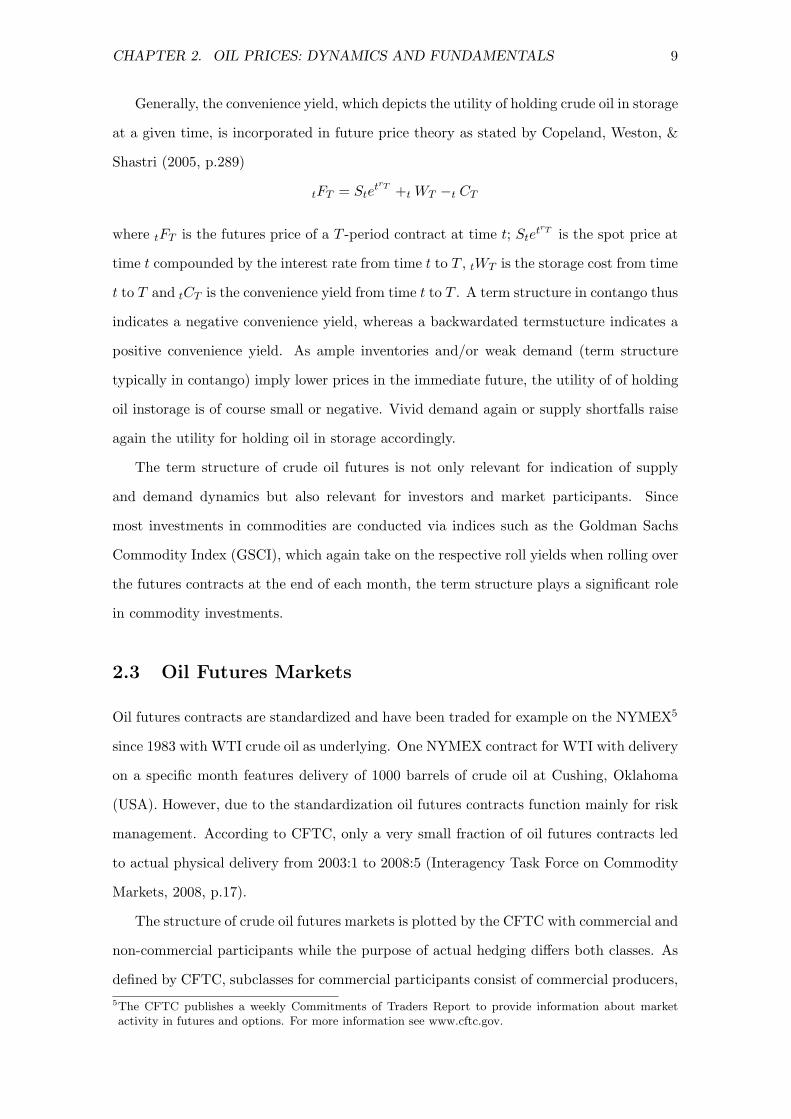
Generally, the convenience yield, which depicts the utility of holding crude oil in storage
at a given time, is incorporated in future price theory as stated by Copeland, Weston, &
Shastri (2005, p.289)
tFT = StetrT +t WT −t CT
where tFT is the futures price of a T -period contract at time t; StetrT is the spot price at
time t compounded by the interest rate from time t to T , tWT is the storage cost from time
t to T and tCT is the convenience yield from time t to T . A term structure in contango thus
indicates a negative convenience yield, whereas a backwardated termstucture indicates a
positive convenience yield. As ample inventories and/or weak demand (term structure
typically in contango) imply lower prices in the immediate future, the utility of of holding
oil instorage is of course small or negative. Vivid demand again or supply shortfalls raise
again the utility for holding oil in storage accordingly.
The term structure of crude oil futures is not only relevant for indication of supply
and demand dynamics but also relevant for investors and market participants. Since
most investments in commodities are conducted via indices such as the Goldman Sachs
Commodity Index (GSCI), which again take on the respective roll yields when rolling over
the futures contracts at the end of each month, the term structure plays a significant role
in commodity investments.
2.3 Oil Futures Markets
Oil futures contracts are standardized and have been traded for example on the NYMEX5
since 1983 with WTI crude oil as underlying. One NYMEX contract for WTI with delivery
on a specific month features delivery of 1000 barrels of crude oil at Cushing, Oklahoma
(USA). However, due to the standardization oil futures contracts function mainly for risk
management. According to CFTC, only a very small fraction of oil futures contracts led
to actual physical delivery from 2003:1 to 2008:5 (Interagency Task Force on Commodity
Markets, 2008, p.17).
The structure of crude oil futures markets is plotted by the CFTC with commercial and
non-commercial participants while the purpose of actual hedging differs both classes. As
defined by CFTC, subclasses for commercial participants consist of commercial producers,5The CFTC publishes a weekly Commitments of Traders Report to provide information about marketactivity in futures and options. For more information see www.cftc.gov.

CHAPTER 2. OIL PRICES: DYNAMICS AND FUNDAMENTALS 10
commercial manufacturers, commercial dealers and swap dealers. Subclasses for non-
commercial participants consist of hedge funds, and floor brokers and traders (Interagency
Task Force on Commodity Markets, 2008, p.21).
Significant amounts of investment capital has flown into commodity markets the last
years. With the persistent price rise from 2003 to 2008 speculation arose that rather
this capital inflow and not market fundamentals contributed to the price spike, but this
has been mostly denied6, see e.g. Smith (2008), Interagency Task Force on Commodity
Markets (2008) and Buyuksahin, Haigh, Harris, Overdahl, & Robe (2008).
Although stochastic and specific features in oil price time series are not discussed
here, the interested reader may see for example (in chronological order) Fama & French
(1987) and Deaton & Laroque (1992) on commodity futures prices, Crowder & Hamed
(1993) on oil futures markets’ efficiency, Sadorsky (2002) on time-varying risk premiums in
petroleum futures prices, Krichene (2006a) on stochastic features of oil prices until 2006,
Gorton, Hayashi, & Rouwenhorst (2007) on commodity futures risk premium and Choi &
Hammoudeh (2009) on the long memory in prices of oil and refined products.
2.4 Foreign Exchange Rates
Oil prices predominantly trade in U.S. dollars and are thus susceptible to exchange rate
movements. However, currencies of major oil exporters and importers also face impacts of
oil price changes. The relationship is hence bidirectional and the relevance for each factor
varies considerably. Intuitively, a depreciation of the U.S. dollar against other exchange
rates leads to a correspondent increase in oil prices. The underlying theory states, that a
U.S. dollar depreciation lets oil importers’ demand soar because of relatively lower prices
for oil. In turn, an oil exporter might seek to curb supply in order to reach a higher price
for its oil. According to the Interagency Task Force on Commodity Markets (2008), this
mechanism yields approximately proportional changes, other factors held constant.
Research also provides some evidence. For example Sadorsky (2000) tested energy
futures (crude oil, gasoline, heating oil) against a trade-weighted index for exchange rates
and found significant results. He demonstrates that a long run relationship between ex-
change rates, crude oil, heating oil and gasoline prices exists as indicated by cointegration6At the time of writing, CFTC changed its stance regarding this issue and planned on toughening regula-tions for speculative trading (non-commercial participants). This change can be attributed to the changeof political will with the inauguration of the Obama administration.

CHAPTER 2. OIL PRICES: DYNAMICS AND FUNDAMENTALS 11
results7. Furthermore, short run relationships as tested by Granger causality8 exist be-
tween crude oil and exchange rates, as exchange rate movements precede crude oil price
movements. Because crude oil is predominantly traded in U.S. dollars, exchange rate
movements have a not negligible effect on crude oil prices. Sadorsky’s findings are in line
with other research and confirm mechanisms reported regularly by commercial commodity
market research.
The persistent devaluation of the U.S. dollar against other currencies since 2002 re-
portedly contributed to the correspondent rise in oil prices (Interagency Task Force on
Commodity Markets, 2008). Oil producers saw their revenues erased by depreciating in-
come. Anecdotal evidence reported that oil producers began to look for diversification.
For example, Iran9 started to sell its oil mostly in Yen and Euros (Reuters, 2007).
2.5 Discussion of Oil Price Endogenity
Most studies assume and argue in favor of exogenous oil prices. Since the most impor-
tant oil price spikes in the last decades coincided with geopolitical events such as OPEC
embargo, Iran war, and Iraq Wars edition one and two, most researchers implicitly as-
sume that oil prices are more or less independent from other factors. Yet, this assumption
seems highly questionable given the arguments above. Rather, events which span only
over a limited period of time may well lead to oil price changes, but fundamental middle
to long term trends of world oil demand rather do the trick. A number of studies also
raised doubts and evidence in favor of the endogenous nature of oil prices such as Hooker
(1996b), Kilian (2008b), Barsky & Kilian (2000), Krichene (2006b), Ewing & Thompson
(2007) and Miller & Ratti (2009).
Kilian & Vega (2008) again examine whether oil prices react instantaneously to macroe-
conomic news, a notion which is is also often spread by the popular press. However, they
do not find evidence which would support an immediate relation of a wide array of macroe-
conomic news (for example output, income, inflation and interest rates) and oil prices. In
fact, 99% of the variation in oil prices is explained by other factors than macroeconomic7A cointegrated relationship exists between two unit root processes, which are I(1), if the connection isdefined by a linear relation of an vector I(0) based on long term observations (Hamilton, 1994, p. 571ff).
8Granger causality states that one variable helps forecasting another, which includes short term horizon(Hamilton, 1994, p. 302ff).
9Other countries seeking for diversification are Russia and Venezuela. However, as these countries aretraditionally some of the more belligerent critics of the U.S., their rhetoric is to be taken cautiously.
CHAPTER 2. OIL PRICES: DYNAMICS AND FUNDAMENTALS 12
news. Kilian & Vega conclude that the common ordering of VAR models in a big number
of studies is correct.
Although Kilian & Vega (2008) find no evidence for the relation of macroeconomic
news and oil prices in high frequency data (daily and monthly), it is nevertheless out
of question that oil prices are driven by macroeconomic developments to a good share.
Supply and demand pricing meachnisms may be distorted by exogenous events, but in
general they hold true.

3 Oil and Economics: Oil Shock Research
The research body of oil and macroeconomics can roughly be divided into two parts.
Firstly, research around oil shocks was borne out of the respective historical context during
the last decades. This part rather looks at the macro-level, whether the economy as a whole
was influenced, measured by highly aggregated variables such as GDP. It also concentrates
mostly on technicalities. Secondly, the questions of how and by which mechanisms affect
economies are addressed. This part of research evolved predominantly during the last
decade. For some part, data availability and technological progress might have enhanced
this part of research. This recent part of research is subject of chapter 4.
Since most research employs U.S. data, chapter 5 provides distinct findings for the
UK, Japan and Germany. Most empirical studies work, unless stated otherwise, in a VAR
framework and test variables such as GDP, interest rates, inflation, unemployment or real
income.
3.1 Oil Shocks and Their Historical Context
When looking at the respective dominating topics of research since the 1970s in combina-
tion with the oil price path, it is straightforward to recognize that each of the topic was
borne out of time. The initial wave of oil and economics research mounted right after the
first major oil shocks in the 1970s. These oil shocks were accompanied by high levels of
inflation and at some point stagflation. Research at that time concluded consequently that
rising oil prices had a negative influence on the economy. However, as oil prices retreated
in the 1980s, it suddenly became puzzling whether falling oil prices actually should prep
economic growth if it was not an asymmetric or nonlinear relationship. Thus, researchers
began working on nonlinear oil price specifications since oil prices entered a phase of rela-
tively lower volatility in the course of the 1990s. During that time, research unanimously
argued that the oil and macroeocnomic relationship broke down. In the consequence, re-
search focused more on technicalities and methods and not so much on transmission and
causal relationships. After this era, research on oil prices leveled out and only after oil
prices started to rise significantly and persistently in the early 2000s, research picked up
again. Economic variables and growth did not react as expected in the course of these
years and researchers again started to look for this reason either by looking back taking
13

CHAPTER 3. OIL AND ECONOMICS: OIL SHOCK RESEARCH 14
into account the respective circumstances of the early oil shocks and concluding that the
factor oil might have been overstated, or proposing that oil shocks need to be disentangled
regarding their origin.
The historical development of oil and economics also found some repercussion in aca-
demic research as Blanchard & Gali (2007) also seek to fathom the puzzle macroeconomic
resilience posed in the 2000s and ask the question which factors distinguishes the 1970s
from the 2000s. The 1970s were characterized by low economic growth, high unemploy-
ment and high inflation, whereas in the 2000s, economic growth and inflation remained
rather stable in most developed economies despite two oil shocks since the late 1990s,
which were of comparable size to the 1970s shocks. During both episodes, the global
economy has been hit by coincidental shocks, such as steeply rising commodity prices in
the 1970s and a phase of high growth and demand in the 2000s. Blanchard & Gali formu-
late four hypothesis which could be responsible for the profound change: good luck (no
other coinciding adverse shocks), decrease of oil intensity in production, higher flexibility
in labor markets and refined monetary policy. The models comprise data for the U.S.
(1960:1-2005:4), as well as France, Germany, UK, Italy and Japan (1970:1-2005:4) and
include variables for oil prices, CPI, GDP defator, wages, GDP and unemployment. First,
they estimate two VAR models with one larger model allowing for a structural break in
the mid 1980s (all countries) and the other as rolling bivariate VAR (only for U.S. data).
In a second step, they test for the four hypotheses stated above in a new-Keynesian model
(only for U.S. data). Based on test results, Blanchard & Gali conclude that the impact of
oil shocks prices, wages, output and employment indeed gradually declined generally over
the last decades. Also, all four hypotheses are found to have played a significant role.
The results from Blanchard & Gali (2007) undermine that research regarding oil and
economics or financial markets always needs to be interpreted in combination with its
respective context. Global economic patterns change as well as capital and trade patterns,
and previous results may therefore prove redundant at some point. Most remarkably
though, it appears as if the 2000s are marked by another structural break but that has
yet to be examined and proven.

CHAPTER 3. OIL AND ECONOMICS: OIL SHOCK RESEARCH 15
3.2 Asymmetry
The arguments of asymmetry and nonlinearity arose mainly during the 1970s and 1980s
and attracted a lot of interest. It is actually still the foundation of the common notion
“beware of rising oil prices”. This notion could be weakened at least in research as some
of the early results were revisited and revised in the later 1990s. But still, asymmetry is
an often cited argument in newer studies, albeit it seems somewhat outdated since other
studies offer more insight and more sophisticated arguments than the simple proposition
of asymmetry without further specification.
Most macroeconomic studies work with very long data samples for technical reasons.
However, it might be questionable whether this may distort some findings since the early
decades, the 1970s and 1980s, faced profoundly different dynamics and macroeconomic
circumstances than its was the case in the 1990s and 2000s.
Hamilton’s (1983) widely renowned and often cited study on oil and the macroeconomy
was de facto the starting point of an ever growing discourse in research dealing with
the relationship of oil and the economy, which started off with the common notion of
a negative relationship of oil prices and macroeconomy. Hamilton showed in his study
that since the second world war, seven of eight U.S. recessions “have been preceded,
typically with a lag of around three-fourths of a year, by a dramatic increase in the price
of crude petroleum” (p.228). The study comprises long term time series from 1948 to 1972
(state regulation on oil prices abandoned) and from 1973 to 1980. The hypothesis of oil
prices triggering or contributing to recessions against alternative hypothesis of coincidence
and other undetected macroeconomic variables is tested with VAR modeling. Hamilton
concludes that neither of the alternative hypothesis can hold true and argues that oil prices
indeed play a part in or prior to recessions. He finds a negative empirical relationship of
nominal oil prices in form of the PPI for crude oil and products with GNP growth. Besides,
Hamilton stresses the role of geopolitical events during that time such as the Iran-Iraq war
(1980-81), the Iranian revolution (1978-79), the OPEC embargo (1973-74), and the Suez
crisis (1956-76) as well as certain strikes or other supply outages to have had determinate
impacts on the U.S. economy and oil prices.
As oil prices collapsed in 1985 and 1986, this decrease in oil prices failed to impose a
positive impact on the economy. Before the oil price slump in the 1980s, oil shocks have

CHAPTER 3. OIL AND ECONOMICS: OIL SHOCK RESEARCH 16
mostly been positive price spikes. Thus, researchers proposed the relationship of oil and
the macroeconomy to be asymmetric, as oil price increases and decreases obviously did
not exert the same respective diametral effect on the economy.
Mork (1989) proves this asymmetric relationship and defines two variables for oil price
shocks with one being zero for negative changes in real oil prices and the other one main-
taining its value for positive changes. Mork’s specification yields significant results for the
variable signifying positive oil price changes and non-significant results for the other vari-
able. In addition, Mork criticizes Hamilton’s (1983) results because the PPI is based on
the U.S. regulated oil price, which is based mostly on domestically produced oil and does
not take into account imported oil for world prices. Furthermore, U.S. domestic crude
oil prices were controlled by governmental agencies such as the Texas Railroad Commis-
sion, which set monthly production quotas based on monthly forecasts from 1948 to 1972.
These agencies also regulated often in favor of U.S. producers using high demand periods
for significant markups in prices. Hence, crude oil price data including price indices can
be expected to be distorted until 1972 (Hamilton, 1983). Instead of PPI, Mork suggests
to use refiner acquisition costs, which are based on domestic and imported oil, as real oil
prices and could show more differentiated results than Hamilton’s this way.
These two early studies are some of the most cited and renowned papers in the research
body of oil and macroeconomics. Especially Mork’s suggestion for the oil price variables
was picked up in subsequent papers, which incorporated his specification of oil prices.
Furthermore, numerous studies approved his results.
Only in the later 1990s, oil and economics research resumed. Naturally, low and less
volatile oil prices failed to attract considerable interest and this strand of research lay
a little dormant during that time. A number of studies also revisited the early times
of oil and macroeconomics in the 1970s. For example, Hooker (1996b) elaborates with
a higher degree of econometric sophistication on this topic. He reassesses the oil price-
macroeconomy relationship and finds that oil prices failed to Granger cause a variety of
macro indicators after 1973. A structural break in 1973 seemed obvious due to a number
of reasons. First, 1973 marked the starting point for a period of marginally declining
productivity, flexible exchange rates and low interest rates. Second, oil prices ceased to
be subject to state regulation. However, Hooker is not able to pin down the reason for
the puzzling fact that the oil-macroeconomy relationship broke down after 1973.

CHAPTER 3. OIL AND ECONOMICS: OIL SHOCK RESEARCH 17
Although Raymond & Rich (1997) also follow the argument of asymmetry, they employ
a Markov Switching Model1 contrary to most other contributions, which estimate VAR
models. Business cycle fluctuations, which represent the two states of negative and positive
growth rates, and oil price shocks (measured in net real oil price increases) are subject of
this paper. The underlying assumption emanates from the differing behavior of output
in the two states and the distinguishing element of shifts between these states. Raymond
& Rich find that oil price increases mainly affect the mean of output during low growth
phases rather than account for the switching between the states. Only the recessions2
from 1973 to 1975 and in 1980 could be attributed to the trigger of oil price increases.
The transition to recession in 1990 and 1991 can only partially be explained by oil price
increases. During other low growth phases, the increases of oil prices are negligible for
the transition as well as for the magnitude of the changes in the mean of output. Barsky
& Kilian (2004) support the argument that increases in oil prices, if anything, contribute
to recessions but do not necessarily cause recessions. They deduct this argument from
the timing pattern of oil price increases and recessions, which they find consistent with
it. Also, Kapetanios & Tzavalis (2004) strengthen this notion as their test results show
only for the recession in 1973 a negative connection of industrial production activity with
rising oil prices, while after the 1980s the connection is negligible.
Even more recently, Lardic & Mignon (2008) deduct from the asymmetry argument
that cointegration test should by asymmetric as well. Asymmetric cointegration (oil price
and GDP data for the G7, U.S.,Europe and Euro area) differs between oil price increases
and decreases with respective coefficients. The researchers conclude that indeed oil price
increases exhibit more influence in oil prices than do price decreases in all tested data
series. In addition, they do not detect standard cointegration in the data. However, this
study does not offer any particularly new insights as it rather supports previous results
by means of a different econometric method, asymmetric cointegration.
The aspect of asymmetry in the relation of oil and macroeconomics is frequently picked
up also in recent research. However, mostly it is rather used for some specific aspect or
part of the underlying rationale of the respective topic to be assessed. This aspect hence
surfaces at some points in the latter part of this thesis again.1Please see e.g. Hamilton (1994, p.690ff).2Based on the NBER definitions and data as reference.

CHAPTER 3. OIL AND ECONOMICS: OIL SHOCK RESEARCH 18
3.3 Nonlinear Measurement and Specification
The strand of research around nonlinearity picked up Mork’s (1989) concept of defining a
specific oil price variable in order to grasp the real relationship of oil and economics. This
was partly caused by unstable empirical results over the last two decades so researchers
assumed misspecification. In the later 1990s, two of the three most popular oil price
variables were proposed by K. Lee, Ni, & Ratti (1995) and Hamilton (1996) which are
mostly tested together with Mork (1989). Their work directly relates to the studies cited
above.
Taking into account Mork’s (1989) results and including the role of price variability
and its environment (“memory”), K. Lee et al. (1995) construct an oil shock variable,
which is based on the volatility evironment of the oil price. K. Lee et al. argue that oil
price innovations have a bigger impact in an environment with little variability than in an
already volatile environment. During periods of high price variability, oil price innovations
are not believed to embody important new information and seem not to trigger the same
impact as innovations during low variability periods. The oil price variable is scaled
by a measure of price variability. An univariate GARCH3 error process incorporates the
innovative component in the variable setup. Tests comparing Mork’s variable to the scaled
oil price variable (analogous one increase and one decrease variable) in the same VAR4
model show significant and stable results for the “Scaled Oil Price Increase” (SOPI).
Furthermore, variables for real oil price increases and decreases as well as real oil price
change are not significant, when tested simultaneously with the scaled variables.
Based on the same argument as the variable proposed by K. Lee et al. (1995), Hamilton
(1996) suggests an oil price variable, which accounts for previous oil prices (variability).
The variable “Net Oil Price Increase” (NOPI) is the percentage of the difference of the
current quarter to the maximum of the four previous quarters, in case the price of the
current quarter exceeds the maximum. In case of a lower price the variable is zero. With
this, real oil price increases, which are corrections to previous decreases, can be filtered
out. Hamilton finds NOPI to be statistically signficant when regressed to GNP growth.3GARCH depicts Generalized Autoregressive Conditional Heteroskedasticity. Please see e.g. Hamilton(1994, p.657ff).
4Vector Autoregressive models. Please see e.g. Hamilton (1994, p.291ff).

CHAPTER 3. OIL AND ECONOMICS: OIL SHOCK RESEARCH 19
Hooker (1999) again challenged the idea of oil price transformations since he found no
Granger causality of nonlinear oil price transformations (NOPI and SOPI) with output
and unemployment. According to Hooker, nonlinear oil price transformations sought their
apparent good fit from data in the 1950s in opposition to their actual determination of
reestablishing the link to output. He readjusted the testing framework by using yearly
instead of quarterly data and reducing the usual multivariate equations by the variables
interest rates and inflation. Furthermore, nonlinear oil price transformations are tested
against real level of oil prices, which are linear and symmetric in nature. Test results
show, that the nonlinear transformations affect output but not unemployment, whereas
real oil prices exhibit effects vice versa. The reduction to bivariate equations reflect indirect
transmission via inflation and interest rates of oil prices into the macroeconomy, reasons
Hooker. In a more recent publication Sill (2007) re-estimates net oil price increases’
relation to GDP with quarterly data and demonstrates with impulse response functions
that a 10% increase NOPI leads to a 1.4% decline in output level and 0.6% in output
growth.
Other studies have evaluated these specifications, for example Bernanke, Gertler, Wat-
son, Sims, & Friedman (1997), Hamilton (2003b) and Gronwald (2008). While Bernanke
et al. prefer Hamilton’s NOPI measure, Hamilton derives in his tests for the ability of these
measures to capture the nonlinear relation of oil prices and GDP growth, that K. Lee et
al.’s specification and his specification perform best. However, the initial specification of
the net oil price increase is based on the previous four quarters, which causes problems, if
oil prices take more than a year to restore previous levels. Therefore, Hamilton includes
12 quarters in the specification (N3OPI) and finds this superior to the initial specifica-
tion. Gronwald (2008) evaluates his proposed oil shock specification, which differentiates
between high volatility (big oil price increases) and normal volatility (minor increases), in
comparison with NOPI and SOPI. He finds that although his specification of high volatility
requires less information, it is not outperformed by the NOPI/SOPI specification, which
comprise more information.
Generally, two types of specification have been proposed until now. The one type
is based on information of previous observations, such as N(3)OPI, SOPI and Mork’s
specification. Hamilton (2003b) concludes, that the nonlinear specifications filter out
“endogenous factors that have historically contributed to changes in oil prices” (p.395).

CHAPTER 3. OIL AND ECONOMICS: OIL SHOCK RESEARCH 20
The second type of specification use only information with regard to quantity or size, like
Gronwald (2008) and B.-N. Huang, Hwang, & Peng (2005) proposed recently.
The nominal oil price adjusted by the U.S. PPI, denoted as world real oil price, had
a come back in the lately published studies. Park & Ratti (2008), for example, also
tested one world oil price against the respective “nationalized” price of oil for every tested
country. They found that the world oil price, unadjusted for exchange rate movements,
yields more significant results and seems more suitable for analysis. Also, Miller & Ratti
(2009) employ one international oil price for their study. The oil price for this empirical
analysis is WTI benchmark crude oil price of the front month NYMEX futures contract
divided by the U.S. PPI for all Commodities. The real oil price is then transformed into
natural logarithms.
The discussion around these specifications clarifies the problem of determining or defin-
ing an oil shock. Because of their transformations they capture deviating periods of oil
price “shocks”. For example, oil price increases, which set off earlier declines over a time
span of more than one year, do less harm than on would expect out of absolute num-
bers only. However, there is broad consensus in literature about some historical events
in the oil market, which triggered severe outcomes in economies. A number of research
papers evaluate the three most prominent specifications and then tend to employ the one
with the respective clearest responses. Latest publications though neglected the nonlinear
specifications and turned to world reals oil prices.
3.4 Differentiation of Shocks
Most researchers discuss the nature and characteristics of oil shocks based on information
within the oil price data. After the steep oil price increase after 2003, however, the puzzling
question emerged, why economies of importing countries have not shown the expected
impact on industrial output or GDP growth. Kilian (2008b) argues, that oil shocks need
differencing with regard to their cause, whether it is a demand or supply driven oil shock.
More precisely, he defines three types of shocks: the oil supply shock, which refers to
unpredicted innovations in crude oil production; the aggregate demand shock, which is
driven by the global business cycle causing overall demand on commodities; and the oil-
market specific demand shock, which predominantly relates to precautionary demand due

CHAPTER 3. OIL AND ECONOMICS: OIL SHOCK RESEARCH 21
to insecurity of expected supply reflecting the convenience yield. These definitions oppose
the common notion of most researchers that oil shocks are treated as mostly exogenous5.
Kilian (2008c) claims that predictions on the impact of oil shocks are erratic without
knowing the reason for the oil shock in the first place. This argument is supported by
empirical results as impulse responses of real GDP and CPI show in a quarterly VAR
framework. Oil supply shocks trigger a statistical significant gradual decline of real GDP
within the first two years after the shock, but fail any response on CPI level. Demand
shocks show more distinct outcomes. While the shock on oil-market specific demand
leads to significant marginal decline in real GDP, the aggregate demand shock leads to an
initial rise of real GDP followed by a decline after three quarters. Because upswings in
the global business cycle incite growth in demand for commodities, this result holds as the
aggregate demand shock is based on a overall demand shock for commodities in general.
Both demand shocks lead to a persistent rise in CPI level and generate the result of the
generalized belief of rising prices due to rising oil prices.
Kilian (2008c) also demonstrates the historical nature of supply and demand shocks in
terms of real oil prices. A historical decomposition (1976-2008) shows that the cumulative
effect of oil supply is negligible, while the aggregate demand shock moves in major swings,
which is in line with the underlying rationale, and the oil-market specific demand shock
exhibits rather sharp spikes, mirroring the characteristic of precautionary demand shocks.
Lippi & Nobili (2008) follow in their analysis of oil and the U.S. macroeconomy Kilian’s
argument and validate that distinguishing the underlying shocks is necessary for forecast-
ing the impact (sign and size) on production. Within a sign-restricted VAR framework,
demand and supply shocks are possible for the consumer, the U.S. in this case, and for
the oil market. Lippi & Nobili use oil price, oil production, U.S. IP and producer’s prices
as variables, while the “allowed” reaction of these variables to the four different shocks
is partially restricted in its sign. The empirical results of this study are roughly in line
with Kilian’s findings, as an oil supply shock leads to a decrease of IP and prices rise to
a minor degree, and an oil demand shock triggers an increase in IP. Relating to Kilian’s
expressive inclusion of a shock in precautionary demand, Lippi & Nobili find that their
model inheres this kind of shock.5For a discussion on the endogenity of oil prices please see section 2.5.

CHAPTER 3. OIL AND ECONOMICS: OIL SHOCK RESEARCH 22
This position within the oil and macroeconomic research6 proved influential already as
it introduced significant new evidence and succeeds in explaining puzzling developments.
A number of studies already picked up or adjusted the methodology. The differentiation
of oil shocks actually explains previous difficulties in empirical research and takes into
account the fundamentals of oil prices, which makes it a very reasonable approach. One
pitfall of this approach is, however, the availability of data with regard to the oil shocks,
where Kilian (2008c) uses an index for global real activity which bases on dry cargo ocean
freight rates.
3.5 Size
Closely related to the introduction of oil price transformations is the aspect of the size
or magnitude of an oil shock. How much does it take for an oil price increase to trigger
measurable economic effects? In the last years some studies have been conducted in this
area and found statistic evidence for the threshold thesis. The question of a potential
threshold arose with the persistent rise in oil prices from 2003 on. As macroeconomic
data seemingly did not pick up or mirror these movements as it did in the decades before,
researchers were looking to grasp the presumably altered dynamics. It is a less fundamental
approach, when compared to the section above.
B.-N. Huang et al. (2005) demonstrate in a study including Japan, the U.S., and
Canada that oil prices and oil price variability need to cross an individual threshold for
oil shocks to be significant. B.-N. Huang et al. argue that each country has a specific
threshold according to its vulnerability to oil shocks, meaning its share of imports. While
Canada is a net exporter, Japan depends completely on imports and the U.S. still produces
domestically for a good share of its consumption. In a multivariate threshold autoregressive
(MVTAR)7 model B.-N. Huang et al. include variables for real oil prices, oil price changes,
real stock returns, industrial production and interest rates. They prove their intuitive
thesis that countries have individual thresholds for oil price change and that volatility has
an impact on the economy. Japan, for example, has a lower threshold than the U.S. and
Canada. Further, they find that oil prices can rather explain economic variables, whereas
price volatility have greater explanatory power in real stock returns.6Kilian also applies this concept to oil and stock markets, see Kilian & Park (2008).7Please see Tsay (1998b) for the motivation of a MVTAR model.

CHAPTER 3. OIL AND ECONOMICS: OIL SHOCK RESEARCH 23
Kapetanios & Tzavalis (2004) address the same question as B.-N. Huang et al. (2005),
although stating structural breaks as reason for the instability of the oil and macroe-
conomic relationship. When looking for structural breaks, researchers need threshold
parameters to detect the breaks within data. A transgression of this parameters induces
shifts of slope coefficients and relations. Kapetanios & Tzavalis estimate the threshold
parameter endogenously out of sample and define a threshold of 2.2% in absolute value
terms (of the oil price). They can prove their thesis that the instability of the oil and
macroeconomic relationship can be attributed to large oil price shocks.
In a recent paper Gronwald (2008) researches the impact of oil price shocks (U.S.
data only) in the common VAR framework, however, approaching the question of oil price
specification via a Markov Switching (MS) model8. Gronwald assumes the real oil prices
(in first log-differences) to follow a heteroskedastic MS process, which allows for different
magnitudes of the oil price shocks, and sets three regimes of low, normal and high volatility.
Derived from the three regimes, he introduces two new oil specification variables, with one
capturing high oil price increases and the second one oil price decreases as well as oil prices
subtracted by the increases. Although this approach seems similar to Hamilton (1996) and
K. Lee et al. (1995), Gronwald’s specification does not take into account previous price
movements or the history and differentiates by magnitude only.
Albeit starting from different angles, B.-N. Huang et al. (2005), Kapetanios & Tzavalis
(2004) and Gronwald (2008) find evidence for certain thresholds of oil price changes and
volatility for oil shocks indicated by significant effects in macroeconomic variables. The
vulnerability of an country to oil shocks seems to have an impact on the threshold. How-
ever, only B.-N. Huang et al. (2005) gave a concrete example for a threshold, which also
can well be found within a normal bandwidth of daily oil price fluctuations.
Taking another stance within this body of research, Huntington (2007) criticizes that
by taking the output variable GDP, the impact of the purchasing power is neglected.
Instead, he argues for measuring the economic impact by real income, which inheres U.S.
purchasing power. Huntington states, that a doubling of oil prices leads to an additional
fall of 1.0% to 1.7% in real income beyond the baseline value one quarter later. The
decline in real income is passed through the impact on real output with a time lag and8Please see e.g. Hamilton (1994, p.690ff).

CHAPTER 3. OIL AND ECONOMICS: OIL SHOCK RESEARCH 24
instantly through terms of trade of an oil-importing economy, while the share of oil imports
determines the vulnerability.

4 Oil and Economics: Transmission Research
The relationship of oil and macroeconomy is foremost determined by the transmission
channels of oil prices within the economy. Research undertaken in this field follows either
the “indirect” argument of a pass-through via monetary policy and inflation, or the ar-
gument of the more direct transmissions via decline in demand and sectoral shifts inter
alia. However, the common preliminary of these studies is the adverse connection of oil
prices and macroeconomy. Empirical results have at best been mixed, so that there is no
dominant theory to follow. Admittedly, as many researchers state, one stand-alone effect
may not have the impact to send an economy into recession but the combination of various
effects may well have.
Research about transmission channels addresses the paths of how oil prices trickle
down the economy. The term “transmission channels” again might be somewhat mis-
leading, as examined sectors, dimensions or variables of the economy and their respective
measurements may also be the end of the road to some degree. These strands of research
were mostly accomplished since the early 2000s, with one important exception, namely
research on monetary policy, which arose one decade earlier. Oil shocks seemed to be a
good way to assess the effectiveness of monetary policies aiming at inflation and the like.
Ferderer (1996) was one of the first to address the question of transmission channels
on an empirical basis. He aimed at answering the question of the relationship from the
point of (monthly) oil price volatility. He also follows the rationale of the asymmetric
nature of the relation and evaluates three transmission channels, which could be respon-
sible. First, oil price uncertainty leads to weakening investments. Referring to Bernanke
(1983), the argument states that the optimal option for a firm facing an investment de-
cision between energy efficient or inefficient capital is to postpone the decision until it
can make the right choice when uncertainty falls back low. Therefore, an increase in oil
price volatility reduces the incentive to invest. Second, sectors within the economy can be
either positively or negatively affected by a relative change in oil price (volatility). The
transmitted impact on employed workforce and the probable consequences are subject of
this argument. Because unemployed workforce on a negatively affected sector, instead
of retraining and transferring to another sector, stays rather unemployed until the sector
faces a more positive environment again, macroeconomic costs arise. Third, tightening
25
CHAPTER 4. OIL AND ECONOMICS: TRANSMISSION RESEARCH 26
monetary policy might also contribute to the asymmetry. Ferderer (1996) derives from his
results that, only the first and the second channel account for the asymmetry from 1970
to 1990 within the U.S. Furthermore, he finds that oil price volatility can also explain a
considerable part of fluctuations in output growth.
4.1 Direct Transmission Channels
The term “direct transmission” depicts any impact of oil price changes on the economy,
which are not triggered by an reaction on oil prices itself. Monetary policy for example aims
at maintaining a low inflation environment and reacts accordingly by taking a restrictive
stance, in case Fed economists expect or notice rising inflation due to rising energy prices.
These measures though also have some significant impact, which is subject in the next
section. Direct transmission again adresses the impact of oil price changes on interest rates,
customer expenditures, business investment, industrial production and employment.
4.1.1 Interest Rates
Balke, Brown, & Yucel (2002) stress that besides the effects of monetary policy responses
to rising oil prices, interest rates are one important channel through which oil prices
transmit. They also find asymmetric effects in interest rate responses to oil price changes.
One explanation for this impact is that the very liquidly traded interest rates anticipate
adverse impacts in the economy, which may emanate with some time lag. The second
explanation is, that oil price variability leads to financial stress, which again lead interest
rates to decline.
For example Balke et al. (2002) analyze the origination of the asymmetry and find
asymmetric responses not only in GDP growth, but also in short term interest rates and
the fed funds rate.
4.1.2 Customer Expenditures
Customer expenditures have a considerable influence on the economy and it is straight-
forward to assume that customers react outrightly on rising energy prices, since they are
ultimately hurt by rising gasoline prices, food prices and heating cost for example. Also,

CHAPTER 4. OIL AND ECONOMICS: TRANSMISSION RESEARCH 27
shifts in demand can occur as evidence from early summer1 2008 with steeply rising oil
prices shows, when sales for U.S. gasoline-thirsty cars de facto collapsed (Reuters, 2008).
Research though neglected this presumably important issue and there is little empirical
evidence for customer expenditures’ respones to oil price shocks.
Kilian (2008b) gives a comprehensive synopsis of how customer expenditures can be
affected by oil price changes. As direct channels he subsumes the discretionary income
effect, the uncertainty effect2, the precautionary savings effect and the operating cost
effect. The discretionary income and the operating cost effect imply less consumption
because of price increases. In case qualitative shifts in demand require reallocation of
production, patterns of consumption expenditure change according to Kilian, which again
has effects on employment due to reallocation effects. These effects are closely interrelated,
have feedback effects and may also re-enforce each other. Estimations for the energy-price
elasticities of energy demand for one year demonstrate an inverse relation and a coefficient
of -0.45 with error band from -0.27 to -0.66. When differentiated by product, gasoline
price demand elasticity has a coefficient of -0.48 whereas heating oil and coal demand
elasticity is far more elastic with -1.47 since both goods are storable. Elasticities of non-
energy aggregates are comparatively small with -0.15, whereas the elasticity of demand for
vehicles is -0.84. The elasticities for other durable goods are weak. In general, elasticities
are higher on a longer term horizon as consumers adjust their investments, for example in
less energy intensive heating installations.
Kilian’s (2008b) estimations of demand elasticities provide good support for intuitive
arguments, such as given above, and undermine in general notions from the popular press.
4.1.3 Business Investment
Within transmission channel research, the transmission of oil prices into the economy via
business investment in structures and equipment found often support on a theoretical basis.
Responses to oil price increases (implies asymmetry) such as the uncertainty effect and
the reallocation effect, which was introduced by Hamilton (1988), were often supported1Decline in U.S. car sales can be attributed more directly to oil prices in early summer 2008, as in thecourse of summer 2008 the credit crisis began to unfold in the real economy. Car sales even fell at a morerapid pace in August and September but it is difficult to sort out the influence of the starting recessionfrom the influence of the oil price shock (oil prices peaked on July 11, 2008 at U.S. Dollar 147/bbl).
2The uncertainty effect leads to lower (actually postponed) investment due to the uncertainty of high oilprice volatility, as proposed by Bernanke (1983).

CHAPTER 4. OIL AND ECONOMICS: TRANSMISSION RESEARCH 28
on a theoretical basis. Yet, Edelstein & Kilian (2007) were the first to examine the effects
of oil price changes on business investment on a thorough empirical basis.
The study conducted by Edelstein & Kilian (2007) comprises U.S. data by industry
from nonresidential investment in structures (commercial and health care, manufacturing,
power and communication, mining and other structures) and in equipment (information
processing, industrial and transportation equipment, mining and oil field machinery, and
all other equipment) from 1970:2 to 2006:4 and employs a VAR3 model. The often cited
asymmetry in business fixed investment is found to be erratic. Edelstein & Kilian find
two factors which lead to the apparent asymmetry. First, mining-related expenditure is
aggregated in the data of business fixed investment. The mining and oil industry though
distorts the results in that it is predominantly driven by energy prices with a detrimental
impact when compared to the rest of the economy. Second, an exogenous shift occurred
with the Tax Reform Act in 1986 which eradicated real estate tax shelters, namely in-
vestment in structures. Business investments consequently fell sharply and also surfaced
in the data leading to false conclusions. After correcting for these two factors, estimated
responses for business investment behave symmetrically. The reallocation and uncertainty
effect find thus little support in the data. Furthermore, historical decomposition of vari-
ance shows that energy price shocks only had a negligible impact on investment, bar the
mining and oil industry.
Edelstein & Kilian (2007) also correct the common notion that energy intensity, or the
share of energy in production cost, has been in decline since the 1970s. Rather, energy
intensity rose from 3.3% in 1977 to its historical maximum of 5% in 1981, fell to 1% in
1998 and is back to the level of the seventies, 3.3% in 2005 respectively. Besides that, they
refrain from employing aggregate PPI or crude oil pricing data and account for regional
refining impacts by employing the PPI for fuels and lubricants.
The study offers a good insight into the transmission of oil prices in economics. It
adjusts previous evidence, which lead to misleading reasoning. Prominent arguments
such as reallocation and uncertainty effects, which are logic and compelling, have been
questioned.3Please see e.g. Hamilton (1994, p.291ff) for the motivation of Vector Autoregressive modeling.

CHAPTER 4. OIL AND ECONOMICS: TRANSMISSION RESEARCH 29
4.1.4 Industrial Production
The manufacturing part of of most Western economies is watched with Argus-eyes as it is
considered to be the backbone of industrialized countries. Nonetheless, there are very few
studies concentrating on the aspect of how industrial sectors react to oil price changes in
particular.
K. Lee & Ni (2002) examine in their study how oil shocks affect various industries
within the U.S. In a VAR framework they differ between the supply side input-cost effect,
which leads to a decline in productivity, and the demand side income effect, which lets
disposable income decline as costs of imported oil rises. Data of industry output measure
the demand side, whereas the producer price of the respective industry cover the supply
side. Hamilton’s (1996) NOPI variable functions as oil price variable. K. Lee & Ni counter
the often cited argument that the actual cost share of oil may be comparatively small
by arguing that combined effects in various industries might have recessionary power.
They observe that the petroleum refining, industrial chemicals and automobile industry
face the most severe impact. The automobile industry is confronted with demand side
effects as consumers avoid to buy new cars due to various possible reasons. The U.S.
automobile industry produces predominantly full size cars, which seem unpopular in times
of relatively high oil prices. As can be expected, the industrial chemical and petroleum
refining industries suffer foremost from supply side shocks. Both industries accounted for
55% of the energy used in the manufacturing sector in 1994.
Herrera (2008) approaches the topic from the specific angle of looking for explanations
of the obvious time lag between oil price shocks and real GDP growth, which has been
estimated to be four quarters. The study comprises 21 U.S. manufacturing industries from
1958:1 to 2000:3 on a quarterly basis and employs both a VAR with NOPI as oil variable,
sales and the inventory-sales ration as well as a structural model, which however yields
roughly the same results. Herrera finds the most distinctive results for motor vehicles,
which has a strong correlation with oil prices. Oil price shocks do have an immediate effect
on new motor vehicle sales and inventory-sales, whereas motor vehicles output shows a
more muted effect as the inventory-sales ratio rises. More generally, Herrera deducts five
conclusions from her analysis. First, oil prices increases lead to a decrease in industry-
level sales with the following industries hurt the most: motor vehicles manufacturing,

CHAPTER 4. OIL AND ECONOMICS: TRANSMISSION RESEARCH 30
other durables, and oil intensive industries such as petroleum products or rubber and
plastics. As response to a 10% NOPI increase, these industries face declines in sales of
2.91%, 1.5%, 1.33% and 1.58% respectively. Second, industry- level output drops due to
oil price shocks with some possible time lag of up to three quarters. Third, sales retreat
at a faster pace than inventories. Fourth, motor vehicles sales and output are hit worst
with a 9.04% slump in manufacturing as the economy slows in the second year reaching
the trough. Fifth, energy intensive industries and industries which depend on demand by
motor vehicles also face significant downfalls in sales and production.
These empirical results by K. Lee & Ni (2002) and Herrera (2008) rather point to the
demand side argument as transmission channel and not so much on the input-cost side.
Of course, energy intensive industries are hurt by oil price increases, but it is reasonable to
assume that input-costs might have a lower elasticity than consumer demand as demand
is not bound by contracts. This discussion gets further insights from the later section 7.4
where stock prices add valuable information.
4.1.5 Employment
The common notion about oil price increases and employment bases upon the argument
that labor productivity declines as energy inputs decline due to cost pressures. There-
fore, real wages need to decrease in order to maintain the level of employment. Sticky
wages otherwise let employment decline (Bohi, 1991, p.155). Davis & Haltiwanger (2001)
research how U.S. manufacturing employment was affected from 1972 to 1988. They sup-
port the asymmetry argument as their results show asymmetric responses in employment
growth figures to oil price changes. Overall, 20% to 25% of a shortfall in employment
growth can be attributed to oil shocks, as measured by an oil shock index4. Furthermore,
they found an adverse relationship in responses to oil price increases of employment and
the characteristics of an industry measured by capital intensity, product durability and
energy intensity. Shifts in job allocation within the manufacturing sector also occurred.
In a more disaggregated study, which includes not only employment within the manufac-
turing sectors but the entire workforce and panel data, Keane & Prasad (1996) show that
real wages decrease with rising oil prices. Interestingly though, the relative wage of skilled4Davis & Haltiwanger (2001) set up an oil shock index, which is the log ratio of real oil price and weightedin marginal decline real oil prices including 10 lags, while the weights sum up to unity.

CHAPTER 4. OIL AND ECONOMICS: TRANSMISSION RESEARCH 31
workers rises. Aggregate employment is also only depressed in the short run after an oil
shock.
4.2 Indirect Transmission Channels
Indirect transmission research builds on inflation and on the impact oil price changes exert
on it. Monetary policy, however, aims at fighting rising inflation and therefore indirectly
interacts with oil prices. This section thus starts with inflation and stagflation, as historic
example of an “unlucky” phase of monetary policy versus oil prices, and elaborates then
on the connection of monetary policy.
4.2.1 Inflation
Gregorio, Landerretche, & Neilson (2007) give a good outline of oil price pass-through
and inflation. One important aspect of the oil price and inflation relation is real wage
rigidity and their flexibility to adjust to higher price levels, which in case of inflexible
wages may result in stagflation as pressure is deflected by reductions in employment. Also,
oil price shocks put pressure on margins and are passed through by higher prices. The
other important aspect addresses monetary policy and its credibility respectively. Inflation
expectations, which are a crucial factor for realized inflation, typically follow the central
banks credibility to tackle inflation. Restrictive monetary policies, e.g. by an interest rate
hike, sacrifices output for lower inflation. Gregorio et al. define a pass-through coefficient
as ratio of accumulated inflation and oil price change (24 month horizon), which appears
to be connected positively with inflation. Both, a rolling VAR and a Phillipps curve model
are employed and data of 24 countries is analyzed. They find that, the coefficient has been
weakening considerably since the 1970s throughout to mid 1980s. Gregorio et al. reason
that a decline in energy intensity and a diminished impact of exchange rates on inflation
are mainly responsible for that shift. As a consequence, monetary policies face less need
for restrictive policies.
Hooker (2002) also argues, that since 1981 oil price shocks seemingly lost their might
passing through to core inflation. A structural break in the U.S. Phillips Curve points
out that oil prices seem to be negligible. However, Hooker fails to verify his two possible
explanations of a decline in energy intensity and the deregulation of energy intensive

CHAPTER 4. OIL AND ECONOMICS: TRANSMISSION RESEARCH 32
(producing or consuming) industries during the last decades. Another reason, according
to Hooker might be monetary policy, which rendered less aggressive towards oil price spike,
though the causality is questionable, whether oil prices lost power because of a change in
monetary policy or vice versa. Hunt, lsard, & Laxton (2001) again cautioned about that
argument5, as oil price spikes during the 1980s and 1990s have been rather temporary and
not persistent.
Hunt et al.’s (2001) analysis of oil price pass-throughs is based on the IMF MULTIMOD
model6, which employs yearly data. Oil prices are allowed to transmit via variables of
inflation expectations (core inflation7 and CPI) and the degree of catch-up in real wages
as inflation expectations of workers adjust. Hunt et al. infer from their simulations that
monetary policy is largely responsible for the magnitude of oil prices passing through to
(core) inflation and stress the aspect of credibility of (expected) monetary policy.
Motivated by the persistent rise in oil prices, Cologni & Manera (2008) seek to establish
some evidence on oil price shocks, inflation and output for the G7 countries (1980 to
2003), taking into account monetary variables and estimating a structural cointegrated
VAR. They find that oil prices have a significant impact on inflation on all countries
but UK and Japan, and that shocks to the inflation rate are passed through by interest
rates. Furthermore, oil prices changes have an immediate but temporary effect on prices.
Monetary policies also do matter with regard to the transmission of oil price shocks as
indicated by national differences.
Although Sanchez (2008) does not include U.S. data in his research but focuses on the
euro area, his findings are displayed here nontheless, since they add enhancing details in
the discussion around inflation. Quarterly data from 1990Q1 to 2006Q1 and as alternative
period from 1970Q1 to 1989Q2 of real GDP, real private consumption, inflation, nominal
interest rates and oil prices is analyzed in a dynamic stochastic equilibrium model. In line
with other research results, Sanchez finds that oil price price shocks exert upward pressure
on inflation, diminish real wages and lead to price markups. Also, impulse responses show
weaker progressions in the post-1990 sample. Simulations demonstrate that improved oil
efficiency could moderate responses in inflation and economic contraction, while a higher5An earlier version of Hooker’s (2002) paper was published in 1999 as working paper of the Federal ReserveBoard.
6Please see http://www.imf.org/external/np/res/mmod/index.htm for details of the IMF MULTIMODmodel.
7Core inflation is defined as the rate of change in GDP deflator with oil excluded.

CHAPTER 4. OIL AND ECONOMICS: TRANSMISSION RESEARCH 33
degree of flexibility in wages could contribute to a softened response of GDP to an oil
shock, albeit at the price of higher inflation. With regard to price markups triggered by
an oil shock, Sanchez reasons that inflation and GDP are not affected substantially by
that, in addition to their actual response.
S.-S. Chen (2009) offers some interesting new insights by taking into account the trade
openness of a country and gradual changes in oil price pass-through, like Gregorio et al.
(2007). The study comprises 19 industrialized countries, reaches from 1970Q1 to 2006Q4
and estimates a Phillips curve model and an error correction model accounting for long
run effects. S.-S. Chen finds that the degree of national energy imports is positively
correlated with the degree of pass-through and that pass-through coefficients vary gradu-
ally over time. Notably so, most European countries face higher pass-throughs compared
to the U.S. In line with the papers cited above, the sensitivity of inflation to oil price
pass-through decreases over time with an (unweighted average) decline of pass-through
of 69.8%. The average pass-through of a 100% oil price increase translates into a 17%
rise in inflation over the lung run. As reasons for this decline, S.-S. Chen assesses several
factors such as low inflation environment, the share of energy consumption in the econ-
omy, the role of exchange rate movements, trade openness and the accommodative role of
monetary policy. By empirical examination, he shows that trade openness of an economy
reduces its vulnerability to pass-through, energy dependence also elevates the susceptibil-
ity and exchange rate movement exert a negative influence on the pass-through coefficient
(exchange rate increase implies appreciation rendering oil price spikes less inflationary).
Also, a tough stance of monetary policy on inflation reduced the pass-through. Energy
dependence though is found to be of less importance and the factor of a low inflation
environment is not supported by data.
The obvious decline of the inflationary power of oil prices is thus well explained by
S.-S. Chen (2009), as over the last decades most industrialized economies underwent struc-
tural changes of introducing flexible exchange rates, opening up and liberalizing global
trade and augmenting the power of monetary policies in order to fight inflation, which
was an important learning from the 1970s.

CHAPTER 4. OIL AND ECONOMICS: TRANSMISSION RESEARCH 34
4.2.2 Stagflation
Stagflation is a keyword in common discussions around oil price shocks, suggested pre-
dominantly by the popular press and by policy makers. However, little empirical evidence
has been proposed in order to clarify the circumstances of the prominent stagflation in
the early and late 1970s. Renewed interest arose in the 2000s, when Barsky & Kilian
(2000) questioned the presumably dominating role of oil supply shocks in triggering these
recessions and pointed to monetary explanations instead. Hunt (2006) supports this view
in his analysis.
Barsky & Kilian (2000) argue that monetary policies in the preface and during the
U.S. recessions of 1973-75 and 1979-82 played a leading part, and that oil price shocks
during that time were partly endogenously pushed upwards and partly imposed by OPEC.
The U.S. central bank pursued expansionary monetary politics at the beginning of the
1970s and followed a stop-go pattern subsequently as inflation picked up due to excessive
monetary growth. This was followed by restrictive policies to fight inflation sacrificing
economic growth and then again expansionary politics to tackle the recession. U.S. money
growth spiked twice in 1971-72 and 1975-77. The sharp oil price increases again trailed
major commodity price booms, which again were sparked previously by global liquidity
growth. OPEC imposed oil price increases were only sustainable due to excess demand,
otherwise they would have faltered. Oil prices retreated in the early 1980s as economic
growth weakened demand and significant growth in non-OPEC production reduced the
might of the cartel. Had OPEC controlled two thirds of world oil in 1977, this share
slumped to below 50% in 1982. Incentivized by high oil prices in the 1970s, major oil
producers such as Egypt, Angola, Malaysia, China, Norway and UK ramped up production
and altered the world of oil profoundly. Barsky & Kilian conclude that policy makers
misinterpreted the inflation in 1973/74 as caused by oil supply shocks and thus failed to
learn from their mistakes and by this laying the ground for the second round of stagflation
in the late 1970s.
Hunt’s (2006) analysis partly supports Barsky & Kilian’s (2000) findings, but pursues
a profoundly different approach. While Barsky & Kilian mostly analyzed U.S. data and
put it into historical perspective, Hunt models a variant of the (structural) IMF General
Equilibrium Model (GEM). Simulation results show that stagflation similar to the 1970s

CHAPTER 4. OIL AND ECONOMICS: TRANSMISSION RESEARCH 35
can only occur due to sharply risen energy prices, if monetary authorities mistake the
supply capacity of the economy and if workers are temporarily able to withstand the
erosion of their real consumption wages to some extent. Without these factors, energy
prices fail to generate stagflation.
Although Hunt’s (2006) paper offers less insight of how stagflation was actually trig-
gered in the 1970s, it also undermines research-based arguments that the 1970s stagflation
was by no means solely responsible for the suffered economic burden.
4.2.3 Monetary Policy
Monetary policies aim at fighting the suspected impact of oil price shocks. This segment
within the research body is tied to Romer & Romer (1989), who stress that recessions
were de facto created by anti-inflationary politics imposed by the Fed. This contribution
yielded widespread critique, mainly due to methodological shortcomings, see e.g. Dotsey
& Reid (1992) and Bernanke et al. (1997). Dotsey & Reid (1992) cite most recessions to
be preceded by increases in the federal funds rate, which is the main instrument for imple-
menting monetary policies, and by a flattening or inversion of the yield curve. However,
they argue that both monetary policy and oil prices produce significant effects on GNP
and employment.
Bernanke et al. (1997) seek to shed light on the role of monetary policy in U.S. business
cycles. Therefore, they draw on oil shocks, which are assumed to be exogenous. Bernanke
et al. conclude that the response to monetary policy innovations following oil price spikes
play a substantial part in the respective succeeding economic downturn. Yet, Hamilton
& Herrera (2004) criticize the results twofold. First, the chosen lag length in Bernanke et
al.’s model leads to an underestimation of the impact of oil prices attributing too much
power to monetary policy8. Second, Bernanke et al. imply that, if the Fed would adjust
monetary policy responses, the effects of oil shocks could be mitigated or eliminated. Still,
Hamilton & Herrera doubt the feasibility of this argument.
Leduc & Sill (2004) also vote for monetary policies to account for a significant share
of the macroeconomic response to oil shocks. Implementing monetary policies via an
interest rate variable which imitates the respective policies, they estimate 40% of the
output decline after 1979 to be attributable to monetary policies and 75% in the pre-19798Bernanke et al. (1997) set the lag length in their monthly VAR on 7, which excludes the persistent directimpact of oil shocks, according to Hamilton & Herrera (2004), who include 12 and 16 lags.

CHAPTER 4. OIL AND ECONOMICS: TRANSMISSION RESEARCH 36
period. Monetary policies shifted to a more inflation adverse setting compared to the
output centered view before 1979. Furthermore, Leduc & Sill state that a more inflation
focused policy inevitably faces a tradeoff with output, but also results in easing volatility
in output and prices.
In the vein of ever rising oil prices, Krichene (2006b) concluded in her paper, that
monetary policy has in turn also an effect on oil prices and that monetary policy is needed
for stabilizing oil prices. Monetary policy does not only transmit oil prices but also sets an
interest rate environment, which, with its economic implications on other factors such as
exchange rates, permits oil price shocks. Krichene also argues that oil shocks and monetary
policies are in fact a two-way street depending on the type of oil shock. Accordingly, oil
supply shocks9 trigger rising interest rates, whereas very low interest rates can lead to
high oil price volatility as in 2005.
The literature around monetary policy and oil prices also supports the fuzzy arguments
of oil shocks’ impact on economies, as it states that a signficant part of the adverse
impact can be attributed to policy makers. The fact that reasearch showed a considerably
weakened connection of oil prices and inflation may point to the learning curve of monetary
policy makers since the 1970s. For further positions in this strand of research and more
thorough arguments please see e.g. Brown & Yucel (2002) who provide a more extensive
overview.
9Krichene defines an oil supply shock as “a disturbance in oil supply in normal demand conditions, oftencaused by exogenous factors” and an “oil demand shock is a disturbance in oil demand in normal supplyconditions; it could result from endogenous factors” (Krichene, 2006b, p.3).

5 Oil and Economics: Findings for UK, Japan, Germany
While the previous results concentrate on U.S. data only, which comprises also the lion’s
share of the research body, this chapter outlines some evidence on a couple of the most
important developed economies globally, namely for United Kingdom (UK), Japan and
Germany. These countries have very different economies and add therefore some differing
evidence. This selection is somewhat arbitrary, but they offer some additional insights,
whereas additional reasoning for France or Italy can be neglected due to space reasons
and also due to their somewhat limited significance.
In this chapter, I present first some more general research with a broader scope before
turning to more specific aspects such as differentiation of net oil exporting (UK) and
importing countries (U.S., Germany, Japan), particular national patterns due to their
national economic shape and lastly Japan, which made very different experiences than the
other western industrialized economies.
Most studies below include data from the U.S., UK, Japan, Germany, Canada, Norway
and in some instances France and/or Italy, while Norway and UK serve as examples for net
oil exporting countries. Burbridge & Harrison (1984), Mork & Olsen (1994), Bjornland
(2000), Jimenez-Rodrıguez & Sanchez (2005), Jimenez-Rodrıguez (2008) and Kilian (2005)
find that at least the U.S. faces the most painful impact on its economy comparatively to
other industrialized and importing countries when confronted with oil shocks. The general
findings outlined above for U.S. data also hold for most other net oil importing countries.
In genereal, research finds broadly similar results for western countries as for the U.S.
Pitfalls within the data may arise for UK, which turned into a net exporter in the 1970s and
Germany, which inheres anomalies due to the reunification. Also, exchange rates effects
may matter to the macroeconomic responses on oil pice shocks, since the petroleum market
traditionally operates with U.S. Dollars and oil importing countries thus face also impact
for example in their current account and trade balance.
Burbridge & Harrison (1984) pick up Hamilton’s (1983) results and extend the coverage
on Japan, Germany, Canada and UK testing for inflation and output. As expected, they
show that oil prices drive CPI in all countries but Canada and that IP is affected most
in UK and U.S. Mork & Olsen (1994) find the asymmetry thesis analogously overall valid
throughout U.S., Japan, Germany, UK, France and Norway albeit the U.S. and Canada
37

CHAPTER 5. FINDINGS FOR UK, JAPAN, GERMANY 38
show significant negative effects on oil price decreases. Oil price increases yield significant
negative effects except for Norway. Bohi (1991) looks on Germany, Japan, UK and U.S.
for macroeconomic effects during the oil shocks in 1973-75 and 1978-80. However, since
he reasons solely based on data during these periods without econometric modeling, he
assumes no overall direct relationship between IP and oil prices, and finds inconsistent
data patterns.
After this initial research, this strand of reserearch lay dormant for a decade or so before
resuming only in recent years. Bjornland (2000) detects within a structural VAR1 model
(U.S., UK, Germany, Norway; data from the 1960s to 1994), which allows for aggregate
demand and supply and oil price shocks, that oil shocks die out in UK and Germany after
six quarters.
Cunado & Gracia (2003) differentiate time horizons in macroeconomic variables. Based
on 15 European countries from 1960 to 1999, the analysis identifies cointegrated relation-
ships2, if allowed for structural breaks, for all countries between the price of oil and inflation
pointing to a long term relation. Furthermore, Cunado & Gracia depict Granger causal-
ity3 of nonlinear oil price specifications and IP indices. These correlations vary over the
tested time horizon and imply a nonlinear and rather short lived relation, as cointegration
tests failed.
Kilian (2005) demonstrates in his survey comprising G7 countries that output generally
declines mostly concentrated from the fourth to the eighth quarter but rebounds afterwards
eventually dying out. The often cited stagflation is rather a problem for Germany and
Japan. Wage and price dynamics lead to more than one spike in inflation impulse response
functions.
5.1 Importers vs. Exporters
Jimenez-Rodrıguez & Sanchez (2005) analyze G7 countries and Norway dividing up net
oil importing and exporting countries. Net oil importers suffer in general a negative eco-
nomic impact except for Japan, which is worst hit during the first two quarters marginally
declining afterwards. Moreover, countries such as Germany and the U.S. face the com-1Please see e.g. Hamilton (1994, p.291ff) for the motivation of Vector Autoregressive modeling.2A cointegrated relationship exists between two unit root processes, which are I(1), if the connection isdefined by a linear relation of an vector I(0) based on long term observations (Hamilton, 1994, p. 571ff).
3Granger causality states that one variable helps forecasting another, which includes short term horizon(Hamilton, 1994, p. 302ff).

CHAPTER 5. FINDINGS FOR UK, JAPAN, GERMANY 39
paratively most negative impact, which Jimenez-Rodrıguez & Sanchez attribute to real
exchange rate appreciation. For example France and Italy undergo an exchange rate de-
preciation and are less hurt. Inflation and interest rates (short and long term) also rise as
result, while real wages decrease. UK as net oil exporter sees output rising in the first two
quarters after the shock but reversing then and summing up to a net negative impact as
the British pound also appreciates. Inflation and interest rates also increase in the case of
UK. Jimenez-Rodrıguez & Sanchez support the asymmetry argument.
Evidence from above suggests that most net oil importers, except of Japan, are affected
rightout negatively. However, by exchange rate deprecitaion econimies can ameliorate the
negative effects from oil shocks. Net oil exporters enjoy an initial benefit from an oil
price hike but their economie are hurt with some time lag as they also bear the burden of
increased energy cost. The time horizon of these effects is as usual persistent and often
enfold completely with a time lag.
5.2 National Patterns
Jimenez-Rodrıguez (2008) conducts a study evaluating manufacturing industry responses
on oil shocks for UK, U.S., and European Monetary Union (EMU) countries such as France,
Germany, Italy and Spain from 1975 to 1998 (Italy and France 1980 to 1998). The Anglo-
Saxon countries show similar impulse responses to oil shocks across the different industries
with a impulse response correlation coefficient of 0.75. Naturally, the impulse responses
broadly mirror the respective industry mix within the economies. The most important
industries across all countries are food, beverages and tobacco, paper and paper products,
chemical, and metal products, machinery and equipment. Sectors relating to construction
and housing are apparently worst hit in Germany, whereas sectors related to industrial
demand are most vulnerable in UK and U.S. Overall, Jimenez-Rodrıguez finds that oil
consumption has somewhat decreased with the Anglo-Saxons consuming comparatively
the most. Another explanation for cross-contry heterogeneity are labour and product
regulations, which are more rigid in the EMU according to the OECD. In spite of these
actually unfavorable conditions, EMU countries prove more resilient to oil shocks than the
Anglo-Saxons do.

CHAPTER 5. FINDINGS FOR UK, JAPAN, GERMANY 40
Kilian (2008a) digresses in his paper from the common oil price variable and defines an
exogenous oil supply shock variable instead. With this, the variable escapes the problem
of endogeneity as oil shocks can also be driven for a good share by global demand or other
factors. However, Kilian’s contribution does not yield considerably different evidence from
results stated above.
National patterns naturally mirror the industry mix within an economy and the oil
intensity of the respective economy. As oil intensity and consumption steadily decreases
gradually in most Western industrialized economies, it is often assumed that this factor is
significant for the apparent easening of oil shock impacts. Evidence stated above however
shows that other factors may be even more significant (see section 3.1 and evidence pre-
sented in this chapter). Also, these factors and others such as national monetary policy
may even override the vulnerability given by the respective national industrial mix. Em-
pirical evidence for this is unfortunately not available and probably difficult to establish.
5.3 Focus: Japan
Remarkably, Japan deviates from the common response pattern and some studies find a
positive output response to oil shocks, see e.g. Bohi (1991), Jimenez-Rodrıguez & Sanchez
(2005) and Jimenez-Rodrıguez (2008). These findings are counter-intuitive as Japan is,
similarly to Germany, fully dependent on oil imports without any domestic source of energy
and one of the major global oil consumers. Japan consumes around 7% of the global oil
production, mostly imported from the Middle East, and around half of Japan’s energy
supply is produced with crude oil (Zhang, 2008, p.2376). Thus, it would be straightforward
to assume that Japan would actually be hurt worse than other economies. However, Bohi
(1991) explains that Japanese monetary policy was expanded after the oil shock in 1978
to 1980 and could therefore escape the otherwise inevitable economic downturn.
Nevertheless, in a comprehensive evaluation of Japanese macroeconomic response B. R. Lee,
Lee, & Ratti (2001) find more detailed results. Industrial production reacts with a sig-
nificant negative response to oil shock albeit reversing after around two years and finding
back to the initial level after 60 months. The call money rate, which is the Japanese
equivalent to the Federal Funds Rate, also rises initially. CPI rises and maintains elevated
although at lower level than the initial peak. B. R. Lee et al. test also fiscal policies and

CHAPTER 5. FINDINGS FOR UK, JAPAN, GERMANY 41
prove that government spending is endogenous twofold, to a shock in IP and oil, which
both triggers expansion. Furthermore, tightening monetary policies due to an oil shock
contribute around 35.9% to the experienced downturn on a two year horizon, if the fiscal
policy variable is included in the model.
Zhang (2008) also follows the argument of nonlinearity and builds upon Hamilton’s
(2003b) approach for capturing a possible nonlinear relationship in testing the most pop-
ular nonlinear oil price specifications4. Testing for GDP growth and oil prices, he finds
stable relationships for nonlinear oil price specification and deducts that asymmetry and
nonlinearity are estabhlished in the Japanese oil and macoreconomic relation. Further-
more, responses in growth are most pronounced in the first and fourth quarter. Zhang
attributes the different transmission channels to this finding. The demand sided channel
of consumers and customers reducing demand may be responsible for the immediate re-
sponse, whereas the input cost argument may apply to the lagged negative imapct in the
fourth quarter. When compared to U.S. data and evidence, the Japanese results do not
deviate much.
Evidence for Japan remains comparatively thin although the above mentioned studies
contributed considerably. As a next step reserach examining the industrial mix and sectors
and their response to oil shocks would add helpful insights. Also, the differing monetary
policies in the face of past oil prcie shocks may contribute the strand of research assessing
monetary policies in relation to oil shocks.
4See section 3.3.

6 Oil and International Transmission
The geographical dispersion of oil production and end product consumption may well span
several continents. Henceforth, economies are either susceptible to falling (net exporters)
or rising (net importers) oil prices. This has of course consequences in the economies’
balance sheets. Several studies examine the effects and balances of the global oil trade for
countries.
6.1 Terms of trade
Backus & Crucini (2000) examine terms of trade, output and trade volumes of eight
industrialized countries1 with a dynamic general equilibrium model in order to retrace
trade patterns from 1973:1 to 1986:4 when oil price volatility was tremendous and terms
of trade volatility was highest. Terms of trade are defined as ratio of the import deflator
and the export deflator in national income and product accounts. During this period three
distinctive features defined trade balances. First, the variability of terms of trade was un-
proportionally higher than the variability of the trade ration, which can directly explained
by oil price developments. Second, correlations of terms of trade with output were smaller
than in other periods. Third, cross-country correlations of output were comparatively
higher. The equilibrium model mirrors the dynamics of major industrialized oil importing
countries and non-industrialized oil producers. Three different shocks can occur, namely
a domestic productivity shock, a foreign productivity shock and an oil supply shock.
Backus & Crucini find that responses of output, terms of trade and trade balances differ
considerably with regard to the different shocks.
Bodenstein, Erceg, & Guerrieri (2007) aim at understanding the impact of oil price
shocks on trade and foreign exhange rates since this also implies shifts in purchasing power
and output. By employing a two country dynamic stochastic equilibrium model with one
oil-importing (calibrated according U.S. data) and one oil-exporting country (calibrated
as rest of the world) each producing one distinctive good, they assess the reactions of
trade and exchange rates also with regard to perfect and imperfect financial markets,
as this is an important factor in the allocation fo risk sharing between these economies.
The oil price hike is persistent and feeds into the economy via household consumption1Australia, Canada, France, Germany, Italy, Japan, United Kingdom and United States.
42

CHAPTER 6. OIL AND INTERNATIONAL TRANSMISSION 43
and as production input. Also, it is by nature an adverse supply shock by the exporting
country though Bodenstein et al. state that their results are not sensitive to oill shocks of
another kind, say a demand shock. Simulation results show that with imperfect financial
markets, the oil-importing country faces a persistent deterioration in its terms of trade
oil-component which needs to be compensated in the non-oil component in order to even
out the trade balance. This compensation however comes with an initial decay in the non-
oil component of terms of trade which again implies a lapsing exchange rate. In contrast,
results with complete financial markets show that the non-oil terms of trade component
of the importing country does not deteriorate and the painful adjustment process does
not apply. Oil shocks therefore have the might to cause significant wealth transfers albeit
complete financial markets can mitigate these effects.
This study implies important learnings and insight. It is straightforward to assume
that financial markets today have a higher degree of completion than they had in the 1970s
and 1980s. Thus, this factor may also play a role in the transmission of the oil price rise in
the last years, which was marked by an astonishing resilience of oil-importing economies.
6.2 Transmission Mechanisms
Elekdag, Lalonde, Laxton, Muir, & Pesenti (2008) try to answer two important questions
with regard to oil price transmissions on a global scale. First, what caused the persistent
rise in oil prices from 2003 to 2008 and second, how do oil prices feed through interna-
tional trade and capital streams. They employ the IMF Global Economy Model (GEM)
taking into account five regions, namely the oil exporting regions Canada and the group
of oil-exporting countries (OPEC, Mexico, Norway and Russia), the oil-importing group
(U.S. and emerging Asia) and the remaining countries Japan and in a joint variable, the
European Union. The model encompasses trade and production of oil but neglects oil in-
ventories, which again may overstate some results in the short and medium time horizon.
Regarding their first question, Elekdag et al. find that the oil price rise from 2003 on
was mostly driven by global demand factors, more specifically in shape of strong growth
in productivity in oil importing economies and in shape of upward shifting oil intensity
in production in emerging Asian economies. As a third, albeit less significant factor,
they identified “exogenous” mark ups in oil prices by oil producers. In response to the

CHAPTER 6. OIL AND INTERNATIONAL TRANSMISSION 44
second question asked, Elekdag et al. find that wealth is transferred by terms-of trade
due to demand induced oil price shocks such that the oil-importing regions’ output grow
at a higher pace than consumption. However, current account balances of oil importing
countries do not necessarily suffer by the developments in consumption as net foreign assets
increase as well. Investments again also shift in the medium term between regions as high-
growth regions attract more capital which exerts a crowding out effect on investment in
oil-exporting countries. These impacts however could be mitigated, if a future increase in
global oil reserves (availability of oil) is expected.
International transmission mechanisms are complex to model and Elekdag et al. (2008)
demonstrate some interesting results. They support the argument of Bodenstein et al.
(2007) that oil price increases do not necessarily imply adverse effects on the global econ-
omy though the rationale differs of course. Also, the study shows that demand-induced
oil shocks yield deviating results as Kilian (2008b) suggested.

7 Oil and Stock Markets
Research in the field of oil and stock markets has always lagged behind research conducted
on oil and the macroeconomy. Comparatively few studies, which are also relatively diverse
in questions asked and methods employed, were published and the pace only picked up
in the last years when oil prices reached unprecedented heights. This chapter provides an
extensive review of the existing research body of oil and stock markets and deals with some
key aspects separately, such as transmission channels, nonlinearity, asymmetry, industry
specific findings and sensitivities with regard to firm size.
Evidence for UK, Germany and Japan besides the U.S. is given when applicable. Most
studies within this strand of reserach already include other countries, whereas the research
of oil and macroeconomics widely focuses on the U.S.
Unlike in the oil and macro literature there is no dominant econometric model and
test procedure in the research community yet given the smaller number of contributions
in the last three decades. As direct consequence, verification and evaluation of proposed
empirical results are marginal and the comparability suffers.
The following three studies give an indication of early research results without going
too much into detail because they more or less looked for the general relation without
asking specific questions. N.-F. Chen, Roll, & Ross (1986) were among the first to test
stock market returns regarding the reaction of oil price innovations. Although they find
no evidence about a significant impact of oil prices on stock returns in their study about
the influence of economic state variables on asset prices. This finding was soon to be
reversed as research about the macroeconomic impact of oil prices intensified and the
common notion about the adverse relationship was easily transmitted to oil and stock
market relationship.
Kaul & Seyhun (1990) study the impact of relative price variability on stock returns
and output during the time period of 1947 to 1985 (yearly data). First, they find that
inflation serves as proxy for relative price variability. Second, they find significant negative
effects of the price variability on output and the stock market. More specifically, the price
variability reflects supply shocks, which seems to be driven by the supply shocks during
the 1970s (OPEC crises), as the subperiod from 1966 to 1984 reveals. The relative price
variability measure or variance of relative price changes is the unweighted average of price
45

CHAPTER 7. OIL AND STOCK MARKETS 46
indices of the producer price index. Additionally, a variable for real supply shocks, namely
the price variability for fuel and oil related products only, enhances Kaul & Seyhun’s test
results. The test results show that the oil price based measure has significant negative
effects on output and stock returns. Furthermore, the inclusion of the oil based variability
measure into regressions renders the other variability and inflation measures insignificant.
However, as macroeconomic and financial market variables are jointly used in regressions,
Kaul & Seyhun employ only yearly data, which is necessary due to the inflation and output
variables. The focus of this study lies therefore rather on the macroeconomy and not so
much on the financial markets side. Kaul & Seyhun’s results deliver first indications, but
fail to enhance clearance in the oil and stock market relationship.
In a less renowned study, Taneko (1995) tests in a VAR1 model the significance of
economic variables including oil prices for stock returns of JPN and the U.S with monthly
data from 1975:1 to 1993:12. Variables include industrial production, inflation, terms of
trade, change in exchange rates, excess stock returns, risk premium, term premium and
change in oil prices. However, only the Japanese stock market proves sensitive to oil prices,
while the U.S. market proved resilient indicated by an insignificant coefficient.
Being one of the most recent contributions, Miller & Ratti (2009) focus on long run
relations in contrast to most other analyses, which focus on the short run relations of
the variables by setup with an VAR. Miller & Ratti (2009) pursue a different approach
as they test for the long run relations of stock indices and oil prices with a cointegrated
VECM 2 . The monthly data sample ranges from 1971:1 to 2008:3 and includes stock
market data from Canada, France, Germany, Italy, UK and U.S. Japan is not taken into
account since the trend of the Japanese stock market deviates from the Western world
stocks markets. Miller & Ratti allow for endogenously identified structural breaks and
split their sample consequently at the identified breaks after 1980:5, 1988:1 and 1999:9.
They find unambiguous results in the long run for all tested countries from 1971:1 to
1980:5 and 1988:2 to 1999:9 with negative impact of oil prices on stock markets. The
period from 1980:6 to 1988:1 sends ambiguous results with statistically insignificant or
non-deviating results from the period before. However, in the last period after 1999:9, the
negative long run relation dissolves, which the authors attribute to stock market and/or
oil price bubbles such as the “dotcom” era.1Please see e.g. Hamilton (1994, p.291ff) for the motivation of Vector Autoregressive modeling.2Please see Miller & Ratti (2009, p.7) for the motivation of VECM.

CHAPTER 7. OIL AND STOCK MARKETS 47
7.1 Transmission Channels
The rationale of transmission channels in the oil and stock market relation adresses the
possible transmission mechanisms by which businesses can be influenced. While supply
sided arguments refer to the input cost/supply side (expected cash flows) of transmission,
demand sided arguments stress weakness in demanded goods for reduced cash flows. The
differentiation is not always clearly cut in most studies, but can often be read between the
lines and within the underlying rationale.
7.1.1 Supply Side
Being among the first to examine the connection of oil and financial markets, R. D. Huang,
Masulis, & Stoll (1996) study whether stock markets (S&P 500, sector indices and oil
stocks) are efficiently linked to oil futures markets (crude oil and heating oil). The rationale
behind this study bases upon the efficient market hypothesis3, which states that markets
are efficient, if all information is inherent in the price and outperforming the market is
therefore impossible. Thus, financial markets would react efficiently on oil markets, if they
are contemporaneously correlated. Furthermore, the - then taken as evident - research
about the oil and macroeconomy relationship as a asymmetric and negative relationship
is included in the rationale. R. D. Huang et al. also allow for lead and lag relations and
include return volatility as variable for the information process additionally to returns.
They derive the connection or transmission channel of oil and stock markets from asset
pricing, with stock prices calculated as discounted values of expected future cash flows.
Stock prices are allowed to react twofold to changes in cash flow, which inheres the oil
price as input either as net producer or as consumer, and to changes in the discount rate,
which again is affected by expected inflation and the expected real interest rate.
R. D. Huang et al. test daily data from 1979:10 to 1990:34 in a VAR framework, which
includes time series of heating oil or crude oil futures, stock returns5 and Treasury bills.
Dummy variables account for anomalies in months other than January, crashes on October
16, 19, 20 and 21, in 1987, holidays, weekends and days when oil futures are rolled over at3For the motivation of efficient market hypothesis please see Fama (1970).4Heating oil futures contracts started trading on the NYMEX on October 9, 1979 and crude oil futurescontracts entered trading in April 11, 1983.
5Besides the S&P 500 returns, data from 12 stock price indices based on SIC codes and data from threeoil companies are tested.

CHAPTER 7. OIL AND STOCK MARKETS 48
the end of the month. The model is laid out as three-equation system VAR, where six lags
are included based on serial correlation results, which showed significant lags up to five
days. Test results exhibit only significance between oil futures and the petroleum stock
index and the three single oil stocks. Both oil futures contracts (heating oil and crude
oil) attain the same effects. The test results for volatilities fail to contribute additional
information. Also, tests for economic significance via bid-ask spreads and simple trading
rules yield weak results and the authors conclude that the results do not reflect the assumed
economic relevance of crude oil for the economy and the results matter more to market
makers in oil stocks.
C. M. Jones & Kaul (1996) approach the issue from slightly different angles than
R. D. Huang et al. (1996) as they work with data of lower frequency (quarterly) and
different variables placing industrial production as aggregate cash flows and PPI for oil
as oil price variable. The study takes Canada (1960-1991), Japan (1970-1991), UK (1962-
1991) and the U.S. (1947-1991) into account. The fundamental assumption of this paper
also starts with the question, whether stock markets anticipate rationally the presumably
negative significant influence of oil shocks on the economy. C. M. Jones & Kaul use the
standard cash flow and dividend valuation model, where the stock return varies due to
expected and unexpected changes in return. The transmission channels of the unexpected
return are defined as changes in current and expected cash flows in the future and changes
in expected future returns. Oil prices are inlcuded as change of oil prices in percentages.
C. M. Jones & Kaul demonstrate that oil price increases have significant and adverse effects
on the respective stock market indices in all countries. However, the impact can only be
accounted for by contemporaneous and future cash flows for the U.S. and Canadian stock
markets, whereas the results for UK and Japan cannot be explained. The authors test for
measurement errors in oil prices, inflation and real cash flow variables with regard to the
puzzling results for UK and Japan. Hence, they conclude that oil price shocks must have
induced excessive volatility in these countries.
Sakellaris (1997) evaluates in his study the impact of oil shocks on stock market excess
returns. He sets up a dynamic optimizing model with a structural framework, which test
U.S. stock market excess returns of four industries (Paper and Allied Products; Primary
Metals Industry; Stone, Clay, Glass and Concrete Products; Electronic Components as
controlling variable with low energy intensity). The first OPEC shock in 1973 and 1974

CHAPTER 7. OIL AND STOCK MARKETS 49
serves as example for a exogenous energy shock and is the benchmark for the model. The
economic rationale of Sakellaris is based on the assumption that firms with technology
and capital investments, which were made in times of low energy prices, suffer the most
from oil shocks as input and production are more costly. He finds that a considerable
part of excess return can be explained by shocks to firm’s input factor and output prices.
Moreover, the investment structure is also related to excess returns providing support to
his argument that the vintage of investments matters with regard to investment choices
either more energy efficient or less.
Wei (2003) elaborates in a similar setting as Sakellaris (1997) on the connection of
energy, stock markets and business investment. The oil price shock in 1973 and 1974
with the coinciding economic downturn serves as reference time period since stock prices
(non-farm and non-financial) collapsed by 40%. Via a dynamic general equilibrium model,
Wei seeks to measure the role energy prices played during or in the preface of that re-
cession. A putty-clay model enhanced by the factor energy describes business investment
and production where labor, energy and capital are not substitutable. Three possible
transmission channels, all three on the input side, apply. First, old machinery depreciates
endogenously due to declines in capacity utilization and expected profits. Second, energy
price shocks affect investment. And tird, energy shocks influence the interest rate. Any
effect on stock prices thus depends on price variables like wage and interest rate. Oil price
shocks in the model are set at an increase of 80% and lead to a 3.9% slump in real income,
a 3.5% decline in real consumption while real wages decrease by 3.8%, which is near the
actual observed data in 1974. However, with regard to stock prices, Wei only finds a minor
negative impact 2% due to an 80% oil price increase. Thus, energy prices obviously had a
negligible effect on stock prices in the stock market collaps during 1973 and 1974. Other
factors such as monetary policy might have had a more pronounced effect on stock market
prices.
7.1.2 Demand Side
In contrast to other studies, Kilian & Park (2008) argue that the preeminent transmission
of oil price shocks lies in the demand side and not on the input cost (supply side) argument.
Analogous to the research about macroeconomy and oil shocks, see e.g. Kilian (2008b),
Kilian (2008c) and Kilian (2008a), the study differentiates between precautionary demand

CHAPTER 7. OIL AND STOCK MARKETS 50
shocks (or oil market specific shocks), aggregate demand shocks (global demand shocks to
commodities) and oil supply shocks. Kilian & Park (2008) include therefore measures of
the global crude oil production (in percentage changes), the real oil price, which is based
on the U.S. refiner’s acquisition cost and a measure for global real economic activity, which
is constructed from an index of dry bulk cargo ocean shipping rates. The measure for the
global economic activity inheres demand from emerging markets such as China and India,
which do not publish data on industrial production but are responsible for the lion’s share
in demand growth for commodities. Naturally, stock market variables for industries and
the aggregate U.S. stock market6 are also included. All data is monthly and range from
1973:1 to 2006:12. Kilian & Park imply three assumptions within the VAR model via
variable ordering. First, crude oil supply is assumed to be a vertical curve in the short
run and does not react contemporaneously. Second, global economic activity also proves
resilient to oil market specific demand shocks, which are driven by the oil price. And third,
oil market specific demand shocks are defined by the residual of innovations, which are not
supply or aggregate demand shocks. Also, stock returns do not influence global crude oil
production. The impulse responses show that oil supply shocks fail to trigger significant
responses on the aggregate stock returns, whereas the aggregate demand shock causes a
persistent increase in stock returns over eleven months (partially statistically significant
on the 10% level). Simulated oil market specific shocks send stock returns persistently
lower (significant at the 10% level for six months). Variance decomposition demonstrates
that in the long run all three shocks account for 22% of the variability in stock returns.
However, the effects are negligible in the short run. Oil market specific demand shocks,
which are again driven by precautionary demand due to expected oil supply shortfalls,
contribute 11% of the stock market return variability.
Kilian & Park (2008) select four industries for their analysis of industry specific stock
market returns, whose stocks presumably face the most severe impacts of oil shocks. The
petroleum and natural gas industry, the automotive industry, the retail industry and
the precious metals sector are included. While the automotive and retail industry are
susceptible for demand sided effects of oil shocks, the precious metals industry gains from
the safe haven status of their products in times of high inflation and crises. Test results
show a more differentiated picture, when compared to other studies. An oil market specific6The aggregate U.S. real stock return is deducted from a value weighted market portfolio as calculated bythe Center for Research in Security Prices.
CHAPTER 7. OIL AND STOCK MARKETS 51
demand shock sets stocks in the precious metal sector higher and leads to a persistent
negative response in the automobile industry stocks. Stocks of the petroleum industry on
the other hand only show weak positive responses. Moreover, an aggregate demand shock,
which is driven by a global upswing in the business cycle, yields positive returns in all
industries albeit, the automobile industry faces a negative effect after the first year. Oil
supply shocks do not trigger distinct responses apart from a gradual decline in petroleum
stocks and an initial positive response over the first six months in precious metals stocks.
After additional tests with industry level data, which are excluded in the paper for space
reasons, the authors vote in favor of the demand side as transmission channel and not so
much to the input cost argument. The energy intensity of industries seems not to exhibit
the expected effects on the magnitude of shock responses. Industries, which are most
susceptible to demand such as retail and automobile suffer comparatively the most.
Picking up the methodology proposed by Kilian (2008c), Apergis and Miller (2009) test
monthly stock market returns from 1981 to 2007 of Australia, Canada, France, Germany,
Italy, Japan, UK and U.S. with regard to their sensitivities towards structural oil-market
effects. Overall, they find only little influence, i.e. significant effects albeit at a small
magnitude, of the oil shocks outlined above on stock market returns. Furthermore, there
seems to be no pattern with regard to specific national macroeconomics of these countries.
The respective signs and results for the three different oil market shock types outlined
above are validated in this study.
7.2 Nonlinearity
Ciner (2001) tests the oil stock market relation with regard to nonlinearity. As R. D. Huang
et al. (1996) found no general significant relationship of oil futures and stock market returns
besides of oil industry stocks, the authors dismissed the general notion of the economic
significance of oil prices. Though many studies found nonlinear relationships of oil and
macroeconomic variables, Ciner argues that the oil and stock market relation is nonlinear
in nature as well. He tests the same data set from the R. D. Huang et al. (1996) paper and
applies tests for nonlinearity as well as linearity and feedback relationships. The sample
consists of daily data of returns of oil futures and the S&P 500 respectively. Additionally

CHAPTER 7. OIL AND STOCK MARKETS 52
to the data set from R. D. Huang et al., he tests data from the 1990s in order to avoid
sample specific findings.
Ciner employs nonlinear Granger causality tests, which were modified by Hiemstra &
Jones (1994) and allows for short term temporal dependence. The test by construction
uncovers relations, which are left out by linear Granger causality tests. The nonlinear test-
ing procedure was originally developed by Baek & Brock (1992), follows an unparametric
approach and is applied to the residuals from a VAR model, because the model already
filters out the linear dependencies7. Ciner finds also insignificant linear test statistics
including the data for the 1990s. However, the nonlinear Granger causality tests detect
evidence for oil and stock returns but not for heating oil and stock returns. A nonlinear
feedback relation from stock returns to oil futures returns is also suggested by test results.
The additional data from the 1990s confirms the results and seems even stronger for that
period of time. Also, the tests render significant bidirectional results for heating oil and
stock markets. Remarkable in another context is the feedback relation as many studies
assume exogenous oil prices, an assumption which, for example, Kilian has repeatedly
criticized.
7.3 Asymmetry
Deducted from the asymmetry argument in the oil and macroeconomy relation, asym-
metry also became an issue for oil and stock markets. Sadorsky (1999) finds unanimous
evidence for the oil prices to impact stock returns and asymmetry such as oil price in-
creases resulting in more severe effects than oil price decreases. Furthermore, oil price
volatility shows analogous effects on stock returns. Monthly data of U.S. IP, interest rates
and real oil prices (measured as PPI for fuels corrected for inflation) over the time horizon
from 1947:1 to 1996:4 was tested. An unrestricted VAR model with variables interest
rates, oil prices, industrial production and real stock returns respectively is estimated.
The variance decomposition of the forecast error variance shows that most of the oil price
variance is rooted in itself. Hence, oil prices face only little influence by other economic
variables but exert impact on others. Impulse response functions of one standard devia-
tion demonstrate oil price shocks to have a significant negative impact on stock returns7Please see Baek & Brock (1992) and Hiemstra & Jones (1994) for a comprehensive outline of the teststatistic, which is beyond the scope of this paper.
CHAPTER 7. OIL AND STOCK MARKETS 53
lasting for three months. The stock market reacts therefore efficiently as the real effects of
an oil price shock are anticipated. Remarkably, when split into subsamples at the point of
1986, the second subperiod indicates a change as oil price shocks obviously have a bigger
impact on stock returns than interest rates (in the first subperiod vice versa). Sadorsky
addresses either a change in the dynamics of oil price shocks or in the economic structure.
He reasons that this change is due to an increase in size of oil price shocks themselves (oil
prices declined heavily in 1986, while in 1990 the Gulf crisis drove prices sharply up) and
in turn due to the decreases in the sizes of shocks in interest rates, industrial production
and real stock returns. Regarding asymmetry, Sadorsky splits oil price changes into the
variables positive and negative oil price changes (shocks), which are zero or the respective
value. VAR forecast error decomposition (over the full sample) states that positive oil
price shocks can explain a bigger part of the forecast variances of interest rates, industrial
production and stock returns than negative oil price shocks. Oil price volatility shocks8
support the findings of the asymmetric impact. Positive oil price volatility shocks reach
a higher fraction of the forecast error variances in industrial production and real stock
returns. These findings are in sync with the ones regarding the oil and macroeconomic
relationship, see e.g. K. Lee et al. (1995) and Ferderer (1996).
In one of the more recent studies, Cobo-Reyes & Quiros (2005) set up a Markov
Switching9 model, which allows to compare the reactions of stock market (S&P 500) and
industrial production from 1963:1 to 2004:5 (monthly data). They prove that stock market
reaction to oil price increases is faster and stronger, albeit industrial production reaction
exceeds it over a longer time horizon. NOPI10 was applied as oil price variable so that
estimation results trace back to nonlinear oil price measures. The binomial state variable
denotes the states of high and low volatility. The empirical test results show a significant
and negative effect on stock returns and on industrial production, whereas the initial
reaction of stock prices is naturally higher. Nevertheless, after three months the effect
on industrial production exceeds the effect on stock market returns by factor two. The
natural assumption that industrial production is more sluggish can be approved.
In a study already cited in the context of the size of oil shocks of this paper, B.-
N. Huang et al. (2005) follow the rationale of asymmetric impacts of oil shocks but argue8Sadorsky models oil price volatility shocks via a GARCH (1,1) model. Please see Sadorsky (1999, p.454)for the specifics.
9Please see e.g. Hamilton (1994, p.690ff).10Please see section 3.3 or Hamilton (1996) respectively.

CHAPTER 7. OIL AND STOCK MARKETS 54
that the often set threshold, which differs oil price increases and decreases at the value of
0, is arbitrary. Rather, an individual threshold reflecting the vulnerability of an economy
shall function as defining value of an oil price shock. B.-N. Huang et al. succeed to set
the individual threshold levels for the U.S., Japan and Canada, which are in line with the
assumed vulnerability of each economy according to its oil dependence11. They also find
mixed results when testing oil prices and their volatility on output and real stock returns.
Oil price volatility tends to explain real stock returns better than industrial production,
whereas oil prices rather show a better fit for industrial production.
In one of the most recent papers, Park & Ratti (2008) accomplish a more differentiated
picture regarding the asymmetry of the relation between oil and stock markets. The
study includes 13 European countries12 and the U.S., and tests from 1986:1 to 2005:12
on a monthly basis for the impact of oil price shocks and oil price volatility on real stock
returns. Linear and nonlinear oil price specifications, namely change in real oil prices as
well as SOP and NOPI are included as oil price variables. Taking into account the influence
of exchange rate effects, Park & Ratti find that world oil prices, defined by Brent (U.S.
Dollar index) per U.S. PPI perform better with clearer results than oil prices denominated
in the respective national currency. Asymmetry in the impact of oil price increases and
decreases was found for many European countries, however not for the U.S. and Norway.
Park & Ratti include variables for short-term interest rates, consumer prices and industrial
production in addition to oil prices and stock returns in their unrestricted VAR model to
grasp the dynamics. Impulse responses of a one standard deviation shock in (world) oil
prices show significant and negative responses in the same month for the U.S. and every
other country except Norway, Finland and the UK. Norway as an oil exporter exhibits a
positive and significant reaction within one month. Both other oil price variables, SOP
and NOPI13 respectively (world oil prices) yield comparable results relative to the linear
specification, albeit the NOPI variable delivers less significant results. When U.S. stock
returns are allowed to affect the other national stock returns, both the linear specification
and SOP let all countries’ stock returns exhibit significant effects. Variance decomposition
shows that in the mean 6% of stock return volatility can be attributed to oil price shocks.
Tests for the influence of oil price volatility yield results, which are generally negatively11Oil dependence is defined as ratio of net oil import to total consumption (B.-N. Huang et al., 2005).12Austria, Belgium, Denmark, Finland, France, Germany, Greece, Italy, Netherlands, Norway, Spain,
Sweden, UK.13For discussion of SOP and NOPI please see section 3.3.

CHAPTER 7. OIL AND STOCK MARKETS 55
related to stock returns. Park & Ratti also test for asymmetry in stock returns responses
and set variables following Mork (1989) in his rationale, differentiating the linear oil price
variable and SOP into increases and decreases. Remarkably, tests with the linear variable
show the null hypothesis of symmetry not to be rejected for the U.S. and the European
countries, while in tests with SOP variables symmetry seems to be evident for all countries
except the U.S. and Norway. However, with allowance for spill-over effects from U.S.
to European stock returns, both specifications testing show no asymmetry expect for
Norway with SOP. Other test procedures employed get somewhat more mixed results,
showing some evidence for asymmetry in the U.S. data but overall little or no evidence
for asymmetry within Europe. The evidence for asymmetry is therefore weakened with
regard to oil and stock markets.
7.4 Industrial Sector Specific Findings
Nandha & Faff (2008) conduct a global study of industrial indices regarding their sensi-
tivity to oil price shocks. The analysis spans over 35 industry indices on a global level
and includes monthly data from 1983:4 to 2005:9. Nandha & Faff find that generally all
industries are negatively affected except the mining, oil and gas industries. Unlike most of
the studies in this ares, this study bases upon a standard market model, which is enhanced
by an oil price variable. Nandha & Faff also test for asymmetry via including variables for
positive and negative oil price changes as initially proposed by Mork (1989). Nevertheless,
test results rather reject the asymmetry argument. The results for the model outlined
above show that merely the mining and the oil and gas sector have a positive relation
to oil prices. All other industries but five (electric equipment, info technology hardware,
investment companies, software and computer services, and telecom services) have statis-
tically significant negative coefficients and reflect therefore the broad impact of oil price
shocks. The authors attribute this to the wide range of products and production inputs
derived from crude oil. However, macroeconomic studies rather point to the demand sided
channel and not to the input cost argument.
In one recent contribution, Gogineni (2009) sheds light on industrial sector specific
findings as well as on the transmission channels in quantifying cost- and demand-side
dependence. A question which has been raised in previous papers, but could not be
CHAPTER 7. OIL AND STOCK MARKETS 56
answered on an empirical and quantifiable basis. Gogineni examines with daily data U.S.
industries14 with regard to their sensitivity to oil price changes from 1984 to 2007. In
order to determine the transmission channel of the respective sensitivity, he defines cost-
side dependence as the ratio of the dollar value of oil used as input and the dollar value of
the respective industry’s output. Values of cost-side dependence range from 24.49% in the
air transportation industry to below zero for example in the financial services industry.
Durable goods producing industries’ input cost also depend to a negligible degree on oil,
namely in double-digit basis points on average.
Demand-side dependence of an industry follows the rationale that even though input
costs may not significantly depend on oil prices, their main customers’ industry may well
do and hence reduce demand in face of an oil price change. Gogineni calculates demand-
side dependence thus by summing up the products of the proportion of industry j output
sold to industry i and the cost-side dependence of industry i. In a first regression, Gogineni
finds only weak results for stock market returns’ sensitivity for oil prices without including
industry-specific data. For the industry-specific sensitivities he estimates a simple mul-
tivariate regression model, where the value weighted return of industry i is explained by
the return of oil and the value-weighted market return. To account for factors influencing
the stock market, variables for three-month Treasuries and the U.S. dollar exchange rate
(trade weighted) are included in the regression. Regression results support the often cited
notion that industry stocks of the transportation and the manufacturing sector react neg-
atively to oil price increases whereas mining sector stocks react positively. However, the
effect of oil price changes varies to a considerable degree even within the sector.
For determining the drivers of the sensitivities of each sector, Gogineni estimates an
additionial model which comprises coefficients for cost-side dependence and demand-side
dependence in order to explain the variation of the industry’s return, if the oil price changes
by 1%. The estimation results imply that for industries with a high negative estimate
of cost-side dependence and a negative relation in stock and oil prices, the industries’
sensitivity to oil prices again increases with a rise in cost-side dependence and vice versa. In
terms of numbers, results show that an increase by 10% in cost-side dependence comes with
a 3.02% change of the industry’s sensitivity to oil prices. Although this rationale should14Gogineni uses the three-digit NAICS for industry classification as the Bureau of Economic Analysis of
the US Department of Commerce provides input and output tables for US industries on yearly basisfrom 1998 to 2006 according to the three-digit NAICS system (Gogineni, 2009, p.5).
CHAPTER 7. OIL AND STOCK MARKETS 57
also apply to demand-side dependence, Gogineni finds no support for this in the estimation
results. He explains that through the fact, that data on end-consuming households and
individuals is not incorporated in the input-output tables of the respective industry sectors.
For the retail industry, for example, this is a valid constraint.
Additionally, Gogineni analyzes the impact of cost- and demand-side dependence on
industry’s sensitivity to oil price changes and finds that industries with a negative rela-
tion to oil prices are driven by their supply costs or cost-side dependence. Demand-side
dependence predominantly applies to industries with a slight negative or positive relation
of oil prices.
These findings pose an important contribution to this strand of research, as the ques-
tion of transmission channels was often discussed on theoretical and model based ar-
guments but has never been clearly estimated. Nevertheless, the argument of private
consumption cannot be covered by the data used by Gogineni (2009). Given the U.S.
economic dependence on private consumption, this is a serious constraint.
El-Sharif, Brown, Burton, Nixon, & Russell (2005) conduct a study regarding the
relationship of the UK equity values and oil prices while focusing on the oil and gas sector
equity. The authors use a multi factor model similar to Nandha & Faff (2008) and test
daily data from 1989:1 to 2001:6 of an oil and gas sector index and London Brent Crude
Oil Index. Also, variables for exchange rate and other sectors (mining, transport, banking
and computer/software services) are included. Empirical results point to a significant
positive relation between oil and gas sector equity with oil prices. However, coefficients
of the other sectors were found to be insignificant. Within the UK equity market non-oil
and gas equity seem rather resilient to oil and gas price increases. However, as the oil and
gas sector is important for the UK economy according to El-Sharif et al. (2005), oil price
increases might be anticipated by other market participants at least not to be too hurtful
for the economy.
Sadorsky (2003) looks specifically at the impact of oil prices on U.S. technology stock
prices. The argument for technology oil price sensitivity is not clear cut in research.
Either, technology stock prices are assumed to be resilient on oil price movements since
technology firms have a low energy intensitiy within their value chain, or technology
stock prices are expected to react on business cycle conditions (or economic downturns
respectively) induced by oil prices via inflation. Sadorsky assesses daily and monthly data

CHAPTER 7. OIL AND STOCK MARKETS 58
from 1986:7 to 2000:12 of the Pacific Stock Exchange Technology 100 Index and includes
macroeconomic variables such as CPI and term premium as well as conditional volatilities
of oil prices. Empirical results indicate that the conditional volatility of technology stock
prices is significantly affected by oil price volatility, the term premium and CPI. Sadorsky
concludes that particularly technology stock prices do not respond well to uncertainty in
macroeconomic conditions, which are often caused by oil price volatility.
Other studies conducting research in this aspect of the relation of oil and stock markets
focus for example on Canada or Australia only. For the sake of brevity these studies are
not mentioned here, but see e.g. Sadorsky (2001) and Faff & Brailsford (1999). Naturally,
(national) stock markets and their indices reflect the national economy. The reaction to
oil price changes should therefore base upon the anticipated respective sensitivity of each
economy. This argument is largely backed by research within the oil and macroeconomic
relations. For oil and stock markets this argument may need further clearance. The study
by Nandha & Faff (2008) fails to provide a clear picture. The aggregation level of global
industry indices seems too high, and little information and insights out of this highly
aggregated data deliver little ground for reasoning.
7.5 Oil Sensitivities of Firms Regarding Size
Sadorsky (2008) initiates the discussion around the firm size, stock prices and the re-
spective sensitivity to oil prices. The underlying rationale for this study rests upon two
strands of research regarding the influence of firm size on their respective efficiency and
operability. One thesis argues that big firms would do better in case of extraordinary oil
price movements, as they draw from a longer history of experience, more resources and
capabilities and are generally more profitable, efficient and productive. The other thesis
reasons that small firms are more flexible and thus more efficient, since they are more in-
novative, are less bound by bureaucrativ structures and face less principle-agent problems.
Small firms could hence accommodate themselves to oil price changes equally well as big
firms, for example by substituting input factors.
For empirical testing, Sadorsky sets up a multi-beta CAPM15 where stock returns
are explained by firm size (annual sales in U.S. Dollar), market returns, interest rates,
oil price returns (WTI front month future) and oil price volatility. He also picks up the15Please see e.g. Copeland et al. (2005, p. 60ff) for the motivation of the Capital Asset Pricing Model.

CHAPTER 7. OIL AND STOCK MARKETS 59
asymmetry argument and includes oil variables in alternative models as up and down
movements by price and volatility respectively. The study comprises panel data of 1500
firms (S&P 1500 with 600 small firms, 400 medium-sized firms, and 500 large firms) from
1990 to 2006 ony a yearly basis. Estimation results show that stock price returns react
negatively on augmenting firms size and oil prices, whereas they react positively on market
returns, interest rate spreads and oil price volatility. With regard to asymmetric oil price
variables, Sadorsky finds that stock returns are affected more intensively by oil price rises.
The variable firm size also yields clearer results for medium-sized firms when extimated
with asymmetric oil price specifications. Generally, the study detects that medium-sized
firms rather face a negative impact of oil prices on their stock prices than small-sized and
large firms. Where small firms have advantages in flexibilitiy and the ability to adapt,
large firms have advantages in efficiency and financial might. Medium-sized firms do not
enjoy these specific andvantages and are therefore more vulnerable.
Since this paper stands alone at the time of writing, it is dificult to put it into perspec-
tive with other positions. Nevertheless, Sadorsky (2008) offers relevant new insights for
further research as well as for stock market participants. The rationale for medium-sized
firms to be most vulnerable to oil price changes is reasonable, especially, if the financial
part of large firms is considered. Large firms do not only enjoy financial robustness due
to their sheer size but they also rather engage in hedging activities, which again require
a fair amount of capability and knowledge. Medium-sized firms, however, may not have
the critical size to attract respecitive specialists for knowledge, but may also lag behind
in modern corporate financing methods. Although this argument rather applies to the
most recent decade, the argument of financing capability and knowledge nevertheless is
applicable to earlier data in that data sample.
8 Conclusion
This master thesis seeks to provide a comprehensive overview on research regarding the
relationship of oil, economics and financial markets. Where necessary, popular notions
such as peak oil are reviewed and rectified. An extensive outline of oil price fundamentals
show that physics and chemistry with related technical aspects, politics and nature itself
play a vital role in the world of oil. Oil shock research deals predominantly with technical
econometric aspects as oil prices underwent fundamental changes every decade or so, puz-
zling researchers. One important new position in oil shock research was introduced with
the differentiation of oil shocks. Different reasons trigger different outcomes. Research
on transmission channels lately showed that popular theoretical arguments, such as the
uncertainty effect, may not hold true. Furthermore, empirical evidence for the manufac-
turing sector offers some insight, which addresses also research on national patterns of
responses to oil shocks. Research on international transmission channels again stressed
that exchange rates and financial markets can either aggravate or alleviate the impact on
oil importing countries’ trade balances and economies, depending on the movement and
state.
Most studies used to concentrate largely on the economic side and the financial market
side came more into focus during the last years. The literature around oil and stock
markets in particular is very fragmented and there are few studies which enjoyed some
follow-up and validation or correction. Often, papers stand alone and results may or may
not apply. Furthermore, a number of studies find contradicting results and there are few
clear-cut empirical findings. In general, only weak results are found in favour of oil prices
exerting a significant influence on stock prices. Papers differentiating along industrial
sectors or firm sizes yield some more interesting results. Research on transmission of oil
prices into firms’ balance sheets and thus stock prices not only explains a good share of
common notions mostly cited in the financial press, but also strengthens some arguments
in the oil and macroeconomic research. Some sector-specific studies found that energy
intensive industries such as transportation is hurt most by rising oil prices and that energy
producing industries benefit respectively. However, the reminder of economies react less
unambiguously on oil price changes. The transmission channels of oil price changes are
also not evident, most studies found contradicting results.
60

CHAPTER 8. CONCLUSION 61
Some important aspects, however, have not been covered by research yet. For example,
emerging markets started to drive developments and fundamentals in the world of oil,
and this is still a blank spot. Admittedly, a lack of or insufficient data probably hampers
examining this topic. Also, research examining end consumers’ reactions to oil price shocks
may add some further insights on how oil price changes transmit. The latest developments
in the U.S. and German car manufacturing sector promise interesting evidence. Another
field of much needed development is research on oil and financial markets. Not only stock
markets may react to oil prices but others as well. Thus, some more evidence on exchange
rates, interest rates and other commodity markets could enhance existent evidence.
The time factor and historical context is important when evaluating empirical results
regarding oil. Oil dynamics change regularly, so some empirical findings may not be eas-
ily transferred. Even during the time of writing this thesis, which span over almost one
year from September 2008 to August 2009, fundamentals and oil prices changed signifi-
cantly. Naturally, the financial and economic circumstances have been extraordinary, but
it actually made the topic more exciting to see global dynamics change within weeks.

References
Apergis, N., & Miller, S. M. (2009). Do structural oil-market shocks affect stock prices?
Energy Economics, 31 , 569-575.
Backus, D. K., & Crucini, M. J. (2000). Oil Prices and the Terms of Trade. Journal of
International Economics, 50 , 185-312.
Baek, E. G., & Brock, W. A. (1992). A General Test for Nonlinear Granger Causality:
Bivariate Model (Working Paper). Iowa State University and University of Wiscon-
sin.
Balke, N. S., Brown, S. P. A., & Yucel, M. K. (2002). Oil Price Shocks and the U.S.
Economy: Where Does the Asymmetry Originate? The Energy Journal , 23 , 27-52.
Barsky, R. B., & Kilian, L. (2000). A Monetary Explanation of the Great Stagflation of
the 1970s (Working Paper No. 7547). National Bureau of Economic Research.
Barsky, R. B., & Kilian, L. (2004). Oil and the Macroeconomy Since the 1970s. Journal
of Economic Perspectives, 18 , 115-134.
Bernanke, B. S. (1983). Irreversibility, Uncertainty, and Cyclical Investment. The Quar-
terly Journal of Economics, 98 , 85-106.
Bernanke, B. S., Gertler, M., Watson, M., Sims, C. A., & Friedman, B. M. (1997).
Systematic Monetary Policy and the Effects of Oil Price Shocks. Brookings Papers
on Economic Activity , 1997 , 91-157.
Bjornland, H. C. (2000). The Dynamic Effects of Aggregate Demand, Supply and Oil
Price Shocks - A Comparative Study. The Manchester School , 68 , 589-607.
Blanchard, O. J., & Gali, J. (2007). The Macroeconomic Effects of Oil Price Shocks: Why
Are the 2000s so Different from the 1970s? (Working Paper No. 07-11). MIT Center
for Energy and Environmental Policy Research.
Bodenstein, M., Erceg, C. J., & Guerrieri, L. (2007). Oil Shocks and External Adjustment
(International Finance Discussion Papers No. 897). Board of Governors of the Federal
Reserve System.
Bohi, D. R. (1991). On the Macroeconomic Effects of Energy Price Shocks. Resources
and Energy , 13 , 145-162.
Brown, S. P., & Yucel, M. K. (2002). Energy Prices and Aggregate Economic Activity:
An Interpretative Survey. The Quarterly Review of Economics and Finance, 42 ,
193–208.
62

References 63
Burbridge, J., & Harrison, A. (1984, June). Testing for the Effects of Oil-Price Rises
Using Vector Autoregressions. International Economic Review , 25 , 459-484.
Chen, N.-F., Roll, R., & Ross, S. A. (1986). Economic Forces and the Stock Market.
Journal of Business, 59 , 383-403.
Chen, S.-S. (2009). Oil price pass-through into inflation. Energy Economics, 31 , 126-133.
Choi, K., & Hammoudeh, S. (2009). Long Memory in Oil and Refined Products Markets.
The Energy Journal , 30 , 97-116.
Ciner, C. (2001). Energy Shocks and Financial Markets: Nonlinear Linkages. Studies in
Nonlinear Dynamics & Econometrics, 5 , 203-212.
Cobo-Reyes, R., & Quiros, G. P. (2005). The Effect of Oil Prices on Industrial Production
and on Stock Returns (ThE Papers No. 05/18). University of Granada Department
of Economic Theory and Economic History.
Cologni, A., & Manera, M. (2008). Oil prices, Inflation and Interest Rates in a Structural
Cointegrated VAR Model for the G-7 Countries. Energy Economics, 30 , 856–888.
Copeland, T. E., Weston, J. F., & Shastri, K. (2005). Financial Theory and Corporate
Policy (Fourth ed.). Pearson Addison Wesley.
Crowder, W. J., & Hamed, A. (1993). A Cointegration for Oil Futures Market Efficiency.
The Journal of Futures Markets, 13 , 933-941.
Cunado, J., & Gracia, F. P. de. (2003). Do Oil Price Shocks Matter? Evidence for Some
European Countries. Energy Economics, 25 , 137-154.
Davis, S. J., & Haltiwanger, J. (2001). Sectoral Job Creation and Destruction Responses
to Oil Price Changes. Journal of Monetary Economics, 48 , 465–512.
Deaton, A., & Laroque, G. (1992). On the Behaviour of Commodity Prices. The Review
of Economic Studies, 59 , 1-23.
Dees, S., Gasteuil, A., Kaufmann, R. K., & Mann, M. (2008). Assessing the Factors
Behind Oil Price Changes (Working Paper No. 855). European Central Bank.
Dotsey, M., & Reid, M. (1992). Oil Shocks, Monetary Policy, and Economic Activity.
Federal Reserve Bank of Richemond Economic Review , 78 , 14-27.
Edelstein, P., & Kilian, L. (2007). The Response of Business Fixed Investment to Changes
in Energy Prices: A Test of Some Hypotheses about the Transmission of Energy Price
Shocks. The B.E. Journal of Macroeconomics, 7 , Article 35.

References 64
Elekdag, S., Lalonde, R., Laxton, D., Muir, D., & Pesenti, P. (2008). Oil Price Movements
and the Global Economy: A Model Based Assessment (Working Paper No. 13792).
National Bureau of Economic Research.
El-Sharif, I., Brown, D., Burton, B., Nixon, B., & Russell, A. (2005). Evidence on the
Nature and Extent of the Relationship between Oil Prices and Equity Values in the
UK. Energy Economics, 27 , 819–830.
Ewing, B. T., & Thompson, M. A. (2007). Dynamic Cyclical Comovements of Oil Prices
with Industrial Production, Consumer Prices, Unemployment, and Stock Prices.
Energy Economics, 35 , 5535-5540.
Faff, R. W., & Brailsford, T. J. (1999). Oil Price Risk and the Australian Stock Market.
Journal of Energy Finance and Development , 4 , 69–87.
Fama, E. F. (1970). Efficient Capital Markets: A Review of Theory and Empirical Work.
Journal of Finance, 25 , 383-417.
Fama, E. F., & French, K. R. (1987). Commodity Futures Prices: Some Evidence on
Forecast Power, Premiums, and the Theory of Storage. Journal of Business, 60 ,
55-73.
Ferderer, J. P. (1996). Oil Price Volatility and the Macroeconomy. Journal of Macroeco-
nomics, 18 , 1-26.
Gogineni, S. (2009). Oil and the Stock Market: An Industry Level Analysis (Working
Paper). University of Oklahoma.
Gorton, G. B., Hayashi, F., & Rouwenhorst, K. G. (2007, July). The Fundamentals
of Commodity Futures Returns (Working Paper No. 13249). National Bureau of
Economic Research.
Gregorio, J. D., Landerretche, O., & Neilson, C. (2007). Another Pass-Through Bites the
Dust? Oil Prices and Inflation (Working Paper No. 417). Central Bank of Chile.
Gronwald, M. (2008). Large Oil Shocks and the US Economy: Infrequent Incidents with
Large Effects. The Energy Journal , 29 , 151-171.
Hamilton, J. D. (1983). Oil and the Macroeconomy Since World War II. The Journal of
Political Economy, 91 , 228-248.
Hamilton, J. D. (1988). A neoclassical model of unemployment and the business cycle.
Journal of Politcal Economy, 96 , 593-617.
Hamilton, J. D. (1994). Time Series Analysis. Princeton University Press.
References 65
Hamilton, J. D. (1996). This is What Happened to the Oil Price-Macroeconomy Rela-
tionship. Journal of Monetary Economics, 38 , 215-220.
Hamilton, J. D. (2003b). What is an Oil Shock? Journal of Econometrics, 113 , 363-398.
Hamilton, J. D. (2009). Understanding Crude Oil Prices. The Energy Journal , 30 ,
179-206.
Hamilton, J. D., & Herrera, A. M. (2004). Oil Shocks and Aggregate Macroeconomic
Behavior: The Role of Monetary Policy. Journal of Money, Credit, and Banking,
36 , 266-286.
Herrera, A. M. (2008). Oil Price Shocks, Inventories and Macroeconomic Dynamics.
Journal of Economic Dynamics and Control , revision requested .
Hiemstra, C., & Jones, J. D. (1994). Testing for Linear and Nonlinear Granger Causality
in the Stock Price-Volume Relation. The Journal of Finance, 49 , 1639-1664.
Holland, S. P. (2008). Modeling peak oil. The Energy Journal , 29 , 61-79.
Hooker, M. A. (1996b). What Happened to the Oil Price-Macroeconomy Relationship?
Journal of Monetary Economics, 38 , 195-213.
Hooker, M. A. (1999). Oil and the Macroeconomy Revisited (FEDS Working Paper No.
99-43). Board of Governors of the Federal Reserve System.
Hooker, M. A. (2002). Are Oil Shocks Inflationary? Asymmetric and Nonlinear Spec-
ifications versus Changes in Regime. Journal of Money, Credit and Banking, 34 ,
540-561.
Huang, B.-N., Hwang, M., & Peng, H.-P. (2005). The Asymmetry of the Impact of Oil
Price Shocks on Economic Activities: An Application of the Multivariate Threshold
Model. Energy Economics, 27 , 455-476.
Huang, R. D., Masulis, R. W., & Stoll, H. R. (1996). Energy Shocks and Financial
Markets. The Journal of Futures Markets, 16 , 1-27.
Hunt, B. (2006). Oil Price Shocks and the U.S. Stagflation of the 1970s: Some Insights
from GEM. The Energy Journal , 27 , 61-81.
Hunt, B., lsard, P., & Laxton, D. (2001). The Macroeconomic Effects of Higher Oil Prices
(Working Paper No. WP/01/14). International Monetary Fund.
Huntington, H. G. (2007). Oil Shocks and Real U.S. Income. The Energy Journal , 28 ,
31-47.

References 66
Jimenez-Rodrıguez, R. (2008). The Impact of Oil Price Shocks: Evidence From the
Industries of Six OECD Countries. Energy Economics, 30 , 3095–3108.
Jimenez-Rodrıguez, R., & Sanchez, M. (2005). Oil price shocks and real gdp growth:
Empirical evidence for some oecd countries. Journal of Applied Economics, 2005 ,
37 , 201-228.
Jones, C. M., & Kaul, G. (1996). Oil and the Stock Markets. Journal of Finance, 51 ,
463-491.
Kapetanios, G., & Tzavalis, E. (2004). The Impact of Large Structural Shocks on Economic
Relationships: Evidence from Oil Price Shocks (Working Paper No. 524). Queen
Mary University of London Department of Economics.
Kaufmann, R. K., Dees, S., Gasteuil, A., & Mann, M. (2008). Oil Prices: The Role of
Refinery Utilization, Futures Markets and Non-Linearities. Energy Economics, 30 ,
2609-2622.
Kaul, G., & Seyhun, H. N. (1990). Relative Price Variability, Real Shocks, and the Stock
Market. The Journal of Finance, 45 , 479-496.
Keane, M. P., & Prasad, E. S. (1996). The Employment and Wage Effects of Oil Price
Changes - A Sectoral Analysis. Review of Economics and Statistics, 78 , 389-400.
Kilian, L. (2005). The Effects of Exogenous Oil Supply Shocks on Output and Inflation:
Evidence from the G7 Countries (Discussion Paper No. 5404). Center for Economic
Policy Resarch.
Kilian, L. (2008a). A Comparison of the Effects of Exogenous Oil Supply Shocks on Output
and Inflation in the G7 Countries. Journal of the European Economic Association,
6 , 78-121.
Kilian, L. (2008b). The Economic Effects of Energy Price Shocks. Journal of Economic
Literature, 46 , 871-909.
Kilian, L. (2008c). Not All Price Shocks Are Alike: Disentangling Demand and Supply
Shocks in the Crude Oil Market. American Economic Review , 99 , 1053-1069.
Kilian, L., & Park, C. (2008). The Impact of Oil Price Shocks on the U.S. Stock Market.
International Economic Review , forthcoming .
Kilian, L., & Vega, C. (2008). Do Energy Prices Respond to U.S. Macroeconomic News? A
Test of the Hypothesis of Predetermined Energy Prices (Discussion Paper No. 7015).
Center for Economic Policy Resarch.

References 67
Krichene, N. (2006a). Recent Dynamics of Crude Oil Prices (Working Paper No.
WP/06/299). International Monetary Fund.
Krichene, N. (2006b). World Crude Oil Markets: Monetary Policy and the Recent Oil
Shock (Working Paper No. WP/06/62). International Monetary Fund.
Lardic, S., & Mignon, V. (2008). Oil prices and economic activity: An asymmetric
cointegration approach. Energy Economics, 30 , 847–855.
Leduc, S., & Sill, K. (2004). A Quantitative Analysis of Oil-Price Shocks, Systematic
Monetary Policy, and Economic Downturns. Journal of Monetary Economics, 51 ,
781–808.
Lee, B. R., Lee, K., & Ratti, R. A. (2001). Monetary Policy, Oil Price Shocks and the
Japanese Economy. Japan and the World Economy , 13 , 321-349.
Lee, K., & Ni, S. (2002). On the Dynamic Effects of Oil Price Shocks: A Study Using
Industry Level Data. Journal of Monetary Economics, 49 , 823-852.
Lee, K., Ni, S., & Ratti, R. A. (1995). Oil Shocks and the Macroeconomy: The Role of
Price Variability. The Energy Journal , 16 , 39-56.
Lippi, F., & Nobili, A. (2008). Oil and the Macroeconomy: A Structural VAR Analysis with
Sign Restrictions (Working Paper No. 6830). Center for Economic Policy Resarch.
Miller, J. I., & Ratti, R. A. (2009). Crude Oil and Stock Markets: Stability, Instability,
and Bubbles. Energy Economics, 31 , 559-568.
Mork, K. A. (1989). Oil and the Macroeconomy When prices go up and down: An
extension of Hamilton’s Results. Journal of Political Economy, 97 , 740-744.
Mork, K. A., & Olsen, O. (1994). Macroeconomic Responses to Oil Price Increases and
Decreases in Seven OECD Countries. Energy Journal , 15 , 19-38.
Nandha, M., & Faff, R. (2008). Does Oil Move Equity Prices? A Global View. Energy
Economics, 30 , 986–997.
Park, J., & Ratti, R. A. (2008). Oil price shocks and stock markets in the U.S. and 13
European countries. Energy Economics, 30 , 2587–2608.
Raymond, J. E., & Rich, R. W. (1997). Oil and the Macroeconomy: A Markov State-
Switching Approach. Journal of Money, Credit, and Banking, 29 , 193-213.
Romer, C., & Romer, D. (1989). Does Monetary Policy Matter? A New Test in the Spirit
of Friedman and Schwartz (Working Paper No. 2966). National Bureau of Economic
Research.

References 68
Sadorsky, P. (1999). Oil Price Shocks and Stock Market Activity. Energy Economics, 21 ,
449-469.
Sadorsky, P. (2000). The Empirical Relationship Between Energy Futures Prices and
Exchange Rates. Energy Economics, 22 , 253-266.
Sadorsky, P. (2001). Risk Factors in Stock Returns of Canadian Oil and Gas Companies.
Energy Economics, 23 , 17-28.
Sadorsky, P. (2002). Time-Varying Risk Premiums in Petroleum Futures Prices. Energy
Economics, 24 , 539-556.
Sadorsky, P. (2003). The macroeconomic determinants of technology stock price volatility.
Review of Financial Economics, 12 , 191-205.
Sadorsky, P. (2008). Assessing the Impact of Oil Prices on Firms of Different Sizes: Its
Tough Being in the Middle. Energy Policy , 36 , 3854-3861.
Sakellaris, P. (1997). Irreversible Capital and the Stock Market Response to Shocks in
Profitability. International Economic Review , 38 , 351-379.
Sanchez, M. (2008). Oil Shocks and Endogenous Markups (Working Paper No. 860).
European Central Bank.
Sill, K. (2007). The Macroeconomics of Oil Shocks. Business Review Federal Reserve
Bank of Phildelphia, Q1 , 21-31.
Smith, J. L. (2008). World Oil: Market or Mayhem? (Working Paper No. 08-015). MIT
Center for Energy and Environmental Policy Research.
Taneko, T. (1995). Relative Importance of Economic Factors in U.S. and Japanese Stock
Markets. Journal of the Japanese and International Economies, 9 , 290-307.
Tsay, R. S. (1998b). Testing and Modeling Multivariate Threshold Models. Journal of
the American Statistical Association, 93 , 1188-1202.
Wei, C. (2003). Energy, the Stock Market, and the Putty-Clay Investment Model. Amer-
ican Economic Review , 93 , 311-323.
Zhang, D. (2008). Oil shock and economic growth in Japan: A nonlinear approach. Energy
Economics, 30 , 2374–2390.

Internet Sources
Bayer, T. (2009, July 21). Schwere Zeiten auf dem Olmarkt. Retrieved August 7, 2009,
from http://www.ftd.de/boersen\ maerkte/aktien/rohstoffe/:Raffinerien
-in-der-Krise-Schwere-Zeiten-auf-dem-%D6lmarkt/542563.html
BP. (2009, June). BP Statistical Review of World Energy. Retrieved
July 20, 2009, from http://www.bp.com/productlanding.do?categoryId=
6929&contentId=7044622
Buyuksahin, B., Haigh, M. S., Harris, J. H., Overdahl, J. A., & Robe, M. A. (2008, De-
cember). Fundamentals, Trader Activity and Derivative Pricing. Retrieved August
4, 2009, from http://www.cftc.gov/EconomicAnalysis/index.htm
EIA. (2008a). Oil Market Basics - Refining. Retrieved January 12, 2009, from
http://www.eia.doe.gov/pub/oil gas/petroleum/analysis publications/
oil market basics/refining text.htm
EIA. (2008b). Oil Market Basics - Stocks. Retrieved January 12, 2009, from
http://www.eia.doe.gov/pub/oil gas/petroleum/analysis publications/
oil market basics/default.htm
EIA. (2009). Short-Term Energy Outlook. Retrieved August 4, 2009, from http://
www.eia.doe.gov/emeu/steo/pub/contents.html
Interagency Task Force on Commodity Markets. (2008). Interim Report on Crude Oil.
Retrieved August 4, 2009, from {http//:www.cftc.gov/EconomicAnalysis/index
.htm}
Reuters. (2007, December 8). Iran stops selling oil in U.S. dollars - report. Retrieved
July 16, 2009, from http://uk.reuters.com/article/idUKDAH83366720071208
Reuters. (2008, June 4). U.S. auto sales plunge, drag market down in May. Re-
trieved August 16, 2009, from http://www.reuters.com/article/businessNews/
idUSN0338197620080604
Reuters. (2009a, April 17). Oil lower as traders await gasoline data. Re-
trieved August 4, 2009, from http://www.reuters.com/article/hotStocksNews/
idUSSP21968520070417
Reuters. (2009b, June 26). Opec helps savvy oil traders sell millions of barrels.
Retrieved August 7, 2009, from http://www.reuters.com/article/GCA-Oil/
idUSTRE55P3PQ20090626
69