Oil and Gas Security - Belgium 2010 · Oil and gas represent roughly two-thirds of the total...
18
BELGIUM Key Figures ________________________________________________________________ 2 Overview __________________________________________________________________ 3 1. Energy Outlook ___________________________________________________________ 4 2. Oil _____________________________________________________________________ 5 2.1 Market Features and Key Issues ____________________________________________________ 5 2.2 Oil Supply Infrastructure __________________________________________________________ 7 2.3 Decision-making Structure for Oil Emergencies ________________________________________ 9 2.4 Stocks _________________________________________________________________________ 9 3. Other Measures _________________________________________________________ 12 3.1 Demand Restraint ______________________________________________________________ 12 3.2 Fuel Switching _________________________________________________________________ 13 3.3 Others ________________________________________________________________________ 13 4. Natural Gas _____________________________________________________________ 13 4.1 Market Features and Key Issues ___________________________________________________ 13 4.2 Natural Gas Supply Infrastructure __________________________________________________ 14 4.3 Emergency Policy for Natural Gas __________________________________________________ 16 List of Figures Total Primary Energy Supply ____________________________________________________________ 4 Electricity Generation by Fuel Source _____________________________________________________ 4 Crude Oil Imports by Source ____________________________________________________________ 5 Oil Consumption by Product ____________________________________________________________ 5 Oil Demand (kb/d) ____________________________________________________________________ 5 Refinery Output vs. Demand ____________________________________________________________ 8 Oil Storage Capacity, by Main Storage Area ________________________________________________ 8 Total Emergency Reserves, by Type _____________________________________________________ 10 Total Emergency Reserves, by Location __________________________________________________ 10 Oil Consumption by Sector ____________________________________________________________ 12 Natural Gas Consumption by Sector _____________________________________________________ 13 Natural Gas Imports, by Source _________________________________________________________ 14 The Natural Gas Grid _________________________________________________________________ 15 Natural Gas Storage Capacity (H-gas) ____________________________________________________ 16
Transcript of Oil and Gas Security - Belgium 2010 · Oil and gas represent roughly two-thirds of the total...

BELGIUM Key Figures ________________________________________________________________ 2
Overview __________________________________________________________________ 3
1. Energy Outlook ___________________________________________________________ 4
2. Oil _____________________________________________________________________ 5 2.1 Market Features and Key Issues ____________________________________________________ 5 2.2 Oil Supply Infrastructure __________________________________________________________ 7 2.3 Decision-making Structure for Oil Emergencies ________________________________________ 9 2.4 Stocks _________________________________________________________________________ 9
3. Other Measures _________________________________________________________ 12 3.1 Demand Restraint ______________________________________________________________ 12 3.2 Fuel Switching _________________________________________________________________ 13 3.3 Others ________________________________________________________________________ 13
4. Natural Gas _____________________________________________________________ 13 4.1 Market Features and Key Issues ___________________________________________________ 13 4.2 Natural Gas Supply Infrastructure __________________________________________________ 14 4.3 Emergency Policy for Natural Gas __________________________________________________ 16
List of Figures
Total Primary Energy Supply ____________________________________________________________ 4 Electricity Generation by Fuel Source _____________________________________________________ 4 Crude Oil Imports by Source ____________________________________________________________ 5 Oil Consumption by Product ____________________________________________________________ 5 Oil Demand (kb/d) ____________________________________________________________________ 5 Refinery Output vs. Demand ____________________________________________________________ 8 Oil Storage Capacity, by Main Storage Area ________________________________________________ 8 Total Emergency Reserves, by Type _____________________________________________________ 10 Total Emergency Reserves, by Location __________________________________________________ 10 Oil Consumption by Sector ____________________________________________________________ 12 Natural Gas Consumption by Sector _____________________________________________________ 13 Natural Gas Imports, by Source _________________________________________________________ 14 The Natural Gas Grid _________________________________________________________________ 15 Natural Gas Storage Capacity (H-gas) ____________________________________________________ 16


BELGIUM
3
OVERVIEW Oil and natural gas provide two-thirds of Belgium’s primary energy supply. While total energy use in Belgium is expected to decline slightly in the coming decades, natural gas demand will increase as new power generation to replace ageing power facilities by 2020 will be mainly gas-fired. With no domestic oil or natural gas production, Belgium is fully dependent on imports. Yet, due to its geographical location and infrastructure, Belgium plays an important role in Europe’s oil and gas supply chain. In the case of natural gas, Belgium is a major hub of gas flows in the region, with some 80 billion cubic metres (bcm) transiting the country each year, compared to domestic consumption of just over 17 bcm per year. Belgium’s large domestic oil refining sector results in the country being a net-exporter of refined products. Nearly one-quarter of oil demand in Belgium is for fuel oil deliveries to international sea-going ships. Excluding these amounts, oil demand in Belgium is dominated by middle distillates, which represent 60% of the oil products consumed in the country. Belgium’s primary response measure in an oil supply disruption is the use of public oil stocks. Belgium’s public stockholding agency, APETRA, began operations in 2007. Until its creation, Belgium relied entirely on its domestic oil industry to meet its IEA stockholding obligation. This was done by placing a minimum stockholding obligation on oil importers based on EU regulations regarding the three main product categories. With the creation of APETRA, the obligation on industry was reduced from covering the full stockholding obligation to only 15 days. The remainder of the national stockholding obligation became the responsibility of APETRA. The portion of the stockholding obligation attributed to industry is to be reduced each year by three days, until 1st April 2012, at which time APETRA will become fully responsible for meeting Belgium’s national stockholding obligations. Concerning natural gas, the country has a robust transport network that is well integrated with other countries through 18 entry points. However, it lacks significant storage capacity and gas demand is likely to grow sharply in the coming years, as gas takes on a greater role in power generation. The Administration relies upon its system operator, Fluxys, to maintain emergency plans for maintaining supply security.
4
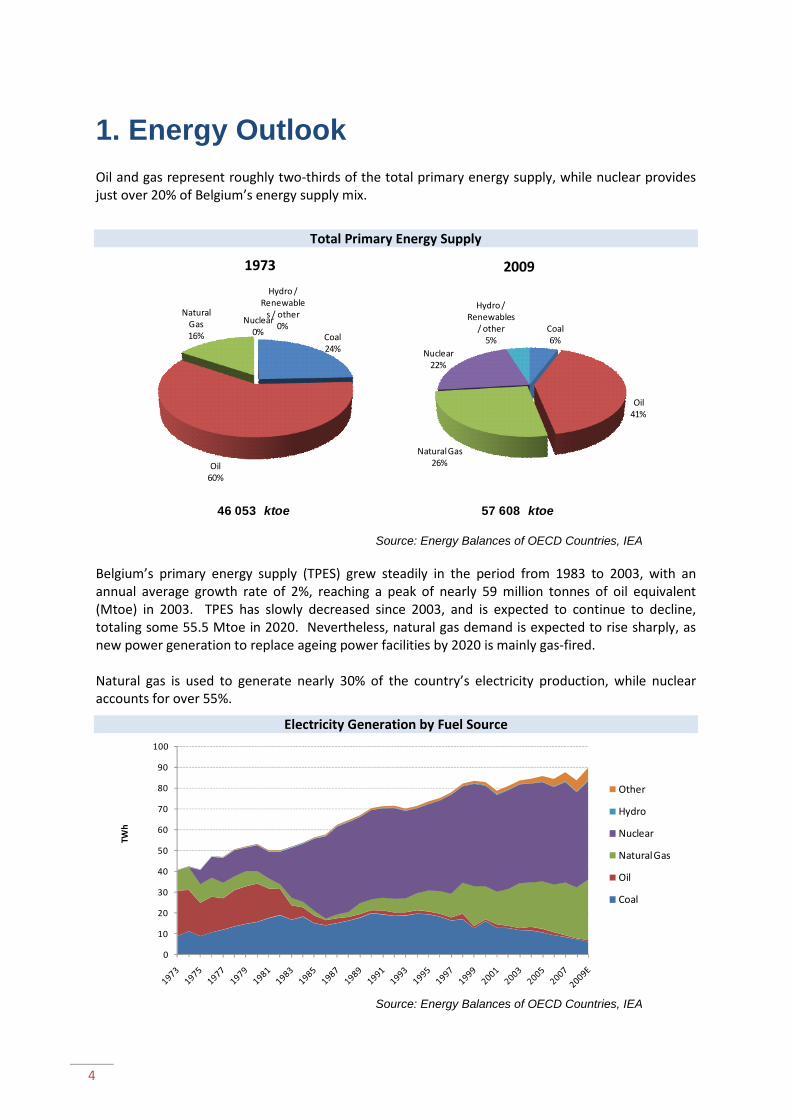
1. Energy Outlook Oil and gas represent roughly two-thirds of the total primary energy supply, while nuclear provides just over 20% of Belgium’s energy supply mix.
Total Primary Energy Supply
46 053 ktoe ktoe 57 608
Coal 24%
Oil 60%
Natural Gas 16%
Nuclear 0%
Hydro / Renewable
s / other0%
1973
Coal 6%
Oil 41%
Natural Gas 26%
Nuclear 22%
Hydro / Renewables
/ other5%
2009
Source: Energy Balances of OECD Countries, IEA Belgium’s primary energy supply (TPES) grew steadily in the period from 1983 to 2003, with an annual average growth rate of 2%, reaching a peak of nearly 59 million tonnes of oil equivalent (Mtoe) in 2003. TPES has slowly decreased since 2003, and is expected to continue to decline, totaling some 55.5 Mtoe in 2020. Nevertheless, natural gas demand is expected to rise sharply, as new power generation to replace ageing power facilities by 2020 is mainly gas-fired. Natural gas is used to generate nearly 30% of the country’s electricity production, while nuclear accounts for over 55%.
Electricity Generation by Fuel Source
0
10
20
30
40
50
60
70
80
90
100
TWh
Other
Hydro
Nuclear
Natural Gas
Oil
Coal
Source: Energy Balances of OECD Countries, IEA

BELGIUM
5
2. Oil 2.1 Market Features and Key Issues
Crude Oil Imports by Source
-
100
200
300
400
500
600
700
800
thou
sand
bar
rels
per
day
Russian Federation
Saudi Arabia
Iran
United Kingdom
Norway
Other
Source: Monthly Oil Statistics, IEA Belgium has no indigenous oil production and is thus 100% import dependant. In 2009 the country’s refineries processed some 31.8 million tons of crude oil, roughly 638 thousand barrels per day (kb/d). Crude oil imports for the year came primarily from the former Soviet Union (43%), OPEC (31%) and the North Sea (22%). Russia is the single largest source of crude oil imports, providing some 240 kb/d in 2009. Its share in Belgium’s total crude imports has risen significantly over the past decade, representing nearly 40% of the total in 2009 compared to 15% in 2000. Residual fuel oil is the single largest component of the oil products going to the Belgian market. However, the vast majority of this, 90%, goes to international marine bunkers, fuelling international sea-going ships. The remainder is mainly used for industrial purposes and power generation; however, demand is declining due to environmental concerns and greater use of natural gas. Naphtha is also a large component of the country’s oil demand, as Belgium is one of the main petrochemical hubs in Europe.
Oil Consumption by Product
-
100
200
300
400
500
600
700
800
thou
sand
bar
rels
per
day Naphtha
Motor Gas
Jet and Kerosene
Diesel
Other Gasoil
Residual Fuels
Other
Source: Monthly Oil Statistics, IEA
Oil Demand in 2009 (kb/d) LPG and Ethane 23 Naphtha 92 Gasoline 26 Kerosene 42 Diesel 136 Heating/other Gasoil 77 Residual Fuels 150 Other Products 64
Total Products 608 Source: Monthly Oil Statistics, IEA

6
Middle distillates represent the bulk of the fuels used domestically, primarily made up of diesel for transport use. Heating oil use is structurally declining as the country moves toward natural gas and electricity-based heating. Notwithstanding the recent decline in oil demand due to the economic recession, the use of diesel has risen steadily over the past decade. In the period from 1995 to 2008, demand for transport diesel grew by 3.6% per year. This compares to a decline over the same period in the demand for gasoil for heating (-2.7% p.a.) and motor gasoline (-5.9% p.a.). In 2008, the transport sector accounted for 46% of all oil used in Belgium. Diesel represents roughly 82% of the total fuels used for transport, and is expected to continue taking up a greater share of the total. It is estimated that roughly 9 of every 10 new cars sold in the country are diesel engines. Taxes and maximum price mechanism Automotive diesel has a price advantage for consumers due to a lower tax rate compared to gasoline. Excise duties on diesel (EUR 0.353/litre at end 2009) are lower than motor gasoline (EUR 0.614/litre at end 2009). This is also the case for the VAT, where EUR 0.184/litre was applied to non-commercial diesel at the end of 2009, compared to EUR 0.236/litre for gasoline (98 RON).
At the same time, Belgium maintains a maximum price-setting mechanism called ‘Le Contrat de Programme’. This sets limits on prices charged to end-consumers for gasoline, heating and automotive gasoil, fuel-oil and LPG. The maximum prices are calculated daily. If the price change for each product compared with the previous day or compared with the moving average for the previous seven days exceeds a calculated threshold, a new tariff comes into effect the following day.
The formula for setting the maximum price is based on ex-refinery prices, primarily at the Rotterdam market. To this is added a distribution margin which is indexed annually and comprises a uniform element for all products and a sales margin (incorporating a fixed profit margin) as well as the APETRA levy (see Emergency Oil Reserves section below), excise duties and the value-added tax. The formula is agreed in a 3-year contract between the Belgian State and the Belgian Oil Federation. In addition to this formula for setting the maximum price, there is a “système du cliquet”, which adjusts the level of excise duties in order to absorb 50% of the change in the maximum price.
Imports/exports and import dependency While fully dependant on crude oil imports, Belgium is an overall net-exporter of refined products. Belgian refinery output is traded across much of Europe. Belgian refineries supply two-thirds of Luxembourg’s product import requirements and, given their proximity to the ARA barge market and the Rhine and product pipelines, jet kerosene, gas/diesel oil and gasoline are exported to Germany, France and Switzerland. At the same time, Belgium imports significant quantities of gas/diesel oil from the Netherlands and, to a lesser extent, from Russia. Furthermore, Belgium is increasingly becoming a net importer of fuel oil to meet growing international bunker fuel demand. Oil Company Operations There are four companies operating in the Belgian refining industry: Total, ExxonMobil, Petroplus and Antwerp Terminal and Processing Company (ATPC, VTTi Group). Altogether, 20 companies, including majors and independents, import oil, while between 700 and 800 distributors, primarily

BELGIUM
7
small companies delivering heating oil, operate on the Belgian market. The number of filling stations in operation has declined from 4 750 in 2000 to 3 295 in 2007. The three main industry associations in Belgium are the Belgian Petroleum Federation, the Belgian Petroleum Union and BRAFCO. The Federation represents the four refiners, one storage company and the seven main distributors of oil products, covering all of the refining activity and 80% of fuel sales in the country. The Union represents independent importers, distributors and retailers. Its 16 members account for some 30% of Belgium’s product imports. BRAFCO is the federation of oil product wholesalers and retailers. It represents nearly 800 small- to medium-sized companies and roughly 10% of the service stations in the country.
2.2 Oil Supply Infrastructure
Refining Belgium has four refineries – all of which are located in Antwerp – with a total crude distillation capacity of over 790 kb/d (39 million tons per year). The most notable change in refinery activity in recent years is the increase of desulphurisation capacity, which reflects EU specifications to reduce sulphur content for gasoline and diesel, including the move in January 2009 to 10 ppm. The two major refineries, owned by Total (357 kb/d) and ExxonMobil (298 kb/d) are world class refineries capable of producing a relatively high yield of light and middle distillates. The third refinery, owned by Petroplus, is the smallest and least complex of the three; however, investment in hydro-treating has allowed it to produce 10 ppm diesel from a predominantly sour crude slate. The

8
fourth refinery, recenty acquired by the VTTi group, is an asphalt plant with a capacity of approximately 21 kb/d. In 2009, the capacity utilisation rate of Belgium’s refineries was 81%. Ports and Pipelines The Port of Antwerp is Belgium’s main sea port for oil trade. The port continues to handle a growing amount of oil trade and imports. According to the Antwerp Port Authority, maritime cargo trade of crude oil (3.95 Mt) and products (25.84 Mt) reached nearly 30 Mt in 2009. The main crude oil pipeline serving Belgium is the Rotterdam-Antwerp pipeline (RAPL), which originates in Rotterdam (The Netherlands) and travels into the Antwerp area. It has a capacity of 575 kb/d. Apart from inland waterways, a key method for transportation of oil products in Belgium is via the Central European Pipeline System (CEPS). The CEPS is a North American Treaty Organisation (NATO) pipeline network in Europe comprising 6000 km of pipeline interconnected to roughly 8.2 mb (1.3 mcm) of oil storage capacity. NATO maintains this distribution system primarily to provide fuel supply support to military bases. However, for many years, the pipeline’s surplus capacity has been leased for civilian storage, transportation and delivery of oil products. The contracts signed between NATO and the oil companies are based on market prices and supervised by the Ministry of Economic Affairs. Storage capacity
Oil Storage Capacity by Main Storage Area
Storage area
Crude Oil Distillates Total Oil '000 m3 mb '000 m3 mb '000 m3 mb
Antwerp 1 901 12 2 744 17 7 482 47
Ghent 753 5 935 6
Liege 187 1 202 1
Brussels 120 1 139 1
Other 914 6 979 6
Total 1 901 12 4 718 30 9 736 61
Source: Belgian Administration
There are over 40 oil storage facilities in Belgium, with a total combined capacity of just over 9.7 mcm or 61 million barrels (8.3 million tonnes of crude equivalent). This includes capacity used by
Refinery Output vs. Demand
0 50 100 150 200 250 300
Other Products
Residual Fuels
Gas/Diesel Oil
Jet and Kerosene
Gasolines
Naphtha
LPG and Ethane
thousand barrels per day
2009Refinery OutputDemand
Source: Monthly Oil Statistics, IEA

BELGIUM
9
industry for normal operations as well as storage capacity used by both industry and APETRA for strategic reserves. Some 620 thousand cubic metres of this capacity is reserved for APETRA. APETRA has also contracted additional capacity, primarily through the expansion of existing facilities and the construction of new facilities, which will add nearly 1 mcm (6.3 mb) of new storage capacity in Belgium over the period of 2009 to end-2012.
2.3 Decision-making Structure for Oil Emergencies Emergency response policy is the responsibility of the Minister of Energy (within the Federal Public Service Economy, SMEs, independent Professions and Energy), in consultation with the Council of Ministers. Under the Minister for Energy, the General Directorate for Energy, in the framework of the National Oil Board, serves as the core of the NESO. This team is responsible for maintaining and implementing emergency response measures in a supply disruption, for monitoring the domestic oil and gas markets and for data collection. The National Oil Board (NOB) was created by the Royal Decree of 11 October 1984 and is charged with the supply and distribution of oil products in time of crisis. It also serves as Belgium’s National Emergency Strategy Organisation (NESO). The permanent unit of the NOB is situated within the framework of the Energy Administration. In a crisis, it can be expanded to include experts from the Department of Economic Affairs, other ministerial departments, the oil stockholding agency Agence de Pétrole (APETRA) and the oil industry. All proposed measures would have to be considered by the Inter-Ministerial Economic Commission (CEI), which represents various government departments. The Minister of Energy would then submit the proposals to the Council of Ministers for final approval. The NOB’s main tasks in case of a supply disruption are to identify vital points (e.g. refineries, pipelines, storage), propose possible crisis measures (e.g. stock, demand restraint) and to determine essential users. The NOB has three stages of operations in a crisis:
• The Monitoring Phase: to monitor market developments and update information required for the implementation of crisis measures;
• The Active Phase: to propose measures to the Council of Ministers; and • The Operational Phase: Implementation of measures and communication with other
international bodies i.e. Benelux, EU, IEA, and NATO.
2.4 Stocks Stockholding Structure Until 2007, Belgium relied entirely on its domestic oil industry to meet its IEA stockholding obligation. This was done by placing a minimum stockholding obligation on oil importers which was based on EU regulations regarding the three main product categories (gasoline, middle distillates and fuel oil). All refiners and importers were obliged to hold quantities of oil products and crude oil such that the aggregate fully met 90 days of domestic consumption. All the quantities in domestic facilities were commingled with operational stocks; significant volumes were held abroad under a number of bilateral arrangements.

10
In January 2006 Belgium passed legislation (the Law of 26 January 2006) which created the public stockholding entity, Agence de Pétrole (APETRA), and established a schedule for shifting stockholding responsibilities from industry to the public agency. APETRA is managed by a board of directors which consists of three representatives from industry, three representatives from the public sector, a chairman and a Government Commissioner. The agency is financed through a levy on all industry participants delivering oil on the domestic market. The amount of the levy is calculated each quarter by the General Directorate for Energy within the Ministry, and the level varies according to the product category. The levy is included in the final price to consumers, as part of the ‘Contrat de Programme’. APETRA’s first year of operation began on the 1st April 2007. As of this date, the obligation on industry1 was reduced from covering the full stockholding obligation to only 15 days. The remainder of the national stockholding obligation became the responsibility of APETRA. The portion of the stockholding obligation attributed to industry is to be reduced each year by three days, until 1st April 2012, at which time APETRA becomes fully responsible for meeting Belgium’s national stockholding obligation. Crude or Products Under the new legislation, oil companies and importers must hold their compulsory stock obligations as finished products or blended stocks. APETRA may hold its share of compulsory stocks as either refined products or crude oil. The legislation limits the amount of crude oil held by APETRA to 50% of all owned stocks. In the case of holding crude oil, APETRA must use product yields approved by the Directorate General for Energy within the relevant ministry. Also, if APETRA purchases crude oil towards its stock obligation, it must fix both refining yields and refining costs for that crude with a Belgium refinery that will process the crude in the event of an emergency stockdraw. Location and Availability
APETRA may fulfil its stockholding responsibilities through oil stocks it directly owns (purchased by tender) or by obtaining stockholding (ticket) contracts with industry, either domestically or abroad under bilateral agreements. APETRA stocks may be held by both Belgian and foreign oil companies and retained within their normal operating systems. Up to a maximum of 30% can be kept abroad under bilateral
1 The obligation applies to larger oil companies (quantities delivered to the domestic market above 100 000 tonnes/year per product category).
Total Emergency Reserves by Type, 2009
Crude Component
37%
Product Component
63%
Source: Monthly Oil Statistics, IEA
Total Emergency Reserves by Location, 2009 Industry abroad
8%
Industry domestic
40%
Public domestic
23%
Public abroad
29%
Source: Monthly Oil Statistics, IEA

BELGIUM
11
agreements2. Belgium has such agreements with France, Germany, Ireland, Luxembourg, the Netherlands and the United Kingdom. The 30% maximum amount of APETRA stocks abroad can be altered by the Minister of Energy if there are insufficient tickets available in Belgium, or if the price of tickets in Belgium is higher than the contribution paid by Belgian industry through the levy. During the transition period, the remaining obligation on industry must be met through stocks held domestically; companies may not hold stocks abroad or use stockholding ticket arrangements with other companies to meet their stockholding obligation.3 APETRA is authorised to hold stocks on behalf of any operator not able to meet its individual obligation. In such cases, the operator pays a service fee to APETRA. Stocks held in storage at the beginning of the RAPL pipeline in Rotterdam do not fall under the limitations put on stocks held abroad (neither for industry nor for APETRA’s limit of 30% held outside of Belgium), as these volumes are considered part of Belgium’s logistical supply. Monitoring and Non-compliance APETRA, oil companies and large consumers incurring a compulsory stocks obligation must inform the Energy Directorate for Energy of Ministry of Economic Affairs and Energy of the location and composition of their stocks. This information must be reported by the 15th of each month, describing stocks held at the beginning of that month. The minister may authorise physical checks to ensure full compliance with all the provisions of the legislation. Penalties for infringements (including those relating to monthly reports, failure to pay levies to APETRA, or a shortfall in compulsory stock obligations) range from fines to imprisonment for up to one year. All of APETRA’s operations are subject to direct control by the Ministry of Energy. One member of the APETRA Board is a government commissioner appointed by the King on the recommendation of the Minister for Energy. Stock Drawdown and Timeframe In the event of an oil supply disruption, the Minister of Energy has the legal authority to draw down oil stocks. The Minster would direct APETRA to drawdown its emergency stocks. APETRA has put in place agreements with a number of refineries, referred to as the Crude Against Product Agreement (CAPA). In times of crisis, this allows the simultaneous sale of crude oil from APETRA and the purchase of products by APETRA. CAPA covers the whole process from the sale of the crude to the delivery of product at a designated depot. Within the contract for delivery, products would be delivered within 10 days and not later than 30 days from the time of the crude delivery to the refinery. In the case of APETRA-owned stocks, the storage contracts stipulate that the delivery of these stocks must begin within 24 hours of a request by APETRA, and that the totality of the stocks must be delivered within 30 days. Ticket contracts with APETRA specify that delivery of finished product must be guaranteed within 30 days (if ticketing on crude oil) and 7 days for tickets on product.
2 The 30% limit does not apply to crude oil owned by APETRA and stored under ground (caverns).
3 This does not, however, preclude industry in Belgium from providing tickets to companies in other countries that have a stockholding obligation with their respective host country.

12
Financing and Fees APETRA’s activities are financed through fees levied on all quantities of the relevant products delivered into domestic consumption. Every oil company that pays excise and national taxes on oil products must also pay levy fees to APETRA. The base calculation for the APERTA fees, which has been decided by the government and promulgated by Royal decree, reflects several cost factors such as renting or writing off stockholding capacity, renewing the product, the external and internal control of the stocks, and the interest paid on bank loans. The Belgian government does not provide financial support to industry for holding minimum reserves. APETRA finances its own purchases of crude/products through bank loans. 3. Other Measures 3.1 Demand Restraint Belgium does not have a specific contingency plan to implement demand restraint measures in a disruption, but has at its disposal a number of dormant decrees which the Minister of Energy could activate after deliberation by the Council of Ministers. Possible measures include:
• speed limits, • driving restrictions (e.g. bans on Sundays, pair- or impair number plates) or complete driving
ban, • rationing of distribution of fuel oil, • rationing of the distribution of motor oil, and • restriction of exportation of certain oil products.
There are no volumetric estimates for each of the separate demand restraint measures, but the total impact of all measures is estimated to be less than 5% of total oil consumption. The NOB has compiled a crisis management manual that includes updated lists of the priority end-users of petroleum products. These lists serve as a reference for drawing up ministerial decrees regarding demand restraint measures that focus on specific products or consumer groups.
Oil Consumption by Sector4
0%
10%
20%
30%
40%
50%
60%
70%
80%
90%
100%
shar
e of
tota
l oil
cons
umpt
ion
Transformation/Energy
Residential
Commercial/Agriculture/Other
Industry
Transport
Source: Oil Information, IEA
4 Total Consumption (including refinery consumption), does not include international marine bunkers.
BELGIUM
13
3.2 Fuel Switching Fuel switching in Belgium is driven primarily by market prices and is not subject to any legal obligations. The use of oil has been declining in power generation. It accounts for less than 1% of power supply and is expected to be eliminated completely in the near future. Thus, there is little potential for fuel switching in the power sector.
3.3 Others
With no domestic crude oil production, surge production is not an available response measure.
4. Natural Gas
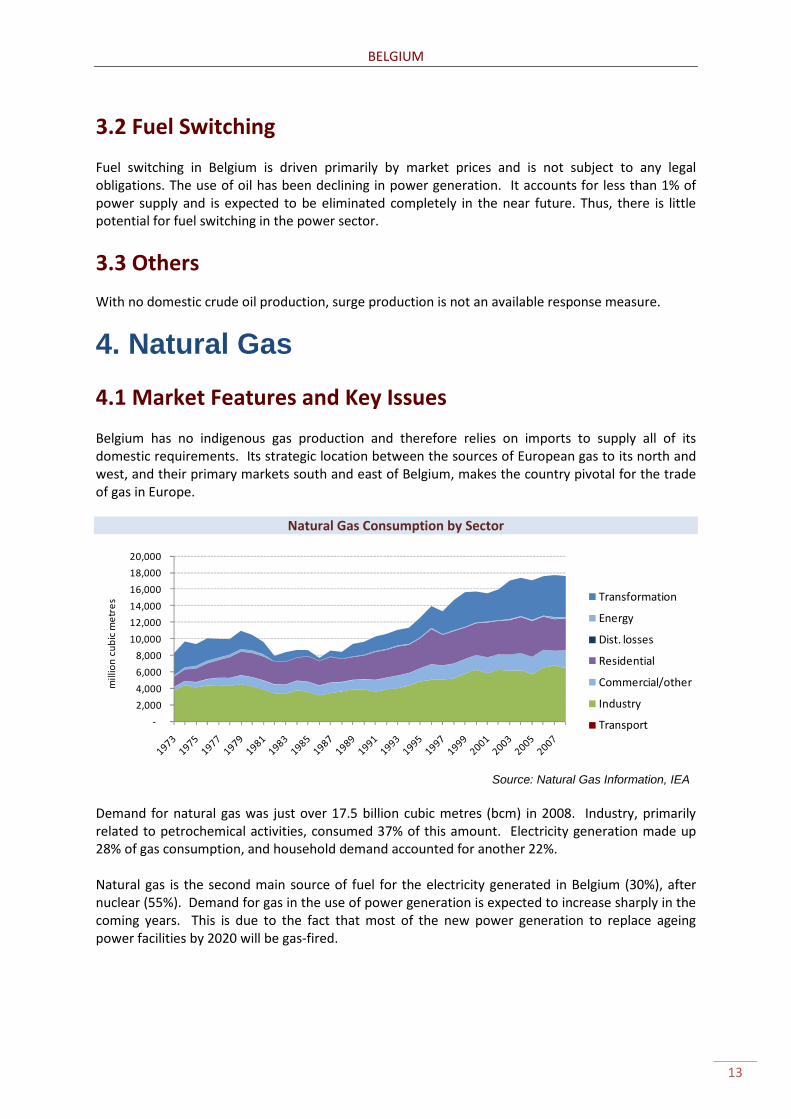
4.1 Market Features and Key Issues Belgium has no indigenous gas production and therefore relies on imports to supply all of its domestic requirements. Its strategic location between the sources of European gas to its north and west, and their primary markets south and east of Belgium, makes the country pivotal for the trade of gas in Europe.
Natural Gas Consumption by Sector
-
2,000
4,000
6,000
8,000
10,000
12,000
14,000
16,000
18,000
20,000
mill
ion
cubi
c m
etre
s Transformation
Energy
Dist. losses
Residential
Commercial/other
Industry
Transport
Source: Natural Gas Information, IEA
Demand for natural gas was just over 17.5 billion cubic metres (bcm) in 2008. Industry, primarily related to petrochemical activities, consumed 37% of this amount. Electricity generation made up 28% of gas consumption, and household demand accounted for another 22%. Natural gas is the second main source of fuel for the electricity generated in Belgium (30%), after nuclear (55%). Demand for gas in the use of power generation is expected to increase sharply in the coming years. This is due to the fact that most of the new power generation to replace ageing power facilities by 2020 will be gas-fired.

14
Natural Gas Imports, by Source
0
2000
4000
6000
8000
10000
12000
14000
16000
18000
20000m
illio
n cu
bic
met
res Other
Russia
Qatar
Algeria
United Kingdom
Norway
Netherlands
Source: Natural Gas Information, IEA
Imports are fairly diversified by origin and type of supply: The Netherlands and Norway, each representing about one-third of total imports, are the principle pipeline suppliers, while Qatar (18% of total imports) is the main sources of LNG imports. There are two qualities of natural gas in Belgium: H-gas (high-calorific) and L-gas (low-calorific). H-gas supplies most of the country’s demand, but L-gas is used by a quarter of the country’s consumers and supplies certain regions exclusively, including Antwerp, Limburg, Flemish Brabant, Walloon Brabant and Hainaut, and Brussels. L-gas is transported from the Dutch Slochteren field on a network that is physically separate from the H-gas network. Gas Company Operations In 2006 Fluxys was appointed by law as the only operator of the natural gas transmission grid and the natural gas storage facility. Fluxys LNG is the sole operator of the LNG facility at the Zeebrugge port. More than thirty authorization holders have the right to sell gas to customers who are connected to the natural gas transmission grid. Only five of the authorization holders operated in 2007, their share of the market was: Distrigaz 45.1%, Electrabel Customers Solutions 28.6%, Gaz de France 10.0%, SPE 6.5%, Wingas 6.0% and others 3.8%. The Belgian government has no ownership in the upstream/downstream but still has a golden share in the transmission system operator (Fluxys) and the major supply company (Distrigas).
4.2 Natural Gas Supply Infrastructure
Ports and Pipelines Fluxys, Belgium’s transmission system operator, has a network of 3 900 kilometres of pipelines with 18 interconnection points. This is used both to transport natural gas for consumption in Belgium (17.5 bcm) and for transit of some 80 bcm of gas to other end user markets. The Fluxys network delivers gas to power stations and large industrial end-users directly, and supplies the grids of 17 distribution system operators which deliver gas to residential and small- to medium-sized industrial users.

BELGIUM
15
The Natural Gas Grid
The Zeebrugge port has an LNG re-gasification facility with a capacity of 9 bcm per year. At the same time, Zeebrugge serves as a crossroads of two major axes in European natural gas flows, as both the Zeepipe terminal (natural gas coming from Norway) and the Interconnector terminal (natural gas coming from /or going to the United Kingdom) are situated in the harbour zone. This allows the flow of gas on the east/west axis from Russia to the United Kingdom and the north/south axis from Norway to Southern Europe. Zeebrugge also has a key commercial role in the natural gas trade as one of Europe’s leading international spot markets for natural gas. More than 76 members are active on the hub and approximately 62 bcm of natural gas was traded on the hub in 2009, equivalent to 3.5 times the annual consumption rate for the Belgian market. The transit of gas through Belgium is via the major two-way high-pressure pipeline systems connecting Belgium to its neighbours. The VTN-RTR pipeline runs from west to east linking the United Kingdom with Germany. Lines also run from east to south linking the North Sea and United Kingdom to France and from north to south, linking The Netherlands with France.

16
Storage There are three sites in which H-gas is stored in Belgium. An aquifer in Loenhout is used to compensate for seasonal swings in purchase contracts and is the only facility exclusively destined for storage. Capacity at Loenhout is expected to be expanded to 700 mcm in 2011. Short-term storage is available at Zeebrugge and also by transporting LNG by truck to a storage site in Dudzele, which is used as a peak-shaving facility.
Natural Gas Storage Capacity (H-gas, June 2009)
Location TypeWorking capacity
(mcm) 1
Peak output (mcm/day) 2
Loenhout Underground 625 12Dudzele Tank 59 12Zeebrugge LNG 228
Total 912 24
(1) Working gas capacity= total gas storage minus cushion gas
(2) Peak output= the maximum rate at which gas can withdrawn from storage Source: Belgian Administration
There is no storage for L-gas in Belgium. The Slochteren field itself is used to compensate for the lack of low gas storage through the use of flexible long-term contracts with The Netherlands.
4.3 Emergency Policy for Natural Gas The Administration does not have a specific emergency response policy for natural gas. It relies on the TSO Fluxys to safeguard natural gas supplies. Fluxys is given the responsibility for maintaining crisis mechanisms through a Royal Decree on public service obligations related to natural gas (23 October 2002). This includes the requirement to have an emergency plan and back-up plan, to be updated every 2 years. It also includes a code of conduct which contains a range of operational and administrative guidelines for users of the gas network. Fluxys maintains an emergency plan for ensuring the integrity of its grid (maintaining line pressure and gas quality). In the case of significant loss of gas supply, the TSO looks to balance the network by shifting gas through its various entry points. In doing this, it maintains an “interruption plan” for cutting supply to end users for short periods of time. Fluxys estimates it is able to compensate for the full loss of gas through its largest entry point for the duration of six hours, during which time the affected shippers should reallocate their supplies through alternative entry points or take other measures to compensate for the loss. In case the shippers are unable to react adequately during that period, Fluxys would begin cutting off supplies to specific end-users based on interruption hierarchy that takes into account safety and alternative sources. This begins with power plants, then industry users. The federal regulator CREG monitors the natural gas market and has powers to approve transportation and distribution tariffs and other regulated assets. Thus, any plans of Fluxys to increase capacity for dealing with supply disruptions would have to be approved by CREG in order to pass on costs through increased tariffs. Regional regulators (VREG of Flanders, CWaPE of Wallonia and Brugel f Brussels-Capital) also have legal powers to monitor the distribution of natural gas and ensure compliance with regional public service obligations.

BELGIUM
17
Strategic Gas Stocks and Drawdown There is no strategic storage of natural gas in Belgium; all gas stocks in Belgium are held by industry for commercial purposes. Demand Restraint There is no demand restraint program in place in Belgium in order to rapidly reduce gas use in the short term, during a gas supply disruption. Fuel Switching There is no program in place in Belgium in order to encourage or otherwise require users of gas to switch to other fuel sources in the event of a gas supply disruption.

INTERNATIONAL ENERGY AGENCY
The International Energy Agency (IEA), an autonomous agency, was established in November 1974. Its mandate is two-fold: to promote energy security amongst its member countries through collective response to physical disruptions in oil supply and to advise member
countries on sound energy policy.
The IEA carries out a comprehensive programme of energy co-operation among 28 advanced economies, each of which is obliged to hold oil stocks equivalent to 90 days of its net imports. The Agency aims to:
n Secure member countries’ access to reliable and ample supplies of all forms of energy; in particular, through maintaining effective emergency response capabilities in case of oil supply disruptions.
n Promote sustainable energy policies that spur economic growth and environmental protection in a global context – particularly in terms of reducing greenhouse-gas emissions that contribute to climate change.
n Improve transparency of international markets through collection and analysis of energy data.
n Support global collaboration on energy technology to secure future energy supplies and mitigate their environmental impact, including through improved energy
efficiency and development and deployment of low-carbon technologies.
n Find solutions to global energy challenges through engagement and dialogue with non-member countries, industry,
international organisations and other stakeholders. IEA member countries:
Australia Austria
Belgium Canada
Czech RepublicDenmark
Finland France
GermanyGreece
HungaryIreland
ItalyJapan
Korea (Republic of)LuxembourgNetherlandsNew Zealand NorwayPolandPortugalSlovak RepublicSpainSwedenSwitzerland
TurkeyUnited Kingdom
United States
The European Commission also participates in
the work of the IEA.
Please note that this publication is subject to specific restrictions that limit its use and distribution.
The terms and conditions are available online at www.iea.org/about/copyright.asp
© OECD/IEA, 2010International Energy Agency
9 rue de la Fédération 75739 Paris Cedex 15, France