Oil and Gas Freight Transportation Alternatives · Oil and Gas Freight Transportation Alternatives...
55
Oil and Gas Freight Transportation Alternatives Final Report PRC 15-50 F
Transcript of Oil and Gas Freight Transportation Alternatives · Oil and Gas Freight Transportation Alternatives...

Oil and Gas Freight
Transportation Alternatives
Final Report
PRC 15-50 F

2
Oil and Gas Freight Transportation Alternatives
Texas A&M Transportation Institute
PRC 15-50 F
November 2016
Authors
Allan Rutter
Curtis Morgan
Jeff Warner
Copies of this publication have been deposited with the Texas State Library in compliance with the
State Depository Law, Texas Government Code §441.101-106.

3
Table of Contents
List of Figures ............................................................................................................. 4
List of Tables .............................................................................................................. 4
Executive Summary ................................................................................................... 5
Freight Railroads and Pipelines ................................................................................ 5
Public-Sector Energy Development Responses ....................................................... 6
Private-Sector Oil and Gas Improvements in Rail and Pipeline Networks .............. 8
State Policy Implications .......................................................................................... 8
Chapter 1. Introduction and Background ............................................................. 10
Oil and Gas Drilling Activity in Texas .................................................................. 10
Oil and Gas Energy Production Activity Clusters in Texas ................................... 11
Chapter 2. Modal Alternatives for Oil and Gas Freight ...................................... 14
Highway ................................................................................................................. 15
Effectiveness ................................................................................................................................ 15 Current Capacity .......................................................................................................................... 15
Rail ......................................................................................................................... 16
Effectiveness ................................................................................................................................ 16 Current Capacity .......................................................................................................................... 17 Texas Abandoned Railroads ........................................................................................................ 21
Pipelines ................................................................................................................. 22
Effectiveness ................................................................................................................................ 23 Current Texas Pipeline Capacity and Routing ............................................................................. 24
Chapter 3. Public-Sector Energy Development Efforts ....................................... 25
State Congestion and Safety Responses ................................................................. 25
State Funding Programs for Energy Development Areas ...................................... 27
Public Involvement in Rail Infrastructure Investment ........................................... 30
Rural Rail Transportation Districts ........................................................................ 33
Chapter 4. Private-Sector Oil and Gas Rail and Pipeline System
Improvements ................................................................................................... 36
Recent Private-Sector Rail Infrastructure Development ........................................ 36
Rail Construction and Development in the Eagle Ford Shale Play ............................................. 36 Rail Construction and Development in the Permian Basin Region ............................................. 42
Pipelines ................................................................................................................. 43
Chapter 5. State Policy Implications ...................................................................... 47
References ................................................................................................................. 51

4
List of Figures
Figure 1. Location of Oil and Gas Wells in Relation to Rail Infrastructure. ...................... 6
Figure 2. Contiguous U.S. State Shale Plays. ................................................................... 12
Figure 3. Texas Oil Production by County in 2013. ......................................................... 13
Figure 4. Texas Freight Rail Network. ............................................................................. 18
Figure 5. Location of Oil and Gas Wells in Relation to Rail Infrastructure. .................... 20
Figure 6. Location of Oil and Gas Wells in Relation to Rail Infrastructure. .................... 21
Figure 7. Comprehensive View of Abandoned Rail Lines in Texas. ............................... 22
Figure 8. Colorado Oil and Gas Severance Tax Distribution. .......................................... 28
Figure 9. Oil and Gas Gross Production Tax Allocation in North Dakota in Fiscal
Year 2012. .................................................................................................................. 29
Figure 10. States with Rail-Eligible Programs. ................................................................ 31
Figure 11. States with Rail-Specific Programs. ................................................................ 32
Figure 12. Types of Funding and State Administering Agencies. .................................... 32
Figure 13. Location of Rural Rail Transportation Districts in Relation to Rail Lines
and Oil and Gas Well Activity in Texas. ................................................................... 34
Figure 14. Mission Rail Park Location Map. .................................................................... 36
Figure 15. Alamo Junction Rail Park Aerial Photo and Site Plan. ................................... 38
Figure 16. Gardendale Railroad 2010 “Before” Conditions. ............................................ 40
Figure 17. Gardendale Railroad Phase 2........................................................................... 40
Figure 18. Live Oak Railroad Site Plan. ........................................................................... 41
Figure 19. TxDOT Map of the South Orient Rail Line (2010). ........................................ 42
Figure 20. TXPF Annual Carloads in 2002–2013. ........................................................... 43
Figure 21. Texas Natural Gas Pipeline Capacity Measurement. ...................................... 45
List of Tables
Table 1. Modal Comparison Table. .................................................................................. 14
Table 2. Texas Key Rail Indicators for 2012. ................................................................... 19
Table 3. Safety Strategies Used and Rated Effectiveness................................................. 26
Table 4. Strategies to Address Observed Congestion Issues. ........................................... 27
Table 5. Texas Pipeline Mileage. ...................................................................................... 44
Table 6. Texas Pipeline Construction Projects in Progress. ............................................. 46

5
Executive Summary
Editor’s Note: At the time of this writing (fall 2016), oil prices are rising from recent lows. The
effect of the price drop has been to reduce oilfield activity and limit, but not eliminate, additional
damage being done to energy-impacted roads. Experience and observation suggest that prices
may again rise to a point that repeats the magnitude of damage seen in the period leading up to
this report.
After 2007, the application of hydraulic fracturing (or fracking) and horizontal drilling
techniques led to rapid new development in the oil and natural gas (O&G) industries in many
areas of Texas and in other shale formation areas across the United States. Between 2007 and
2014, an increasing demand for O&G products in a favorable market (high prices for Texas
O&G products with favorable marginal prices compared to worldwide benchmarks) resulted in
dramatically increased drilling activity and associated freight traffic on Texas roadways in
energy production areas moving drilling equipment, fracking sand, water, and other energy-
development-related freight.
The Texas A&M Transportation Institute (TTI), in Texas Department of Transportation
(TxDOT)–sponsored research and in Transportation Policy Research Center (PRC) reports, has
offered a thorough background on the recent O&G drilling activity in Texas and the effects of
that activity on the condition and use of state and local roadway infrastructure. The policy project
discussed in this report examined potential options regarding the use of rail and pipeline
infrastructure to address the growing costs of roadway rehabilitation in the energy production
areas of Texas.
Freight Railroads and Pipelines
Despite the recent downturn in O&G prices, energy development in its various forms (e.g., oil,
coal, natural gas, and related products) is expected to remain a key driver of future demand on
the multimodal Texas transportation system (e.g., rail, truck, and pipeline) and, in the long run,
increase its maintenance and operating costs. Throughout the recent energy boom, private rail
and pipeline companies have independently and collectively improved and extended networks or
built expanded rail yards or pipeline collection hubs at the closest points on their network to
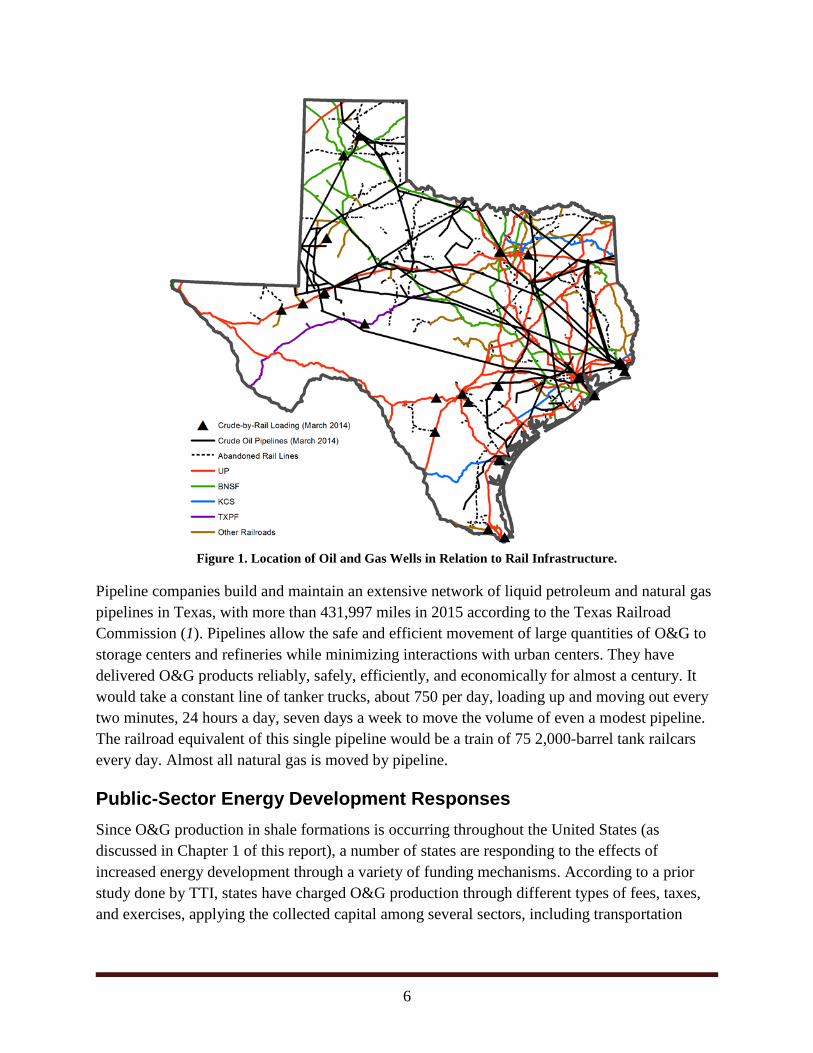
energy production areas. Figure 1 is a map of freight railroads, pipelines, and major transloading
facilities that move crude oil in railroad tank cars.
Freight railroads, large and small, offer O&G producers access to equipment and supplies used in
drilling and fracking, including pipe, fracking sand, chemicals, and cement. Railroads can also
transport crude oil and petroleum by-products in production regions not served by pipelines.
These transportation services can be provided within the existing freight railroad network,
through expansion of third-party transloading facilities along the rail network, or through
expansion of rail capacity or new rail lines.
6
Figure 1. Location of Oil and Gas Wells in Relation to Rail Infrastructure.
Pipeline companies build and maintain an extensive network of liquid petroleum and natural gas
pipelines in Texas, with more than 431,997 miles in 2015 according to the Texas Railroad
Commission (1). Pipelines allow the safe and efficient movement of large quantities of O&G to
storage centers and refineries while minimizing interactions with urban centers. They have
delivered O&G products reliably, safely, efficiently, and economically for almost a century. It
would take a constant line of tanker trucks, about 750 per day, loading up and moving out every
two minutes, 24 hours a day, seven days a week to move the volume of even a modest pipeline.
The railroad equivalent of this single pipeline would be a train of 75 2,000-barrel tank railcars
every day. Almost all natural gas is moved by pipeline.
Public-Sector Energy Development Responses
Since O&G production in shale formations is occurring throughout the United States (as
discussed in Chapter 1 of this report), a number of states are responding to the effects of
increased energy development through a variety of funding mechanisms. According to a prior
study done by TTI, states have charged O&G production through different types of fees, taxes,
and exercises, applying the collected capital among several sectors, including transportation

7
programs. The study reveals that these taxes have aided in matching needed funds in the
transportation area in important producer states (2).
In Texas, O&G production is charged on severance taxes according to the market value of the
product (7.5 percent for gas and 4.6 percent for O&G condensate). The allocation of budget
relies on the Economic Stabilization Fund needs, as determined by House Bill 1
(83rd Legislature) approved in November 2014. From the total of O&G severance taxes,
37.5 percent is designated to the Environmental Response Fund, and the remainder is allocated to
the State Highway Fund, aiming to fund unmet financial needs in the transportation sector.
Fifteen percent of the revenue allocated to the State Highway Fund is statutory, allocated to road
construction and maintenance related to O&G activities.
Other states have O&G-related funding programs, such as the following:
The Colorado O&G severance tax allocates funds for state and local transportation
projects.
West Virginia allocates $24 million in O&G severance taxes for infrastructure debt
amortization. West Virginia also requires well operators to post revenue bonds with the
state in anticipation of damage to state and local roads.
North Dakota allocates O&G severance taxes into a state Oil Impact Fund and to
producing counties for transportation projects.
Pennsylvania distributes revenues from its unconventional gas well fees to fund rail
freight assistance grants and to fund bridge repairs in producing counties. Pennsylvania
also requires oversize/overweight oilfield motor carriers to execute excess maintenance
agreements for use of state and local roads.
A number of states also maintain grant programs that offer funding for rail infrastructure
improvements. Thirty-three states have programs that fund rail spur lines or industrial leads (rail
connections from mainline track to industrial facilities), and nine state programs support
economic development activities that can include rail improvements.
Texas has also authorized rural rail transportation districts (RRTDs), subdivisions of the Texas
state government created at the county level. RRTDs have the authority to purchase, operate,
and/or build new railroad and intermodal facilities; the right of eminent domain; and the ability
to issue bonds based on projected revenues that may be generated by the rail improvements. As
of June 2013, 42 RRTDs have been identified as being officially formed in Texas, with 95 of the
state’s 254 counties participating in at least one RRTD. Counties forming RRTDs generally do
so to preserve rail access or prevent abandonment of the rail lines, foster local economic
development through short-line rail access, or improve passenger rail service.

8
Private-Sector Oil and Gas Improvements in Rail and Pipeline
Networks
This project also gathered illustrative examples of new rail facilities funded and constructed by
the private sector in O&G production areas. Dozens of new pipelines are under construction in
Texas, and many more have been built during the last decade. Examples of rail-served facilities
include the following:
Mission Rail Park in San Antonio, along Union Pacific (UP), offers storage and
transloading of crude oil and hazardous materials, fracking sand, and other commodities.
Alamo Junction Rail Park in San Antonio, served by Burlington Northern Santa Fe
(BNSF) Railway and UP, offers railcar handling, storage, and switching.
Gardendale Railroad in La Salle County reconstituted 29 miles of abandoned track into
Crystal City and offers railcar storage and transloading of fracking sand, pipe, and crude
oil.
Live Oak Railroad between Three Rivers and George West in Live Oak County offers
connections to UP and four pipelines at the facility.
Texas Pacifico Transportation, the railroad operator on the state-owned South Orient Rail
Line between Coleman and Presidio, has seen extensive traffic growth with O&G
production.
The BNSF Logistics Center in Sweetwater offers unit train terminals for sand,
agricultural commodities, and aggregates that serve the Permian Basin fields.
State Policy Implications
While increased O&G drilling and production activity creates significant benefits for the state’s
economy, particularly in spreading job and income growth into rural areas outside the Texas
Triangle, this O&G activity increases truck activity, which then affects infrastructure conditions
and commercial motor vehicle safety. These effects in turn have real monetary costs for the state.
The private sector is already responding to the new energy development business opportunities
by expanding pipeline capacity and offering more rail transloading facilities, as described in
Chapter 4 of this report. Both the expansion of pipelines (particularly pipelines that collect O&G
from wells, pipelines that transport liquids and gas to injection wells, and pipelines that distribute
water to wells) and the addition of new rail lines and facilities to serve O&G production areas
may reduce commercial motor vehicle mileage and the associated public costs. Some of these
new rail facilities are being developed with the participation of local economic development
corporations and other public investments.
9
Texas O&G severance taxes are now being allocated into the State Highway Fund as a result of
Proposition 1 adopted in 2013, but these funds appropriated for energy development areas are
limited to state highways. Texas may wish to consider the capitalization of a new multimodal
State Infrastructure Bank—a revolving loan fund to leverage private investments in rail, pipeline,
and port infrastructure projects that can reduce energy-development-related truck trips.

10
Chapter 1. Introduction and Background
The policy project discussed in this report examined potential options regarding the use of rail
and pipeline infrastructure to address the growing costs of roadway rehabilitation in the energy
production areas of Texas. This project studied whether offering state incentives for expansion of
rail or pipeline infrastructure along with roadway improvements might be an effective approach
to address the increased freight transport needs of energy development and subsequently provide
longer-term economic development opportunities in Texas shale energy regions. Specific rail and
pipeline improvements have the potential to divert some heavy-truck traffic from energy
production area roadways and thereby decrease roadway rehabilitation costs and increase traffic
safety for roadway users on state and local roads.
Oil and Gas Drilling Activity in Texas
After 2007, the application of hydraulic fracturing (or fracking) and horizontal drilling
techniques led to rapid new development in the O&G industries in many areas of Texas and in
other shale formation areas across the United States. Between 2007 and 2014, an increasing
demand for O&G products in a favorable market (high prices for Texas O&G products with
favorable marginal prices compared to worldwide benchmarks) resulted in dramatically
increased drilling activity and associated freight traffic on Texas roadways in energy production
areas moving drilling equipment, fracking sand, water, and other energy-development-related
freight. By late 2014, the Texas O&G industry was producing 31 percent of the natural gas
consumed in the United States and accounted for 45 percent of total U.S. crude oil production
(3). At that time, more than 15 million Americans lived within a mile of an oil or gas well—with
6 million of those located in Texas.
TTI, in TxDOT-sponsored research and in PRC reports, offers a thorough background on the
recent O&G drilling activity in Texas and the effects of that activity on the condition and use of
state and local roadway infrastructure. Because those reports offer both a valuable historical
overview of the implementation of fracking and horizontal drilling in Texas and a detailed
assessment of how this energy development activity affects state and county roads, that
information will not be replicated in this report. Additional background can be found in the
following TTI reports:
Energy Developments and the Transportation Infrastructure in Texas: Impacts and
Strategies (4).
“Work Order 24: Estimation of Additional Investment Needed to Support Energy
Industry Activity in Texas,” in TxDOT Administration Research: Tasks Completed
FY 2012 (5).
Oil and Gas Energy Developments and Changes in Pavement Conditions in Texas (6).
Oil and Gas Energy Developments and Changes in Crash Trends in Texas (7).

11
Despite the recent downturn in O&G prices, energy development in its various forms (e.g., oil,
coal, natural gas, and related products) is expected to remain a key driver of future demand on
the multimodal Texas transportation system (e.g., rail, truck, and pipeline) and, in the long run,
increase its maintenance and operating costs. TxDOT has partnered with the Texas Legislature to
seek new funding sources to address the acute needs for improved roadways in production areas,
authorizing and getting voter approval for two separate funding propositions to address energy-
sector needs following the 2013 and 2015 legislative sessions; however, the increased funding
provided by these propositions still falls short of identified needs.
Throughout the recent energy boom, private rail and pipeline companies have independently and
collectively improved and extended networks or built expanded rail yards or pipeline collection
hubs at the closest points on their network to energy production areas. Unfortunately, new rail
capacity improvements have not grown quickly enough to slow the growth of truck traffic on
rural roadways servicing wells with sand, drilling equipment, and water. In fact, many distant rail
yard/pipeline hub facilities can act as truck traffic generators from which truck-to-well
operations originate to service an expanse of well sites. Unfortunately, several abandoned former
rail lines within current energy production areas have been lost over the past 3.5 decades since
rail deregulation, and existing pipeline infrastructure is only now being built to serve many of
these now-economical energy production areas of the state.
Oil and Gas Energy Production Activity Clusters in Texas
Texas is home to several O&G shale plays including some of the most significant nationwide.
Figure 2 shows that the energy production activity in the state extends to areas beyond just the
Eagle Ford Shale Play and Permian Basin, although these two are the most well known. In
September 2014, Texas accounted for 897 active rigs of the 3,683 active oil rigs worldwide—
nearly 25 percent of the oil rigs around the globe (8, 9). Texas led the United States with
46 percent of active oil rigs at that time. Each of the state’s shale plays within a larger petroleum
basin area has varying regional characteristics of the depth of the formation and the type of oil or
gas products produced.
In Texas, the major basins and their associated shale plays include:
Anadarko Basin—Granite Wash and the Cleveland Formation.
East Texas Basin—Bossier, Cotton Valley, and Haynesville-Bossier.
Fort Worth Basin—Barnett.
Western Gulf Coast Basin—Eagle Ford and Pearsall.
Permian Basin—Avalon, Bone Spring, Cline, Spraberry, Yates, Yeso, and Wolfcamp.
Palo Duro Basin—Bend.

12
Source: (10).
Figure 2. Contiguous U.S. State Shale Plays.
Some of the listed Texas shale plays have active production, while others are relatively
untouched—awaiting future energy development once market prices rise. The TTI energy
development reports listed previously focus on the three shale plays with the greatest drilling
activity: Barnett, Permian, and Eagle Ford.
According to a 2014 U.S. Energy Information Administration (EIA) study, the six basins in
Texas represented 90 percent of the growth in O&G production in the United States. The
objective of the 2014 study was to measure the growth and impact that the O&G industry may
have on residents near production areas. The EIA study focused on the impact of the drilling
operations in the Permian Basin, which is classified as one of the O&G basins with the highest
production growth rates in Texas. The research focused on only 10 of the basin’s counties:
Fisher, Glasscock, Howard, Irion, Martin, Mitchell, Nolan, Reagan, Scurry, and Sterling.
Findings included an expected total impact for the year 2022 of $20 billion in the moderate
scenario, creation of 30,540 jobs, and revenues of $664 million for the local governments and
$701 million for the state government at the time the report was completed (11).
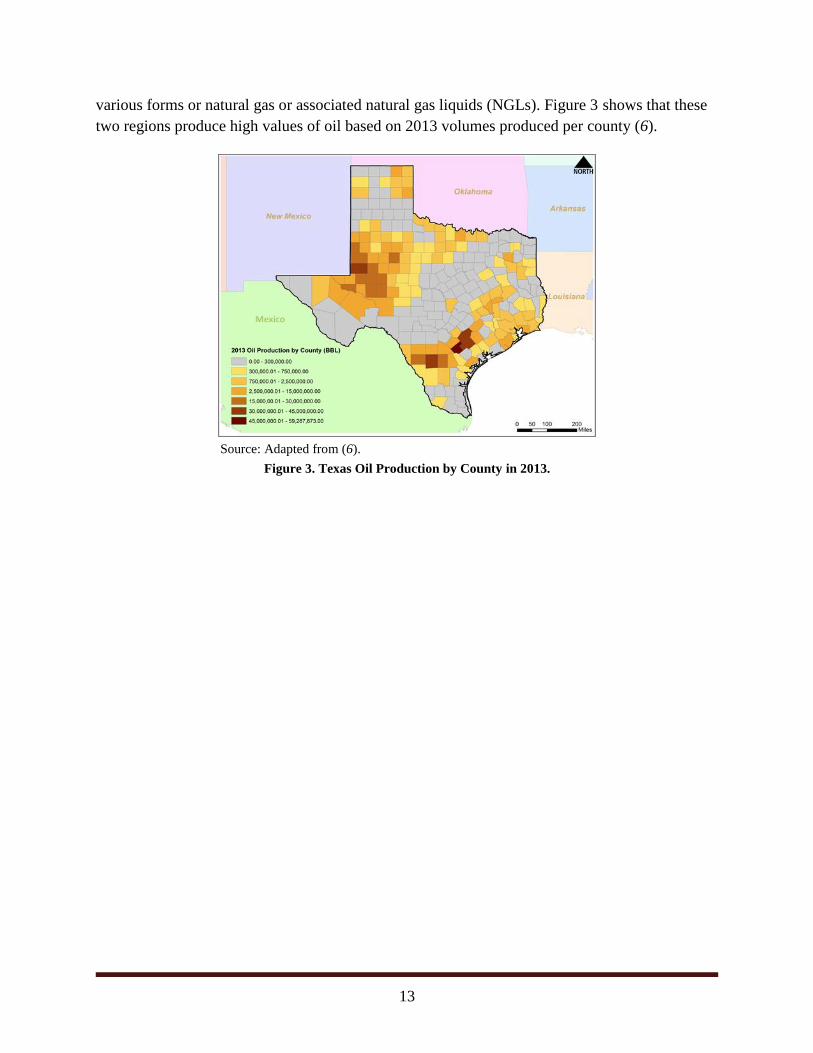
The Permian Basin region and Eagle Ford Shale region are the highest oil-producing regions in
the state, while the other basin areas, though producing some oil, primarily produce either
13
various forms or natural gas or associated natural gas liquids (NGLs). Figure 3 shows that these
two regions produce high values of oil based on 2013 volumes produced per county (6).
Source: Adapted from (6).
Figure 3. Texas Oil Production by County in 2013.

14
Chapter 2. Modal Alternatives for Oil and Gas Freight
This chapter describes the transportation alternatives and the effectiveness of each mode (i.e.,
truck, rail, and pipeline) to handle freight related to Texas shale O&G exploration. Table 1 gives
an overview of advantages, disadvantages, benefits, and implementation hurdles associated with
the use of highway, rail, and pipeline modes to serve O&G industry freight needs.
Table 1. Modal Comparison Table.
Mode Modal Advantages Modal Disadvantages Modal Benefits Implementation
Hurdles
Highway Flexibility for short- or long-distance transportation
Direct access to well sites
Easy movement of specialty equipment
Certain cities have restrictions on truck dimensions and weights
Operations and maintenance costs related to heavy loads are higher compared to rail and pipeline
Increased road maintenance and repair
Roadside management/ inspection
Limited available funding sources for reconstruction and rehabilitation of rural roadways
Hazardous materials involved in highway accidents
Rail Flexibility to transport where pipeline is unable
Shorter contracts than pipelines
Faster movement than pipelines
Able to bring supplies and carry commodities closer to drilling operations—reduces truck trip length
Faster but less dependable than pipeline
Cannot directly connect all drill sites
Able to provide services not possible with pipeline and cheaper than truck
Continued expansion and development of rail parks located adjacent to or within the O&G exploration areas
Potential restoration of abandoned rail lines
Pipelines that are adjusting and realigning network in Texas to capture crude from Texas fields
New safety regulations that limit crude-by-rail speeds
Negative public opinion
Pipeline Safe and efficient movement of large quantities of O&G products
Cost-effective transportation of large quantities of liquid freight products
500,000 miles of U.S. pipeline network
Speed of movement
Flexibility of movement
Slow response in case of pipeline damage
Potential flexibility to expand in the future
Eliminates additional transportation cost
Flexibility to connect from origin to destination
Nearby fire or explosion that can impact the pipeline system
Potential for vandalism/ disturbance of O&G flow
Negative public opinion

15
Highway
Effectiveness
The drilling of new O&G wells calls for the movement of heavy equipment to transport fracking
sands, water, and other supplies to rural locations with roads and bridges unequipped for heavy
traffic. While the highway system tends to offer flexible short- and long-distance transportation,
direct access to drill sites, flexible transportation schedules, and easy movement of specialty
equipment, the energy sector is placing significant financial and operational demands on state
and local transportation systems (12).
An oil or gas well’s development typically takes more than 20 days to construct and about three
months to drill (13). A previous study conducted by TTI provided an estimate of the average
daily truck traffic of approximately 27 truck arrivals per day during a well’s construction phase.
This development results in a total two-way traffic estimate of 1,054 truck trips per well during
construction. Flatbed trucks move drilling rigs to the site; gravel trucks supply materials for the
construction of site access roads; and tankers deliver cement, sand, mud, and water to the site
and take waste water from the site (14). Rural roads and bridges were designed to provide land
access for agricultural uses, not to withstand such high traffic levels or heavy loadings.
Transportation agencies are challenged to address the increased damages resulting from energy-
development-related traffic (12). Cooperative relationships between individual counties and
TxDOT have been developed as one means to maintain roadways through the energy
development period (14).
Current Capacity
TxDOT maintains over 80,260 centerline miles of roadway, with almost 41,000 centerline miles
being farm-to-market system roads and spurs (15). Numerous segments of Texas’s transportation
system are experiencing deterioration and congestion, lack some desirable safety features, and do
not have adequate capacity to provide reliable mobility, creating challenges for Texas’s
residents, visitors, businesses, and state and local governments (16).
From 1990 to 2013, Texas’s population increased by 55 percent, from approximately 17 million
to approximately 26.4 million. Texas’s population is expected to increase to 45 million by 2040.
From 1990 to 2015, annual vehicle miles of travel (VMT) in the state increased by 50 percent,
from approximately 162.2 billion VMT to 243 billion VMT. Based on travel and population
trends, the Road Information Program estimates that vehicle travel in Texas will increase another
25 percent by 2030, reaching approximately 304 billion VMT (16).
According to 2013 numbers, $1.167 billion in goods is shipped from sites in Texas, and another
$1.246 billion in goods is shipped to sites in Texas, mostly by trucks. Sixty percent of the goods
shipped annually from sites in Texas are carried by trucks, and another 9 percent are carried by
parcel, U.S. Postal Service, or courier services, which use trucks for part of their deliveries (16).
16
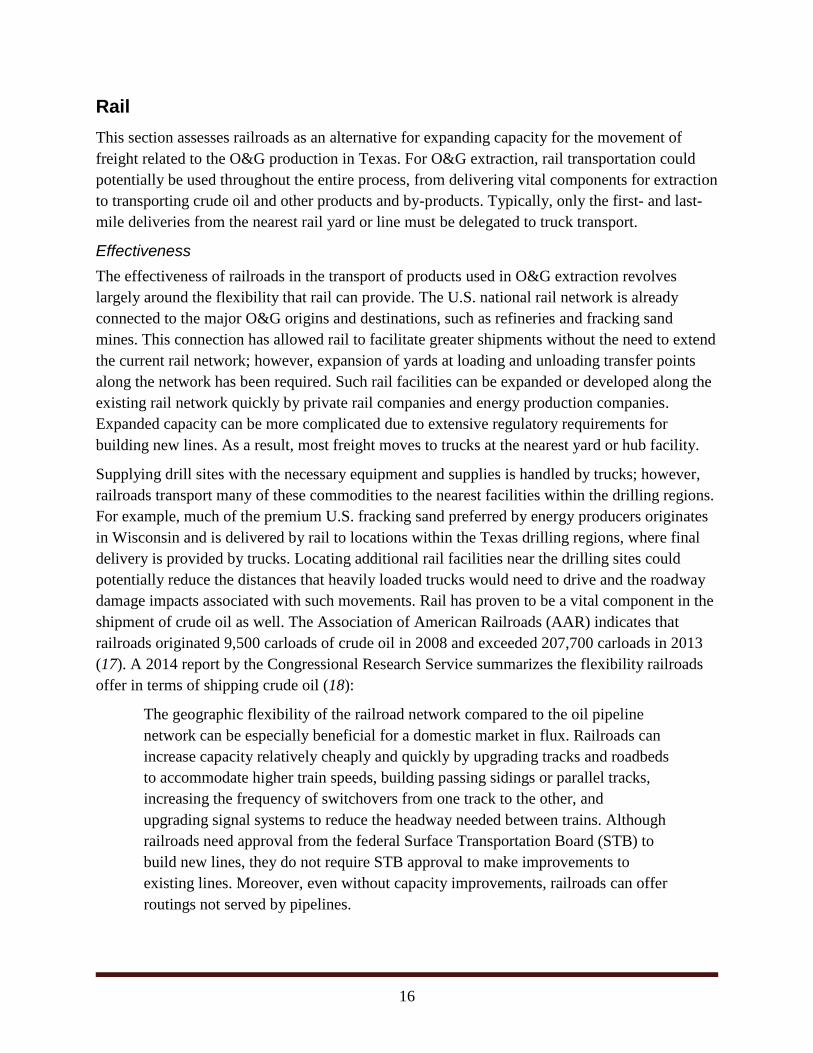
Rail
This section assesses railroads as an alternative for expanding capacity for the movement of
freight related to the O&G production in Texas. For O&G extraction, rail transportation could
potentially be used throughout the entire process, from delivering vital components for extraction
to transporting crude oil and other products and by-products. Typically, only the first- and last-
mile deliveries from the nearest rail yard or line must be delegated to truck transport.
Effectiveness
The effectiveness of railroads in the transport of products used in O&G extraction revolves
largely around the flexibility that rail can provide. The U.S. national rail network is already
connected to the major O&G origins and destinations, such as refineries and fracking sand
mines. This connection has allowed rail to facilitate greater shipments without the need to extend
the current rail network; however, expansion of yards at loading and unloading transfer points
along the network has been required. Such rail facilities can be expanded or developed along the
existing rail network quickly by private rail companies and energy production companies.
Expanded capacity can be more complicated due to extensive regulatory requirements for
building new lines. As a result, most freight moves to trucks at the nearest yard or hub facility.
Supplying drill sites with the necessary equipment and supplies is handled by trucks; however,
railroads transport many of these commodities to the nearest facilities within the drilling regions.
For example, much of the premium U.S. fracking sand preferred by energy producers originates
in Wisconsin and is delivered by rail to locations within the Texas drilling regions, where final
delivery is provided by trucks. Locating additional rail facilities near the drilling sites could
potentially reduce the distances that heavily loaded trucks would need to drive and the roadway
damage impacts associated with such movements. Rail has proven to be a vital component in the
shipment of crude oil as well. The Association of American Railroads (AAR) indicates that
railroads originated 9,500 carloads of crude oil in 2008 and exceeded 207,700 carloads in 2013
(17). A 2014 report by the Congressional Research Service summarizes the flexibility railroads
offer in terms of shipping crude oil (18):
The geographic flexibility of the railroad network compared to the oil pipeline
network can be especially beneficial for a domestic market in flux. Railroads can
increase capacity relatively cheaply and quickly by upgrading tracks and roadbeds
to accommodate higher train speeds, building passing sidings or parallel tracks,
increasing the frequency of switchovers from one track to the other, and
upgrading signal systems to reduce the headway needed between trains. Although
railroads need approval from the federal Surface Transportation Board (STB) to
build new lines, they do not require STB approval to make improvements to
existing lines. Moreover, even without capacity improvements, railroads can offer
routings not served by pipelines.

17
AAR identifies many advantages of transporting crude oil by rail (17):
Geographical flexibility—By serving almost every refinery in the United States and
Canada, railroads offer market participants enormous flexibility to shift product quickly
to different places in response to market needs and price opportunities.
Responsiveness—Rail facilities can usually be built or expanded much more quickly than
pipelines and refineries. Essentially, railroads are the only transportation mode that can
expand capacity quickly enough to keep up with production growth in the emerging oil
fields.
Efficiency—Railroads promote unit train shipments, which use dedicated equipment and
generally follow direct shipping routes to and from facilities designed to load and unload
them efficiently.
Underlying infrastructure—Hundreds of millions of dollars have been invested on tracks,
locomotives, terminals, and more to enhance rail’s ability to transport crude oil.
Product purity—Consumers of crude oil often desire a specific type of crude oil.
Shipping crude by rail allows pure barrels to be delivered to destinations in ways that are
not always possible with pipelines.
Current Capacity
Texas has 49 railroad companies that operate on almost 10,500 miles of rail line across the entire
state, which ranks it first in total rail miles compared to other states (19). Most of the mileage
and movements occur on the three Class I railroads: UP, BNSF Railway, and Kansas City
Southern Railway (KCS). Figure 4 presents a Texas rail network map from the Texas Rail Plan
with the color-coded lines representing the three Class I railroads, the state right-of-way-owned
Texas Pacifico Railroad (TXPF), and all the other railroads.

18
Source: (20).
Figure 4. Texas Freight Rail Network.
The Texas rail network is the most extensive network in terms of mileage and ranks high in most
key indicators, according to the most current publicly available 2012 data sheet compiled by
AAR and as seen in Table 2. Texas’s 10,469 miles of rail rank first among other states, and its
49 railroads rank second nationally. Including trackage rights, which is where one railroad
operates over another railroad through an agreement, the state’s rail miles are 14,687 miles.
Texas ranks fifth in overall rail tons, with terminating tons ranking first, at over 206.6 million
tons, and ranks second in total rail carloads, with over 9.1 million carloads (19).

19
Table 2. Texas Key Rail Indicators for 2012.
Key Indicator Statistic Rank
Number of freight railroads 49 2nd
Total rail miles Excluding trackage rights Including trackage rights
10,469 14,687
NA
Total rail tons Originating Terminating
373.4 million 92.9 million 206.6 million
5th 3rd 1st
Total rail carloads Originating Terminating
9,151,800 1,902,200 3,117,400
2nd 4th 3rd
Total rail employment 16,826 1st
Total wages by rail employees $1.3 billion 1st NA = not applicable. Overall state rankings do not include trackage rights mileage.
Source: (19).
Figure 5 displays the locations of O&G wells constituted between 1977 and 2010, with the
railroad network placed over them. The O&G well data come as processed data from the Texas
Railroad Commission.
The rail network appears to have good coverage throughout the Texas Gulf Coast and East
Texas, while patches of wells in the Texas Panhandle, west of Fort Worth, and in the Permian
Basin are not as covered by the existing railroads. Several abandoned rail corridors traverse
O&G activity areas, such as between Wichita Falls and Abilene.

20
Figure 5. Location of Oil and Gas Wells in Relation to Rail Infrastructure.
Figure 6 displays the crude-by-rail facilities and crude oil pipelines. The crude-by-rail facilities
are mostly concentrated in the Permian Basin and Texas Panhandle, with some additional
facilities in the San Antonio area. The Permian Basin facilities exist despite the presence of crude
oil pipelines. The San Antonio area facilities seem to be filling a need due to the lack of crude oil
pipelines.

21
Figure 6. Location of Oil and Gas Wells in Relation to Rail Infrastructure.
Texas Abandoned Railroads
The peak of Texas railroad mileage was in 1932 with over 17,000 miles of track (21). That total
has decreased over the years, with accelerated rates of decline beginning in the late 1970s and
1980s following the passage of the Staggers Act in 1980, which made it easier for railroads to
abandon unprofitable rail lines.
A March 2011 TTI report calculated that as of 2008, over 9,000 miles of rail line track had been
abandoned in the state (21). Some of those lines are now used for other purposes, such as
roadways or pathways, while most of the remainder are used by the adjoining landowners, who
reassumed ownership. Still other segments are still owned by the railroads and sit idle. Figure 7
provides a comprehensive view of the abandoned rail lines in Texas based on the findings of the
2011 TTI report. Several of the abandoned lines sit within the most active O&G exploration
regions, with a few former lines being reconstructed or expanded for rail service to support O&G
shipments.

22
Source: (21).
Figure 7. Comprehensive View of Abandoned Rail Lines in Texas.
Pipelines
This section presents an assessment of pipeline networks as an alternative for the movement of
freight related to the O&G production in Texas. Almost 500,000 miles of pipelines in the United
States have been used to transport O&G products—including interstate, intrastate, and
intracompany. A typical trip through a pipeline is from a producing region (e.g., Texas,
Wyoming, North Dakota, and Alaska) to a refinery. Pipelines also move oil that arrives from
Mexico, Africa, the Middle East, and Latin America by tanker from U.S. seaports to refineries.
Pipelines are privately owned assets for which transmission and distribution companies assume
capital, operation, and maintenance costs in exchange for the opportunity to make a profit. This
extensive infrastructure network is regulated and overseen by the Pipeline and Hazardous
Materials Safety Administration, the National Association of Pipeline Safety Representatives,
and the National Transportation Safety Board. In Texas, the Railroad Commission has regulatory
authority over common carrier pipelines (22). However, lines located before the point of sale are
not regulated and face no construction specification restrictions. In general, there are two types
of energy pipelines: liquid petroleum pipelines and natural gas pipelines.
23
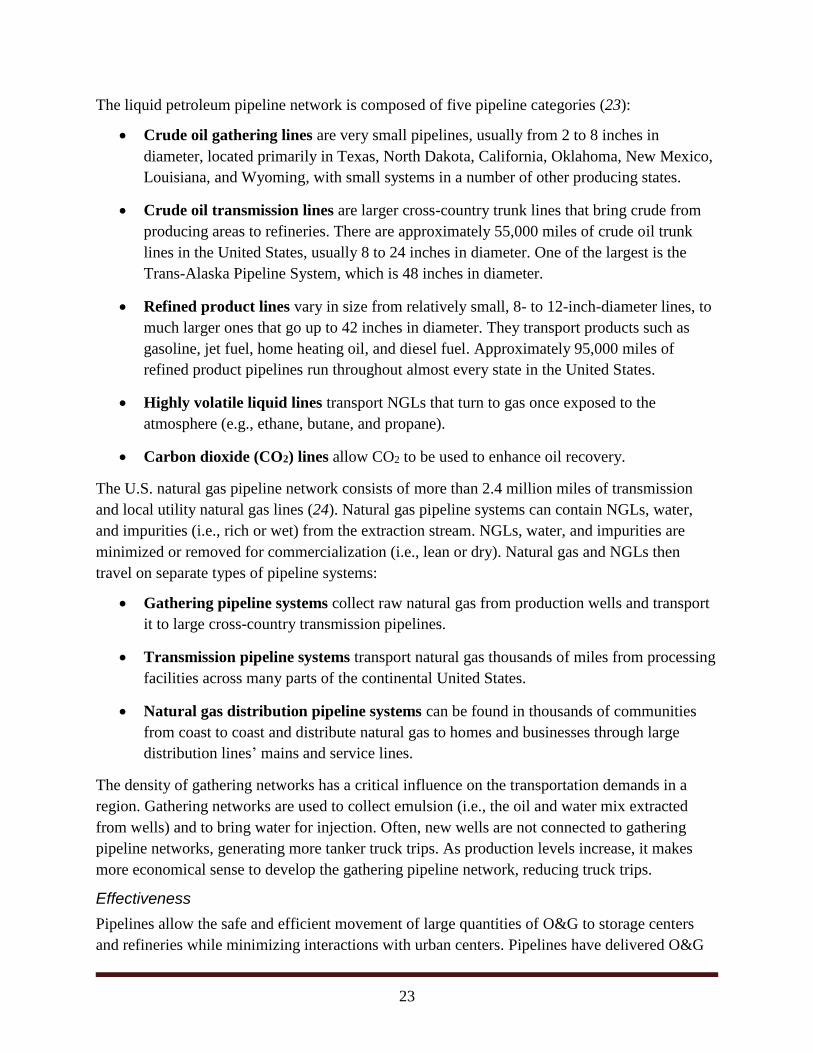
The liquid petroleum pipeline network is composed of five pipeline categories (23):
Crude oil gathering lines are very small pipelines, usually from 2 to 8 inches in
diameter, located primarily in Texas, North Dakota, California, Oklahoma, New Mexico,
Louisiana, and Wyoming, with small systems in a number of other producing states.
Crude oil transmission lines are larger cross-country trunk lines that bring crude from
producing areas to refineries. There are approximately 55,000 miles of crude oil trunk
lines in the United States, usually 8 to 24 inches in diameter. One of the largest is the
Trans-Alaska Pipeline System, which is 48 inches in diameter.
Refined product lines vary in size from relatively small, 8- to 12-inch-diameter lines, to
much larger ones that go up to 42 inches in diameter. They transport products such as
gasoline, jet fuel, home heating oil, and diesel fuel. Approximately 95,000 miles of
refined product pipelines run throughout almost every state in the United States.
Highly volatile liquid lines transport NGLs that turn to gas once exposed to the
atmosphere (e.g., ethane, butane, and propane).
Carbon dioxide (CO2) lines allow CO2 to be used to enhance oil recovery.
The U.S. natural gas pipeline network consists of more than 2.4 million miles of transmission
and local utility natural gas lines (24). Natural gas pipeline systems can contain NGLs, water,
and impurities (i.e., rich or wet) from the extraction stream. NGLs, water, and impurities are
minimized or removed for commercialization (i.e., lean or dry). Natural gas and NGLs then
travel on separate types of pipeline systems:
Gathering pipeline systems collect raw natural gas from production wells and transport
it to large cross-country transmission pipelines.
Transmission pipeline systems transport natural gas thousands of miles from processing
facilities across many parts of the continental United States.
Natural gas distribution pipeline systems can be found in thousands of communities
from coast to coast and distribute natural gas to homes and businesses through large
distribution lines’ mains and service lines.
The density of gathering networks has a critical influence on the transportation demands in a
region. Gathering networks are used to collect emulsion (i.e., the oil and water mix extracted
from wells) and to bring water for injection. Often, new wells are not connected to gathering
pipeline networks, generating more tanker truck trips. As production levels increase, it makes
more economical sense to develop the gathering pipeline network, reducing truck trips.
Effectiveness
Pipelines allow the safe and efficient movement of large quantities of O&G to storage centers
and refineries while minimizing interactions with urban centers. Pipelines have delivered O&G

24
products reliably, safely, efficiently, and economically for almost a century. Although marine
tankers, trucks, and railroads are alternative transportation modes to move O&G products, on a
ton-mile basis, 71 percent of crude oil and refined products are carried by pipeline, 22 percent
are carried by marine tankers, 4 percent are carried by trucking, and 3 percent are carried by rail.
Of the dry natural gas recovered in the United States, 100 percent is shipped by pipeline to end
users (24). For the movement of crude oil over long distances, pipelines represent the most cost-
effective transportation mode. Without pipelines, streets and highways would be overwhelmed
by trucks trying to keep up with the nation’s demand for petroleum products.
It would take a constant line of tanker trucks, about 750 per day, loading up and moving out
every two minutes, 24 hours a day, seven days a week to move the volume of even a modest
pipeline. The railroad equivalent of this single pipeline would be a train of 75 2,000-barrel tank
railcars every day. Almost all natural gas is moved by pipeline. Natural gas can be liquefied and
moved by ship or truck, but few truck shipments of liquefied natural gas occur in the United
States (24). According to statistics from EIA, as of December 2012, the United States produces
over 10.6 million barrels of petroleum per day (24). This figure is projected to rise to 27 million
barrels of petroleum per day by 2020.
Current Texas Pipeline Capacity and Routing
The 2013 EIA report Short‐Term Energy Outlook Supplement: Key Drivers for EIA’s Short‐Term
U.S. Crude Oil Production Outlook provides an overview of existing and planned pipeline
capacity in Texas’s Permian Basin region (25). According to this report, in 2013, two pipelines
transported crude from the Permian Basin to the main pipeline collection point for crude oil in
the United States at Cushing, Oklahoma. Those two pipelines were the Plains All American
pipeline and the Oxy Centurion pipeline. The Plains All American pipeline had a current
capacity of 450,000 barrels of petroleum per day (expanded from 400,000 barrels of petroleum
per day in 2012), and the Oxy Centurion pipeline had a capacity of 175,000 barrels of petroleum
per day. A third pipeline from the Permian Basin moved crude oil to Longview, Texas, where it
connected to another transmission pipeline to the U.S. Midwest with a capacity of
300,000 barrels of petroleum per day.
The EIA report further stated that all three of these pipelines were approaching full capacity in
early 2013 and that all three serviced the U.S. Midwest refinery region, which was effectively
overserviced at the time of the report. As a result, and due to increased production in the Permian
Basin occurring at the time of the report, six pipeline projects were underway to increase pipeline
capacity from the region—all of which served the Texas Gulf Coast. The list of planned pipeline
projects in 2013 included reversals and expansions of existing pipelines as well as construction
of new pipelines. Projected pipeline capacity increases from these projects were forecast to
provide an additional 355,000 barrels of petroleum per day in 2013 and 478,000 barrels of
petroleum per day in 2014, if completed as planned (25).
25
Chapter 3. Public-Sector Energy Development Efforts
Recent investigations have focused on other state activities related to managing the rapidly
increased levels of truck activity in and around well locations. Most of these activities involve
efforts to maintain roadway conditions, upgrade roadway sections in poor condition, and fund
these infrastructure improvements. Little research has investigated how rail and pipelines can
assist in the management of truck activity or how these modes can play a larger role in
supporting mining activities. The PRC report Energy Development Impacts on State Roadways:
A Review of DOT Policies, Programs and Practices across Eight States found that “Colorado,
North Dakota, Pennsylvania, and Utah reported engaging in long-term energy corridor planning
involving important roads or other modes such as pipeline and rail” (2).
This project found that those states with potential rail options typically have an existing state-
level rail funding program or programs (i.e., loans, grants, or a combination of loans and grants)
that could be used for rail infrastructure projects. In almost all cases, the scoring/selection
process for these funds is based largely on economic development criteria rather than
transportation benefits. With that said, rail-based infrastructure associated with O&G activity
would be eligible because of the local economic development benefits. Examples of such
infrastructure include loading facilities and loop tracks within local industrial parks and staging
facilities for interchange of energy equipment and products between Class I and short-line
railroads.
State Congestion and Safety Responses
In a National Cooperative Highway Research Program study on energy development impacts on
U.S. roads and bridges, states reported traffic conflicts with other modes (e.g., pedestrians and
bicycles), along with increases in the number of head-on collisions and run-off-the-road
incidents, as safety-related issues for increased O&G-related traffic. Both the North Dakota
Department of Transportation (NDDOT) and TxDOT reported increases in fatality crashes and
rear-end collisions. The leading causes of these crashes, according to law enforcement in Texas,
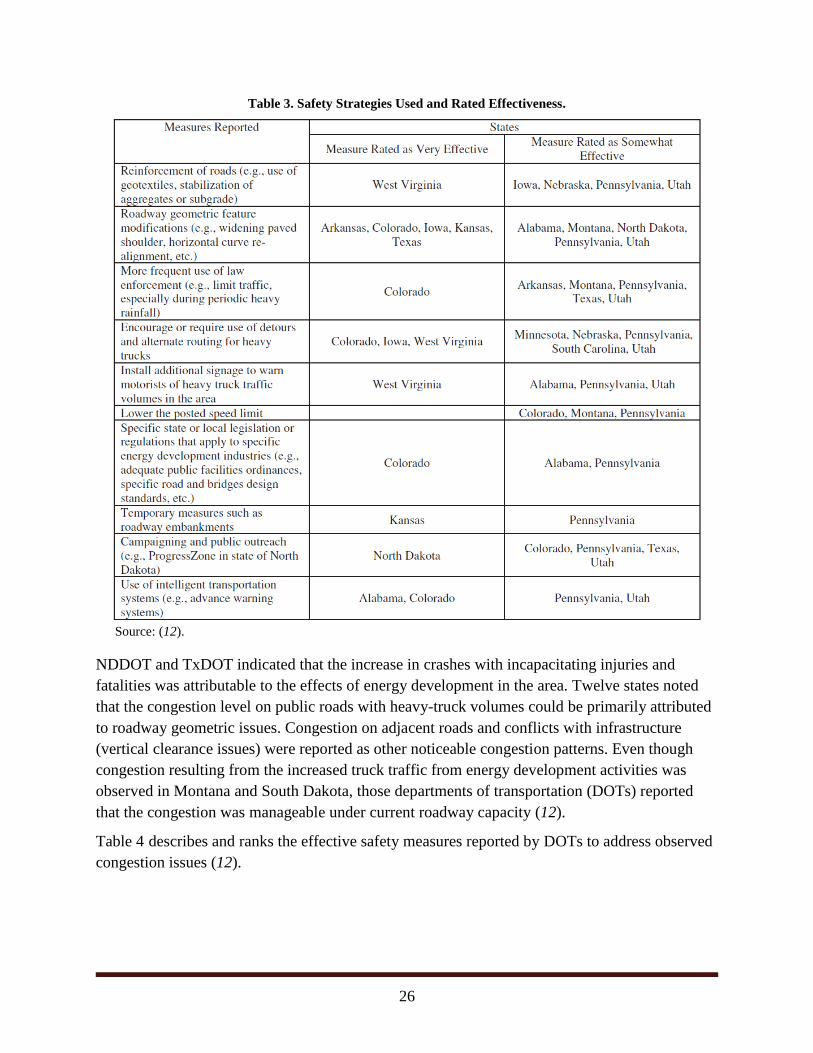
were the failure to control speed and driver inattention. Table 3 summarizes the effective
measures reported to address the identified safety issues. Two safety measures reported as very
effective were modifications to roadway geometric features and use of detours or alternate
routing for heavy trucks (12).
26
Table 3. Safety Strategies Used and Rated Effectiveness.
Source: (12).
NDDOT and TxDOT indicated that the increase in crashes with incapacitating injuries and
fatalities was attributable to the effects of energy development in the area. Twelve states noted
that the congestion level on public roads with heavy-truck volumes could be primarily attributed
to roadway geometric issues. Congestion on adjacent roads and conflicts with infrastructure
(vertical clearance issues) were reported as other noticeable congestion patterns. Even though
congestion resulting from the increased truck traffic from energy development activities was
observed in Montana and South Dakota, those departments of transportation (DOTs) reported
that the congestion was manageable under current roadway capacity (12).
Table 4 describes and ranks the effective safety measures reported by DOTs to address observed
congestion issues (12).

27
Table 4. Strategies to Address Observed Congestion Issues.
Source: (12).
State Funding Programs for Energy Development Areas
Since O&G production in shale formations is occurring throughout the United States (as
discussed in Chapter 1), a number of states are responding to the effects of increased energy
development through a variety of funding mechanisms. According to a prior study done by TTI,
states have charged O&G production through different types of fees, taxes, and exercises,
applying the collected capital among several sectors, including transportation programs. The
study reveals that these taxes have aided in matching needed funds in the transportation area in
important producer states (2).
In Texas, O&G production is charged on severance taxes according to the market value of the
product (7.5 percent for gas and 4.6 percent for O&G condensate). The allocation of budget
relies on the Economic Stabilization Fund needs, as determined by House Bill 1 (83rd
Legislature) approved in November 2014. From the total of O&G severance taxes, 37.5 percent
is designated to the Environmental Response Fund, and the remainder is allocated to the State
Highway Fund, aiming to fund unmet financial needs in the transportation sector. Fifteen percent
of the revenue allocated to the State Highway Fund is statutory, allocated to road construction
and maintenance related to O&G activities.
These revenue sources and funding programs include the following examples from other states:
Colorado oil and gas severance tax—Colorado, the seventh largest oil producer in the
United States (26), has transferred revenues from O&G severance taxes allocated to the
General Fund to aid transportation projects statewide. From the total revenue,
$1.5 million is transferred into the Innovative Energy Fund, and from the remainder, half
is deposited into the State Trust Fund and the other half into the Local Impact Fund. The
Local Impact Fund is devoted to financially aiding projects related to energy-sector
activities. The fund is part of the Energy and Mineral Impact Assistance Program (see
Figure 8), approved in 1977 by the Colorado Legislature (27).

28
Source: (27).
Figure 8. Colorado Oil and Gas Severance Tax Distribution.
West Virginia oil and gas severance taxes—West Virginia has also adopted
apportionments from the General Fund to mitigate infrastructure impacts caused by
energy development activities. From the 90 percent portion of O&G severance taxes
deposited into the General Fund, the first $24 million collected is allocated to amortize
debts in infrastructure bonds (28).
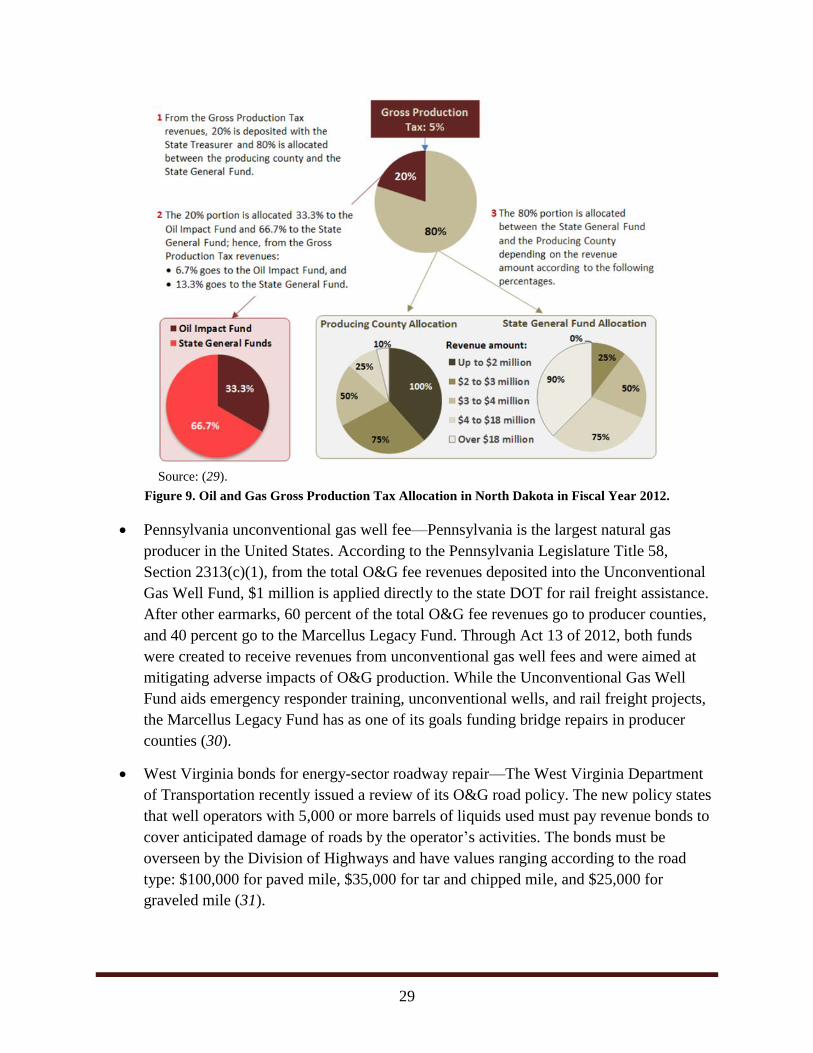
North Dakota oil and gas production tax—According to North Dakota’s tax
commissioner, of the 5 percent of the budget leveraged from the O&G gross production
tax, 20 percent is allocated to the State Treasury. Of that portion, 33.3 percent is then
transferred to the Oil and Gas Impact Fund, and 66.7 percent goes to state general
revenues. The other 80 percent from the gross production tax is distributed to the State
General Fund and the producing county, according to the total collected revenue (29).
From the producing county allocation, local entities are required to fund transportation
projects under penalty of forfeiting such revenues. Figure 9 shows the O&G gross
production tax distribution in North Dakota in fiscal year 2012.
29
Source: (29).
Figure 9. Oil and Gas Gross Production Tax Allocation in North Dakota in Fiscal Year 2012.
Pennsylvania unconventional gas well fee—Pennsylvania is the largest natural gas
producer in the United States. According to the Pennsylvania Legislature Title 58,
Section 2313(c)(1), from the total O&G fee revenues deposited into the Unconventional
Gas Well Fund, $1 million is applied directly to the state DOT for rail freight assistance.
After other earmarks, 60 percent of the total O&G fee revenues go to producer counties,
and 40 percent go to the Marcellus Legacy Fund. Through Act 13 of 2012, both funds
were created to receive revenues from unconventional gas well fees and were aimed at
mitigating adverse impacts of O&G production. While the Unconventional Gas Well
Fund aids emergency responder training, unconventional wells, and rail freight projects,
the Marcellus Legacy Fund has as one of its goals funding bridge repairs in producer
counties (30).
West Virginia bonds for energy-sector roadway repair—The West Virginia Department
of Transportation recently issued a review of its O&G road policy. The new policy states
that well operators with 5,000 or more barrels of liquids used must pay revenue bonds to
cover anticipated damage of roads by the operator’s activities. The bonds must be
overseen by the Division of Highways and have values ranging according to the road
type: $100,000 for paved mile, $35,000 for tar and chipped mile, and $25,000 for
graveled mile (31).
30
Pennsylvania excess maintenance agreement—The Pennsylvania Department of
Transportation has an agreement with haulers that exceed posted weight limits on state
and local roadways, aimed at mitigating adverse roadway impacts caused by heavy-duty
truck traffic. The fields that the agreement covers are mainly related to timber, coal, and
natural gas exploration. According to the Pennsylvania Department of Transportation,
after the type of roadway that will be impacted is decided, haulers must pay $50,000 per
mile of paved roads that can be reverted to unpaved roads, $12,500 per mile of paved
roads, and $6,000 per mile of unpaved roads (32).
Texas–New Mexico Railroad improvement—Permian Basin Railways, Inc., which owns
nine local railroads throughout the country, received $64.4 million in loans from the
Federal Railroad Administration’s Railroad Rehabilitation and Improvement Financing
program in 2009. The funding improved the Texas–New Mexico Railroad’s track speed
and service consistency (33). This stretch of 104 miles from the UP connection at
Monahans, Texas, to Lovington, New Mexico, is an important corridor serving crude-by-
rail movement (34).
Public Involvement in Rail Infrastructure Investment
The availability of adequate freight transportation infrastructure has long been recognized as
critically important for the growth of business and industry in local communities. Economic
development through relocation of businesses from other states or expansion of existing
businesses typically benefits a local economy through employment growth and/or increased tax
revenues. Consequently, public resources are often used to expand local infrastructure to support
economic development initiatives. Investing in local rail freight infrastructure may create new
economic development opportunities for local communities. Examples of the types of freight
railroad infrastructure projects that can benefit local business or industry include:
Construction of a new rail line or restoration of track, structures, subgrade, or switches on
an existing rail spur or industrial lead to improve connectivity between local industry and
a railroad mainline.
Installation of modern grade crossing devices, train signaling, or other communication
systems to improve safety and increase capacity on a local rail line.
Purchase of specialized rolling stock for use by local industry for freight transport.
Construction of support facilities required for local industries to use rail for freight
transport, such as storage buildings, silos, or transloading facilities.
Improvements to local freight rail infrastructure can benefit local communities through economic
development while also supporting broader transportation system goals, such as shifting freight
from highways to rail or increasing connectivity between rail lines. As a result, many states have

31
found it to be in the public interest to provide mechanisms for local governments, railroads, and
private businesses to obtain funding support for these types of projects.
TTI found that 33 states outside Texas have state-level programs that can fund rail spur line or
industrial lead infrastructure projects. In 24 states, 33 different programs that are specifically
focused on rail infrastructure funding exist, while in the other nine states, state-level funding for
general infrastructure or economic development can be applied to rail improvements. This type
of funding program could potentially give one of those states an upper hand in recruiting
businesses looking for a rail-served site for relocation or expansion. For instance, one of these
states might offer assistance in paying for the rail connections in order to entice a business to
relocate to that state. Figure 10 and Figure 11 provide maps that demonstrate which states offer
rail-eligible and rail-specific programs, respectively.
Source: TTI analysis, 2013.
Figure 10. States with Rail-Eligible Programs.

32
Source: TTI analysis, 2013.
Figure 11. States with Rail-Specific Programs.
In the states with state-level rail-specific programs, the types of funding and the state agency that
administers the rail infrastructure program differ (see Figure 12). Loans, grants, revolving funds,
and the use of state funding to match available federal programs for rail improvements were all
identified as strategies being used to attract rail-served businesses.
Types of Funding State Administering Agency
Source: TTI analysis, 2013.
Figure 12. Types of Funding and State Administering Agencies.

33
Rural Rail Transportation Districts
RRTDs are subdivisions of Texas state government, created at the county level, that have the
authority to purchase, operate, and/or build new railroad and intermodal facilities; the right of
eminent domain; and the ability to issue bonds based on projected revenues that may be
generated by the rail improvements. RRTDs do not have taxing authority, however, and the lack
of a dedicated funding source has prevented many RRTDs from being successful in either
preventing rail abandonment or implementing proposed rail projects. RRTDs are seen by some
local economic development entities as a vehicle they can use to enhance their local development
efforts.
The 67th Texas Legislature first authorized RRTDs in 1981. RRTDs are formed by simple
resolution of one or more county commissioners’ courts under rules outlined in Texas Statutes
and the Texas Transportation Code. The creation of an RRTD does not require approval by
TxDOT or any other state-level planning authority.
RRTDs are not required to notify TxDOT or any other state agency upon formation, which
makes tracking new RRTDs and monitoring their activity difficult. TxDOT has contracted with
TTI to perform several studies to characterize RRTD formation and activities, with the latest
update published in 2013 (35). As of June 2013, 42 RRTDs have been identified as being
officially formed in Texas, with 95 of the state’s 254 counties participating in at least one RRTD.
Several motivations were cited by counties for the formation of RRTDs (35). Such motivations
generally fall into the following three categories:
Rail preservation/prevention of abandonment—The RRTD was formed in response to
proposed abandonment of a railroad line within the RRTD’s jurisdiction, generally for
the purpose of opposing the abandonment and preserving the line for future use.
Economic development—The RRTD was formed to promote economic development
within the RRTD jurisdiction, including construction of railroad spur lines to single
industries or larger multi-parcel industrial parks, or construction of new railroad lines to
promote alternative (i.e., dual) rail service.
Improved passenger rail service—The RRTD was formed largely to promote
establishment of improved passenger rail service along an existing Amtrak route.
Among the 42 RRTDs identified in the state, 15 (36 percent) were formed primarily in response
to the threat of rail line abandonment, 19 (45 percent) were formed to promote economic
development, four (10 percent) were formed for multiple reasons, and at least one was created
primarily for promoting improved passenger rail service. The primary motivation for RRTD
formation was not conclusively identified for three RRTDs (35).

34
Many of the RRTDs are located in counties with O&G activities. Figure 13 displays a map
showing the RRTDs overlaid on the active and abandoned rail lines in the state and O&G wells
between 1997 and 2010.
Figure 13. Location of Rural Rail Transportation Districts in Relation to Rail Lines and Oil and Gas Well
Activity in Texas.
Few RRTDs are actively meeting and pursuing rail projects, but those that are active and located
within O&G activity regions could be used as a tool to develop rail infrastructure projects. The
following are some of the noteworthy projects identified in the 2013 update (35). These projects
represent either activities by RRTDs located in O&G regions or project types that could assist
with increased rail use for O&G activities.
The Top of Texas RRTD was formed in 2006 to prevent the abandonment of a railroad
line through Hansford, Ochiltree, and Lipscomb Counties in the Texas Panhandle. The
RRTD was able to negotiate a deal to gain fee-simple ownership of the 90-mile right of
way, while the former railroad owner was able to salvage the rail materials. The
agreement allows the businesses along the line to retain their leases and the RRTD to
collect lease payments as income. The right of way owned by the RRTD extends into
Oklahoma, where the abandoned line connects to the nearest Class I railroad.
35
The La Entrada Al Pacifico RRTD has proposed a north-south rail line between
Seagraves, Texas, through the Midland-Odessa region and farther south to interchange
with the South Orient Railroad/Texas Pacifico line at McCamey, Texas.
The Ellis County RRTD has been active in enhancing the rail transport capabilities of the
Railport Industrial Park adjacent to the BNSF Railway line in Midlothian, Texas, which
opened in 2004. Recently, the RRTD undertook several track work projects to eliminate
flooding issues and move storage tracks to accommodate a second entrance to the
industrial park.
In 2011, the Liberty County Rural Rail District #1 received $15,000 from the Liberty
Community Development Corporation for a feasibility study on the acquisition,
construction, and rehabilitation of a 1.8-mile railroad spur line within the city of Liberty
connecting several local industries to the mainline.
The Reeves County RRTD formed in 2010 to assist with the development of
transportation infrastructure associated with a proposed 500-acre industrial park near
Pecos, Texas.

36
Chapter 4. Private-Sector Oil and Gas Rail and Pipeline
System Improvements
Increased O&G production in Texas has encouraged private investments in rail facilities and
pipelines to serve the wells being drilled and operated. This chapter offers illustrative examples
of the private-sector activity in Texas.
Recent Private-Sector Rail Infrastructure Development
The growth in O&G activities has resulted in the development of several major rail-served yard
facilities and the upgrading and expansion of short-line railroads to serve the O&G industry.
Rail Construction and Development in the Eagle Ford Shale Play
Mission Rail Park in San Antonio
Mission Rail Park is advertised as San Antonio’s largest commercial rail park ever constructed.
Located southeast of San Antonio, the park is over 1,000 acres and is designed to support O&G
industry activities south of San Antonio and other commercial activities in the San Antonio
region. Figure 14 shows the location of the facility in comparison to the bands of O&G activities.
The facility is only 40 miles from the highest-producing Eagle Ford wells (36). Some of the
capabilities include the capacity for multiple daily unit trains; hazmat loading and unloading,
crude storage, and transloading sites; and fracking sand and other commodity storage and
transloading. This facility is served by UP, which had to reconstitute previously out-of-service
tracks for the development of the facility.
Source: (36).
Figure 14. Mission Rail Park Location Map.

37
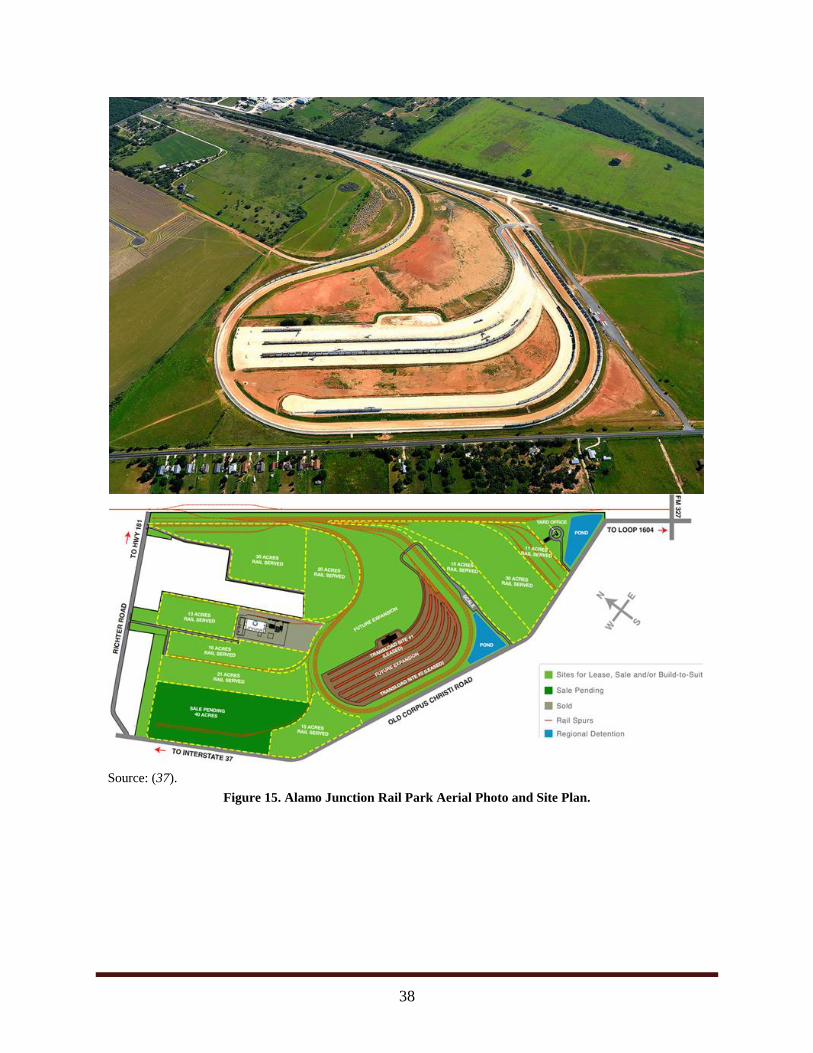
Alamo Junction Rail Park in San Antonio
Alamo Junction Rail Park is located a few miles northwest of Mission Rail Park. The 400-acre
master planned industrial park promotes easy access to I-37, South Loop 1604, and
U.S. Highway 181 and is in close proximity to many of the major oilfield service companies
(37). Some of the stated rail services and capabilities include:
Dual rail service (UP and BNSF Railway).
Railcar handling, switching, and storage.
Manifest and unit train service capability.
Figure 15 provides an aerial photograph and site plan of Alamo Junction Rail Park.
38
Source: (37).
Figure 15. Alamo Junction Rail Park Aerial Photo and Site Plan.
39
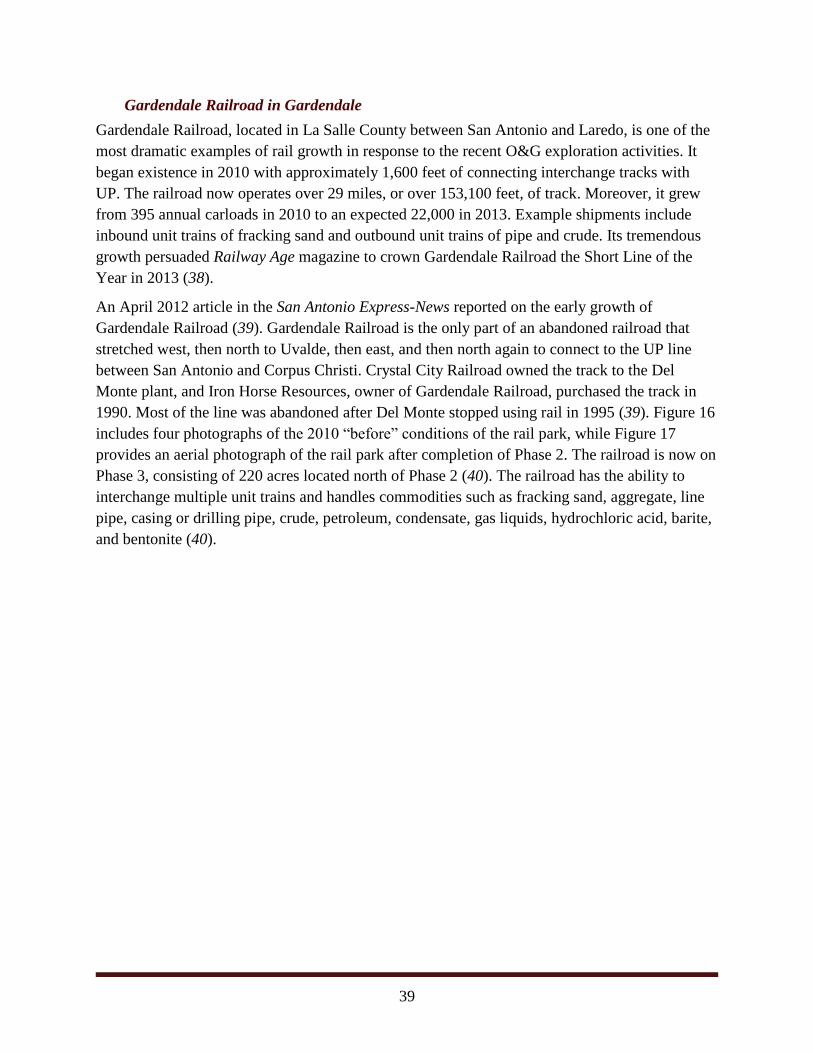
Gardendale Railroad in Gardendale
Gardendale Railroad, located in La Salle County between San Antonio and Laredo, is one of the
most dramatic examples of rail growth in response to the recent O&G exploration activities. It
began existence in 2010 with approximately 1,600 feet of connecting interchange tracks with
UP. The railroad now operates over 29 miles, or over 153,100 feet, of track. Moreover, it grew
from 395 annual carloads in 2010 to an expected 22,000 in 2013. Example shipments include
inbound unit trains of fracking sand and outbound unit trains of pipe and crude. Its tremendous
growth persuaded Railway Age magazine to crown Gardendale Railroad the Short Line of the
Year in 2013 (38).
An April 2012 article in the San Antonio Express-News reported on the early growth of
Gardendale Railroad (39). Gardendale Railroad is the only part of an abandoned railroad that
stretched west, then north to Uvalde, then east, and then north again to connect to the UP line
between San Antonio and Corpus Christi. Crystal City Railroad owned the track to the Del
Monte plant, and Iron Horse Resources, owner of Gardendale Railroad, purchased the track in
1990. Most of the line was abandoned after Del Monte stopped using rail in 1995 (39). Figure 16
includes four photographs of the 2010 “before” conditions of the rail park, while Figure 17
provides an aerial photograph of the rail park after completion of Phase 2. The railroad is now on
Phase 3, consisting of 220 acres located north of Phase 2 (40). The railroad has the ability to
interchange multiple unit trains and handles commodities such as fracking sand, aggregate, line
pipe, casing or drilling pipe, crude, petroleum, condensate, gas liquids, hydrochloric acid, barite,
and bentonite (40).

40
Source: (39).
Figure 16. Gardendale Railroad 2010 “Before” Conditions.
Source: (40).
Figure 17. Gardendale Railroad Phase 2.

41
Live Oak Railroad between Three Rivers and George West
Located in Live Oak County between San Antonio and Corpus Christi, this new rail park serves
the Eagle Ford Shale Play and South Texas and connects to UP. With over 300 acres, Live Oak
Railroad advertises capabilities for handling pipeline interconnects, bulk liquid terminals,
transload services, and multiple unit trains (41). Figure 18 shows the Live Oak Railroad rail park
site plan with interconnections to four pipelines at the complex (42).
Source: (42).
Figure 18. Live Oak Railroad Site Plan.
Other Eagle Ford Shale Rail Developments
In addition to the locations previously discussed, several other rail-based developments exist in
the Eagle Ford Shale region, including:
Hondo Railway, LLC—co-located at the publicly owned Hondo airport and recently
expanded from 13,000 feet to 80,000 feet of track.
Port San Antonio’s East Kelly Railport—expanded from 4 miles to almost 8 miles of
track within the 350-acre site.
Texas Gonzales and Northern Railway—expanded from 12 miles to 25 miles of track
(43).

42
Rail Construction and Development in the Permian Basin Region
The Permian Basin of West Texas has also seen construction and development of several new
rail-based facilities for transporting equipment and loads related to the O&G industry. This
section discusses several of these.
Texas Pacifico Transportation in West Texas
TXPF operates and maintains via lease from TxDOT the South Orient Rail Line between San
Angelo Junction (near Coleman, Texas) and Presidio, Texas, at the Mexican border (44).
Approximately 371 mainline track miles exist over the route between San Angelo Junction and
Presidio. TxDOT completed the purchase of the line and leased operations to TXPF in 2001.
Figure 19 shows a map of the South Orient Rail Line.
Source: (45).
Figure 19. TxDOT Map of the South Orient Rail Line (2010).
TXPF has experienced a tremendous jump in traffic with the recent O&G exploration growth.
Figure 20 shows the annual carloads from 2002 to 2013. Before the O&G exploration began to
rapidly expand, TXPF delivered 1,527 carloads of sand, grain, wheat, and other shipments. The
end-of-year count for 2014 was expected to exceed 25,800 carloads, with projections for 2015
totaling almost 40,000 (46). In response to acquiring the line and the growth in O&G
exploration-related shipments, TxDOT and TXPF have undertaken several infrastructure

43
projects, including a project partially funded using $14.01 million in American Recovery and
Reinvestment Act funds.
Source: (46).
Figure 20. TXPF Annual Carloads in 2002–2013.
BNSF Logistics Center in Sweetwater
In November 2014, BNSF Railway opened the BNSF Logistics Center in Sweetwater to help
accommodate the traffic growth in the Permian Basin. According to Progressive Railroading, the
facility will provide rail, truck, and transload services and serve several industries, including
agricultural products, sand, pipe, and aggregates (47). The 75-acre facility has rail capabilities
that include a 100-car unit train sand terminal, 100-car unit train agriculture terminal, 90-car unit
train aggregate terminal, 30-car dimensional transload site, and expandable switch yard. The
project added 40,000 feet, or over 7.5 miles, of new track at the site. The local economic
development director said that “the rail hub helps alleviate tractor-trailer traffic in the area by
using rail cars to transport products that would have been shipped by truck” (48).
Pipelines
Private-sector pipeline expansion in terms of mileage and capacity is expressed in Table 5 and
Figure 21. Table 5 shows the growth of regulated and unregulated pipeline mileage throughout
the state. Figure 21 illustrates the recent growth of natural gas pipelines in natural-gas-producing
regions of the state. These pipelines not only connect Texas natural gas to other states but also
provide natural gas feedstocks to chemical manufacturing plants in Texas.

44
Table 5. Texas Pipeline Mileage.
Type of Pipeline 2012
Mileage 2013
Mileage 2014
Mileage 2015
Mileage
1 natural gas distribution 100,645 100,404 101,995 101,856
1a service lines 40,573 40,800 44,563 44,305
2 natural gas master meter* 438 419 408 408
3 LP-gas distribution 163 164 164 167
4 natural gas transmission & storage 33,797 32,739 32,888 32,228
5 natural gas gathering 3,993 4,029 4,004 4,346
6 hazardous liquids transmission and storage 28,252 29,768 30,428 31,895
7 hazardous liquids gathering 699 1,041 1,849 1,860
8 total regulated intrastate miles (sum of 1 through 7) 208,560 209,364 216,299 217,065
9 intrastate production and gathering lines leaving lease 154,225 159,604 163,543 168,268
10 total intrastate pipeline miles in Texas
362,785 368,968 379,842 385,333 (regulated and non-regulated) (sum of 8 and 9)
11 interstate natural gas transmission pipeline 21,580 21,724 21,618 21,554
12 interstate hazardous liquids transmission pipeline 22,482 24,426 24,479 25,090
13 total regulated interstate miles
44,062 46,150 46,097 46,664 (sum of 11 and 12)
14 total regulated miles (intrastate and interstate)
252,622 255,514 262,396 263,729 (sum of 8 and 13)
15 total pipeline miles in Texas (interstate and intrastate, regulated and non-regulated)
406,847 415,118 425,939 431,997 (sum of 10 and 13) *A master metered system is a pipeline system, other than one designated as a local distribution
system, for distributing natural gas within but not limited to a definable area, such as a mobile home
park, housing project, or apartment complex, where the operator purchases metered gas from an
outside source for resale through a gas distribution pipeline system.
Note: LP = liquefied petroleum.
Source: (1).

45
Source: Based on data from (49).
Figure 21. Texas Natural Gas Pipeline Capacity Measurement.
Table 6 lists new O&G pipelines under construction in Texas, showing the continued private
investment in pipeline infrastructure to collect and distribute new energy resources being
extracted in the state.
-
5,000
10,000
15,000
20,000
25,000
30,000
35,000
40,000
20
00
20
01
20
02
20
03
20
04
20
05
20
06
20
07
20
08
20
09
20
10
20
11
20
12
20
13
20
14
20
15
MM
cf/d
Outflow
Inflow

46
Table 6. Texas Pipeline Construction Projects in Progress.
Contractor/Owner Project Name/Location Miles Completion
Date Natural Gas
Bechtel/Cheniere Energy, Inc. Corpus Christi Liquefaction Project 22 2018
Blueknight Energy Partners, LP Leon, Walker, and Houston Counties 160 2016
Burk Royalty Co., Ltd./ Midcoast Energy
Ghost Chili Lateral/Houston County NA 2016
DCP Midstream Carlsbad, NM–Andrews, TX 164 2016
Energy Transfer Partners, LP Panola Pipeline/Carthage– Mont Belvieu 181 2016
Femaca/CFE El Encino–La Laguna Pipeline/Waha, TX 263 2017
Larrett Energy/NRG Energy CO2 Project/Corpus Christi 80 2016
Pumpco, Inc./Energy Transfer Pecos–Presidio/El Paso–Pecos 342 2017
Pumpco, Inc.; Strike Construction/Lone Star NGL, LLC
Lone Star NGL Pipeline/Bosque County–Mont Belvieu
533 2018
Strike, LLC; Pumpco, Inc./ Energy Transfer
Volunteer Pipeline/Brazos County 70 2016
Oil Boots Smith/Kinder Morgan Sweeney 24 2016
JP Energy Partners, LP Silver Dollar Pipeline Extension/Reagan County 55 2015
Knight Warrior, LLC Madison County–Houston County 160 2016
Medallion Pipeline Co., LLC Santa Rita Lateral/Reagan County 55 2016 Navigator Energy Services Big Spring Gateway System/
Martin, Glasscock, Howard, Midland Counties 450 2016
Plains All American Pipeline, LP Caddo Pipeline/Longview–Shreveport, LA 80 2015
Plains All American Pipeline, LP Three Rivers/Corpus Christi 125 2017
Progressive Pipeline/Phillips 66; Energy Transfer Partners, LP; Sunoco Logistics Partners, LP
Bayou Bridge Pipeline/Nederland, TX–Lake Charles, LA
60 2016
Pumpco, Inc.; Strike, LLC/ Sunoco Logistics
Permian Express Phase II/Colorado City–Wortham 308 2017
Two Rivers Pipeline/Frontier Energy Services
Alpha Crude Connection/Lea County, NM–Winkler County, TX 400 2017
MDS Boring and Drilling, Inc./ Strike
Houston, Grimes, Madison, and Walker Counties 50 2016
Price Gregory International, Inc./TransCanada Keystone Pipeline, LP
Chambers, Harris, and Liberty Counties
48 2015 Source: Based on data from (50).
47
Chapter 5. State Policy Implications
The two most recent PRC energy development publications (relating to crashes and pavement
condition) describe the public costs associated with increased O&G production (6, 7).
Costs of crashes, particularly rural crashes involving commercial motor vehicles (CMVs), have
the following impacts (7):
The cost of injuries resulting from rural CMV crashes in energy development
regions increased significantly and was largely responsible for the net increase in
the cost of injuries resulting from rural CMV crashes in the state from 2006–2009
to 2010–2013. In the Eagle Ford Shale region, the increase was $139 million in
economic costs or $801 million–$2 billion in comprehensive costs. In the Permian
Basin region, the increase was $176 million in economic costs or $1.03–
$2.0 billion in comprehensive costs.
This information adds to the 2012 report’s findings that increased energy development activity
will increase state highway needs by approximately $1 billion per year and have a similar impact
on county and local roads (4).
The pavement condition report shows a correlation between new wells and pavement
deterioration (6):
In general, as the number of new wells increases, pavement conditions deteriorate.
The correlation level varies significantly from region to region. Pavement
structures in the Eagle Ford Shale region have suffered the most, followed by
pavement structures in the Permian Basin region. Pavement structures in the
Barnett Shale region have begun to recover, although this is due in part to a
reduction in the number of new wells in recent years. The number of new wells
could be used as a predictor of changes in pavement conditions, which could
facilitate the allocation of limited maintenance dollars depending on the
anticipated need.
Furthermore, the report details the decreases in pavement condition associated with new
horizontal wells, which generate more intense truck activity. The report also mentions the
impacts of truck traffic to transport liquid waste to injection well sites in areas without sufficient
pipeline infrastructure for that purpose. The pavement condition report describes how
maintenance expenditures in energy development areas have gone up at a higher rate than
statewide, and at higher per-lane-mile amounts to keep up with drilling activity (6).
These findings demonstrate that while increased O&G drilling and production activity create
significant benefits for the state’s economy, particularly in spreading job and income growth into
rural areas outside the Texas Triangle, the O&G activity increases truck activity, which affects
infrastructure conditions and CMV safety. These effects in turn have real monetary costs for the
state.

48
The private sector is already responding to the new energy development business opportunities
by expanding pipeline capacity and offering more rail transloading facilities, as described in
Chapter 4. Both the expansion of pipelines (particularly pipelines that collect O&G from wells,
pipelines that transport liquids and gas to injection wells, and pipelines that distribute water to
wells) and the addition of new rail lines and facilities to serve O&G production areas may reduce
CMV mileage and the associated public costs. Some of these new rail facilities are being
developed with the participation of local economic development corporations and other public
investments.
Some of the state’s increased tax revenues from O&G activity are being allocated to
transportation needs. A portion of the O&G severance tax revenues that were deposited in the
state’s Economic Stabilization Fund and then transferred into the State Highway Fund under
Proposition 1 (2013) are now appropriated to upgrade and repair state highways affected by
energy development activities (estimated to be $121,627,400 for fiscal year 2016 and
$119,739,300 for fiscal year 2017). As those transferred funds go into the State Highway Fund,
they are dedicated to highway-related purposes as required by the Texas State Constitution. None
of the severance taxes collected through O&G activities are currently allocated to any
non-highway transportation purposes.
In 1997, the state created a State Infrastructure Bank (SIB), as authorized by federal law,
capitalizing a revolving loan program for transportation purposes. TxDOT reports that the Texas
Transportation Commission has approved 109 loans totaling more than $596 million from the
SIB program. TxDOT estimates that the loans have helped leverage more than $4.8 billion in
transportation projects in Texas (51). In Texas, SIB financial assistance can be granted to any
public or private entity authorized to construct, maintain, or finance a transportation project
eligible for funding under the existing federal highway rules (Title 23) to comply with SIB
requirements. This usually requires a project to be on a state’s highway system and included in
the statewide transportation improvement plan.
The state might consider the creation of a multimodal SIB, capitalized by funds other than the
State Highway Fund, so that SIB loans could be used for multimodal projects including freight
rail and pipelines. In developing such a program, the Texas Legislature could consider whether
projects that are estimated to reduce energy-development-related commercial truck traffic
(projects with expected reductions in truck crashes and reductions in pavement damage) could be
eligible for SIB loans that could leverage pipeline and rail projects, with loans to be repaid by
project developers (public or private). If such a program were to be authorized and a loan fund
capitalized, TxDOT would need to carefully consider the economic viability of the proposed
projects in light of unstable commodity prices. Estimates of project impacts on O&G well truck
activity would require updated traffic analyses that count trucks servicing existing wells with
new horizontal well drilling or continued fracking operations.
Why get involved with the private sector in railroads or pipelines? Fundamentally, the only
reason for the State of Texas to contemplate doing so is to advance clear public interests (as

49
mentioned in a PRC report on public freight rail projects) (52). As was the case in the public
freight rail projects, the public sector may want to be involved in a project with a for-profit
railroad or pipeline company for a number of reasons:
Public interest may not match business objectives. O&G producers may be agnostic
about how many trucks serve their facilities, or reducing truck trips may not have as
much private cost savings for the producer as it does for the public. Property owners with
mineral leases may receive royalties from O&G production, but they also pay county
property taxes that are used to repair county roads damaged by frequent heavy-truck
traffic. Their interests in reducing truck traffic are rarely reflected in the terms of their
O&G leases, so they have little influence on actual production activities.
There may be multiple producers with nearby wells. A number of different O&G
producers may be operating wells in close proximity with different leasing agreements
and multiple landowners—these competing interests may not be able or willing to
coordinate or cooperate in pipeline or rail projects that benefit the public by reducing
truck trips in and out of these concentrated well locations.
Railroads may not have access to capital to address public needs. This is particularly
true for short lines and RRTDs that may be able to use underused or soon-to-be-
abandoned rail lines to reach O&G production areas.
As Chapter 4 describes, the private sector is expanding non-highway transportation capacity
serving O&G production regions. A multimodal revolving loan program may allow the public
sector to further incentivize private activity that moves more O&G-related products, by-products,
equipment, and supplies with fewer trucks—a public policy goal that has the potential to bring
public benefits in better roads, lower maintenance costs, and fewer crashes involving larger
trucks.
One final note on state policy: private-sector railroads and pipeline companies are granted
statutory powers of eminent domain in the acquisition of property. Railroad companies are
granted this power in Chapter 112, Title 5 of the Texas Transportation Code, and
Sections 112.052 and 112.053 enumerate those powers. O&G pipeline operators can be
considered common carriers under Chapter 111, Title 3 of the Texas Natural Resources Code,
and Sections 111.019 and 111.0191 list the common carriers’ powers under state law. Chapter 21
of the Texas Property Code outlines standard procedures for the exercise of statutory authority
for eminent domain. As pipeline construction has increased in the past 10 years, so have the
concerns of Texas landowners about this particular application of eminent domain powers. The
issue has been extensively litigated and discussed in numerous legislative sessions, and the
subject is too complicated to fully discuss in this particular report. However, expanded private-
sector pipeline construction activity affects property owners in areas of the state outside the
O&G production areas. Since both the Texas Railroad Commission and TxDOT are under Sunset
Commission review during the 2016–2017 review cycle, the Texas Legislature may have an

50
opportunity to revisit the roles of both agencies in monitoring the use of eminent domain
authority by pipeline and railroad companies.
51
References
1. Texas Railroad Commission. Pipeline Safety. http://www.rrc.state.tx.us/pipeline-safety/.
Accessed March 9, 2016.
2. Bierling, D., M. Martin, A. See, C. Morgan, A. Bujanda, and N. Kelly. Energy
Development Impacts on State Roadways: A Review of DOT Policies, Programs and
Practices across Eight States. Report PRC 14-29 F. Transportation Policy Research
Center, Texas A&M Transportation Institute, College Station, Texas, 2014.
3. U.S. Energy Information Administration. Rankings: Total Energy Consumed per Capita,
2014 (Million Btu). http://www.eia.gov/state/rankings/?sid=US#/series/46. Accessed
February 15, 2015.
4. Quiroga, C., E. Fernando, and J. Oh. Energy Developments and the Transportation
Infrastructure in Texas: Impacts and Strategies. Report FHWA/TX-12/0-6498-1. Texas
A&M Transportation Institute, College Station, Texas, 2012.
5. Cooner, S., J. Crawford, J. Epps, E. Fernando, M. Le, D. Newcomb, C. Poe, C. Quiroga,
Y. Rathod, E. Seymour, B. Stockton, and A. Wimsatt. TxDOT Administration Research:
Tasks Completed FY 2012. Report FHWA/TX-13/0-6581-TI-4. Texas A&M
Transportation Institute, College Station, Texas, 2013.
6. Quiroga, C., I. Tsapakis, E. Kraus, J. Le, and A. Wimsatt. Oil and Gas Energy
Developments and Changes in Pavement Conditions in Texas. Report PRC 14-35F.
Transportation Policy Research Center, Texas A&M Transportation Institute, College
Station, Texas, 2015.
7. Quiroga, C., and I. Tsapakis. Oil and Gas Energy Developments and Changes in Crash
Trends in Texas. Report PRC 15-35F. Transportation Policy Research Center, Texas
A&M Transportation Institute, College Station, Texas, 2015.
8. Baker Hughes. Rig Count Overview and Summary Count. September 26, 2014.
http://phx.corporate-ir.net/phoenix.zhtml?c=79687&p=irol-rigcountsoverview. Accessed
October 30, 2014.
9. Baker Hughes. North America Rig Count: North America Rotary Rig Count Archive.
http://phx.corporate-ir.net/phoenix.zhtml?c=79687&p=irol-reportsother. Accessed
October 30, 2014.
10. U.S. Energy Information Administration. Lower 48 States Shale Plays. June 30, 2016.
http://www.eia.gov/maps/images/shale_gas_lower48.jpg. Accessed October 7, 2016.
11. Tunstall, T., and J. Oyakawa. Economic Impact of Oil and Gas Activities in the West
Texas Energy Consortium Region. Center for Community and Business Research,
University of Texas at San Antonio, San Antonio, Texas, 2014.

52
12. McCarthy, L. A., S. Park, P. Casazza, and A. R. Giancola. NCHRP Synthesis of Highway
Practice 469: Impacts of Energy Developments on U.S. Roads and Bridges.
Transportation Research Board, National Research Council, Washington, D.C., 2015.
13. Tribal Energy and Environmental Information Clearinghouse. Oil or Gas
Drilling/Development Phase: Resource Requirements and Impact Sources.
http://teeic.indianaffairs.gov/er/oilgas/activities/drilldev/index.htm. Accessed March 11,
2015.
14. Prozzi, J., S. Grebenschikov, A. Banerjee, and J. Prozzi. Impacts of Energy Developments
on the Texas Transportation System. Report 0-6513-1A. Center for Transportation
Research, The University of Texas at Austin, Austin, Texas, 2011.
15. Texas Department of Transportation. Pocket Facts. 2013. http://www.txdot.gov/inside-
txdot/division/communications/pocket-facts.html. Accessed February 25, 2015.
16. Road Information Program. Texas’ Top 100 Transportation Challenges and
Improvements Needed to Address Them. Washington, D.C., 2013.
17. Association of American Railroads. Moving Crude Oil by Rail. December 2013.
http://dot111.info/wp-content/uploads/2014/01/Crude-oil-by-rail.pdf. Accessed March 4,
2015.
18. Frittelli, J., A. Andrews, P. W. Parfomak, R. Pirog, J. L. Ramseuir, and M. Ratner. U.S.
Rail Transportation of Crude Oil: Background and Issues for Congress. Congressional
Research Service, Washington, D.C., December 2014.
19. Association of American Railroads. State Rankings. 2012. https://www.aar.org
/Style%20Library/railroads_and_states/dist/data/pdf/State%20rankings.pdf. Accessed
March 4, 2015.
20. Texas Department of Transportation. Texas Rail Plan, Revised Edition. Austin, Texas,
March 2011.
21. Morgan, C., J. Warner, J. Huang, R. Barkley, L. Loftus-Otway, N. Hutson, A. Cruz Ross,
and R. Niven. Abandoned Rail Corridors in Texas: A Policy and Infrastructure
Evaluation. Report FHWA/TX-11/0-6268-1. Texas A&M Transportation Institute,
College Station, Texas, March 2011.
22. Texas Legislative Council. Utilities Code. 2013. http://www.statutes.legis.state.tx.us
/Docs/SDocs/UTILITIESCODE.pdf. Accessed March 24, 2015.
23. U.S. Department of Transportation. Pipeline Glossary: Pipeline and Hazardous Materials
Safety Administration (PHMSA). http://primis.phmsa.dot.gov/comm/glossary/index
.htm?nocache=5088%23ASTMInternational#phmsa. Accessed March 24, 2015.
24. Pipeline 101. Other Means of Transport. 2013. http://www.pipeline101.com/why-do-we-
need-pipelines/other-means-of-transport. Accessed March 24, 2015.

53
25. U.S. Energy Information Administration. Short-Term Energy Outlook Supplement: Key
Drivers for EIA’s Short-Term U.S. Crude Oil Production Outlook. February 14, 2013.
https://www.eia.gov/forecasts/steo/special/pdf/2013_sp_02.pdf. Accessed March 24,
2015.
26. U.S. Energy Information Administration. Rankings: Crude Oil Production. February
2015. http://www.eia.gov/state/rankings/#/series/46. Accessed June 18, 2015.
27. Colorado Department of Local Affairs. Energy/Mineral Impact Assistance Fund Grant
(EIAF). https://www.colorado.gov/pacific/dola/energymineral-impact-assistance-fund-
eiaf. Accessed June 15, 2015.
28. Brown, C. State Revenues and the Natural Gas Boom: An Assessment of State Oil and
Gas Production Taxes. June 2013. http://www.ncsl.org/documents/energy
/pdf_version_final.pdf. Accessed June 18, 2015.
29. Fong, C. State and Local Taxes: An Overview and Comparative Guide. North Dakota
Office of State Tax Commissioner, 2012. http://www.nd.gov/tax/data/upfiles/media
/2012-redbook.pdf?20160808125313. Accessed June 15, 2015.
30. Pennsylvania Public Utility Commission. Act 13 of 2012 Unconventional Gas Well
Impact Fee: Annual Report of Fund Revenue and Disbursements. September 30, 2014.
http://www.puc.state.pa.us/NaturalGas/pdf/MarcellusShale/Gas_Well_PUC_Rpt_101514
.pdf. Accessed June 29, 2015.
31. West Virginia Department of Transportation. Memorandum—Oil and Gas Policy
Addendum. February 5, 2013. http://www.transportation.wv.gov/highways/policies
/Documents/OilAndGasPolicyAddendum.pdf. Accessed June 29, 2015.
32. Pennsylvania Department of Transportation. Posted and Bonded FAQ’s.
http://www.penndot.gov/ProjectAndPrograms/PostedBondedRoadway/Pages/Posted-and-
Bonded-FAQ's.aspx. Accessed June 23, 2015.
33. Iowa Pacific Railroad. Enhancements to Improve Velocity, Safety. Iowa Pacific
Dispatch, Fourth Quarter 2009. http://www.iowapacific.com/wp-content/uploads
/2016/02/IPD0909.pdf. Accessed June 23, 2015.
34. Watco Companies. Texas and New Mexico Railway (TXN).
https://www.watcocompanies.com/services/rail/texas-new-mexico-railway-txn/ Accessed
August 11, 2016.
35. Morgan, C. A., J. E. Warner, and B. R. Sperry. Rural Rail Transportation Districts
(RRTDs) Update. Texas A&M Transportation Institute, College Station, Texas, June
2013. http://ftp.dot.state.tx.us/pub/txdot-info/rail/rural/rrtd-update.pdf. Accessed
March 2, 2015.

54
36. Frac Resources and Frontier Logistics. Mission Rail Park (brochure). 2015.
http://missionrailpark.com/images/pdfs/LOWREZ_Mission_Brochure.pdf. Accessed
March 2, 2015.
37. National Property Holdings. Alamo Junction Rail Park: Park Features.
http://www.alamojunction.com/. Accessed March 2, 2015.
38. Bowen, D. J. Railway Age’s 2013 Short Line of the Year: Gardendale Railroad. April 8,
2013. http://www.railwayage.com/index.php/freight/short-lines/railway-ages-2013-short-
line-of-the-year-gardendale-railroad.html. Accessed February 18, 2015.
39. MacCormack, J. Gardendale Railroad No Longer Trivial. April 13, 2012.
http://www.mysanantonio.com/news/local_news/article/Gardendale-no-longer-trivial-
3478247.php#photo-2809531. Accessed March 23, 2015.
40. Gardendale Railroad. Welcome to Gardendale Railroad, Inc. 2013.
http://www.gardendalerail.com/. Accessed Feb. 27, 2015.
41. Live Oak Railroad. Home: Eagle Ford Rail. http://www.eaglefordrail.com/. Accessed
February 27, 2015.
42. Live Oak Railroad. About: Location and Site Plan.
http://www.eaglefordrail.com/location--site-plan.html. Accessed February 27, 2015.
43. Hiller, J. New Eagle Ford Rail Park Coming to Bexar County. Fuel Fix, May 16, 2013.
http://fuelfix.com/blog/2013/05/16/new-eagle-ford-rail-park-coming-to-bexar-county/.
Accessed December 2, 2014.
44. Texas Department of Transportation. South Orient Rail Line Benefit Cost Analysis.
January 2015. https://ftp.dot.state.tx.us/pub/txdot-info/rail/south_orient/benefit-cost-
analysis.pdf. Accessed May 17, 2014.
45. Texas Department of Transportation. Map of South Orient Rail Line. July 13, 2010.
http://ftp.dot.state.tx.us/pub/txdot-info/rail/south_orient/map.pdf. Accessed May 17,
2014.
46. Texas Department of Transportation. 2014 Annual Inspection of the South Orient Rail
Line under Lease to Texas Pacifico Transportation Company. March 3–5, 2014.
http://ftp.dot.state.tx.us/pub/txdot-info/rail/south_orient/inspection/2014.pdf. Accessed
May 17, 2014.
47. Progressive Railroading. BNSF Opens Permian Basin-Based Logistics Center in Texas.
July 11, 2014. http://www.progressiverailroading.com/bnsf_railway/article/BNSF-opens-
Permian-Basinbased-logistics-center-in-Texas--42530. Accessed March 9, 2016.

55
48. Sweetwater Economic Development Corporation. BNSF, Developers Revitalize Rail
Yard to Support Growth in Permian Basin. November 6, 2014.
http://www.sweetwatertexas.net/news/bnsf-developers-revitalize-rail-yard-support-
growth-permian-basin. Accessed March 9, 2016.
49. U.S. Energy Information Administration. Natural Gas Pipeline Capacity and Utilization:
Interstate Pipeline Capacity on a State-to-State Level. 2015. https://www.eia.gov/pub
/oil_gas/natural_gas/analysis_publications/ngpipeline/usage.html. Accessed March 9,
2016.
50. Construction Scorecard, North American Pipelines under Construction. Pipeline and Gas
Journal, December 2015. http://pgj-wp-media.s3.amazonaws.com/wp-
content/uploads/sites/2/2015/12/11PGJ_15_Scorecard.pdf. Accessed March 9, 2016.
51. Texas Department of Transportation. State Infrastructure Bank (SIB).
http://www.txdot.gov/inside-txdot/division/debt/sib.html. Accessed August 11, 2016.
52. Rutter, A. Considerations for Public Freight Rail Projects in Texas. Report PRC 15-57F.
Transportation Policy Research Center, Texas A&M Transportation Institute, College
Station, Texas, September 2015.