OFRewind: Enabling Record and Replay Troubleshooting...
14
OFRewind: Enabling Record and Replay Troubleshooting for Networks Andreas Wundsam * Dan Levin * Srini Seetharaman ‡ Anja Feldmann * * Deutsche Telekom Laboratories / TU Berlin, {andi,dan,anja}@net.t-labs.tu-berlin.de ‡ Deutsche Telekom Inc., R&D Lab USA, [email protected] Abstract Debugging operational networks can be a daunting task, due to their size, distributed state, and the presence of black box components such as commercial routers and switches, which are poorly instrumentable and only coarsely configurable. The debugging tool set available to administrators is limited, and provides only aggre- gated statistics (SNMP), sampled data (NetFlow/sFlow), or local measurements on single hosts (tcpdump). In this paper, we leverage split forwarding architectures such as OpenFlow to add record and replay debugging capabil- ities to networks – a powerful, yet currently lacking ap- proach. We present the design of OFRewind, which en- ables scalable, multi-granularity, temporally consistent recording and coordinated replay in a network, with fine- grained, dynamic, centrally orchestrated control over both record and replay. Thus, OFRewind helps op- erators to reproduce software errors, identify data-path limitations, or locate configuration errors. 1 Introduction Life as a network operator can be hard. In spite of many efforts to the contrary, problem localization and trou- bleshooting in operational networks still remain largely unsolved problems today. Consider the following anec- dotal evidence: Towards the end of October 2009, the administrators of the Stanford production OpenFlow network began ob- serving strange CPU usage patterns in their switches. The CPU utilization oscillated between 25% and 100% roughly every 30 minutes and led to prolonged flow setup times, which where unacceptable for many users. The network operators began debugging the problem using standard tools and data sets, including SNMP statistics, however the cause for the oscillation of the switch CPU remained inexplicable. Even an analysis of the entire control channel data could not shed light on the cause of the problem, as no observed parameter (number of: packets in, packets out, flow modifications, flow expira- tions, statistics requests, and statistics replies) seemed to correlate with the CPU utilization. This left the network operator puzzled regarding the cause of the problem. This anecdote (further discussion in Section 4.2) hints at some of the challenges encountered when debugging problems in networks. Networks typically contain black box devices, e.g., commercial routers, switches, and mid- dleboxes, that can be only coarsely configured and in- strumented, via command-line or simple protocols such as SNMP. Often, the behavior of black box components in the network cannot be understood by analytical means alone – controlled replay and experimentation is needed. Furthermore, network operators remain stuck with a fairly simplistic arsenal of tools. Many operators re- cord statistics via NetFlow or sFlow [33]. These tools are valuable for observing general traffic trends, but of- ten too coarse to pinpoint the origin problems. Collect- ing full packet traces, e.g., by tcpdump or specialized hardware, is often unscalable due to high volume data plane traffic. Even when there is a packet trace avail- able, it typically only contains the traffic of a single VLAN or switch port. It is thus difficult to infer tempo- ral or causal relationships between messages exchanged between multiple ports or devices. Previous attempts have not significantly improved the situation. Tracing frameworks such as XTrace [35] and Netreplay [11] enhance debugging capabilities by per- vasively instrumenting the entire network ecosystem, but face serious deployment hurdles due to the scale of changes involved. There are powerful tools avail- able in the context of distributed applications that enable fully deterministic recording and replay, oriented toward end hosts [16, 24]. However, overhead for the fully- deterministic recording of a large network with high data rates can be prohibitive and the instrumentation of ’black’ middleboxes and closed source software often re- mains out of reach. 1
Transcript of OFRewind: Enabling Record and Replay Troubleshooting...
OFRewind: Enabling Record and Replay
Troubleshooting for Networks
Andreas Wundsam∗ Dan Levin∗ Srini Seetharaman‡ Anja Feldmann∗
∗ Deutsche Telekom Laboratories / TU Berlin, {andi,dan,anja}@net.t-labs.tu-berlin.de
‡ Deutsche Telekom Inc., R&D Lab USA, [email protected]
Abstract
Debugging operational networks can be a daunting task,
due to their size, distributed state, and the presence
of black box components such as commercial routers
and switches, which are poorly instrumentable and only
coarsely configurable. The debugging tool set available
to administrators is limited, and provides only aggre-
gated statistics (SNMP), sampled data (NetFlow/sFlow),
or local measurements on single hosts (tcpdump). In this
paper, we leverage split forwarding architectures such as
OpenFlow to add record and replay debugging capabil-
ities to networks – a powerful, yet currently lacking ap-
proach. We present the design of OFRewind, which en-
ables scalable, multi-granularity, temporally consistent
recording and coordinated replay in a network, with fine-
grained, dynamic, centrally orchestrated control over
both record and replay. Thus, OFRewind helps op-
erators to reproduce software errors, identify data-path
limitations, or locate configuration errors.
1 Introduction
Life as a network operator can be hard. In spite of many
efforts to the contrary, problem localization and trou-
bleshooting in operational networks still remain largely
unsolved problems today. Consider the following anec-
dotal evidence:
Towards the end of October 2009, the administrators
of the Stanford production OpenFlow network began ob-
serving strange CPU usage patterns in their switches.
The CPU utilization oscillated between 25% and 100%
roughly every 30 minutes and led to prolonged flow setup
times, which where unacceptable for many users. The
network operators began debugging the problem using
standard tools and data sets, including SNMP statistics,
however the cause for the oscillation of the switch CPU
remained inexplicable. Even an analysis of the entire
control channel data could not shed light on the cause
of the problem, as no observed parameter (number of:
packets in, packets out, flow modifications, flow expira-
tions, statistics requests, and statistics replies) seemed to
correlate with the CPU utilization. This left the network
operator puzzled regarding the cause of the problem.
This anecdote (further discussion in Section 4.2) hints
at some of the challenges encountered when debugging
problems in networks. Networks typically contain black
box devices, e.g., commercial routers, switches, and mid-
dleboxes, that can be only coarsely configured and in-
strumented, via command-line or simple protocols such
as SNMP. Often, the behavior of black box components
in the network cannot be understood by analytical means
alone – controlled replay and experimentation is needed.
Furthermore, network operators remain stuck with a
fairly simplistic arsenal of tools. Many operators re-
cord statistics via NetFlow or sFlow [33]. These tools
are valuable for observing general traffic trends, but of-
ten too coarse to pinpoint the origin problems. Collect-
ing full packet traces, e.g., by tcpdump or specialized
hardware, is often unscalable due to high volume data
plane traffic. Even when there is a packet trace avail-
able, it typically only contains the traffic of a single
VLAN or switch port. It is thus difficult to infer tempo-
ral or causal relationships between messages exchanged
between multiple ports or devices.
Previous attempts have not significantly improved the
situation. Tracing frameworks such as XTrace [35] and
Netreplay [11] enhance debugging capabilities by per-
vasively instrumenting the entire network ecosystem,
but face serious deployment hurdles due to the scale
of changes involved. There are powerful tools avail-
able in the context of distributed applications that enable
fully deterministic recording and replay, oriented toward
end hosts [16, 24]. However, overhead for the fully-
deterministic recording of a large network with high
data rates can be prohibitive and the instrumentation of
’black’ middleboxes and closed source software often re-
mains out of reach.
1
In this paper, we present a new approach to enable
practical network recording and replay, based upon an
emerging class of network architectures called split for-
warding architectures, such as OpenFlow [28], Tesser-
act [41], and Forces [2]. These architectures split con-
trol plane decision-making off from data plane forward-
ing. In doing so, they enable custom programmability
and centralization of the control plane, while allowing
for commodity high-throughput, high-fanout data plane
forwarding elements.
We discuss, in Section 2, the design of OFRewind,
a tool that takes advantage of these properties to sig-
nificantly improve the state-of-the-art for recording and
replaying network domains. OFRewind enables scal-
able, temporally consistent, centrally controlled network
recording and coordinated replay of traffic in an Open-
Flow controller domain. It takes advantage of the flex-
ibility afforded by the programmable control plane, to
dynamically select data plane traffic for recording. This
improves data-path component scalability and enables
always-on recording of critical, low-volume traffic, e.g.,
routing control messages. Indeed, a recent study has
shown that the control plane traffic accounts for less than
1% of the data volume, but 95 − 99% of the observed
bugs [10]. Data plane traffic can be load-balanced across
multiple data plane recorders. This enables record-
ing even in environments with high data rates. Finally,
thanks to the centralized perspective of the controller,
OFRewind can record a temporally consistent trace of
the controller domain. This facilitates investigation of
the temporal and causal interdependencies of the mes-
sages exchanged between the devices in the controller
domain.
During replay, OFRewind enables the operator to se-
lect which parts of the traces are to be replayed and how
they should be mapped to the replay environment. By
partitioning (or bisecting) the trace and automatically re-
peating the experiment, our tool helps to narrow down
and isolate the problem causing component or traffic. A
concrete implementation of the tool based on OpenFlow
is presented in Section 3 and is released as free and open
source software [4].
Our work is primarily motivated by operational issues
in the OpenFlow-enabled production network at Stan-
ford University. Accordingly, we discuss several case
studies where our system has proven useful, including:
switch CPU inflation, broadcast storms, anomalous for-
warding, NOX packet parsing errors, and other invalid
controller actions (Section 4). We in addition present a
case study in which OFRewind successfully pinpoints
faulty behavior in the Quagga RIP software routing dae-
mon. This indicates that OFRewind is not limited to
locating OpenFlow-specific bugs alone, but can also be
used to reproduce other network anomalies.
Our evaluation (Section 5) shows (a) that the tool
scales at least as well as current OpenFlow hardware
implementations, (b) that recording does not impose an
undue performance penalty on the throughput achieved,
and (c) that the messaging overhead for synchronization
in our production network is limited to 1.13% of all data
plane traffic.
While using our tool, we have made and incorporated
the following key observations:
(1) A full recording of all events in an entire pro-
duction network is infeasible, due to the data volumes
involved and their asynchronous nature. However, one
usually needs not record all information to be able to re-
produce or pinpoint a failure. It suffices to focus on rel-
evant subparts, e.g., control messages or packet headers.
By selectively recording critical traffic subsets, we can
afford to turn recording on by default and thus reproduce
many unforeseen problems post facto.
(2) Partial recordings, while missing some data neces-
sary for fully deterministic replay, can be used to repro-
duce symptomatic network behavior, useful for gaining
insights in many debugging situations. With careful ini-
tialization, the behavior of many network devices turns
out to be deterministic with respect to the network input.
(3) By replaying subsets of traffic at a controlled pace,
we can, in many cases, rapidly repeat experiments with
different settings (parameters/code hooks) while still re-
producing the error. We can, for instance, bisect the traf-
fic and thus localize the sequence of messages leading to
an error.
In summary, OFRewind is, to the best of our knowl-
edge, the first tool which leverages the properties of split
architecture forwarding to enable practical and economi-
cally feasible recording and replay debugging of network
domains. It has proven useful in a variety of practical
case studies, and our evaluation shows OFRewind does
not significantly affect the scalability of OpenFlow con-
troller domains and does not introduce undue overhead.
2 OFRewind System Design
In this section, we discuss the expected operational en-
vironment of OFRewind, its design goals, and the com-
ponents and their interaction. We then focus on the need
to synchronize specific system components during oper-
ation.
2.1 Environment / Abstractions
We base our system design upon split forwarding archi-
tectures, for instance, OpenFlow [28], Tesseract [41], or
Forces [2], in which standardized data plane elements
(switches) perform fast and efficient packet forwarding,
and the control plane is programmable via an external
2
DataStore
OF-Controller
OFRewind
of-sw1 of-sw3
of-sw2
DataStore
(a) System components
OFRewind
Ofrecord Ofreplay
DataStore
DatareplayDatarecord
(b) Software modules
DatarecordDatarecord Datarecord
L4 to L8
Data-Plane
Ofrecord
OpenFlow
Ctrl-PlaneOpenFlow
Data-Plane
L2
Ctrl-Plane
(e.g. ARP)
L2
Data-PlaneTo
Controller
To
Switch
L4
Ctrl-Plane
(e.g. RSVP)
L3
Data-PlaneL3
Ctrl-Plane
(e.g. RIP)
(c) Traffic strata
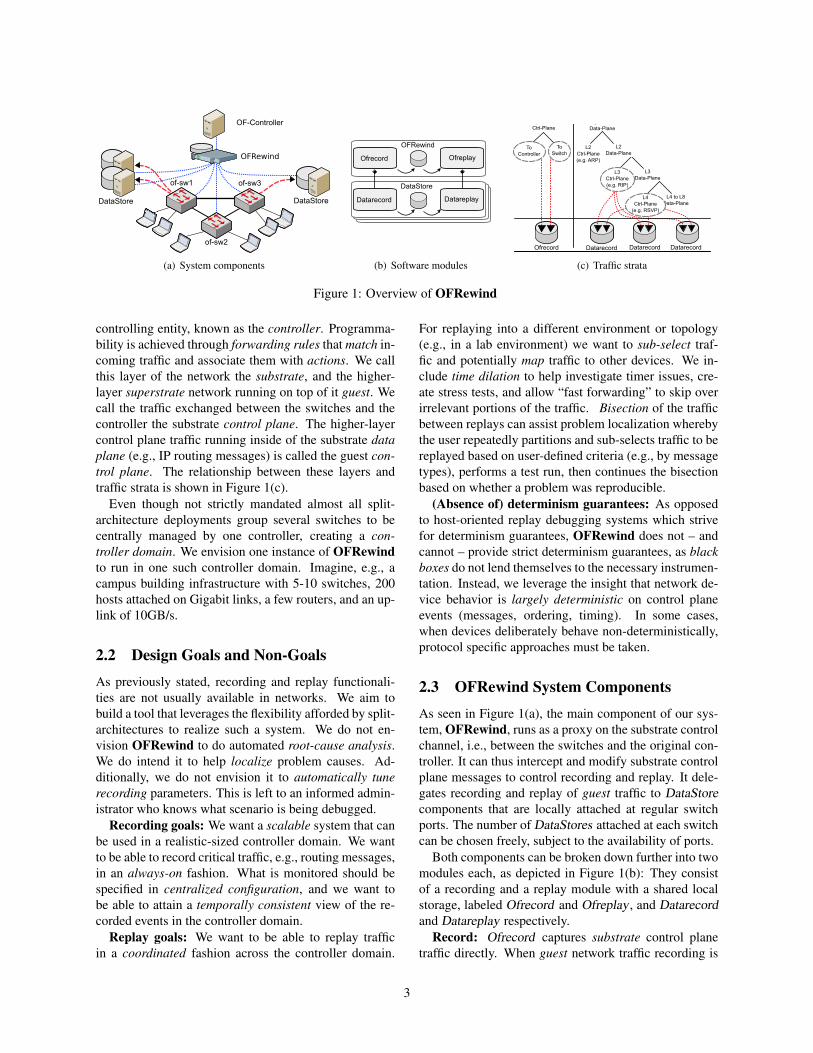
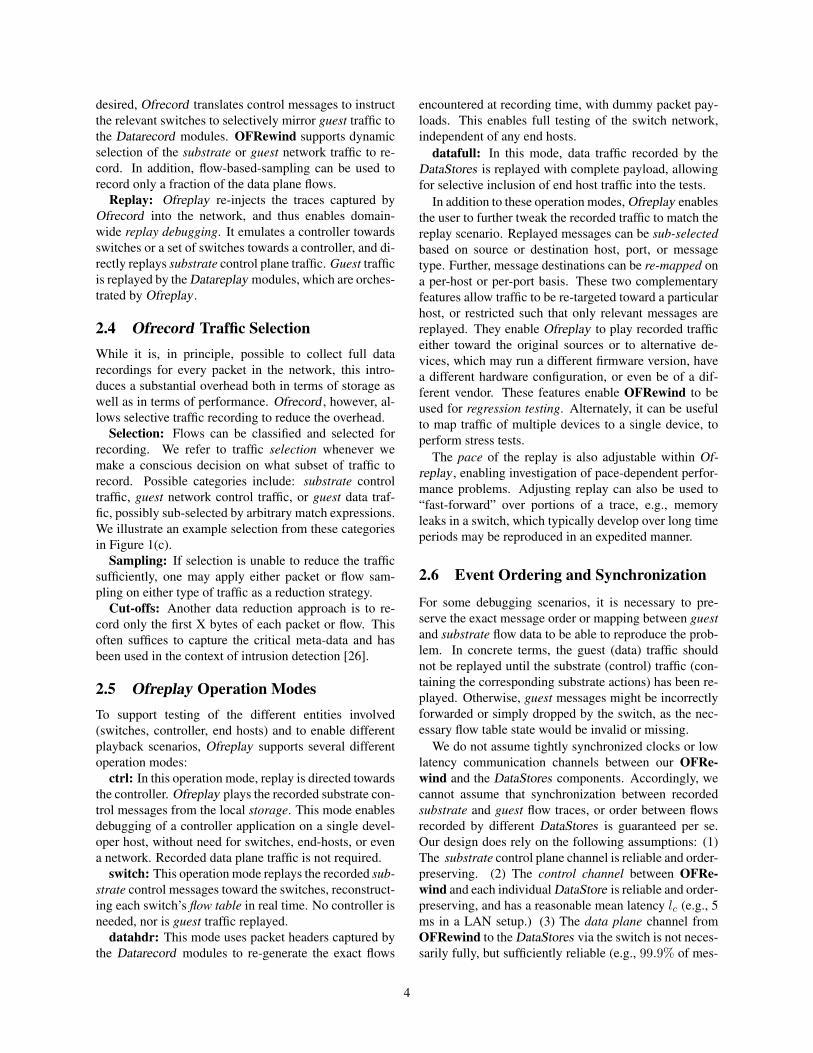
Figure 1: Overview of OFRewind
controlling entity, known as the controller. Programma-
bility is achieved through forwarding rules that match in-
coming traffic and associate them with actions. We call
this layer of the network the substrate, and the higher-
layer superstrate network running on top of it guest. We
call the traffic exchanged between the switches and the
controller the substrate control plane. The higher-layer
control plane traffic running inside of the substrate data
plane (e.g., IP routing messages) is called the guest con-
trol plane. The relationship between these layers and
traffic strata is shown in Figure 1(c).
Even though not strictly mandated almost all split-
architecture deployments group several switches to be
centrally managed by one controller, creating a con-
troller domain. We envision one instance of OFRewind
to run in one such controller domain. Imagine, e.g., a
campus building infrastructure with 5-10 switches, 200
hosts attached on Gigabit links, a few routers, and an up-
link of 10GB/s.
2.2 Design Goals and Non-Goals
As previously stated, recording and replay functionali-
ties are not usually available in networks. We aim to
build a tool that leverages the flexibility afforded by split-
architectures to realize such a system. We do not en-
vision OFRewind to do automated root-cause analysis.
We do intend it to help localize problem causes. Ad-
ditionally, we do not envision it to automatically tune
recording parameters. This is left to an informed admin-
istrator who knows what scenario is being debugged.
Recording goals: We want a scalable system that can
be used in a realistic-sized controller domain. We want
to be able to record critical traffic, e.g., routing messages,
in an always-on fashion. What is monitored should be
specified in centralized configuration, and we want to
be able to attain a temporally consistent view of the re-
corded events in the controller domain.
Replay goals: We want to be able to replay traffic
in a coordinated fashion across the controller domain.
For replaying into a different environment or topology
(e.g., in a lab environment) we want to sub-select traf-
fic and potentially map traffic to other devices. We in-
clude time dilation to help investigate timer issues, cre-
ate stress tests, and allow “fast forwarding” to skip over
irrelevant portions of the traffic. Bisection of the traffic
between replays can assist problem localization whereby
the user repeatedly partitions and sub-selects traffic to be
replayed based on user-defined criteria (e.g., by message
types), performs a test run, then continues the bisection
based on whether a problem was reproducible.
(Absence of) determinism guarantees: As opposed
to host-oriented replay debugging systems which strive
for determinism guarantees, OFRewind does not – and
cannot – provide strict determinism guarantees, as black
boxes do not lend themselves to the necessary instrumen-
tation. Instead, we leverage the insight that network de-
vice behavior is largely deterministic on control plane
events (messages, ordering, timing). In some cases,
when devices deliberately behave non-deterministically,
protocol specific approaches must be taken.
2.3 OFRewind System Components
As seen in Figure 1(a), the main component of our sys-
tem, OFRewind, runs as a proxy on the substrate control
channel, i.e., between the switches and the original con-
troller. It can thus intercept and modify substrate control
plane messages to control recording and replay. It dele-
gates recording and replay of guest traffic to DataStore
components that are locally attached at regular switch
ports. The number of DataStores attached at each switch
can be chosen freely, subject to the availability of ports.
Both components can be broken down further into two
modules each, as depicted in Figure 1(b): They consist
of a recording and a replay module with a shared local
storage, labeled Ofrecord and Ofreplay, and Datarecord
and Datareplay respectively.
Record: Ofrecord captures substrate control plane
traffic directly. When guest network traffic recording is
3
desired, Ofrecord translates control messages to instruct
the relevant switches to selectively mirror guest traffic to
the Datarecord modules. OFRewind supports dynamic
selection of the substrate or guest network traffic to re-
cord. In addition, flow-based-sampling can be used to
record only a fraction of the data plane flows.
Replay: Ofreplay re-injects the traces captured by
Ofrecord into the network, and thus enables domain-
wide replay debugging. It emulates a controller towards
switches or a set of switches towards a controller, and di-
rectly replays substrate control plane traffic. Guest traffic
is replayed by the Datareplay modules, which are orches-
trated by Ofreplay.
2.4 Ofrecord Traffic Selection
While it is, in principle, possible to collect full data
recordings for every packet in the network, this intro-
duces a substantial overhead both in terms of storage as
well as in terms of performance. Ofrecord , however, al-
lows selective traffic recording to reduce the overhead.
Selection: Flows can be classified and selected for
recording. We refer to traffic selection whenever we
make a conscious decision on what subset of traffic to
record. Possible categories include: substrate control
traffic, guest network control traffic, or guest data traf-
fic, possibly sub-selected by arbitrary match expressions.
We illustrate an example selection from these categories
in Figure 1(c).
Sampling: If selection is unable to reduce the traffic
sufficiently, one may apply either packet or flow sam-
pling on either type of traffic as a reduction strategy.
Cut-offs: Another data reduction approach is to re-
cord only the first X bytes of each packet or flow. This
often suffices to capture the critical meta-data and has
been used in the context of intrusion detection [26].
2.5 Ofreplay Operation Modes
To support testing of the different entities involved
(switches, controller, end hosts) and to enable different
playback scenarios, Ofreplay supports several different
operation modes:
ctrl: In this operation mode, replay is directed towards
the controller. Ofreplay plays the recorded substrate con-
trol messages from the local storage. This mode enables
debugging of a controller application on a single devel-
oper host, without need for switches, end-hosts, or even
a network. Recorded data plane traffic is not required.
switch: This operation mode replays the recorded sub-
strate control messages toward the switches, reconstruct-
ing each switch’s flow table in real time. No controller is
needed, nor is guest traffic replayed.
datahdr: This mode uses packet headers captured by
the Datarecord modules to re-generate the exact flows
encountered at recording time, with dummy packet pay-
loads. This enables full testing of the switch network,
independent of any end hosts.
datafull: In this mode, data traffic recorded by the
DataStores is replayed with complete payload, allowing
for selective inclusion of end host traffic into the tests.
In addition to these operation modes, Ofreplay enables
the user to further tweak the recorded traffic to match the
replay scenario. Replayed messages can be sub-selected
based on source or destination host, port, or message
type. Further, message destinations can be re-mapped on
a per-host or per-port basis. These two complementary
features allow traffic to be re-targeted toward a particular
host, or restricted such that only relevant messages are
replayed. They enable Ofreplay to play recorded traffic
either toward the original sources or to alternative de-
vices, which may run a different firmware version, have
a different hardware configuration, or even be of a dif-
ferent vendor. These features enable OFRewind to be
used for regression testing. Alternately, it can be useful
to map traffic of multiple devices to a single device, to
perform stress tests.
The pace of the replay is also adjustable within Of-
replay, enabling investigation of pace-dependent perfor-
mance problems. Adjusting replay can also be used to
“fast-forward” over portions of a trace, e.g., memory
leaks in a switch, which typically develop over long time
periods may be reproduced in an expedited manner.
2.6 Event Ordering and Synchronization
For some debugging scenarios, it is necessary to pre-
serve the exact message order or mapping between guest
and substrate flow data to be able to reproduce the prob-
lem. In concrete terms, the guest (data) traffic should
not be replayed until the substrate (control) traffic (con-
taining the corresponding substrate actions) has been re-
played. Otherwise, guest messages might be incorrectly
forwarded or simply dropped by the switch, as the nec-
essary flow table state would be invalid or missing.
We do not assume tightly synchronized clocks or low
latency communication channels between our OFRe-
wind and the DataStores components. Accordingly, we
cannot assume that synchronization between recorded
substrate and guest flow traces, or order between flows
recorded by different DataStores is guaranteed per se.
Our design does rely on the following assumptions: (1)
The substrate control plane channel is reliable and order-
preserving. (2) The control channel between OFRe-
wind and each individual DataStore is reliable and order-
preserving, and has a reasonable mean latency lc (e.g., 5
ms in a LAN setup.) (3) The data plane channel from
OFRewind to the DataStores via the switch is not neces-
sarily fully, but sufficiently reliable (e.g., 99.9% of mes-
4
sages arrive). It is not required to be order-preserving
in general, but there should be some means of explicitly
guaranteeing order between two messages. We define the
data plane channel mean latency as ld.
Record: Based on these assumptions, we define a log-
ical clock C [25] on Ofrecord , incremented for each sub-
strate control message as they arrive at Ofrecord . Ofre-
cord logs the value of C with each substrate control mes-
sage. It also broadcasts the value of C to the DataStores
in two kinds of synchronization markers: time binning
markers and flow creation markers.
Time binning markers are sent out at regular time in-
tervals it, e.g., every 100ms. They group flows into bins
and thus constrain the search space for matching flows
during replay and help reconstruct traffic characteristics
within flows. Note that they do not impose a strict order
on the flows within a time bin.
Flow creation markers are optionally sent out when-
ever a new flow is created. Based on the previous as-
sumptions, they induce a total ordering on all flows
whose creation markers have been successfully recorded.
However, their usage limits the scalability of the system,
as they must be recorded by all DataStores .
Replay: For synchronization during replay, Ofreplay
assumes the role of a synchronization master, reading the
value of C logged with the substrate messages. When a
DataStore hits a synchronization marker while replaying,
it synchronizes with Ofreplay before continuing. This
assures that in the presence of time binning markers, the
replay stays loosely synchronized between the markers
(within an interval I = it + ld + lc). In the presence
of flow creation markers, it guarantees that the order be-
tween the marked flows will be preserved.
2.7 Typical Operation
We envision that users of OFRewind run Ofrecord in
an always-on fashion, always recording selected sub-
strate control plane traffic (e.g., OpenFlow messages)
onto a ring storage. If necessary, selected guest traffic
can also be continuously recorded on Datarecord . To
preserve space, low-rate control plane traffic, e.g., rout-
ing announcements, may be selected, sampling may be
used, and/or the ring storage may be shrunk. When
the operator (or an automated analytics tool) detects an
anomaly, a replay is launched onto a separate set of hard-
ware, or onto the production network during off-peak
times. Recording settings are adapted as necessary un-
til the anomaly can be reproduced during replay.
During replay, one typically uses some kind of debug-
ging by elimination, either by performing binary search
along the time axis or by eliminating one kind of message
at a time. Hereby, it is important to choose orthogonal
subsets of messages for effective problem localization.
3 Implementation
In this section, we describe the implementation of OF-
Rewind based on OpenFlow, selected for currently be-
ing the most widely used split forwarding architecture.
OpenFlow is currently in rapid adoption by testbeds [20],
university campuses [1], and commercial vendors [3].
OpenFlow realizes split forwarding architecture as an
open protocol between packet-forwarding hardware and
a commodity PC (the controller). The protocol allows
the controller to exercise flexible and dynamic control
over the forwarding behavior of OpenFlow enabled Eth-
ernet switches at a per-flow level. The definition of a
flow can be tailored to the specific application case—
OpenFlow supports an 11-tuple of packet header parts,
against which incoming packets can be matched, and
flows classified. These range from Layer 1 (switch
ports), to Layer 2 and 3 (MAC and IP addresses), to
Layer 4 (TCP and UDP ports). The set of matching rules,
and the actions associated with and performed on each
match are held in the switch and known as the flow table.
We next discuss the implementation of OFRewind,
the synchronization among the components and dis-
cuss the benefits, limitations, and best-practices of using
OpenFlow to implement our system. The implementa-
tion, which is an OpenFlow controller in itself, and based
on the source code of FlowVisor [36] is available under
a free and open source license at [4].
3.1 Software Modules
To capture both the substrate control traffic and guest
network traffic we use a hybrid strategy for implement-
ing OFRewind. Reconsider the example shown in Fig-
ure 1(a) from an OpenFlow perspective. We deploy
a proxy server in the OpenFlow protocol path (labeled
OFRewind) and attach local DataStore nodes to the
switches. The OFRewind node runs the Ofrecord and
Ofreplay modules, and the DataStore nodes run Datare-
cord and Datareplay, respectively. We now discuss the
implementation of the four software components Ofre-
cord , Datarecord , Ofreplay and Datareplay.
Ofrecord : Ofrecord intercepts all messages passing
between the switches and controller and applies the se-
lection rules. It then stores the selected OpenFlow con-
trol (substrate) messages to locally attached data stor-
age. Optionally, the entire flow table of the switch can
be dumped on record startup. If recording of the guest
network control and/or data traffic is performed, Of-
record transforms the FLOW-MOD and PACKET-OUT
commands sent from the controller to the switch to du-
plicate the packets of selected flows to a DataStore at-
tached to a switch along flow path. Multiple DataStores
can be attached to each switch, .e.g., for load-balancing.
The order of flows on the different DataStores in the sys-
5
tem is retained with the help of synchronization markers.
Any match rule supported by OpenFlow can be used for
packet selection. Additionally, flow-based-sampling can
be used to only record a fraction of the flows.
Datarecord : The Datarecord components located
on the DataStores record the selected guest traffic, as
well as synchronization and control metadata. They are
spawned and controlled by Ofrecord . Their implemen-
tation is based on tcpdump, modified to be controlled
by Ofrecord via a TCP socket connection. Data reduc-
tion strategies that cannot be implemented with Open-
Flow rules (e.g., packet sampling, cut-offs) are executed
by Datarecord before writing the data to disk.
Ofreplay: Ofreplay re-injects OpenFlow control
plane messages as recorded by Ofrecord into the network
and orchestrates the guest traffic replay by the Datare-
play components on the DataStores . It supports replay
towards the controller and switches, and different lev-
els of data plane involvement (switch, datahdr, datafull,
see Section 2.5.) Optionally, a flow table dump created
by Ofrecord can be installed into the switches prior to
replay. It supports traffic sub-selection and mapping to-
wards different hardware and time dilation.
Datareplay: The Datareplay components are respon-
sible for re-injecting guest traffic into the network. They
interact with and are controlled by Ofreplay for tim-
ing and synchronization. The implementation is based
on tcpreplay. Depending on the record and replay
mode, they reconstruct or synthesize missing data before
replay, e.g., dummy packet payloads, when only packet
headers have been recorded.
3.2 Synchronization
As we do not assume precise time synchronization be-
tween Ofrecord and the DataStores , the implementation
uses time binning markers and flow creation markers, as
discussed in Section 2.6. These are packets with unique
ids flooded to all DataStores and logged by Ofrecord .
The ordering of these markers relative to the recorded
traffic is ensured by OpenFlow BARRIER messages1.
We now discuss by example how the markers are used.
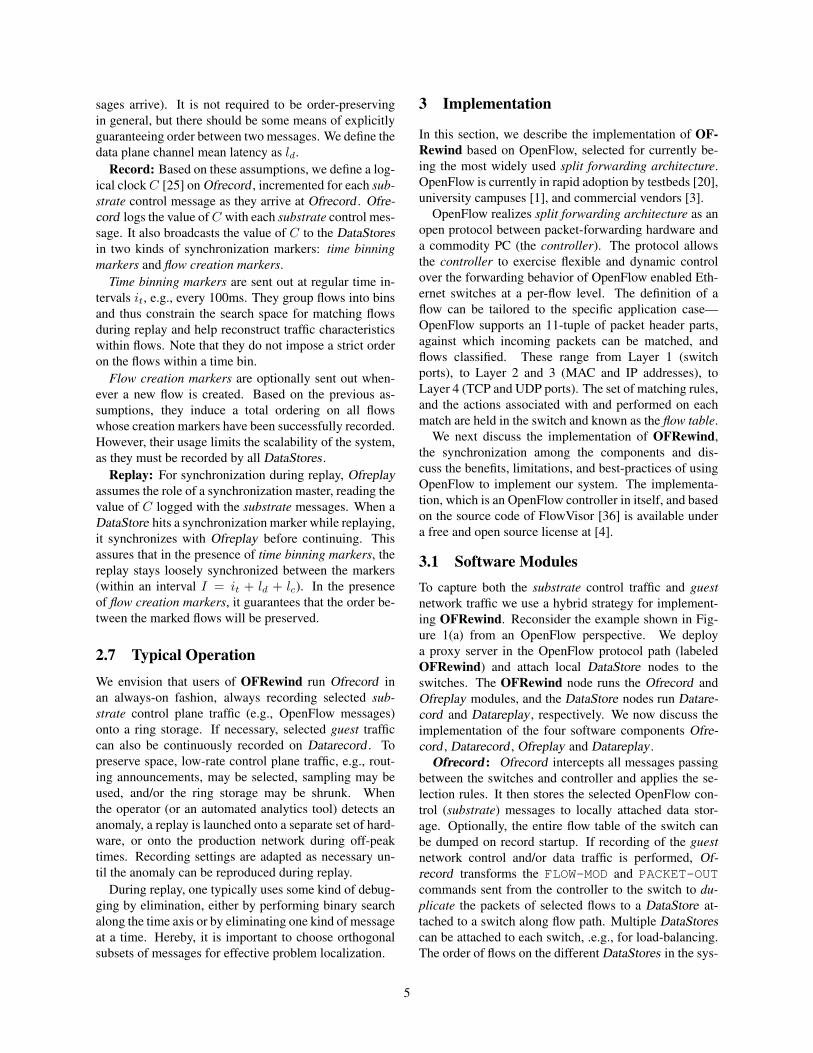
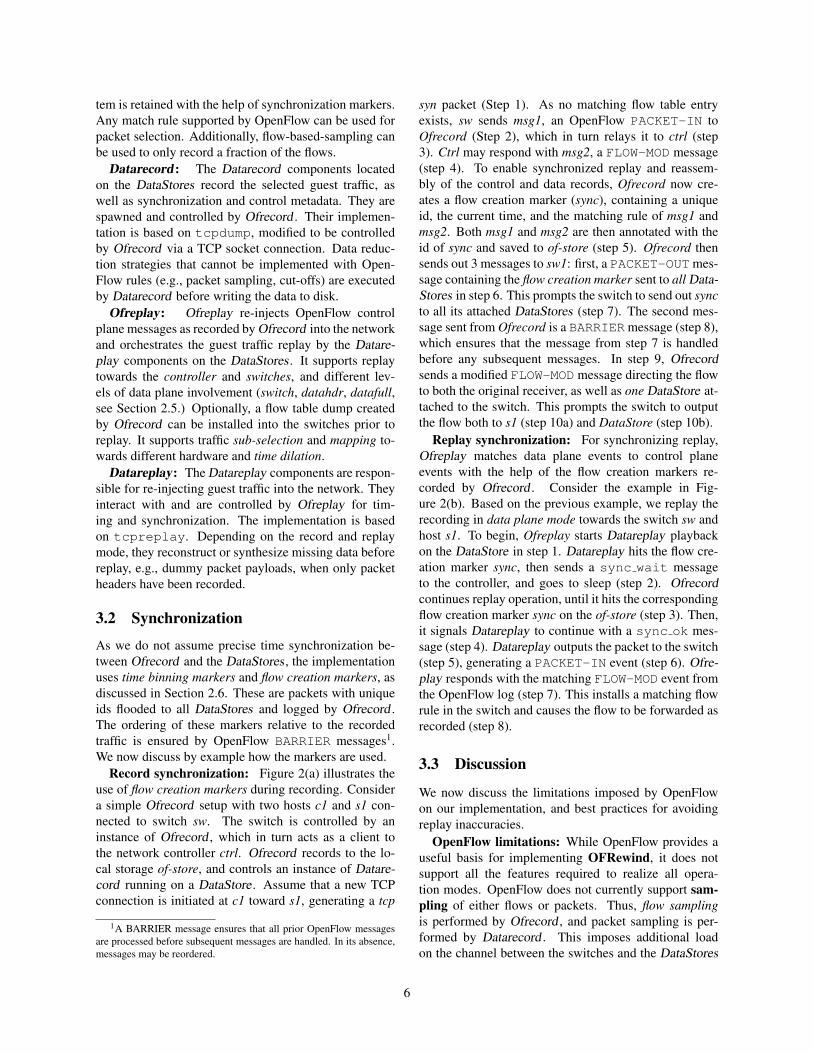
Record synchronization: Figure 2(a) illustrates the
use of flow creation markers during recording. Consider
a simple Ofrecord setup with two hosts c1 and s1 con-
nected to switch sw. The switch is controlled by an
instance of Ofrecord , which in turn acts as a client to
the network controller ctrl. Ofrecord records to the lo-
cal storage of-store, and controls an instance of Datare-
cord running on a DataStore . Assume that a new TCP
connection is initiated at c1 toward s1, generating a tcp
1A BARRIER message ensures that all prior OpenFlow messages
are processed before subsequent messages are handled. In its absence,
messages may be reordered.
syn packet (Step 1). As no matching flow table entry
exists, sw sends msg1, an OpenFlow PACKET-IN to
Ofrecord (Step 2), which in turn relays it to ctrl (step
3). Ctrl may respond with msg2, a FLOW-MOD message
(step 4). To enable synchronized replay and reassem-
bly of the control and data records, Ofrecord now cre-
ates a flow creation marker (sync), containing a unique
id, the current time, and the matching rule of msg1 and
msg2. Both msg1 and msg2 are then annotated with the
id of sync and saved to of-store (step 5). Ofrecord then
sends out 3 messages to sw1: first, a PACKET-OUT mes-
sage containing the flow creation marker sent to all Data-
Stores in step 6. This prompts the switch to send out sync
to all its attached DataStores (step 7). The second mes-
sage sent from Ofrecord is a BARRIERmessage (step 8),
which ensures that the message from step 7 is handled
before any subsequent messages. In step 9, Ofrecord
sends a modified FLOW-MOD message directing the flow
to both the original receiver, as well as one DataStore at-
tached to the switch. This prompts the switch to output
the flow both to s1 (step 10a) and DataStore (step 10b).
Replay synchronization: For synchronizing replay,
Ofreplay matches data plane events to control plane
events with the help of the flow creation markers re-
corded by Ofrecord . Consider the example in Fig-
ure 2(b). Based on the previous example, we replay the
recording in data plane mode towards the switch sw and
host s1. To begin, Ofreplay starts Datareplay playback
on the DataStore in step 1. Datareplay hits the flow cre-
ation marker sync, then sends a sync wait message
to the controller, and goes to sleep (step 2). Ofrecord
continues replay operation, until it hits the corresponding
flow creation marker sync on the of-store (step 3). Then,
it signals Datareplay to continue with a sync ok mes-
sage (step 4). Datareplay outputs the packet to the switch
(step 5), generating a PACKET-IN event (step 6). Ofre-
play responds with the matching FLOW-MOD event from
the OpenFlow log (step 7). This installs a matching flow
rule in the switch and causes the flow to be forwarded as
recorded (step 8).
3.3 Discussion
We now discuss the limitations imposed by OpenFlow
on our implementation, and best practices for avoiding
replay inaccuracies.
OpenFlow limitations: While OpenFlow provides a
useful basis for implementing OFRewind, it does not
support all the features required to realize all opera-
tion modes. OpenFlow does not currently support sam-
pling of either flows or packets. Thus, flow sampling
is performed by Ofrecord , and packet sampling is per-
formed by Datarecord . This imposes additional load
on the channel between the switches and the DataStores
6
c1 s1 sw Datarecord Ofrecord of-store ctrl
1: tcp_syn
5: sync
2: PKT_IN(tcp_syn) 3: PKT_IN(c1:tcp_syn)
4: FLOW_MOD (c1->s1)
6: PKT_OUT(sync->dr*)
7: sync
8: BARRIER
9: FLOW_MOD(c1->s1, dr)
10b: tcp_syn10a:tcp_syn
(a) Ofrecord
c1 s1 sw Datareplay Ofreplay of-store ctrl
6: PKT_IN(tcp_syn)
7: FLOW_MOD (dr->s1)
2: sync_wait
8: tcp syn
1: start
3: find_sync
4: sync_ok
5: tcp syn
(b) Ofreplay
Figure 2: DataStore synchronization mechanism in OFRewind
for data that is not subsequently recorded. Similarly,
the OpenFlow data plane does not support forwarding
of partial packets2. Consequently, full packets are for-
warded to the DataStore and only their headers may be
recorded. OpenFlow also does not support automatic
flow cut-offs after a specified amount of traffic3. The
cut-off can be performed in the DataStore . Further op-
timizations are possible, e.g., regularly removing flows
that have surpassed the threshold.
Avoiding replay inaccuracies: To reliably reproduce
failures during replay in a controlled environment, one
must ensure that the environment is properly initialized.
We suggest therefore, to use the flow table dump feature
and, preferably, reset (whenever possible) the switches
and controller state before starting the replay operation.
This reduces any unforeseen interference from previ-
ously installed bad state.
When bisecting during replay, one must consider the
interdependencies among message types. FLOW-MOD
messages are for example, responsible for creating the
flow table entries and their arbitrary bisection may lead to
incomplete or nonsense forwarding state on the switch.
Generally speaking, replay inaccuracies can occur
when: (a) the chain of causally correlated messages
is recorded incompletely, (b) synchronization between
causally correlated messages is insufficient, (c) timers
influence system behavior, and (d) network communi-
cation is partially non-deterministic. For (a) and (b), it
is necessary to adapt the recording settings to include
more or better-synchronized data. For (c) a possible ap-
proach is to reduce the traffic being replayed via sub-
selection to reduce stress on the devices and increase ac-
curacy. We have not witnessed this problem in our prac-
tical case studies. Case (d) requires the replayed traffic
to be modified. If the non-determinism stems from the
transport layer (e.g., TCP random initial sequence num-
2It does support a cut-off for packets forwarded to the controller.3Expiration after a specified amount of time is supported.
bers), a custom transport-layer handler in Datareplay can
shift sequence numbers accordingly for replay. For ap-
plication non-determinism (e.g., cryptographic nonces),
application-specific handlers must be used.
When the failure observed in the production network
does not appear during replay, we call this a false nega-
tive problem. When the precautions outlined above have
been taken, a repeated false negative indicates that the
failure is likely not triggered by network traffic, but other
events. In a false positive case, a failure is observed dur-
ing replay which does not stem from the same root cause.
Such inaccuracies can often be avoided by careful com-
parison of the symptoms and automated repetition of the
replay.
4 Case Studies
In this section, we demonstrate the use of OFRewind for
localizing problems in black box network devices, con-
trollers, and other software components, as summarized
in Table 1. These case studies also demonstrate the bene-
fits of bisecting the control plane traffic (4.2), of mapping
replays onto different pieces of hardware (4.3), from a
production network onto a developer machine (4.5), and
the benefit of a temporally consistent recording of multi-
ple switches (4.6).
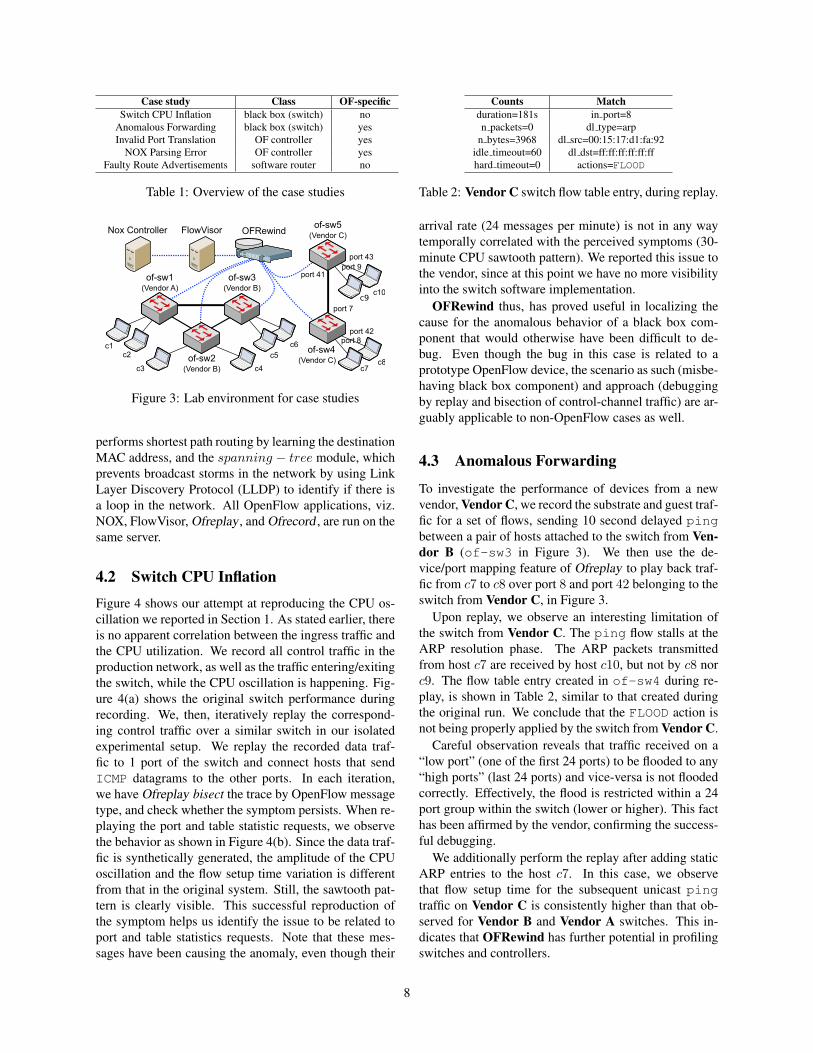
4.1 Experimental Setup
For our case studies we use a network with switches
from three vendors: Vendor A, Vendor B, Vendor C.
Each switch has two PCs connected to it. Figure 3 il-
lustrates the connectivity. All switches in the network
have a control-channel to Ofrecord . DataStores running
Datarecord and Datareplay are attached to the switches
as necessary. We use NOX [31], unless specified oth-
erwise, as the high level controller performing the actual
routing decisions. It includes the routing module, which
7
Case study Class OF-specific
Switch CPU Inflation black box (switch) no
Anomalous Forwarding black box (switch) yes
Invalid Port Translation OF controller yes
NOX Parsing Error OF controller yes
Faulty Route Advertisements software router no
Table 1: Overview of the case studies
port 7
of-sw1(Vendor A)
of-sw3(Vendor B)
of-sw2(Vendor B)
c1c2
c3 c4
c5
c6
c7c8
of-sw5(Vendor C)
of-sw4 (Vendor C)
FlowVisor OFRewindNox Controller
port 41
c9c10
port 43
port 42
port 8
port 9
Figure 3: Lab environment for case studies
performs shortest path routing by learning the destination
MAC address, and the spanning − tree module, which
prevents broadcast storms in the network by using Link
Layer Discovery Protocol (LLDP) to identify if there is
a loop in the network. All OpenFlow applications, viz.
NOX, FlowVisor, Ofreplay, and Ofrecord , are run on the
same server.
4.2 Switch CPU Inflation
Figure 4 shows our attempt at reproducing the CPU os-
cillation we reported in Section 1. As stated earlier, there
is no apparent correlation between the ingress traffic and
the CPU utilization. We record all control traffic in the
production network, as well as the traffic entering/exiting
the switch, while the CPU oscillation is happening. Fig-
ure 4(a) shows the original switch performance during
recording. We, then, iteratively replay the correspond-
ing control traffic over a similar switch in our isolated
experimental setup. We replay the recorded data traf-
fic to 1 port of the switch and connect hosts that send
ICMP datagrams to the other ports. In each iteration,
we have Ofreplay bisect the trace by OpenFlow message
type, and check whether the symptom persists. When re-
playing the port and table statistic requests, we observe
the behavior as shown in Figure 4(b). Since the data traf-
fic is synthetically generated, the amplitude of the CPU
oscillation and the flow setup time variation is different
from that in the original system. Still, the sawtooth pat-
tern is clearly visible. This successful reproduction of
the symptom helps us identify the issue to be related to
port and table statistics requests. Note that these mes-
sages have been causing the anomaly, even though their
Counts Match
duration=181s in port=8
n packets=0 dl type=arp
n bytes=3968 dl src=00:15:17:d1:fa:92
idle timeout=60 dl dst=ff:ff:ff:ff:ff:ff
hard timeout=0 actions=FLOOD
Table 2: Vendor C switch flow table entry, during replay.
arrival rate (24 messages per minute) is not in any way
temporally correlated with the perceived symptoms (30-
minute CPU sawtooth pattern). We reported this issue to
the vendor, since at this point we have no more visibility
into the switch software implementation.
OFRewind thus, has proved useful in localizing the
cause for the anomalous behavior of a black box com-
ponent that would otherwise have been difficult to de-
bug. Even though the bug in this case is related to a
prototype OpenFlow device, the scenario as such (misbe-
having black box component) and approach (debugging
by replay and bisection of control-channel traffic) are ar-
guably applicable to non-OpenFlow cases as well.
4.3 Anomalous Forwarding
To investigate the performance of devices from a new
vendor, Vendor C, we record the substrate and guest traf-
fic for a set of flows, sending 10 second delayed ping
between a pair of hosts attached to the switch from Ven-
dor B (of-sw3 in Figure 3). We then use the de-
vice/port mapping feature of Ofreplay to play back traf-
fic from c7 to c8 over port 8 and port 42 belonging to the
switch from Vendor C, in Figure 3.
Upon replay, we observe an interesting limitation of
the switch from Vendor C. The ping flow stalls at the
ARP resolution phase. The ARP packets transmitted
from host c7 are received by host c10, but not by c8 nor
c9. The flow table entry created in of-sw4 during re-
play, is shown in Table 2, similar to that created during
the original run. We conclude that the FLOOD action is
not being properly applied by the switch from Vendor C.
Careful observation reveals that traffic received on a
“low port” (one of the first 24 ports) to be flooded to any
“high ports” (last 24 ports) and vice-versa is not flooded
correctly. Effectively, the flood is restricted within a 24
port group within the switch (lower or higher). This fact
has been affirmed by the vendor, confirming the success-
ful debugging.
We additionally perform the replay after adding static
ARP entries to the host c7. In this case, we observe
that flow setup time for the subsequent unicast ping
traffic on Vendor C is consistently higher than that ob-
served for Vendor B and Vendor A switches. This in-
dicates that OFRewind has further potential in profiling
switches and controllers.
8
20:00 21:00 22:00 23:00 00:000
50
100C
PU
usage (
%)
Time
20:00 21:00 22:00 23:00 00:000
500
1000
1500
2000
Flo
w s
etu
p t
ime (
ms)
Time
(a) Switch performance with original traffic
08:06 08:36 09:06 09:36 10:06 10:360
50
100Replayed traffic characteristics
Time
CP
U u
sage (
%)
08:06 08:36 09:06 09:36 10:06 10:360
50
100
Time
Flo
w s
etu
p tim
e (
ms)
(b) Switch performance with replayed traffic
20:00 21:00 22:00 23:00 00:000
20
40
60
80
100
CP
U U
til %
Nov−06−2009 to Nov−07−200920:00 21:00 22:00 23:00 00:00
0
5
10
15
20
25
ST
AT
S R
EQ
UE
ST
(c) STATS-REQUEST vs. CPU
Figure 4: Sawtooth CPU pattern reproduced during replay of port and table STATS-REQUEST messages. Figure (c)
shows no observable temporal correlation to message arrivals.
FlowVisor
Ofrecord
sw
OF-Controller
c2c1
Ofreplay
(a) recording the bug (b) replay of bug
Figure 5: Debugging of FlowVisor bug #68
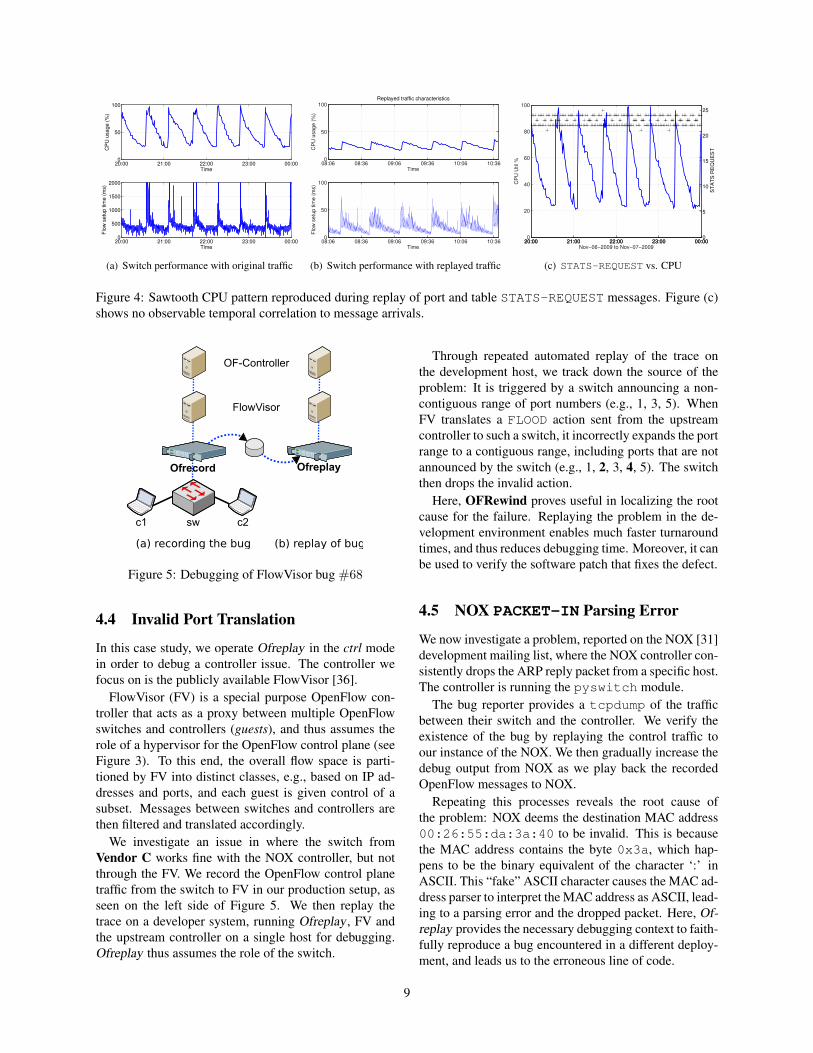
4.4 Invalid Port Translation
In this case study, we operate Ofreplay in the ctrl mode
in order to debug a controller issue. The controller we
focus on is the publicly available FlowVisor [36].
FlowVisor (FV) is a special purpose OpenFlow con-
troller that acts as a proxy between multiple OpenFlow
switches and controllers (guests), and thus assumes the
role of a hypervisor for the OpenFlow control plane (see
Figure 3). To this end, the overall flow space is parti-
tioned by FV into distinct classes, e.g., based on IP ad-
dresses and ports, and each guest is given control of a
subset. Messages between switches and controllers are
then filtered and translated accordingly.
We investigate an issue in where the switch from
Vendor C works fine with the NOX controller, but not
through the FV. We record the OpenFlow control plane
traffic from the switch to FV in our production setup, as
seen on the left side of Figure 5. We then replay the
trace on a developer system, running Ofreplay, FV and
the upstream controller on a single host for debugging.
Ofreplay thus assumes the role of the switch.
Through repeated automated replay of the trace on
the development host, we track down the source of the
problem: It is triggered by a switch announcing a non-
contiguous range of port numbers (e.g., 1, 3, 5). When
FV translates a FLOOD action sent from the upstream
controller to such a switch, it incorrectly expands the port
range to a contiguous range, including ports that are not
announced by the switch (e.g., 1, 2, 3, 4, 5). The switch
then drops the invalid action.
Here, OFRewind proves useful in localizing the root
cause for the failure. Replaying the problem in the de-
velopment environment enables much faster turnaround
times, and thus reduces debugging time. Moreover, it can
be used to verify the software patch that fixes the defect.
4.5 NOX PACKET-IN Parsing Error
We now investigate a problem, reported on the NOX [31]
development mailing list, where the NOX controller con-
sistently drops the ARP reply packet from a specific host.
The controller is running the pyswitch module.
The bug reporter provides a tcpdump of the traffic
between their switch and the controller. We verify the
existence of the bug by replaying the control traffic to
our instance of the NOX. We then gradually increase the
debug output from NOX as we play back the recorded
OpenFlow messages to NOX.
Repeating this processes reveals the root cause of
the problem: NOX deems the destination MAC address
00:26:55:da:3a:40 to be invalid. This is because
the MAC address contains the byte 0x3a, which hap-
pens to be the binary equivalent of the character ‘:’ in
ASCII. This “fake” ASCII character causes the MAC ad-
dress parser to interpret the MAC address as ASCII, lead-
ing to a parsing error and the dropped packet. Here, Of-
replay provides the necessary debugging context to faith-
fully reproduce a bug encountered in a different deploy-
ment, and leads us to the erroneous line of code.
9
OF-Controller
OFRewind
DataStore
Router A of-sw1 Router B Router Cof-sw2
DataStore
Network 1 Network 2 Network 3 Network 4
Figure 6: Quagga RIPv1 bug #235
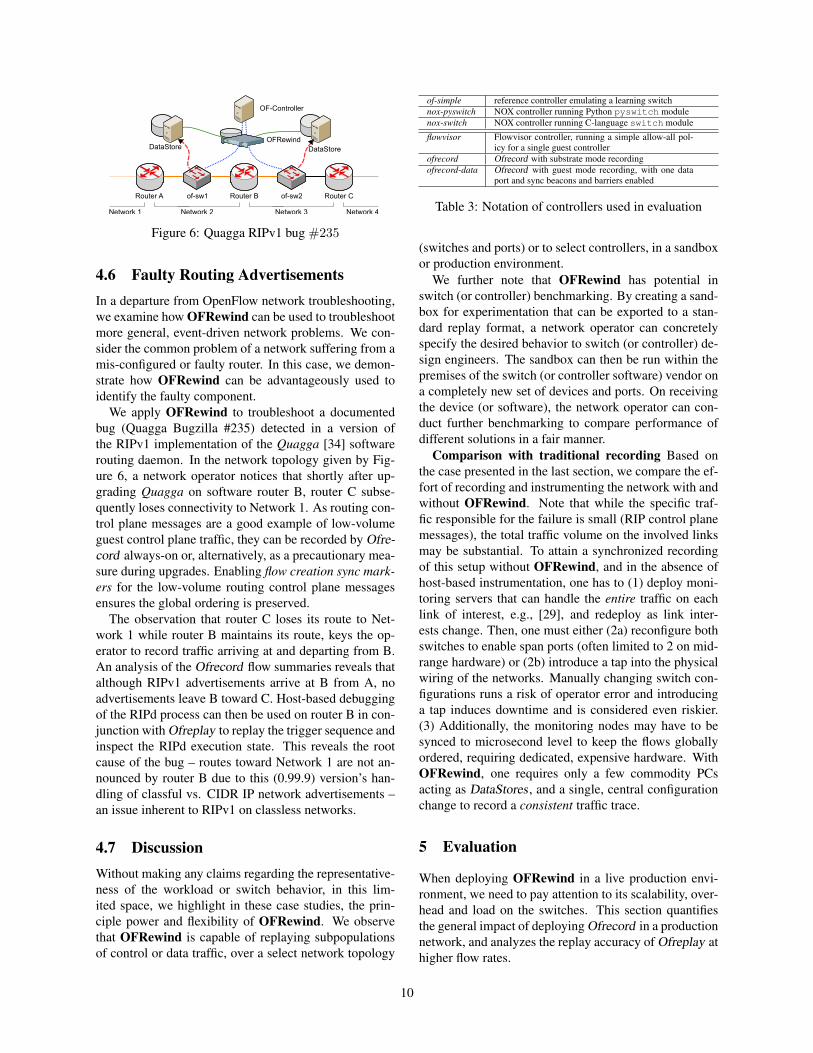
4.6 Faulty Routing Advertisements
In a departure from OpenFlow network troubleshooting,
we examine how OFRewind can be used to troubleshoot
more general, event-driven network problems. We con-
sider the common problem of a network suffering from a
mis-configured or faulty router. In this case, we demon-
strate how OFRewind can be advantageously used to
identify the faulty component.
We apply OFRewind to troubleshoot a documented
bug (Quagga Bugzilla #235) detected in a version of
the RIPv1 implementation of the Quagga [34] software
routing daemon. In the network topology given by Fig-
ure 6, a network operator notices that shortly after up-
grading Quagga on software router B, router C subse-
quently loses connectivity to Network 1. As routing con-
trol plane messages are a good example of low-volume
guest control plane traffic, they can be recorded by Ofre-
cord always-on or, alternatively, as a precautionary mea-
sure during upgrades. Enabling flow creation sync mark-
ers for the low-volume routing control plane messages
ensures the global ordering is preserved.
The observation that router C loses its route to Net-
work 1 while router B maintains its route, keys the op-
erator to record traffic arriving at and departing from B.
An analysis of the Ofrecord flow summaries reveals that
although RIPv1 advertisements arrive at B from A, no
advertisements leave B toward C. Host-based debugging
of the RIPd process can then be used on router B in con-
junction with Ofreplay to replay the trigger sequence and
inspect the RIPd execution state. This reveals the root
cause of the bug – routes toward Network 1 are not an-
nounced by router B due to this (0.99.9) version’s han-
dling of classful vs. CIDR IP network advertisements –
an issue inherent to RIPv1 on classless networks.
4.7 Discussion
Without making any claims regarding the representative-
ness of the workload or switch behavior, in this lim-
ited space, we highlight in these case studies, the prin-
ciple power and flexibility of OFRewind. We observe
that OFRewind is capable of replaying subpopulations
of control or data traffic, over a select network topology
of-simple reference controller emulating a learning switch
nox-pyswitch NOX controller running Python pyswitch module
nox-switch NOX controller running C-language switch module
flowvisor Flowvisor controller, running a simple allow-all pol-
icy for a single guest controller
ofrecord Ofrecord with substrate mode recording
ofrecord-data Ofrecord with guest mode recording, with one data
port and sync beacons and barriers enabled
Table 3: Notation of controllers used in evaluation
(switches and ports) or to select controllers, in a sandbox
or production environment.
We further note that OFRewind has potential in
switch (or controller) benchmarking. By creating a sand-
box for experimentation that can be exported to a stan-
dard replay format, a network operator can concretely
specify the desired behavior to switch (or controller) de-
sign engineers. The sandbox can then be run within the
premises of the switch (or controller software) vendor on
a completely new set of devices and ports. On receiving
the device (or software), the network operator can con-
duct further benchmarking to compare performance of
different solutions in a fair manner.
Comparison with traditional recording Based on
the case presented in the last section, we compare the ef-
fort of recording and instrumenting the network with and
without OFRewind. Note that while the specific traf-
fic responsible for the failure is small (RIP control plane
messages), the total traffic volume on the involved links
may be substantial. To attain a synchronized recording
of this setup without OFRewind, and in the absence of
host-based instrumentation, one has to (1) deploy moni-
toring servers that can handle the entire traffic on each
link of interest, e.g., [29], and redeploy as link inter-
ests change. Then, one must either (2a) reconfigure both
switches to enable span ports (often limited to 2 on mid-
range hardware) or (2b) introduce a tap into the physical
wiring of the networks. Manually changing switch con-
figurations runs a risk of operator error and introducing
a tap induces downtime and is considered even riskier.
(3) Additionally, the monitoring nodes may have to be
synced to microsecond level to keep the flows globally
ordered, requiring dedicated, expensive hardware. With
OFRewind, one requires only a few commodity PCs
acting as DataStores , and a single, central configuration
change to record a consistent traffic trace.
5 Evaluation
When deploying OFRewind in a live production envi-
ronment, we need to pay attention to its scalability, over-
head and load on the switches. This section quantifies
the general impact of deploying Ofrecord in a production
network, and analyzes the replay accuracy of Ofreplay at
higher flow rates.
10
0 10 20 30 40 50 60
02
00
00
60
00
01
00
00
0
# Switches
Flo
w R
ate
/s
flowvisor
nox−pyswitch
nox−switch
ofrecord
ofrecord−data
of−simple
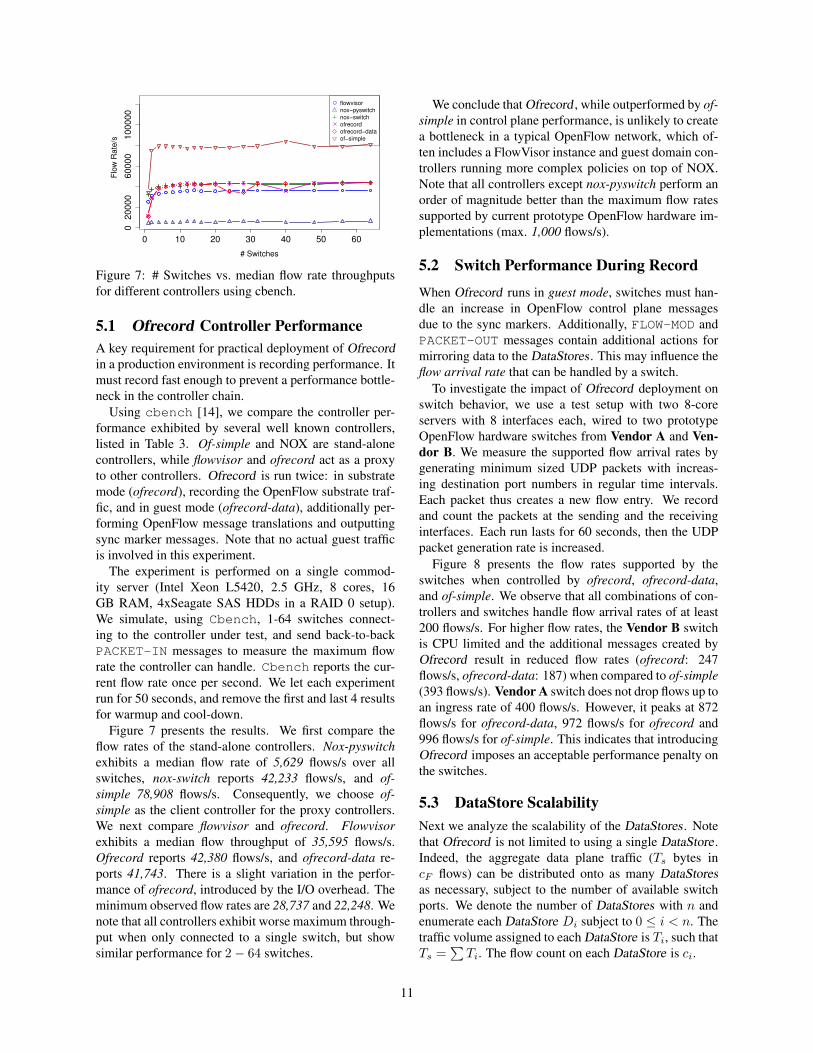
Figure 7: # Switches vs. median flow rate throughputs
for different controllers using cbench.
5.1 Ofrecord Controller Performance
A key requirement for practical deployment of Ofrecord
in a production environment is recording performance. It
must record fast enough to prevent a performance bottle-
neck in the controller chain.
Using cbench [14], we compare the controller per-
formance exhibited by several well known controllers,
listed in Table 3. Of-simple and NOX are stand-alone
controllers, while flowvisor and ofrecord act as a proxy
to other controllers. Ofrecord is run twice: in substrate
mode (ofrecord), recording the OpenFlow substrate traf-
fic, and in guest mode (ofrecord-data), additionally per-
forming OpenFlow message translations and outputting
sync marker messages. Note that no actual guest traffic
is involved in this experiment.
The experiment is performed on a single commod-
ity server (Intel Xeon L5420, 2.5 GHz, 8 cores, 16
GB RAM, 4xSeagate SAS HDDs in a RAID 0 setup).
We simulate, using Cbench, 1-64 switches connect-
ing to the controller under test, and send back-to-back
PACKET-IN messages to measure the maximum flow
rate the controller can handle. Cbench reports the cur-
rent flow rate once per second. We let each experiment
run for 50 seconds, and remove the first and last 4 results
for warmup and cool-down.
Figure 7 presents the results. We first compare the
flow rates of the stand-alone controllers. Nox-pyswitch
exhibits a median flow rate of 5,629 flows/s over all
switches, nox-switch reports 42,233 flows/s, and of-
simple 78,908 flows/s. Consequently, we choose of-
simple as the client controller for the proxy controllers.
We next compare flowvisor and ofrecord. Flowvisor
exhibits a median flow throughput of 35,595 flows/s.
Ofrecord reports 42,380 flows/s, and ofrecord-data re-
ports 41,743. There is a slight variation in the perfor-
mance of ofrecord, introduced by the I/O overhead. The
minimum observed flow rates are 28,737 and 22,248. We
note that all controllers exhibit worse maximum through-
put when only connected to a single switch, but show
similar performance for 2− 64 switches.
We conclude that Ofrecord , while outperformed by of-
simple in control plane performance, is unlikely to create
a bottleneck in a typical OpenFlow network, which of-
ten includes a FlowVisor instance and guest domain con-
trollers running more complex policies on top of NOX.
Note that all controllers except nox-pyswitch perform an
order of magnitude better than the maximum flow rates
supported by current prototype OpenFlow hardware im-
plementations (max. 1,000 flows/s).
5.2 Switch Performance During Record
When Ofrecord runs in guest mode, switches must han-
dle an increase in OpenFlow control plane messages
due to the sync markers. Additionally, FLOW-MOD and
PACKET-OUT messages contain additional actions for
mirroring data to the DataStores . This may influence the
flow arrival rate that can be handled by a switch.
To investigate the impact of Ofrecord deployment on
switch behavior, we use a test setup with two 8-core
servers with 8 interfaces each, wired to two prototype
OpenFlow hardware switches from Vendor A and Ven-
dor B. We measure the supported flow arrival rates by
generating minimum sized UDP packets with increas-
ing destination port numbers in regular time intervals.
Each packet thus creates a new flow entry. We record
and count the packets at the sending and the receiving
interfaces. Each run lasts for 60 seconds, then the UDP
packet generation rate is increased.
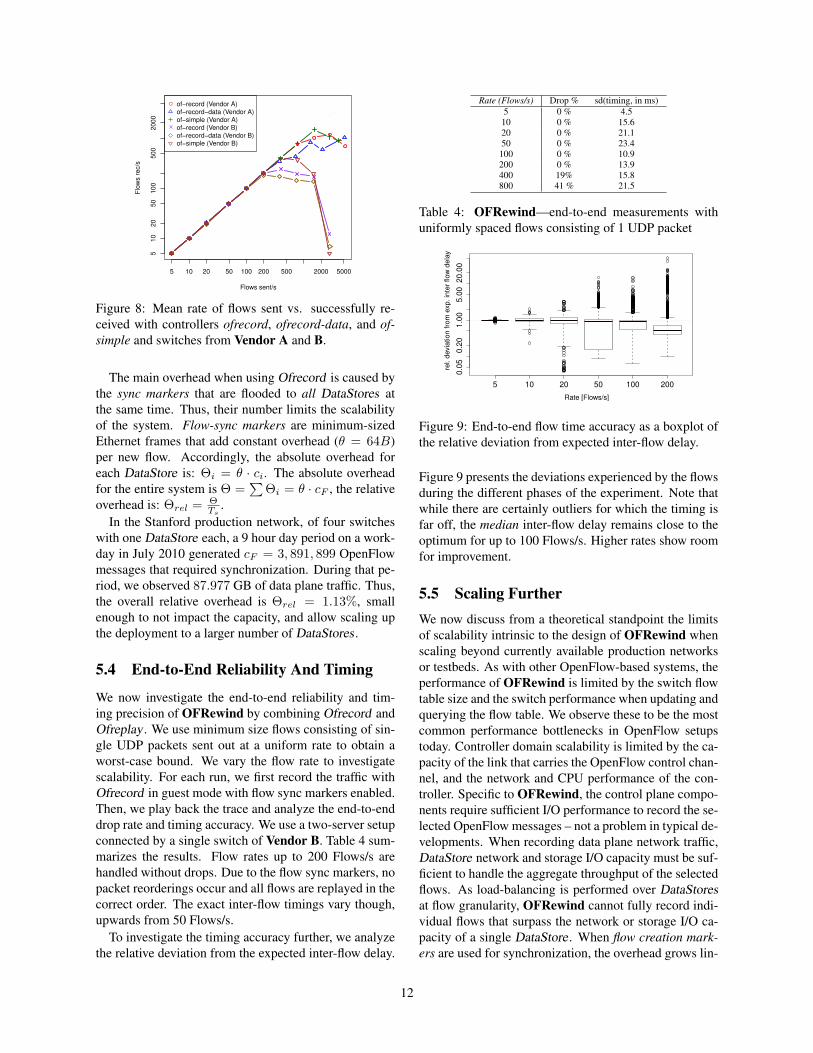
Figure 8 presents the flow rates supported by the
switches when controlled by ofrecord, ofrecord-data,
and of-simple. We observe that all combinations of con-
trollers and switches handle flow arrival rates of at least
200 flows/s. For higher flow rates, the Vendor B switch
is CPU limited and the additional messages created by
Ofrecord result in reduced flow rates (ofrecord: 247
flows/s, ofrecord-data: 187) when compared to of-simple
(393 flows/s). Vendor A switch does not drop flows up to
an ingress rate of 400 flows/s. However, it peaks at 872
flows/s for ofrecord-data, 972 flows/s for ofrecord and
996 flows/s for of-simple. This indicates that introducing
Ofrecord imposes an acceptable performance penalty on
the switches.
5.3 DataStore Scalability
Next we analyze the scalability of the DataStores . Note
that Ofrecord is not limited to using a single DataStore .
Indeed, the aggregate data plane traffic (Ts bytes in
cF flows) can be distributed onto as many DataStores
as necessary, subject to the number of available switch
ports. We denote the number of DataStores with n and
enumerate each DataStore Di subject to 0 ≤ i < n. The
traffic volume assigned to each DataStore is Ti, such that
Ts =∑
Ti. The flow count on each DataStore is ci.
11
5 10 20 50 100 200 500 2000 5000
51
02
05
01
00
50
02
00
0
Flows sent/s
Flo
ws r
ec/s
of−record (Vendor A)
of−record−data (Vendor A)
of−simple (Vendor A)
of−record (Vendor B)
of−record−data (Vendor B)
of−simple (Vendor B)
Figure 8: Mean rate of flows sent vs. successfully re-
ceived with controllers ofrecord, ofrecord-data, and of-
simple and switches from Vendor A and B.
The main overhead when using Ofrecord is caused by
the sync markers that are flooded to all DataStores at
the same time. Thus, their number limits the scalability
of the system. Flow-sync markers are minimum-sized
Ethernet frames that add constant overhead (θ = 64B)
per new flow. Accordingly, the absolute overhead for
each DataStore is: Θi = θ · ci. The absolute overhead
for the entire system is Θ =∑
Θi = θ · cF , the relative
overhead is: Θrel =Θ
Ts
.
In the Stanford production network, of four switches
with one DataStore each, a 9 hour day period on a work-
day in July 2010 generated cF = 3, 891, 899 OpenFlow
messages that required synchronization. During that pe-
riod, we observed 87.977 GB of data plane traffic. Thus,
the overall relative overhead is Θrel = 1.13%, small
enough to not impact the capacity, and allow scaling up
the deployment to a larger number of DataStores .
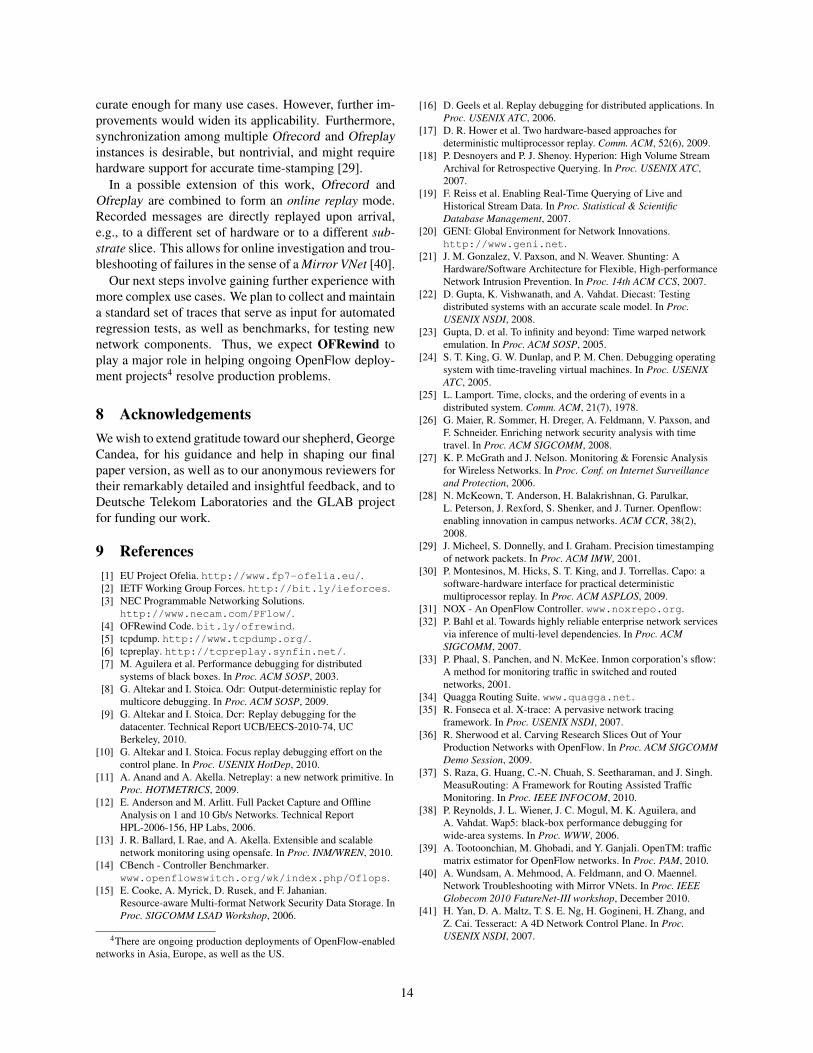
5.4 End-to-End Reliability And Timing
We now investigate the end-to-end reliability and tim-
ing precision of OFRewind by combining Ofrecord and
Ofreplay. We use minimum size flows consisting of sin-
gle UDP packets sent out at a uniform rate to obtain a
worst-case bound. We vary the flow rate to investigate
scalability. For each run, we first record the traffic with
Ofrecord in guest mode with flow sync markers enabled.
Then, we play back the trace and analyze the end-to-end
drop rate and timing accuracy. We use a two-server setup
connected by a single switch of Vendor B. Table 4 sum-
marizes the results. Flow rates up to 200 Flows/s are
handled without drops. Due to the flow sync markers, no
packet reorderings occur and all flows are replayed in the
correct order. The exact inter-flow timings vary though,
upwards from 50 Flows/s.
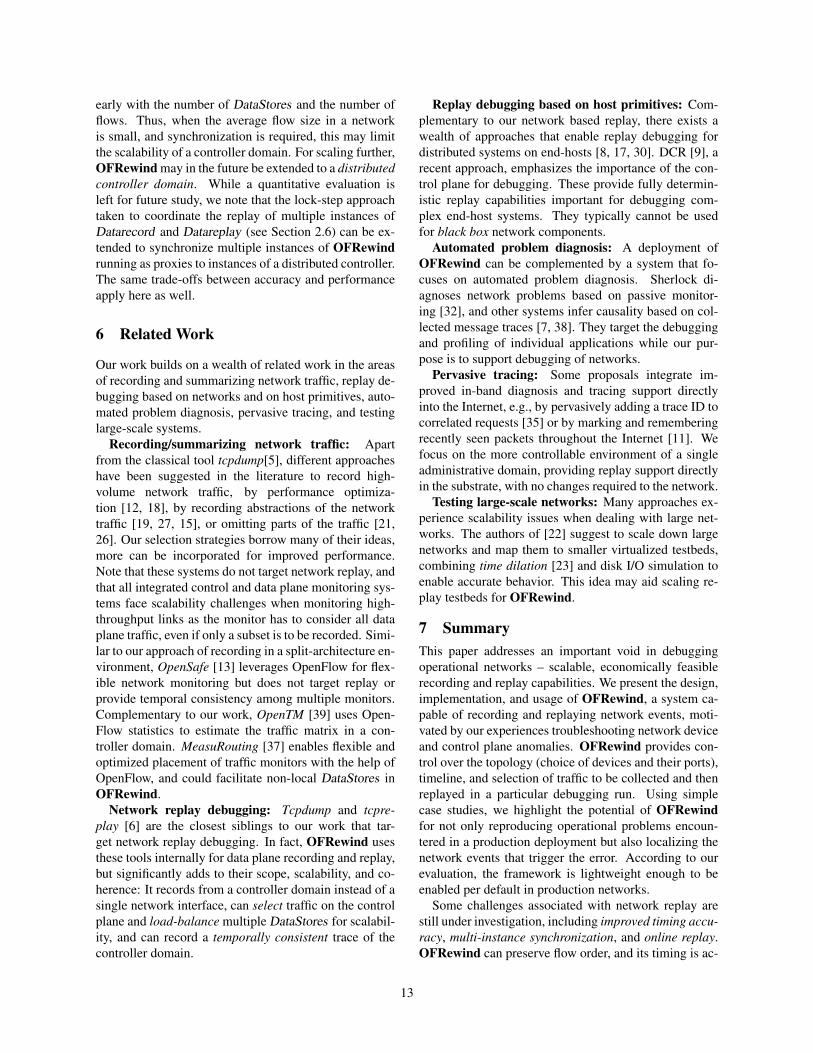
To investigate the timing accuracy further, we analyze
the relative deviation from the expected inter-flow delay.
Rate (Flows/s) Drop % sd(timing, in ms)
5 0 % 4.5
10 0 % 15.6
20 0 % 21.1
50 0 % 23.4
100 0 % 10.9
200 0 % 13.9
400 19% 15.8
800 41 % 21.5
Table 4: OFRewind—end-to-end measurements with
uniformly spaced flows consisting of 1 UDP packet
5 10 20 50 100 200
0.0
50.2
01.0
05.0
020.0
0
Rate [Flows/s]
rel. d
evia
tio
n f
rom
exp
. in
ter
flow
de
lay
Figure 9: End-to-end flow time accuracy as a boxplot of
the relative deviation from expected inter-flow delay.
Figure 9 presents the deviations experienced by the flows
during the different phases of the experiment. Note that
while there are certainly outliers for which the timing is
far off, the median inter-flow delay remains close to the
optimum for up to 100 Flows/s. Higher rates show room
for improvement.
5.5 Scaling Further
We now discuss from a theoretical standpoint the limits
of scalability intrinsic to the design of OFRewind when
scaling beyond currently available production networks
or testbeds. As with other OpenFlow-based systems, the
performance of OFRewind is limited by the switch flow
table size and the switch performance when updating and
querying the flow table. We observe these to be the most
common performance bottlenecks in OpenFlow setups
today. Controller domain scalability is limited by the ca-
pacity of the link that carries the OpenFlow control chan-
nel, and the network and CPU performance of the con-
troller. Specific to OFRewind, the control plane compo-
nents require sufficient I/O performance to record the se-
lected OpenFlow messages – not a problem in typical de-
velopments. When recording data plane network traffic,
DataStore network and storage I/O capacity must be suf-
ficient to handle the aggregate throughput of the selected
flows. As load-balancing is performed over DataStores
at flow granularity, OFRewind cannot fully record indi-
vidual flows that surpass the network or storage I/O ca-
pacity of a single DataStore . When flow creation mark-
ers are used for synchronization, the overhead grows lin-
12
early with the number of DataStores and the number of
flows. Thus, when the average flow size in a network
is small, and synchronization is required, this may limit
the scalability of a controller domain. For scaling further,
OFRewind may in the future be extended to a distributed
controller domain. While a quantitative evaluation is
left for future study, we note that the lock-step approach
taken to coordinate the replay of multiple instances of
Datarecord and Datareplay (see Section 2.6) can be ex-
tended to synchronize multiple instances of OFRewind
running as proxies to instances of a distributed controller.
The same trade-offs between accuracy and performance
apply here as well.
6 Related Work
Our work builds on a wealth of related work in the areas
of recording and summarizing network traffic, replay de-
bugging based on networks and on host primitives, auto-
mated problem diagnosis, pervasive tracing, and testing
large-scale systems.
Recording/summarizing network traffic: Apart
from the classical tool tcpdump[5], different approaches
have been suggested in the literature to record high-
volume network traffic, by performance optimiza-
tion [12, 18], by recording abstractions of the network
traffic [19, 27, 15], or omitting parts of the traffic [21,
26]. Our selection strategies borrow many of their ideas,
more can be incorporated for improved performance.
Note that these systems do not target network replay, and
that all integrated control and data plane monitoring sys-
tems face scalability challenges when monitoring high-
throughput links as the monitor has to consider all data
plane traffic, even if only a subset is to be recorded. Simi-
lar to our approach of recording in a split-architecture en-
vironment, OpenSafe [13] leverages OpenFlow for flex-
ible network monitoring but does not target replay or
provide temporal consistency among multiple monitors.
Complementary to our work, OpenTM [39] uses Open-
Flow statistics to estimate the traffic matrix in a con-
troller domain. MeasuRouting [37] enables flexible and
optimized placement of traffic monitors with the help of
OpenFlow, and could facilitate non-local DataStores in
OFRewind.
Network replay debugging: Tcpdump and tcpre-
play [6] are the closest siblings to our work that tar-
get network replay debugging. In fact, OFRewind uses
these tools internally for data plane recording and replay,
but significantly adds to their scope, scalability, and co-
herence: It records from a controller domain instead of a
single network interface, can select traffic on the control
plane and load-balance multiple DataStores for scalabil-
ity, and can record a temporally consistent trace of the
controller domain.
Replay debugging based on host primitives: Com-
plementary to our network based replay, there exists a
wealth of approaches that enable replay debugging for
distributed systems on end-hosts [8, 17, 30]. DCR [9], a
recent approach, emphasizes the importance of the con-
trol plane for debugging. These provide fully determin-
istic replay capabilities important for debugging com-
plex end-host systems. They typically cannot be used
for black box network components.
Automated problem diagnosis: A deployment of
OFRewind can be complemented by a system that fo-
cuses on automated problem diagnosis. Sherlock di-
agnoses network problems based on passive monitor-
ing [32], and other systems infer causality based on col-
lected message traces [7, 38]. They target the debugging
and profiling of individual applications while our pur-
pose is to support debugging of networks.
Pervasive tracing: Some proposals integrate im-
proved in-band diagnosis and tracing support directly
into the Internet, e.g., by pervasively adding a trace ID to
correlated requests [35] or by marking and remembering
recently seen packets throughout the Internet [11]. We
focus on the more controllable environment of a single
administrative domain, providing replay support directly
in the substrate, with no changes required to the network.
Testing large-scale networks: Many approaches ex-
perience scalability issues when dealing with large net-
works. The authors of [22] suggest to scale down large
networks and map them to smaller virtualized testbeds,
combining time dilation [23] and disk I/O simulation to
enable accurate behavior. This idea may aid scaling re-
play testbeds for OFRewind.
7 Summary
This paper addresses an important void in debugging
operational networks – scalable, economically feasible
recording and replay capabilities. We present the design,
implementation, and usage of OFRewind, a system ca-
pable of recording and replaying network events, moti-
vated by our experiences troubleshooting network device
and control plane anomalies. OFRewind provides con-
trol over the topology (choice of devices and their ports),
timeline, and selection of traffic to be collected and then
replayed in a particular debugging run. Using simple
case studies, we highlight the potential of OFRewind
for not only reproducing operational problems encoun-
tered in a production deployment but also localizing the
network events that trigger the error. According to our
evaluation, the framework is lightweight enough to be
enabled per default in production networks.
Some challenges associated with network replay are
still under investigation, including improved timing accu-
racy, multi-instance synchronization, and online replay.
OFRewind can preserve flow order, and its timing is ac-
13
curate enough for many use cases. However, further im-
provements would widen its applicability. Furthermore,
synchronization among multiple Ofrecord and Ofreplay
instances is desirable, but nontrivial, and might require
hardware support for accurate time-stamping [29].
In a possible extension of this work, Ofrecord and
Ofreplay are combined to form an online replay mode.
Recorded messages are directly replayed upon arrival,
e.g., to a different set of hardware or to a different sub-
strate slice. This allows for online investigation and trou-
bleshooting of failures in the sense of a Mirror VNet [40].
Our next steps involve gaining further experience with
more complex use cases. We plan to collect and maintain
a standard set of traces that serve as input for automated
regression tests, as well as benchmarks, for testing new
network components. Thus, we expect OFRewind to
play a major role in helping ongoing OpenFlow deploy-
ment projects4 resolve production problems.
8 Acknowledgements
We wish to extend gratitude toward our shepherd, George
Candea, for his guidance and help in shaping our final
paper version, as well as to our anonymous reviewers for
their remarkably detailed and insightful feedback, and to
Deutsche Telekom Laboratories and the GLAB project
for funding our work.
9 References
[1] EU Project Ofelia. http://www.fp7-ofelia.eu/.
[2] IETF Working Group Forces. http://bit.ly/ieforces.
[3] NEC Programmable Networking Solutions.
http://www.necam.com/PFlow/.
[4] OFRewind Code. bit.ly/ofrewind.
[5] tcpdump. http://www.tcpdump.org/.
[6] tcpreplay. http://tcpreplay.synfin.net/.
[7] M. Aguilera et al. Performance debugging for distributed
systems of black boxes. In Proc. ACM SOSP, 2003.
[8] G. Altekar and I. Stoica. Odr: Output-deterministic replay for
multicore debugging. In Proc. ACM SOSP, 2009.
[9] G. Altekar and I. Stoica. Dcr: Replay debugging for the
datacenter. Technical Report UCB/EECS-2010-74, UC
Berkeley, 2010.
[10] G. Altekar and I. Stoica. Focus replay debugging effort on the
control plane. In Proc. USENIX HotDep, 2010.
[11] A. Anand and A. Akella. Netreplay: a new network primitive. In
Proc. HOTMETRICS, 2009.
[12] E. Anderson and M. Arlitt. Full Packet Capture and Offline
Analysis on 1 and 10 Gb/s Networks. Technical Report
HPL-2006-156, HP Labs, 2006.
[13] J. R. Ballard, I. Rae, and A. Akella. Extensible and scalable
network monitoring using opensafe. In Proc. INM/WREN, 2010.
[14] CBench - Controller Benchmarker.
www.openflowswitch.org/wk/index.php/Oflops.
[15] E. Cooke, A. Myrick, D. Rusek, and F. Jahanian.
Resource-aware Multi-format Network Security Data Storage. In
Proc. SIGCOMM LSAD Workshop, 2006.
4There are ongoing production deployments of OpenFlow-enabled
networks in Asia, Europe, as well as the US.
[16] D. Geels et al. Replay debugging for distributed applications. In
Proc. USENIX ATC, 2006.
[17] D. R. Hower et al. Two hardware-based approaches for
deterministic multiprocessor replay. Comm. ACM, 52(6), 2009.
[18] P. Desnoyers and P. J. Shenoy. Hyperion: High Volume Stream
Archival for Retrospective Querying. In Proc. USENIX ATC,
2007.
[19] F. Reiss et al. Enabling Real-Time Querying of Live and
Historical Stream Data. In Proc. Statistical & Scientific
Database Management, 2007.
[20] GENI: Global Environment for Network Innovations.
http://www.geni.net.
[21] J. M. Gonzalez, V. Paxson, and N. Weaver. Shunting: A
Hardware/Software Architecture for Flexible, High-performance
Network Intrusion Prevention. In Proc. 14th ACM CCS, 2007.
[22] D. Gupta, K. Vishwanath, and A. Vahdat. Diecast: Testing
distributed systems with an accurate scale model. In Proc.
USENIX NSDI, 2008.
[23] Gupta, D. et al. To infinity and beyond: Time warped network
emulation. In Proc. ACM SOSP, 2005.
[24] S. T. King, G. W. Dunlap, and P. M. Chen. Debugging operating
system with time-traveling virtual machines. In Proc. USENIX
ATC, 2005.
[25] L. Lamport. Time, clocks, and the ordering of events in a
distributed system. Comm. ACM, 21(7), 1978.
[26] G. Maier, R. Sommer, H. Dreger, A. Feldmann, V. Paxson, and
F. Schneider. Enriching network security analysis with time
travel. In Proc. ACM SIGCOMM, 2008.
[27] K. P. McGrath and J. Nelson. Monitoring & Forensic Analysis
for Wireless Networks. In Proc. Conf. on Internet Surveillance
and Protection, 2006.
[28] N. McKeown, T. Anderson, H. Balakrishnan, G. Parulkar,
L. Peterson, J. Rexford, S. Shenker, and J. Turner. Openflow:
enabling innovation in campus networks. ACM CCR, 38(2),
2008.
[29] J. Micheel, S. Donnelly, and I. Graham. Precision timestamping
of network packets. In Proc. ACM IMW, 2001.
[30] P. Montesinos, M. Hicks, S. T. King, and J. Torrellas. Capo: a
software-hardware interface for practical deterministic
multiprocessor replay. In Proc. ACM ASPLOS, 2009.
[31] NOX - An OpenFlow Controller. www.noxrepo.org.
[32] P. Bahl et al. Towards highly reliable enterprise network services
via inference of multi-level dependencies. In Proc. ACM
SIGCOMM, 2007.
[33] P. Phaal, S. Panchen, and N. McKee. Inmon corporation’s sflow:
A method for monitoring traffic in switched and routed
networks, 2001.
[34] Quagga Routing Suite. www.quagga.net.
[35] R. Fonseca et al. X-trace: A pervasive network tracing
framework. In Proc. USENIX NSDI, 2007.
[36] R. Sherwood et al. Carving Research Slices Out of Your
Production Networks with OpenFlow. In Proc. ACM SIGCOMM
Demo Session, 2009.
[37] S. Raza, G. Huang, C.-N. Chuah, S. Seetharaman, and J. Singh.
MeasuRouting: A Framework for Routing Assisted Traffic
Monitoring. In Proc. IEEE INFOCOM, 2010.
[38] P. Reynolds, J. L. Wiener, J. C. Mogul, M. K. Aguilera, and
A. Vahdat. Wap5: black-box performance debugging for
wide-area systems. In Proc. WWW, 2006.
[39] A. Tootoonchian, M. Ghobadi, and Y. Ganjali. OpenTM: traffic
matrix estimator for OpenFlow networks. In Proc. PAM, 2010.
[40] A. Wundsam, A. Mehmood, A. Feldmann, and O. Maennel.
Network Troubleshooting with Mirror VNets. In Proc. IEEE
Globecom 2010 FutureNet-III workshop, December 2010.
[41] H. Yan, D. A. Maltz, T. S. E. Ng, H. Gogineni, H. Zhang, and
Z. Cai. Tesseract: A 4D Network Control Plane. In Proc.
USENIX NSDI, 2007.
14