Offshore oil and gas, and operational sheen occurrence: is ... ·...
34
REVIEW Offshore oil and gas, and operational sheen occurrence: is there potential harm to marine birds? Lora A. Morandin and Patrick D. O’Hara Abstract: Hydrocarbon discharges into the ocean, both regulated and accidental, occur from offshore drilling and production operations, and can result in oil sheen (≤3 m thick) and slick (>3 m thick) formation, potentially harming marine birds. Sheens may commonly occur around offshore oil and gas platforms in Atlantic Canada, however, there is little information on regularity of occurrence. Further, there are few direct studies on potential impacts of sheens, associated with offshore oil and gas operations, on marine birds. We reviewed potential sources and frequency of hydrocarbon accumulation on sea surfaces from offshore oil and gas operations in Atlantic Canada, and the likelihood of overlap with marine birds. We conducted a literature review on lethal and sub-lethal effects of low levels of oil contact and ingestion on marine birds, focusing on studies that describe measured dosages of oil. We extrapolated from these data on low-dose oil exposure to link possible effects to marine birds resulting from exposure to sheens. We found that sheens occur around production operations in Atlantic Canada at allowable levels of oil concentrations in produced water. Frequency and extent of occurrence cannot be estimated from current monitoring practices. While immediate lethal effects to seabirds likely are not common from external oiling of feathers from sheens, added stressors, such as cold weather, can result in external oiling from sheens having significant impact on seabird metabolic rate and can be ultimately lethal. Ingestion of small amounts of oil, doses that realistically could be expected from exposure to sheens, in some cases resulted in sub-lethal effects to adult seabirds, primarily affecting metabolic rate, sub-lethal health impacts, and reproductive output. Nestlings and eggs do not come in direct contact with sheens, yet these life stages are highly sensitive to oil, and transfer of oil from adults exposed to sheens likely is above tolerance levels at times. Negative effects to reproductive output from small doses of ingested oil could be causing undetected impacts on marine birds and marine bird populations. Lack of standardized monitoring of marine bird contact with sheens and potential harm makes assessments of magnitude and extent of impact problematic. Key words: seabirds, offshore oil and gas, petroleum, oil sheens, produced water, operational discharges. Résumé : Les décharges d’hydrocarbures dans l’océan, tant régulées qu’accidentelles, sont occasionnées par le forage en mer et les exploitations de production, et peuvent donner lieu a ` la formation d’une irisation d’hydrocarbures (≤3 m d’épaisseur) et d’une nappe de pétrole (>3 m d’épaisseur), nuisant potentiellement aux oiseaux de mer. Les irisations peuvent généralement se produire autour des plateformes de forage pétrolier et gazier extracôtiers au Canada atlantique ; cependant, il y a peu d’information au sujet de la régularité des cas. De plus, il existe peu d’études ciblées des conséquences potentielles des irisations liées aux exploitations ex- tracôtières de pétrole et de gaz, sur les oiseaux de mer. Nous avons fait le point sur la fréquence et les sources possibles d’accumulation d’hydrocarbures sur les surfaces de la mer provenant des exploitations de pétrole et de gaz extracôtiers au Canada atlantique, et la probabilité qu’elle s’imbrique avec les oiseaux de mer. Nous avons passé la littérature en revue en ce qui a trait aux effets mortels et sublétaux sur les oiseaux de mer a ` la suite du contact et de l’ingestion de faibles niveaux de pétrole, en nous concentrant sur les études qui décrivent des dosages mesurés de pétrole. Nous avons extrapolé a ` partir de ces données sur l’exposition a ` de faibles niveaux de pétrole afin de faire le lien avec les effets possibles sur les oiseaux de mer a ` la suite de l’exposition a ` des irisations. Nous avons constaté que les irisations se trouvent autour des exploitations de production au Canada atlantique, et ce, a ` des niveaux permis de concentra- tion de pétrole dans l’eau de production. Il n’est pas possible d’évaluer la fréquence et l’étendue des cas au moyen des pratiques de surveillance actuelles. Tandis que les effets mortels immédiats sur les oiseaux de mer ne sont probablement pas communs pour les cas de graissage externe des plumes par les irisations, des facteurs de stress supplémentaires tels que le temps froid peuvent causer un effet significatif du graissage externe des plumes sur le taux métabolique de l’oiseau de mer et peuvent être mortels a ` la fin. L’ingestion de petites quantités de pétrole, des doses auxquelles on pourrait s’attendre a ` la suite d’exposition a ` des irisations, a dans quelques cas eu des effets sublétaux sur les oiseaux de mer adultes, influant principalement sur le taux métabolique, les incidences sublétales sur la santé, et l’efficacité de la reproduction. Bien que les oisillons et les œufs n’entrent pas en contact direct avec les irisations, ces étapes de la vie sont fortement sensibles au pétrole, et le transfert de pétrole des adultes exposés aux irisations est probablement au-dessus du seuil de tolérance parfois. Les effets négatifs sur l’efficacité de la reproduction a ` la suite de petites doses de pétrole ingéré pourraient être en train de causer une incidence non détectée sur les oiseaux de mer et les populations d’oiseaux de mer. À cause du manque de surveillance normalisée du contact des oiseaux de mer avec les irisations et des dommages potentiels, l’évaluation de la grandeur et de l’ampleur de l’incidence est problématique. [Traduit par la Rédaction] Mots-clés : oiseaux de mer, pétrole et gaz extracôtiers, pétrole, irisation d’hydrocarbures, eau produite, rejets d’exploitation. Received 23 November 2015. Accepted 3 May 2016. L.A. Morandin. Morandin Ecological Consulting, Victoria, BC, Canada. P.D. O’Hara. Canadian Wildlife Service, Environment and Climate Change Canada, c/o Institute of Ocean Sciences, 9860 W. Saanich Rd., Sidney, B.C., Canada; Department of Biology, University of Victoria, Station CSC, Victoria, BC, Canada. Corresponding author: Patrick D. O’Hara (email: [email protected]). Copyright remains with the author(s) or their institution(s). Permission for reuse (free in most cases) can be obtained from RightsLink. 285 Environ. Rev. 24: 285–318 (2016) dx.doi.org/10.1139/er-2015-0086 Published at www.nrcresearchpress.com/er on 4 July 2016. Environ. Rev. Downloaded from www.nrcresearchpress.com by Environment Canada on 09/30/16 For personal use only.
Transcript of Offshore oil and gas, and operational sheen occurrence: is ... ·...

REVIEW
Offshore oil and gas, and operational sheen occurrence:is there potential harm to marine birds?Lora A. Morandin and Patrick D. O’Hara
Abstract: Hydrocarbon discharges into the ocean, both regulated and accidental, occur from offshore drilling and productionoperations, and can result in oil sheen (≤3 �m thick) and slick (>3 �m thick) formation, potentially harming marine birds. Sheens maycommonly occur around offshore oil and gas platforms in Atlantic Canada, however, there is little information on regularity ofoccurrence. Further, there are few direct studies on potential impacts of sheens, associated with offshore oil and gas operations, onmarine birds. We reviewed potential sources and frequency of hydrocarbon accumulation on sea surfaces from offshore oil and gasoperations in Atlantic Canada, and the likelihood of overlap with marine birds. We conducted a literature review on lethal andsub-lethal effects of low levels of oil contact and ingestion on marine birds, focusing on studies that describe measured dosages of oil.We extrapolated from these data on low-dose oil exposure to link possible effects to marine birds resulting from exposure to sheens.We found that sheens occur around production operations in Atlantic Canada at allowable levels of oil concentrations in producedwater. Frequency and extent of occurrence cannot be estimated from current monitoring practices. While immediate lethal effects toseabirds likely are not common from external oiling of feathers from sheens, added stressors, such as cold weather, can result inexternal oiling from sheens having significant impact on seabird metabolic rate and can be ultimately lethal. Ingestion of smallamounts of oil, doses that realistically could be expected from exposure to sheens, in some cases resulted in sub-lethal effects to adultseabirds, primarily affecting metabolic rate, sub-lethal health impacts, and reproductive output. Nestlings and eggs do not come indirect contact with sheens, yet these life stages are highly sensitive to oil, and transfer of oil from adults exposed to sheens likely isabove tolerance levels at times. Negative effects to reproductive output from small doses of ingested oil could be causing undetectedimpacts on marine birds and marine bird populations. Lack of standardized monitoring of marine bird contact with sheens andpotential harm makes assessments of magnitude and extent of impact problematic.
Key words: seabirds, offshore oil and gas, petroleum, oil sheens, produced water, operational discharges.
Résumé : Les décharges d’hydrocarbures dans l’océan, tant régulées qu’accidentelles, sont occasionnées par le forage en mer et lesexploitations de production, et peuvent donner lieu a la formation d’une irisation d’hydrocarbures (≤3 �m d’épaisseur) et d’une nappede pétrole (>3 �m d’épaisseur), nuisant potentiellement aux oiseaux de mer. Les irisations peuvent généralement se produire autourdes plateformes de forage pétrolier et gazier extracôtiers au Canada atlantique ; cependant, il y a peu d’information au sujet de larégularité des cas. De plus, il existe peu d’études ciblées des conséquences potentielles des irisations liées aux exploitations ex-tracôtières de pétrole et de gaz, sur les oiseaux de mer. Nous avons fait le point sur la fréquence et les sources possibles d’accumulationd’hydrocarbures sur les surfaces de la mer provenant des exploitations de pétrole et de gaz extracôtiers au Canada atlantique, et laprobabilité qu’elle s’imbrique avec les oiseaux de mer. Nous avons passé la littérature en revue en ce qui a trait aux effets mortels etsublétaux sur les oiseaux de mer a la suite du contact et de l’ingestion de faibles niveaux de pétrole, en nous concentrant sur les étudesqui décrivent des dosages mesurés de pétrole. Nous avons extrapolé a partir de ces données sur l’exposition a de faibles niveaux depétrole afin de faire le lien avec les effets possibles sur les oiseaux de mer a la suite de l’exposition a des irisations. Nous avons constatéque les irisations se trouvent autour des exploitations de production au Canada atlantique, et ce, a des niveaux permis de concentra-tion de pétrole dans l’eau de production. Il n’est pas possible d’évaluer la fréquence et l’étendue des cas au moyen des pratiques desurveillance actuelles. Tandis que les effets mortels immédiats sur les oiseaux de mer ne sont probablement pas communs pour les casde graissage externe des plumes par les irisations, des facteurs de stress supplémentaires tels que le temps froid peuvent causer uneffet significatif du graissage externe des plumes sur le taux métabolique de l’oiseau de mer et peuvent être mortels a la fin. L’ingestionde petites quantités de pétrole, des doses auxquelles on pourrait s’attendre a la suite d’exposition a des irisations, a dans quelques caseu des effets sublétaux sur les oiseaux de mer adultes, influant principalement sur le taux métabolique, les incidences sublétales surla santé, et l’efficacité de la reproduction. Bien que les oisillons et les œufs n’entrent pas en contact direct avec les irisations, ces étapesde la vie sont fortement sensibles au pétrole, et le transfert de pétrole des adultes exposés aux irisations est probablement au-dessusdu seuil de tolérance parfois. Les effets négatifs sur l’efficacité de la reproduction a la suite de petites doses de pétrole ingéré pourraientêtre en train de causer une incidence non détectée sur les oiseaux de mer et les populations d’oiseaux de mer. À cause du manque desurveillance normalisée du contact des oiseaux de mer avec les irisations et des dommages potentiels, l’évaluation de la grandeur etde l’ampleur de l’incidence est problématique. [Traduit par la Rédaction]
Mots-clés : oiseaux de mer, pétrole et gaz extracôtiers, pétrole, irisation d’hydrocarbures, eau produite, rejets d’exploitation.
Received 23 November 2015. Accepted 3 May 2016.
L.A. Morandin. Morandin Ecological Consulting, Victoria, BC, Canada.P.D. O’Hara. Canadian Wildlife Service, Environment and Climate Change Canada, c/o Institute of Ocean Sciences, 9860 W. Saanich Rd., Sidney, B.C.,Canada; Department of Biology, University of Victoria, Station CSC, Victoria, BC, Canada.Corresponding author: Patrick D. O’Hara (email: [email protected]).Copyright remains with the author(s) or their institution(s). Permission for reuse (free in most cases) can be obtained from RightsLink.
285
Environ. Rev. 24: 285–318 (2016) dx.doi.org/10.1139/er-2015-0086 Published at www.nrcresearchpress.com/er on 4 July 2016.
Env
iron
. Rev
. Dow
nloa
ded
from
ww
w.n
rcre
sear
chpr
ess.
com
by
Env
iron
men
t Can
ada
on 0
9/30
/16
For
pers
onal
use
onl
y.

IntroductionIt is well established that marine birds are negatively impacted
by exposure to oil in the ocean (Alonso-Alvarez et al. 2007b; Burger1993; Castege et al. 2007; Munilla et al. 2011). When seabirds con-tact oil, feathers lose their water-repellent properties, resultingin penetration of water and oil, loss of buoyancy, behaviouralchanges, impaired flight, and significant reduction in ability tothermoregulate; these effects are particularly lethal in colder cli-mates and for diving birds (Burger 1993; Lambert et al. 1982; Levy1980; McEwan and Koelink 1973). In addition, oil ingestion resultsin toxic effects to marine birds (Alonso-Alvarez et al. 2007b; Balseiroet al. 2005; Leighton 1991).
While all marine birds that come into contact with oil sheensand slicks are susceptible to harm, pelagic seabirds are someof the most vulnerable birds to marine oil contamination(Camphuysen 1998). Pelagic seabird life history is characterized bya long immature stage, high annual adult survivorship, and lowreproductive output with typically one egg per clutch per year(Cairns 1992; Lack 1967). These characteristics make seabird pop-ulations sensitive to anthropogenic perturbations (Ford et al.1982). Vulnerability to oiling is higher in birds that spend most oftheir time at the surface or diving (e.g., auks, seaducks, and divers)than those that forage on the wing (e.g., storm-petrels, alba-trosses, and shearwaters), and highest for surface-dwelling sea-birds that spend most of their lives at sea (Camphuysen 1998).
Most research on effects of oil on seabirds has focused on theimpacts of larger catastrophic spills (e.g., Dunnet et al. 1982; Piattet al. 1990). While much less is known about effects of chronic,low-level oily discharges, some evidence suggests these dischargesmay pose equal, if not a greater threat to marine birds than theless common, large discharges (Camphuysen and Heubeck 2001;Wiese and Robertson 2004). Operational discharges from mari-time industrial activities, such as offshore oil and gas production,and shipping, are sources of chronic, low-level oil discharges.Hydrocarbon discharges from these industries typically are regu-lated in compliance with international protocols (e.g., Interna-tional Convention for the Prevention of Pollution from Ships(MARPOL)). Environmentally safe levels of operational hydrocarbondischarges are determined though environmental impact assess-ments but may not fully take into account effects to many marineorganisms.
In Canada, environmental impact assessments for offshore oiland gas operations have predicted no significant effects on ma-rine birds (Husky Oil 2000; Mobile Oil 1985; Petro-Canada 1997);however, these conclusions appear to be based on a lack of datarather than data showing no effects to marine birds (Fraser et al.2006). For the first time in this review we provide data, analysis,and discussion of sheen formation from operational discharges inAtlantic Canada. We then review the literature on effects of con-trolled doses of low levels of oil, externally and internally, onmarine birds. From these data, we extrapolate to possible effectson marine birds from contact with low levels of oil.
Operational discharges of hydrocarbons fromoffshore oil operations
In Canada, allowable operational discharges of hydrocarbonscan result in the formation of oil sheens. Sheens are defined ashydrocarbon concentrations on water surfaces that are less thanor equal to 3 �m in thickness, as opposed to slicks, which aregreater than 3 �m in thickness (ERIN Consulting Ltd. and OCLServices Ltd 2003). There are two main types of allowable, opera-tional discharges from offshore oil and gas drilling and produc-tion operations: (i) produced water, (ii) oil- or synthetic-baseddrilling muds and cuttings. Hydrocarbons also can be released asa result of typical operating procedures that are not necessarilycompliant with international protocols, such as storage displace-ment water, bilge and ballast water, deck drainage, produced
sand, well treatment fluids, and accidental discharges and blow-outs. However, in this review we focus on the operational dis-charges that occur at rates that are allowable in Canada.
Produced water accounts for the largest volume of waste dis-charged from offshore oil and gas operations (Neff 2002). Pro-duced water is a mixture of formation water present in the groundand injection water used to raise pressures in oil recovery, mixedwith the extracted hydrocarbons (Stephens et al. 2000). Generally,in the early stages of production, produced water volumes aresmall relative to the volume of hydrocarbons, but with time thevolume of produced water increases to exceed hydrocarbon pro-duction. Produced water is released below the surface of the oceanbut hydrocarbons can rise to the surface. In Canada, guidelinesstate that, 1.30 d volume weighted average oil-in-water (OIW) con-centration does not exceed 30 mg/L (�ppm), and 2.24 h averageOIW concentration, calculated at least twice a day, does not ex-ceed 44 mg/L (Canada’s Offshore Waste Treatment Guidelines2010). Regulations for produced water in other countries are sim-ilar, generally between 30 and 42 ppm allowable OIW (Igunnu andChen 2014).
Drilling muds are used to clean and condition drill holes, tolubricate drill bits, and to counterbalance pressure. Drilling mudscan be oil-based, water-based, synthetic-based (SBM), or enhancedmineral oil-based muds. Canadian regulations state that SBMmust contain polycyclic aromatic hydrocarbon concentrations ofless than 10 ppm, be relatively non-toxic in marine environments,and be able to biodegrade aerobically, and that there should beno more than 6.9 g/100 g remaining oil on wet solids (Canada’sOffshore Waste Treatment Guidelines 2010).
Sheen formation in Atlantic CanadaAtlantic Canada is a globally significant area for seabirds, sup-
porting over 40 million birds per year, including year-round resi-dents and species that migrate to the region for breeding (Locket al. 1994). The region is also a significant area for hydrocarbonreserves, with four active oil production operations (Hibernia,Terra Nova, White Rose, and North Amethyst) and a total produc-tion to date of over 1.5 billion barrels (C-NLOPB 2014–2015 annualreport). Drilling and production operations are a significantsource of low-level hydrocarbon discharges into the marine envi-ronments in Atlantic Canada through both regulated dischargesand accidental spills (Burke et al. 2012; ERIN Consulting Ltd. andOCL Services Ltd 2003).
Whether oil sheens are a regular occurrence, or an infrequentresult of high concentrations of oil discharge from offshore oiland gas operations, is not well-established (ERIN Consulting Ltd.and OCL Services Ltd 2003). Canadian offshore operations reportaverage hydrocarbon concentrations of 20–40 mg/L in producedwater, and that these levels can be associated with sheens (ERINConsulting Ltd. and OCL Services Ltd 2003). In addition, effluenttesting by industry to comply with guidelines may not adequatelydetect polar or lower weight hydrocarbons (C4 to C30), makingactual hydrocarbon levels greater than reported levels (ERINConsulting Ltd. and OCL Services Ltd 2003).
Sheens vary in appearance, to a certain extent corresponding tothickness (Table 1). It is important to note that sheens are a visualphenomenon and the perception of a sheen requires favourableenvironmental conditions. Estimation of oil volume based onsheen appearance is problematic because appearance and colourvary with available sunlight, sea surface state, light incidence, andthe viewing angle of the observer (ERIN Consulting Ltd. and OCLServices Ltd 2003).
However, approximate estimation of thickness and volumebased on appearance is an important tool for assessment of po-tential harm of produced water. Currently in Canada, governmentagencies and response corporations typically use the “thicknessappearance rating code” (TAR code) developed by the CanadianCoast Guard and Environment Canada to characterize sheens
286 Environ. Rev. Vol. 24, 2016
Published by NRC Research Press
Env
iron
. Rev
. Dow
nloa
ded
from
ww
w.n
rcre
sear
chpr
ess.
com
by
Env
iron
men
t Can
ada
on 0
9/30
/16
For
pers
onal
use
onl
y.

(CAPP 2009). Formation of sheens, in addition to being influencedby hydrocarbon concentration in the effluent, are influenced byhydrocarbon droplet size, water temperature differential be-tween the effluent and sea, suspended solids in the effluent, typeof hydrocarbon in the effluent, and weather – ocean surface con-ditions (ERIN Consulting Ltd. and OCL Services Ltd 2003). Oilsheens also can occur from natural processes releasing hydrocarbonsinto water.
Interviews with industry personnel from Canada’s East Coastoffshore operations, the Gulf of Mexico, and the North Sea wereconducted by ERIN Consulting Ltd. and OCL Services Ltd (2003) togauge frequency of sheen formation from produced water. Theyfound that sheen occurrence responses varied widely by region. InCanada’s east coast, occasional sheens were observed; in the Gulfof Mexico sheens were common in the 1990s but rare in the 5 yearsbefore the report; in the North Sea, sheens were a normal occur-rence. Some informants suspected that sheens could form withhydrocarbon concentrations of less than 20 ppm. Respondentsindicated that sheen observation was most likely with calm seasand on clear days (ERIN Consulting Ltd. and OCL Services Ltd2003). Other respondents suggested that sheens may be very com-mon around platforms off the east coast, and M. Fingas (ChiefScience Officer, Spill Science, Edmonton, Alberta) is cited in thesame report as saying sheens are “usually always present…visibleunder certain conditions”.
Following the ERIN Consulting Ltd. and OCL Services Ltd.Report (2003), observations of sheen occurrence from productionoperations in Atlantic Canada have been reported from 2003 topresent, and were supplied to us by the C-NLOPB (Table A1). Ac-cording to C-NLOPB Environmental Protection Plan guidelines,sheen monitoring is recommended as a means of complying withCanada Oil and Gas Drilling and Production Regulations, New-foundland Offshore Petroleum Drilling and Production Regula-tions (Government of Canada 2009). While specific protocols arenot outlined in the Regulations, most operators direct platformand rig personnel to watch for sheens as part of their daily activ-ities, investigate sources if sheens are observed, and report to theC-NLOPB within 24 h of the incident (D.G. Taylor, D.G. Taylor Inc.Pers. Comm., Nov. 2015). Because of the somewhat unspecific pro-tocols, lack of standardization in effort, training, and possibly inreporting, the analyses and interpretation of these data are useful,yet limited.
We base our analyses on data that extend from 2003 to the endof 2014, and these data were collected from production operationsonly (not exploration). There were a total of 290 reported sheensightings from produced water discharges over the 12 year obser-vation period, making the reported number of sheens aroundproduction platforms in the Grand Banks approximately 24 peryear. There was variation in the number of sheens reported peryear but no obvious trend to increasing or decreasing sheen oc-currence based on the information provided (Fig. 1).
In 155 of the 290 reported sheen occurrences, there was one ormore OIW concentration measure for produced water reported inconjunction with the occurrence. In some cases, a range of valueswas reported (e.g., OIW below 25 mg/L). If a range was given,rather than actual concentrations, we used the largest number inthe range for our calculations. Using the maximum value poten-tially results in a greater value for OIW in association with sheenoccurrence than if we had actual OIW values for our calculations.We consider this a conservative approach because we are explor-ing minimum threshold OIW values associated with sheen detec-tions. In 135 of the 290 reported sheens from produced water,there was either no information on OIW, or it was reported thatthe OIW was “in spec” (within specified allowable limits); and there-fore those 135 reported observations are not included in our calcu-lated average of OIW during sheen occurrence.
The range of reported values during sheen occurrence was4–137 mg/L with an average OIW of 29.8 mg/L and a median valueof 28 mg/L (Fig. 2). The average and median OIW values duringsheen sightings fall well within allowable limits, and thereforesheens may be a regular occurrence around platforms when oce-anic conditions are favourable for formation (calm seas). This issupported by the distribution of sheen reports on a yearly basis,which shows that almost 50% of sheens are reported during thefour months of May, June, July, and August when calm seas aremost likely (Fig. 3). However, the skew of more observations ofsheens in the summer months corresponds to longer daylighthours (see Fig. 3) and therefore greater potential observation timeper day. Because observation durations per day and protocolswere not made available to us, we do not adjust sheen occurrenceby day length but note the potential for day length to skew obser-vations.
Although we requested OIW measures independent of sheenoccurrences, they were not provided to us, and for this reason, wecannot make inferences on relative contributions of OIW concen-tration versus oceanic conditions to sheen occurrence. Becausesheens cannot be observed at night, and are less likely to be seenon overcast days, number of reported sheens, even with the mostvigilant observation protocols, will be an underestimate of actualnumber of sheens.
Some data on sheen colour around platforms off the east coastof Canada are available and are presented in Table A1. The major-ity of sheens reported, for those that have a qualitative descrip-
Table 1. Estimated oil sheen thickness andvolume based on visual appearance using the“thickness appearance rating” (TAR) code, devel-oped by the Canadian Coast Guard and Environ-ment Canada.
Appearance Thickness (�m) Volume (L/km2)
Barely visible 0.04 50Silver sheen 0.07 100First colour trace 0.1 200Bright colours 0.3 400Dull colours 1 1200Dark colours 3 3600
Note: TAR code is used as the standard reference forobservation and quantification of oil on water (CAPP2009).
Fig. 1. Number of oil sheens reported each year to the CNLOPBfrom produced water discharge, from three oil and gas productionplatforms in Atlantic Canada (Hibernia, Terra Nova, and WhiteRose). Observations for sheen occurrence are believed to occurcontinuously during daylight hours and reporting compliance isbelieved to be high.
Moramdin and O’Hara 287
Published by NRC Research Press
Env
iron
. Rev
. Dow
nloa
ded
from
ww
w.n
rcre
sear
chpr
ess.
com
by
Env
iron
men
t Can
ada
on 0
9/30
/16
For
pers
onal
use
onl
y.

tion, were characterized as blue-grey, silver, and silver withcolour. These characterizations may describe sheens in the rangeof 0.07 to 1 �m in thickness (see Table 1). Thick sheens seem to bea rare occurrence based on the reported observations from theCanadian offshore operations (which frequently mention blue orcolour sheens, but not specifically dark colour).
Based on these results, guidelines that reduce allowable amountsof OIW during summer months may help operators minimizesheen occurrence. However, these data also suggest that sheenscan occur even at very low OIW concentrations, if conditions arefavourable, and sheen occurrence may be unavoidable with cur-rent operating procedures and produced water discharge into theocean.
Fate of hydrocarbons from offshore oil and gasoperations
In addition to rates of sheen formation, it is important to knowthe spatial and temporal extent of hydrocarbon accumulationfrom offshore oil facilities. When produced waters are dischargedthey typically contain remnant particulate oil, dissolved oil, or-ganic acids, phenols, metals, production chemicals, and radioac-tive material (Neff 2002).
Environmental assessments for some offshore operations in At-lantic Canada acknowledge that subsurface discharges may rise tothe surface, but that rapid dilution and evaporation takes place(Husky Oil 2000; Mobile Oil 1985; Petro-Canada 1997). ERINConsulting Ltd and OCL Services Ltd (2003) reported that at onemicrometre thickness sheens may persist for up to 24 h whereasat 0.1 �m, sheens disappear within 20 to 60 min. In the North Sea,where sheens occur frequently, they have been observed stretch-ing up to one kilometre or more from platforms depending onwind and currents. Sheens often begin as small areas a few metresin diameter and spread into thin trails a few hundred metres long,disappearing within an hour (ERIN Consulting Ltd and OCLServices Ltd 2003).
Impacts of oil on aquatic birdsEnvironmental assessments of offshore drilling operations in
Atlantic Canada have concluded that potential effects to seabirdsfrom regulated discharges are “negligible” or “non-significant”(Husky Oil 2000; Mobile Oil 1985; Petro-Canada 1997). Fraser et al.(2006) and Burke et al. (2012) question this assertion and point outthat no evidence is provided to support the no-effects conclusions.Fraser et al. (2006) refuted the negligible impact conclusions using
a model of sheen formation and risk to auks. They predicted 3.6–100% mortality of the auk population in a 1 km2 area around aplatform, resulting in an assessment of low to high impact ofoffshore oil operations. They stress that lack of access to data onfrequency of sheen formation from offshore oil operations in theGrand Banks severely impairs attempts to accurately assess risk tomarine birds (Fraser and Ellis 2009; Fraser et al. 2006).
Oil pollution has the potential to impact seabirds through ex-ternal oiling of plumage, toxic effects due to ingestion of oil, andby contaminating or killing their nutritional sources (Jenssen1994). Short-term and long-term studies of large marine oil spillsshow negative impacts to marine bird survival (Burger 1993;Goldsworthy et al. 2000; Munilla et al. 2011), physiological impair-ment (Alonso-Alvarez et al. 2007a; Balseiro et al. 2005; Leightonet al. 1983), disruption to reproductive output, and long-term pop-ulation declines (Barros et al. 2014; Golet et al. 2002; Irons et al.2000; Lance et al. 2001). Yet, there is little direct data on the impactof chronic, low-level oil pollution and sheens on marine birds. Wetherefore summarize effects of low levels of hydrocarbons on ma-rine birds from controlled dose studies (Table A2). We then usethese data to make inferences on possible effects of sheens fromoffshore operations on marine birds in general and within theAtlantic region context.
External oiling
Feather microstructureIn addition to flight, feathers are important for both insulation
and buoyancy on water. Feather microstructure, made up of barbsand barbules, creates an interwoven mesh structure that traps airunder water, and results in a waterproof barrier (Stephenson1997), but still allows for breathability out of the water. It is thismicrostructure and the oleophilic nature of the structure andfeather material that result in the water repellency of feathers(Rijke 1970). In water birds, the structure within and betweenfeathers is adapted to the specific (high) surface tension of unpol-luted water (Swennen 1978). Oil adheres to bird feathers causing areduction in water repellent properties by collapsing the inter-locking structure of barbs, barbules, and hooks (Hartung 1967;Jenssen 1994; Jenssen and Ekker 1988). In addition to disruptingthe feather microstructure, oil and other materials lower the sur-face tension of water resulting in feathers being less able to resistpenetration (Stephenson 1997; Stephenson and Andrews 1997;Swennen 1978). A compromise of feather integrity can result inwater penetrating plumage and displacing the layer of insulatingair, which may result in loss of buoyancy, hypothermia, anddeath.
There are few studies specifically examining the effects of oilingon microstructure of feathers and water and oil penetration.Hartung (1967) was the first to observe and report on featherstructural changes caused by oil. Hartung examined oiled andunoiled mallard (Anas platyrhynchos) feathers and observed severematting and a “deranged” appearance in the barbules of oiledfeathers. A study on cleaning feathers following immersion invarious oils noted that feather microstructure returned to a pre-oiling state after magnetic cleansing (Orbell et al. 1999). Morerecently, significant feather microstructure disruption and oiland water uptake were shown for seabird feathers exposed tosheens of petroleum and fish oil (Morandin and O’Hara 2014;O’Hara and Morandin 2010). Because these studies were on singlefeathers, it is not possible to scale up to effects of sheens on wholebirds; however, it was evident that thin sheens significantly dis-rupt feather structure, and their water-repellent and insulativeproperties. If the oil and water were to penetrate more than theouter feathers, effects on birds could be severe.
Metabolic rateBecause oil on feathers can result in water penetration, one of
the major effects of external oiling is elevated metabolic rate.
Fig. 2. Frequency of reported sheens, from produced waterdischarge, from three production platforms in Atlantic Canada(Hibernia, Terra Nova, and White Rose) between 2003 and 2014.
288 Environ. Rev. Vol. 24, 2016
Published by NRC Research Press
Env
iron
. Rev
. Dow
nloa
ded
from
ww
w.n
rcre
sear
chpr
ess.
com
by
Env
iron
men
t Can
ada
on 0
9/30
/16
For
pers
onal
use
onl
y.

Portier and Raffy (1934) were the first to publish findings on theeffects of oil on bird thermoregulation. They found that afterexternal oiling, exposure to low air temperatures or immersion inwater resulted in a lowering of body temperature and concludedthat oiled seabirds are particularly susceptible to hypothermiabecause rate of heat loss can exceed heat production capacity.
Hartung (1967) found a doubling of metabolic rate in mallardducks after experimentally oiling plumage with 15 g of oil at–10 °C compared to control birds, and a similar response in blackducks (Anas rubripes). Hartung described a dose-dependent re-sponse of metabolic rate to oiling with 5–50 g of various oil types.Lambert et al. (1982) exposed mallard adults to a simulated 50 �mthick crude oil slick under laboratory conditions for 1 h and thenmeasured metabolic rate in a –12 °C chamber. They found a sig-nificant increase in metabolic rate of birds after exposure to theoil slick compared to control birds. Exposed birds were observedshivering and microscopic feather inspection revealed that bar-bules of oiled feathers were matted into clumps leading theauthors to conclude that disruption of the smooth, organizedstructure of feathers caused water to penetrate the plumage.Jenssen and Ekker (1991) found that metabolic heat production ofcommon eiders (Somateria mollissima) resting in 5.5 °C water for 3 hafter external application of 10–70 mL of crude oil increased overtime and with dose, and that there was no change in metabolicrate at the low dose of 2.5 mL. Eiders are a large, well-insulatednorthern bird and any impacts of oiling found in eiders likelywould be as bad or worse in other smaller, or less insulated sea-birds (Robertson et al. 2014). Adelie Penguins (Pygoscelis adeliae)with residual vegetable oil on their plumage had metabolic rates50% higher than control birds, and the authors hypothesized thatexposure to oil could lead to mass losses of penguins (Culik et al.1991). Butler et al. (1986) dosed birds externally with 1.0 mL ofcrude oil and found no change in metabolic rate; however, birdswere maintained in relatively warm temperatures during the ex-periment and were not exposed to water. Disruption of waterrepellence of feathers has greater implications for heat loss andthus metabolic compensation for birds that are on water or wet-ted after oiling as opposed to oiled birds in dry conditions (seeJenssen 1994). Even with undisturbed, water-repellent feathers,seabirds floating on water surfaces in medium and high latitudesrequire an increased metabolic rate to maintain body tempera-
ture and further stress from cold water penetration can result indeath (Stephenson 1997).
Behavioural effectsDrying out on land after water penetration of contour feathers
could aid in thermoregulation, reducing heat loss to water, whichhas a higher specific heat capacity than air. The immediate re-sponse of some oiled and wetted birds is to seek land; however,this poses additional problems, such as reduced time for foragingand breeding, and increased risk of predation (Stephenson 1997).Pelagic seabirds forage solely in the marine environment and thusdrying out on land may result in starvation (Hartung 1967; Jenssen1994).
Burger and Tsipoura (1998) applied fresh and weathered oilto the belly feathers of sanderlings (Calidris alba) simulating20% plumage oiling. Oiled birds spent less time resting and moretime bathing and preening, resulting in increased spread of oil onfeathers and less time feeding. The amount of oil evident on feath-ers steadily decreased over 2 weeks, but was never completelyeliminated. Similarly, Burger (1997) found that time spent preen-ing was increased and time spent feeding was decreased propor-tionally to amount of oil on semipalmated plovers (Charadriussemipalmatus). Burger speculated that the decrease in time allo-cated to foraging could prove fatal or reduce reproductive outputin birds that are already time-stressed.
Conversely, Camphuysen (2011), examining lesser black-backedgulls (Larus fuscus) following oil spills, found that most oiled birdswere clean within a week and bred successfully, without humanintervention. Camphuysen noted that oiled birds usually wereabsent from the colony for a few days following the oiling event,but then displayed normal behaviour following their return, andconcluded that due to effective preening behaviour, and theiraccess to land for food and cleaning (unlike pelagic seabird spe-cies), long-term survival and reproduction of these gulls may notbe significantly impacted by smaller quantities of oil resultingfrom exposure to chronic oil pollution. Perhaps this is not surpris-ing, as Camphuysen noted that gulls as a group (Larids) are rankedrelatively low among marine birds in terms of Oil VulnerabilityIndex (Camphuysen 1998; King and Sanger 1979) because theyroost on land. However, the study only directly examined a coupleof birds’ breeding success and was further hindered in that many
Fig. 3. Proportion of oil sheens observed off of production platforms in Atlantic Canada, attributed to, or suspected to be from, oil inproduced water, separated by month, over a 12 year period, from 2003 to 2014. Day length is the interval, in hours, from sunrise to sunset atthe middle of each month for latitude 46.75°N.
Moramdin and O’Hara 289
Published by NRC Research Press
Env
iron
. Rev
. Dow
nloa
ded
from
ww
w.n
rcre
sear
chpr
ess.
com
by
Env
iron
men
t Can
ada
on 0
9/30
/16
For
pers
onal
use
onl
y.

gulls from both oiled and unoiled categories gave up breedingduring the oil event year. As well, Camphuysen (2011) did notcollect toxicological data from oiled individuals (see subsectionentitled Internal Toxicity).
Preening can result in eventual, effective removal of oil fromplumage for some birds, primarily those with access to land andwarmer climates; however, behavioural changes during the clean-ing time and toxic effects from ingestion pose serious threats tosurvival and reproduction for many marine bird species. Yet, an-other study found that preening resulted in greater effects thanoil left alone on the feathers because preening resulted in oilbeing spread around and into feathers, enhancing metabolic heatloss (Jenssen and Ekker 1991).
Internal toxicityIt is well known that large-volume oil spills cause toxicological
effects to marine birds, often resulting in death from acute toxicityor multiple sub-lethal effects (Balseiro et al. 2005; Briggs et al. 1997,1996; Burger and Tsipoura 1998; Esler et al. 2000; Goldsworthy et al.2000; Golet et al. 2002; Golightly et al. 2002; Irons et al. 2000; Khanand Ryan 1991; Parsons and Underhill 2005; Stubblefield et al.1995b; Wiens et al. 2001). Ingestion of oil, from preening oiledfeathers, drinking water with oil, or from oiled food sources, neg-atively impacts reproductive ability (Butler et al. 1988; Cavanaughand Holmes 1987), disrupts hepatic function (Gorsline and Holmes1981, 1982; Gorsline et al. 1981), osmoregulatory function (Holmeset al. 1978), increases metabolic rate (Butler et al. 1986), causesanemia (Balseiro et al. 2005; Leighton et al. 1983; Newman et al.1999), and oxidative damage to red blood cells (Couillard andLeighton 1993; Newman et al. 1999). Reproductive disruptions in-clude increased embryo mortality, decreased hatchling success,and decreased chick growth (Butler et al. 1988). Whether ingestionof low doses (i.e., dosage levels expected from exposure to oilsheens) results in toxic effects to marine birds has not been well-studied. In the following sections, we review studies that use con-trolled, relatively low doses of oil on adult and juvenile seabirds,and seabird eggs.
Toxicity of oil to adult aquatic birdsThere are relatively few controlled-dose studies on direct toxic
effects of low levels of oil to adult marine birds. An early studyshowed that acute oral LD50 values for several petroleum-derivedproducts on waterfowl range from 7 to 20 mL/kg (Hartung andHunt 1966). Some of the toxic effects common to all the industrialoils they tested were lipid pneumonia, gastrointestinal irritation,fatty changes in the liver, and adrenal cortical hyperplasia. Theyfound that toxicity of oils was greatly enhanced when birds werestressed by crowded conditions and cold temperatures, loweringLD50 values to 1–4 mL/kg. Translating these results to seabirds, fora common murre (Uria aalge) weighing 1 kg for example, as little as1 mL of ingested oil could result in death in cold climates.
Other studies have focused on testing effects of lower levels ofoil ingestion. While not testing toxicity per se, Butler et al. (1986)internally dosed adult Leach’s storm-petrels (Oceanodroma leucorhoa)with 0.1 mL of Purdue Bay Crude Oil (PBCO) and found a 25%increase in metabolic rate over control birds 24 h after dosing.They speculated that some of the metabolic increases seen fromexternal oiling in other studies may be due to ingestion frompreening. A recent study on yellow-legged gulls (Larus michahellis)breeding pairs internally dosed with only 0.04 mL of Prestige oilfor 7 days showed significant, negative effects (Alonso-Alvarez et al.2007b). Most notably, they found significant decreases in blood glu-cose and phosphorus, higher levels of two aminotransferases, and asignificant decrease in blood calcium in female birds.
Similar to the increased effects of external oiling when exposedto multiple stressors, internal toxicity can be more severe andevident at lower doses when birds experience even minor coldstress. Holmes et al. (1978, 1979) fed ducks 3–6 mL of crude and
fuel oil over 100 days. Bird death was minimal over the first half ofthe experiment while temperatures were maintained at 27 °C, butwhen temperatures were lowered to 3 °C, mortality in all of theoil-treated groups increased to 60%–90%. Birds in control groupsalso experienced an increase in mortality when under cold stress,but death did not occur as quickly or in as high numbers as inthe oiled groups. The authors concluded that consumption of oilis problematic when there are multiple, additive physiologicalstressors.
Negative effects on reproduction have been shown to occur atrelatively low levels of oil ingestion (e.g., Butler et al. 1988; Fowleret al. 1995; Miller et al. 1980; Peakall et al. 1982; Trivelpiece et al.1984). Reproduction could be impacted by transfer of oil fromadults to eggs, nestlings (discussed in following sections), or directsub-lethal effects to adults that result in impaired ability to pro-duce healthy eggs or provision offspring. Cavanaugh and Holmes(1987) fed female mallard ducks 3 mL/100 g dry food (no estimatewas provided of actual amount of oil ingested per bird) each dayfor 50 days. They found significant decreases in reproductive hor-mones and significant delays in egg laying in the group fed oil.They hypothesized that such sub-lethal effects could seriouslythreaten survival of seabird populations, which characteristicallyhave low annual recruitment of fledglings. Similarly, a series ofstudies using low doses of oil (2.5 mL/kg with ranges of actualdoses from 0.02 to 0.3 mL per adult) found a 40% decrease inhatching success of Leach’s storm-petrels, a decrease in chick sur-vival up to 50% when a single member of a breeding pair wasintubated, significantly lower weight gain of chicks with oiledparents, and damage to adult nasal and adrenal glands (Milleret al. 1980; Trivelpiece et al. 1984). The authors hypothesized thatthe decreased hatching success, chick growth, and chick survivallikely were due to temporary desertion of the burrow and (or)impaired ability of oil-treated adults to provide for their young.
Despite evidence that even small amounts of ingested oil canimpact adult metabolic rate, health, and reproductive output,there are other low- and high-dose studies that show no negativeimpacts on adults. In a study on oxidative damage to red bloodcells in adult rhinoceros auklets (Cerorhinca monocerata) exposed toPBCO, low dose birds received 2.5 mL/kg body weight of oil for fiveconsecutive days (Newman et al. 1999). There were no negativeeffects on any of the tested blood parameters. Stubblefield et al.(1995a) assessed acute and sub-acute toxicity of weathered ExxonValdez crude oil (WEVC) on mallard ducks. In the acute tests,ducks were fed 5 g/kg body weight WEVC and observed for 14 d.They concluded that acute oral LD50 exceeded 5 g/kg and theyobserved no treatment-related toxicity during the study or in post-mortem examination. They hypothesized that weathered oil maybe less toxic than unweathered oil. In addition, Alonso-Alvarezet al. (2007b), in the study described earlier on yellow-legged gulls,showed that the low dose of 0.04 mL of oil over 4 days showed noimmediate effects on reproductive output. A study on the repro-ductive impacts of ingested oil in Cassin’s auklets (Ptychoramphusaleuticus) found no effect of doses less than 0.6 g (�0.7 mL) of oilbut did see a reduction in the number of eggs laid for birds inthe 1 g dose group (Ainley et al. 1981). Cassin’s auklets are about3–4 times the weight of Leach’s storm-petrels, which may in partaccount for the lack of effect on reproduction.
Toxicity to chicks and embryos
ChicksLab and field studies have shown that even small levels of oil
ingested by chicks can impact nestling growth, metabolism, en-docrine balance, and liver function (e.g., Butler and Lukasiewicz1979; Lee et al. 1985; Peakall et al. 1980; 1982). Tests of effects ofingestion of PBCO and Hibernia crude oil were conducted on nest-ling herring gulls (Larus argentatus) (Lee et al. 1985). Birds received4 mL/kg or 10 mL/kg (approximately 1.8 mL/bird and 4.6 mL/bird
290 Environ. Rev. Vol. 24, 2016
Published by NRC Research Press
Env
iron
. Rev
. Dow
nloa
ded
from
ww
w.n
rcre
sear
chpr
ess.
com
by
Env
iron
men
t Can
ada
on 0
9/30
/16
For
pers
onal
use
onl
y.
respectively) of PBCO or 10 mL/kg of Hibernia crude oil for sixconsecutive days. Hepatic cytochrome P-450 was increased four-fold, along with increases in other hepatic and renal mixed func-tion oxidase activities, suggesting that ingestion of toxins induceda metabolic response to enhance elimination of toxic chemicals.In another study on herring gull nestlings receiving 10 mL/kg(approximately 4.6 mL/bird) of PBCO for 5 days, severe hemolyticanemia was evident (Leighton et al. 1983).
Miller et al. (1980), using lower doses than in the precedingstudies, fed nestling herring gulls 1 mL of PBCO and examinedchanges in mass for 4days, comparing birds to a control groupthat were sham dosed. All birds were deprived of food during theexperiment. The dosed birds lost mass at twice the rate of controlbirds and the authors hypothesized that oil dosing caused anincrease in metabolic rate. Using even smaller doses, Peakall et al.(1980) fed nestling black guillemots (Cepphus grille) with 0.1–0.5 mLof weathered South Louisiana Crude Oil and detected a transientrise in plasma sodium, a decrease in growth rate, and hypertrophyof adrenal glands.
Prichard et al. (1997) fed pigeon guillemot (Cepphus columba)nestlings 0.05 and 0.2 mL of weathered PBCO twice, at 20 and25 days post-hatching and examined blood for protein biomarkersrelated to health. They found only a weak treatment effect onblood proteins and no effect on sodium levels, liver enzymes, orbird growth or body mass and concluded that the doses used werenot large enough to cause a negative impact. They also speculatedthat because weathered crude oil is less toxic than unweatheredoil as a result of loss of low molecular weight aliphatics and aro-matic fractions by evaporation and dissolution (Stubblefield et al.1995a), their use of weathered crude oil may have resulted inminimal detectable impact.
While data indicate that nestlings may be more susceptible toacute effects from ingestion of low levels of oil, seabird nestlingswould not be directly exposed to hydrocarbons from offshoredrilling and production operations. However, transfer of oil tonestlings likely could occur through external contact with fouledplumage of adults (Albers 1980), transfer from adults to eggs (Kingand Lefever 1979), or through ingestion of contaminated food(Alonso-Alvarez et al. 2007a).
EmbryosThere is some evidence that oil on eggs may negatively impact
developing embryos, even at very low dose levels (Couillard andLeighton 1989, 1990, 1991; Hoffman and Albers 1984; King andLefever 1979). While embryos were exposed externally in experi-ments, through transfer or application of oil to eggs, we includethe discussion of embryo impacts in the internal toxicity sectionof this report because the primary impact is thought to bethrough toxicity. Couillard and Leighton (1989, 1990, 1991), in aseries of studies on the effects of various oils on chicken (Gallusgallus domesticus) embryos, found that eggs externally dosed with2.6–20 �L of various types of crude oil suffered subcutaneousedema, liver necrosis, dilation of the heart, renal tube mineraliza-tion, and enlargement of the spleen. When eggs were exposed to5 �L of PBCO at 8–8.5 d old, there was 100% mortality. Exposure at9 d old with12 �L of PBCO resulted in 32% embryo mortality,indicating that embryos may be particularly sensitive at certaindevelopmental stages. Conversely, Stubblefield et al. (1995b) foundno negative impacts on hatchling survival or growth after appli-cation of WEVC to 1/6–1/3 of mallard eggs. They concluded thattheir results may differ from similar studies that found negativeimpacts of crude oil on eggs because of the use of less toxic weath-ered oil in their study, as opposed to unweathered oil. Hoffmanand Albers (1984) estimated LD50 levels of various types of crudeand refined petroleum for mallard embryos. They found thatmany of the petroleum products were embryotoxic and had LD50
of 0.3–5 �L/egg.
Laughing gulls (Leucophaeus atricilla) dosed with 2.5 mL of oil tothe breast feathers transferred oil to eggs, resulting in 41% embryomortality compared to 2% for controls (King and Lefever 1979).They speculated that the cause of mortality was from egg smoth-ering and (or) toxicity of the oil, rather than behavioural changesin the incubating adults. Albers (1980) exposed breeding mallardsto water with 100 or 5 mL of PBCO per square metre of watersurface area and observed breeding behaviour, hatching success,and duckling survival. The oil thicknesses that the birds wereexposed to correspond to oil films 0.1 and 0.005 mm thick for thehigh and low treatments, respectively. The 0.005 mm treatment isonly slightly thicker than a sheen (which are up to 0.003 mmthick). Albers found that there was oil transfer from adults to eggsin both treatments, in a dose-dependent fashion. Hatching suc-cesses (proportion of eggs hatched) were 96%, 80%, and 47% in thecontrol, low, and high treatment groups, respectively. Survivalrate of hatchlings and incubation behaviour of adults did notappear to differ among treatments. Albers concluded that sub-acutely oiled birds continue to incubate their eggs normally, butthat transfer of oil to eggs could have devastating effects on em-bryos and hatchability.
Extrapolation to effects of oil sheensMost studies on marine birds and oil have examined the effects
of contact with large oily discharges that are not typical of pro-duced water or SBM discharges, which typically cause thinnerlayers of oil of 3 �m or less in thickness (sheens). A light silversheen, possibly the thinnest sheen that can be visually observed,and likely only on a clear day with calm water, is approximately0.04 �m thick and has a hydrocarbon volume of about 0.04 mL/m2
of sea surface. Thicker sheens that show trace colours are 0.1 �m,and bright to dark colour sheens are approximately 0.3–3 �mthick with a corresponding volume of 0.3–3 mL/m2. How much oila bird would pick up from a sheen is, of course, a critical questionwhen assessing impacts. Lambert et al. (1982) observed that mal-lard ducks in a swim tank 50 cm × 52 cm × 30 cm with a 50 �mthick oil slick picked up almost all of the oil from the surfacewithin a few minutes. The lipophilic (or hydrophobic) nature ofthe materials that make up feathers (keratin coated with waxesand esters) (Stephenson and Andrews 1997) likely cause them toreadily adhere to oil. Birds swimming in sheens therefore couldpick up an appreciable proportion of the surface oil that theycontact directly. While the lipophilic nature of feathers couldcause a “wicking” effect (i.e., oil moving in behind oil drawn upthe feathers) causing greater oil absorption than would be esti-mated by direct contact, we keep our estimates conservative anddo not factor in additional oil uptake from this potential wickingeffect.
While studies point to “minute” amounts and “small spots” ofoil causing significant impact and death, none quantified exactamounts meant by those qualitative descriptions. We hypothesizethat those qualitative descriptions likely are equivalent to 1 mL ofoil or less. There is definitive evidence of impacts of external andinternal impacts of approximately 5 mL of oil ingested or on plum-age. We therefore provide context for oil transfer of 1 and 5 mLwhen birds are exposed to sheens. For a bird to pick up 1 mL of oilfrom a trace colour sheen (�0.1 �m thick), it would need to swimthrough the equivalent of about 10 m2 of sheen and pick up allof the oil from the area. A bird swimming through a colour sheen(�1–3 �m thick) could come in contact with 1 mL of oil in 0.3–1 m2
of surface, making it likely that these thicker sheens could resultin significant oil transfer. For a bird to pick up 5 mL of oil from atrace colour sheen (�0.1 um thick), it would have to swim throughthe equivalent of approximately 50 m2 of sheen and pick up allof the oil from the area; not a likely scenario. Yet, a bird swimmingthrough a colour sheen (�1–3 �m thick) could come in contactwith up to 5 mL of oil less than 2 m2 of surface, making it plausiblethat, at the least, 5 mL of oil could be picked up by a bird swim-
Moramdin and O’Hara 291
Published by NRC Research Press
Env
iron
. Rev
. Dow
nloa
ded
from
ww
w.n
rcre
sear
chpr
ess.
com
by
Env
iron
men
t Can
ada
on 0
9/30
/16
For
pers
onal
use
onl
y.

ming in a colour sheen. In the next subsection, in the context ofthe literature discussed (Table A2), we assess whether oil fromsheens could result in harm to marine birds.
External oilingEffects on thermoregulation are proportional to the amount of
oil to which birds are exposed and the extent of coverage onplumage, with only a small spot of oil, 5 mL, and 10 mL shown tosignificantly increase metabolic rate (Hartung 1967; Jenssen 1994;McEwan and Koelink 1973). Studies have reported that even“minute” oiling of plumage can be fatal to birds when combinedwith stresses imposed by severe environmental conditions (Hartung1967; Levy 1980; McEwan and Koelink 1973). This is supported byour studies, which show disruption of feather microstructure,and oil and water uptake when feathers are exposed to thinsheens of petroleum and fish oil (Morandin and O’Hara 2014;O’Hara and Morandin 2010). In addition, beached bird surveyscommonly find dead birds with only small spots of oil on theirplumage. Researchers believe that these small amounts of oil (pos-sibly equivalent to about 1 mL of oil) when found on beachedbirds, particularly when it is heavy oil, result in wetting and hy-pothermia, and are the primary cause of death (Francis Wiese,Pers. Comm., July, 2016).
InternalIt is unlikely that exposure to oil sheens resulting from dis-
charges of hydrocarbons within regulated amounts would causeacute toxic effects to adult seabirds. However, a number of studieshave found sub-lethal effects and reproductive effects on adultbirds, when as little as 0.02–3 mL of oil was ingested, singly or overa number of days. The primary route of internal exposure for birdsexposed to sheens is from preening oiled feathers (although in-gestion can also occur from “drinking” oiled water and eatingoiled food).
Studies show that birds will preen from 50% to “most” and “all”of the oil from their feathers over a few days (Birkhead et al. 1973;Camphuysen 2011; Hartung 1963, 1964; Stubblefield et al. 1995a).Using the conservative estimate of 50% of oil on plumage preenedand ingested, a bird fouled with 0.04 mL of oil on its plumagecould experience sub-lethal toxic effects described in previoussections. Because a sheen can have up to 3 mL of oil per squaremetre, it is plausible that a seabird swimming in a sheen couldpick up at least 0.04–2 mL of oil on its feathers. It is reasonable topropose then, that some sub-lethal toxic effects are experiencedby adult seabirds from sheen exposure. It is important to empha-size that some studies on adult birds (reported in previous sec-tions and in Table A2) found no effects of low levels of oilingestion on factors they tested. Possible explanations for differ-ences between study findings are the use of weathered versusunweathered oil, species, and (or) size of bird tested, and re-sponses tested. Therefore, sub-lethal effects of sheens on adultseabirds is expected to vary based on factors, such as age of oil thata bird contacts (weathered or unweathered), bird species and size,and feeding mode.
Nestlings are more susceptible to acute toxicity from low levelsof oil ingestion than adult birds, showing consistent, negativeeffects with ingestion levels as low as 0.1 mL. Nestlings, however,do not come in direct contact with sheens, and transfer rates tonestlings from oiled adults have not been quantified. It is plausi-ble that adults exposed to oil sheens could transfer small amountsof oil to nestlings at sufficient dosages to cause toxic effects, basedon the low nestling toxicity threshold.
Like nestlings, eggs will not come in direct contact with sheens;however, embryos are susceptible to even minute amounts of oil.King and Lefever (1979) showed that 2.5 mL of oil applied to incu-bating laughing gulls resulted in 41% embryo mortality (comparedto 2% in controls); it therefore follows that birds exposed tothicker sheens could pick up oil at levels that cause significant
embryo mortality. Albers (1980) found transfer of oil to eggs fromadults that were oiled from slicks that were only slightly thickerthan sheens. There was decreased hatching success of eggs com-pared to control eggs, making it one of the few studies to show adirect causal link between oil sheens and decreases in reproduc-tive output. With an LD50 for mallard embryos of 0.3–5 �L a birdwould need to pick up only 0.1 mL of oil and transfer about 5% toan egg in order for the egg to be dosed with 5 �L of oil. Whilespecies will differ in their susceptibility to oil, these findingsmake it plausible that some amount of embryo mortality is occur-ring from seabird exposure to sheens. However, it should be notedthat exposure of adults (and consequently, nestlings and eggs) tooil discharged in the production areas in the Atlantic is unlikelyduring breeding because most Atlantic species do not travel dur-ing foraging trips as far as oil platforms, which lie approximately300 km offshore. Leach’s storm-petrel are an exception as birdsbreeding in Nova Scotia have been shown to fly thousands ofkilometres in single foraging trips during the breeding season(Pollet et al. 2014).
Population effectsStudies of marine bird populations following major oil spills
indicate that there are both short- and long-term negative impactson populations (Esler et al. 2000, 2002; Golet et al. 2002; Irons et al.2000; Lance et al. 2001; Votier et al. 2005). Population effects fol-lowing oil exposure will vary based on many factors includingwhether the species are pelagic or not (Lock et al. 1994; Votier et al.2005), and feeding mode, such as diving (Irons et al. 2000) orsurface feeding birds (Butler et al. 1988). Further, it is reasonableto expect vulnerability to vary within species with life historystages and annual cycles. For example, immature birds may beless capable of preening and recovering feather function thanolder, more experienced birds. Birds may also be more susceptibleto effects of external oiling during moult, particularly if theyexperience periods of flightlessness (Stone et al. 1995).
Some of the most vulnerable birds to oil spills in Canada(chronic and acute) are alcids, with murres often making up thelargest proportion of dead individuals found after spills (Ironset al. 2000; Robertson et al. 2006; Wiese and Ryan 2003). Modelsestimating recovery time of pelagic bird populations followinglarge or chronic discharges are hampered by the inadequacy ofdata to form the basis for these models; however, there is somesuggestion that even very small decreases in fecundity or adultsurvivorship cause large increases in recovery time, especially forthose species with already low reproductive rates and adult re-cruitment (Ford et al. 1982). In addition, chronic, low-level pollu-tion could result in changes in survivorship and fecundity thatmake populations more susceptible to large-scale perturbations(Ford et al. 1982). It has been proposed that chronic dischargesmay be more detrimental to seabird population stability thanperiodic major discharges (Burger 1992; Wiese and Ryan 2003) andit has been shown that timing and location of oil is a better deter-minant of seabird mortality, and population effects, than volumeof oil (Burger 1993). Further, Wiese et al. (2004) showed how mul-tiple anthropogenic stressors can lead to cumulative effects whenmortality rates attributable to these stressors are additive as op-posed to compensatory.
Understanding how seabirds interact with offshore oil and gasoperations can also be important for estimating potential impactsfrom operational discharges of hydrocarbons. It is known thatsome seabird species are attracted to offshore drilling and produc-tion structures, potentially exacerbating any impact that hy-drocarbon discharges from offshore operations could have (Burkeet al. 2012; Fifield et al. 2009; Ronconi et al. 2015). Tasker et al.(1986) estimated that seabirds were approximately seven timesmore dense within 500 m of platforms than in locations furtherfrom platforms. Similarly, Baird (1990) estimated bird density in-
292 Environ. Rev. Vol. 24, 2016
Published by NRC Research Press
Env
iron
. Rev
. Dow
nloa
ded
from
ww
w.n
rcre
sear
chpr
ess.
com
by
Env
iron
men
t Can
ada
on 0
9/30
/16
For
pers
onal
use
onl
y.

creases of six to seven fold in locations after commencement ofdrilling and production operations. In Atlantic Canada, Wieseet al. (2001) estimated that seabird concentrations near offshoreoil platforms in the Grand Banks were 19–38 times higher than intransect locations more remote to platforms. However, Hurley(2000) showed no evidence of avoidance or attraction to NovaScotia platforms.
It has been noted that a lack of monitoring and data on seabirddistributions at sea, and co-occurrence with offshore drilling op-erations hinder risk assessment (Burke et al. 2012; Hedd et al.2011). Despite regular standardized seabird monitoring that hasbeen conducted from offshore oil and gas platforms in the NorthEast Grand Banks since 1997, a number of challenges were identi-fied by Baillie et al. (2005) that precluded useful analyses (e.g.,study design, observer training, and data management). Althoughsome of these challenges have been addressed, there remain is-sues with protocol compliance, data management, and speciesidentification that all could be addressed potentially with suffi-cient training (Fifield et al. 2009).
Seabird populations are at risk from any mortality because oftheir slow intrinsic population growth rates, particularly if theyare already stressed from other factors. The consensus of datashow that sheen-level hydrocarbon exposure can harm individualbirds through external exposure and internal sub-lethal toxicity;any added mortality due to sheens, however minor, should beconsidered as part of the cumulative effects on these species.Effects of sheens on seabird populations are only speculative atthis point and specific research is critical before possible implica-tions for population level impacts can be identified, understood,and managed.
ConclusionSheens regularly occur around offshore drilling and produc-
tion operations under Canada’s current regulatory limits on hy-drocarbon discharges. Because operational discharge regulationsin other parts of the world are similar to Canadian regulations,frequency of sheen occurrence from oil and gas operations, andthreat to seabirds, likely is similar in other locations with signif-icant seabird populations. Pelagic seabirds are found in areaswhere current offshore operations are located and some speciesare attracted to offshore drilling and production structures, mak-ing it probable that there is regular contact between marine birdsand sheens around platforms. Contact with sheens can cause dam-age to feather microstructure and may result in reduced buoy-ancy, and (or) water penetration and increased metabolism.Depending on other stressors, such as cold weather, disruption offeather microstructure from sheens could cause death from hypo-thermia or starvation. In addition to metabolic disruption, lowlevels of external oiling could alter behaviour resulting in moretime preening and less time feeding and tending nests. Thus, lowlevels of external oiling could have more significant impacts dur-ing the breeding season. Conversely, internal acute toxic effectsare unlikely from exposure to sheens around offshore oil and gasoperations. Yet, sub-lethal effects are likely; impacting health andreproduction either through a number of mechanisms includinginadequate provisioning of the nestlings, altered incubation be-haviour, and (or) transfer of oil from adults to eggs and nestlings.Sheens from offshore oil and gas platforms therefore are a prob-able contributor to the cumulative effects of anthropogenic stres-sors on marine birds.
We have not focused on large accidental discharges from dril-ling and production operations that exceed regulatory limits.These events occur occasionally, yet regularly, at drilling and pro-duction platforms. Depending on factors such as magnitude of thedischarge, climatic conditions, local bird populations, and time ofyear, these events likely cause impacts to seabird individuals, re-production, and populations.
Pelagic seabird populations may be detrimentally affectedbecause of the life-history characteristics that make them par-ticularly vulnerable to increased adult mortality or decreasedreproductive output; subtle impacts from contact with sheensaround offshore drilling and production operations. However,whether these likely impacts to individuals have long-term effectson populations is speculative at this point due to (i) lack of data onincidence of seabird oiling around platforms; (ii) more consistentmonitoring, reporting, and transparency of the likelihood, persis-tence, fate, and thickness of sheens resulting from dischargesassociated with produced water and drilling muds; (iii) controlledstudies that directly quantify effects of sheens on seabirds; and(iv) long-term effects on pelagic seabird abundance in AtlanticCanada.
AcknowledgementsWe thank Laura Galbraith for the initial review of relevant
literature. We thank the Environmental Studies Research Fund(ESRF: Natural Resources Canada) committee for providing in-sight and feedback on former versions of this document. Wethank Greg Robertson and one anonymous reviewer for commentsthat greatly improved the manuscript. The Canada-Newfoundlandand Labrador Offshore Petroleum Board provided the data onsheen occurrence. This review is an updated and condensed ver-sion of a report commissioned by the Environmental Studies Re-search Fund (ESRF: administered by Natural Resources Canada),which was supported by the Canada-Newfoundland and LabradorOffshore Petroleum Board (C-NLOPB) and funding was provided byESRF grant #05–078 and Environment Canada (P.D. O’Hara). Wethank the British Columbia Conservation Foundation (BCCF) forin-kind support for L.A. Morandin, and we also thank the Instituteof Ocean Sciences (Fisheries and Oceans Canada) and the Depart-ment of Biology, University of Victoria for in kind support pro-vided to P.D. O’Hara.
ReferencesAinley, D.G., Grau, C.R., Roudybush, T.E., Morrell, S.H., and Utts, J.M. 1981. Pe-
troleum Ingestion Reduces Reproduction In Cassin’s Auklets. Mar. Pollut.Bull. 12(9): 314–317. doi:10.1016/0025-326X(81)90083-7.
Albers, P.H. 1980. Transfer Of Crude Oil From Contaminated Water To Bird Eggs.Environ. Res. 22(2): 307–314. doi:10.1016/0013-9351(80)90143-7. PMID:7408822.
Alonso-Alvarez, C., Munilla, I., López-Alonso, M., and Velando, A. 2007a. Sub-lethal toxicity of the Prestige oil spill on yellow-legged gulls. Environ. Int.33(6): 773–781. doi:10.1016/j.envint.2007.02.012. PMID:17383727.
Alonso-Alvarez, C., Pérez, C., and Velando, A. 2007b. Effects of acute exposure toheavy fuel oil from the Prestige spill on a seabird. Aquat. Toxicol. 84(1):103–110. doi:10.1016/j.aquatox.2007.06.004. PMID:17631973.
Baillie, S., Robertson, G.J., Wiese, F.K., and Williams, U.P. 2005. Seabird datacollected by the Grand Banks offshore hydrocarbon industry, 1999–2002:results, limitations and suggestions for improvement. Canadian Wildlife Ser-vice, Environment Canada, Atlantic Region.
Baird, P.H. 1990. Concentrations Of Seabirds At Oil-Drilling Rigs. Condor, 92(3):768–771. doi:10.2307/1368697.
Balseiro, A., Espí, A., Márquez, I., Pérez, V., Ferreras, M.C., Marín, J.F.G., andPrieto, J.M. 2005. Pathological features in marine birds affected by the pres-tige’s oil spill in the north of Spain. J. Wildl. Dis. 41(2): 371–378. doi:10.7589/0090-3558-41.2.371. PMID:16107672.
Barros, A., Alvarez, D., and Velando, A. 2014. Long-term reproductive impair-ment in a seabird after the Prestige oil spill. Biol. Lett. 10(4). doi:10.1098/rsbl.2013.1041.
Birkhead, T.R., Lloyd, C., and Corkhill, P. 1973. Oiled seabirds successfully clean-ing their plumage. Br. Birds, 66: 535–537.
Briggs, K.T., Yoshida, S.H., and Gershwin, M.E. 1996. The influence of petrochem-icals and stress on the immune system of seabirds. Regul. Toxicol. Pharma-col. 23(2): 145–155. doi:10.1006/rtph.1996.0036. PMID:8661333.
Briggs, K.T., Gershwin, M.E., and Anderson, D.W. 1997. Consequences of petro-chemical ingestion and stress on the immune system of seabirds. ICES J. Mar.Sci. 54(4): 718–725. doi:10.1006/jmsc.1997.0254.
Burger, A.E. 1992. The effects of oil pollution on seabirds of the west coast offVancouver Island. In The Ecology, Status, and Conservation of Marine Shore-line Birds on the West Coast of Vancouver Island. Edited by K. Vermerer,R.W. Butler, and K.H. Morgan. Canadian Wildlife Service Occasional Paper.pp. 120–128.
Burger, A.E. 1993. Estimating The Mortality Of Seabirds Following Oil-Spills:
Moramdin and O’Hara 293
Published by NRC Research Press
Env
iron
. Rev
. Dow
nloa
ded
from
ww
w.n
rcre
sear
chpr
ess.
com
by
Env
iron
men
t Can
ada
on 0
9/30
/16
For
pers
onal
use
onl
y.

Effects Of Spill Volume. Mar. Pollut. Bull. 26(3): 140–143. doi:10.1016/0025-326X(93)90123-2.
Burger, J. 1997. Effects of oiling on feeding behavior of sanderlings and semipal-mated plovers in New Jersey. Condor, 99(2): 290–298. doi:10.2307/1369935.
Burger, J., and Tsipoura, N. 1998. Experimental oiling of sanderlings (Calidrisalba): Behavior and weight changes. Environ. Toxicol. Chem. 17(6): 1154–1158.doi:10.1002/etc.5620170623.
Burke, C.M., Montevecchi, W.A., and Wiese, F.K. 2012. Inadequate environmen-tal monitoring around offshore oil and gas platforms on the Grand Bank ofEastern Canada: Are risks to marine birds known? J. Environ. Manage. 104:121–126. doi:10.1016/j.jenvman.2012.02.012. PMID:22487400.
Butler, R.G., and Lukasiewicz, P. 1979. Field-Study Of The Effect Of Crude-Oil OnHerring Gull (Larus-Argentatus) Chick Growth. Auk, 96(4): 809–812.
Butler, R.G., Trivelpiece, W., Miller, D.S., Bishop, P., D'Amico, C., D'Amico, M.,Lambert, G., and Peakall, D.B. 1979. Further studies of the effects of petro-leum hydrocarbons on marine birds. Bull. Mt. Desert Isl. Biol. Lab, 19: 33–35.
Butler, R.G., Peakall, D.B., Leighton, F.A., Borthwick, J., and Harmon, R.S. 1986.Effects Of Crude Oil Exposure On Standard Metabolic-Rate Of Leachs Storm-Petrel. Condor, 88(2): 248–249. doi:10.2307/1368924.
Butler, R.G., Harfenist, A., Leighton, F.A., and Peakall, D.B. 1988. Impact OfSublethal Oil And Emulsion Exposure On The Reproductive Success OfLeach’s Storm-Petrels - Short And Long-Term Effects. J. Appl. Ecol. 25(1): 125–143. doi:10.2307/2403614.
C-NLOPB 2014–2015 annual report. 2015. http://www.cnlopb.ca/pdfs/ar2015e.pdf.Cairns, D.K. 1992. Population regulation of seabird colonies. In Current Ornithol-
ogy. Springer, US. pp. 37–61.Camphuysen, K.C.J. 1998. Beached bird surveys indicate decline in chronic oil
pollution in the North Sea. Mar. Pollut. Bull. 36(7): 519–526. doi:10.1016/S0025-326X(98)80018-0.
Camphuysen, K.C.J. 2011. Seabirds and chronic oil pollution: Self-cleaning prop-erties of gulls, Laridae, as revealed from colour-ring sightings. Mar. Pollut.Bull. 62(3): 514–519. doi:10.1016/j.marpolbul.2010.12.008. PMID:21236450.
Camphuysen, K.C.J., and Heubeck, M. 2001. Marine oil pollution and beachedbird surveys: the development of a sensitive monitoring instrument. Environ.Pollut. 112(3): 443–461. doi:10.1016/S0269-7491(00)00138-X. PMID:11291451.
Canada’s Offshore Waste Treatment Guidelines. 2010. http://www.cnsopb.ns.ca/pdfs/owtg_redraft.pdf [accessed Feb 2015]
CAPP. 2009. Marine hydrocarbon spill response capability assessment. Jeanned’Arc production operation. Canadian Association of Petroleum Producers.http://www.cnlopb.ca/pdfs/sr/oilassrep.pdf.
Castege, I., Lalanne, Y., Gouriou, V., Hemery, G., Girin, M., D’Amico, F.,Mouches, C., D’Elbee, J., Soulier, L., Pensu, J., et al. 2007. Estimating actualseabirds mortality at sea and relationship with oil spills: lesson from the“Prestige” oilspill in Aquitaine (France). Ardeola, 54(2): 289–307.
Cavanaugh, K.P., and Holmes, W.N. 1987. Effects Of Ingested Petroleum On TheDevelopment Of Ovarian Endocrine Function In Photostimulated MallardDucks (Anas Platyrhynchos). Arch. Environ. Contam. Toxicol. 16(2): 247–253.doi:10.1007/BF01055806.
Couillard, C.M., and Leighton, F.A. 1989. Comparative Pathology Of Prudhoe BayCrude Oil And Inert Shell Sealants In Chicken Embryos. Fundam. Appl. Toxi-col. 13(1): 165–173. doi:10.1016/0272-0590(89)90316-3. PMID:2767357.
Couillard, C.M., and Leighton, F.A. 1990. The Toxicopathology Of Prudhoe BayCrude Oil In Chicken Embryos. Fundam. Appl. Toxicol. 14(1): 30–39. doi:10.1016/0272-0590(90)90228-C. PMID:2307320.
Couillard, C.M., and Leighton, F.A. 1991. Critical Period Of Sensitivity To Petro-leum Toxicity In The Chicken Embryo. Environ. Toxicol. Chem. 10(2): 249–253. doi:10.1002/etc.5620100214.
Couillard, C.M., and Leighton, F.A. 1993. In vitro Red Blood Cell Assay For Oxi-dant Toxicity Of Petroleum Oil. Environ. Toxicol. Chem. 12(5): 839–845. doi:10.1002/etc.5620120507.
Culik, B.M., Wilson, R.P., Woakes, A.T., and Sanudo, F.W. 1991. Oil Pollution OfAntarctic Penguins: Effects On Energy-Metabolism And Physiology. Mar. Pol-lut. Bull. 22(8): 388–391. doi:10.1016/0025-326X(91)90341-O.
Dunnet, G.M., Crisp, D.J., Conan, G., and Bourne, W.R.P. 1982. Oil Pollution andSeabird Populations [and Discussion]. Philos. Trans. R. Soc. London B: Biol.Sci. 297(1087): 413–427. doi:10.1098/rstb.1982.0051.
ERIN Consulting Ltd. and OCL Services Ltd. (E.C.L. Ltd a. O.S. Ltd). 2003. Sheensassociated with produced water effluents – Review of causes and mitigationoptions. ERIN Consulting Ltd. and OCL Services Ltd. for Environmental Stud-ies Research Funds Report 142.
Esler, D., Schmutz, J.A., Jarvis, R.L., and Mulcahy, D.M. 2000. Winter survival ofadult female harlequin ducks in relation to history of contamination by the“Exxon valdezm” oil spill. J. Wildl. Manage. 64(3): 839–847. doi:10.2307/3802754.
Esler, D., Bowman, T.D., Trust, K.A., Ballachey, B.E., Dean, T.A., Jewett, S.C., andO’Clair, C.E. 2002. Harlequin duck population recovery following the ‘ExxonValdez’ oil spill: progress, process and constraints. Mar. Ecol. Progr. Ser. 241:271–286. doi:10.3354/meps241271.
Fifield, D.A., Lewis, K.P., Gjerdrum, C., Robertson, G.J., and Wells, R. 2009. Off-shore Seabird Monitoring Program. Environment Studies Research FundsReport No. 183.
Ford, R.G., Weins, J.A., Heinemann, D., and Hunt, G.L. 1982. Modelling TheSensitivity Of Colonially Breeding Marine Birds To Oil Spills: Guillemot And
Kittiwake Populations On The Pribilof Islands, Bering Sea. J. Appl. Ecol. 19(1):1–31. doi:10.2307/2402988.
Fowler, G.S., Wingfield, J.C., and Boersma, P.D. 1995. Hormonal and reproductiveeffects of low levels of petroleum fouling in Magellanic Penguins (Spheniscusmagellanicus). Auk, 112(2): 382–389. doi:10.2307/4088725.
Fraser, G.S., and Ellis, J. 2009. The Canada-Newfoundland Atlantic Accord Imple-mentation Act: Transparency of the environmental management of the off-shore oil and gas industry. Mar. Policy 33(2): 312–316. doi:10.1016/j.marpol.2008.07.012.
Fraser, G.S., Russell, J., and Von Zharen, W.M. 2006. Produced water from off-shore oil and gas installations on the Grand Banks, Newfoundland andLabrador: are the potential effects to seabirds sufficiently known? Mar. Orni-thol. 34: 147–156.
Goldsworthy, S.D., Gales, R.P., Giese, M., and Brothers, N. 2000. Effects of theIron Baron oil spill on little penguins (Eudyptula minor). I. Estimates ofmortality. Wildl. Res. 27(6): 559–571. doi:10.1071/WR99075.
Golet, G.H., Seiser, P.E., McGuire, A.D., Roby, D.D., Fischer, J.B., Kuletz, K.J.,Irons, D.B., Dean, T.A., Jewett, S.C., and Newman, S.H. 2002. Long-term directand indirect effects of the ‘Exxon Valdez’ oil spill on pigeon guillemots inPrince William Sound, Alaska. Mar. Ecol. Prog. Ser. 241: 287–304. doi:10.3354/meps241287.
Golightly, R.T., Newman, S.H., Craig, E.N., Carter, H.R., and Mazet, J.A.K. 2002.Survival and behavior of western gulls following exposure to oil and rehabil-itation. Wildl. Soc. Bull. 30(2): 539–546.
Gorsline, J., and Holmes, W.N. 1981. Effects Of Petroleum On AdrenocorticalActivity And On Hepatic Naphthalene-Metabolizing Activity In Mallard Ducks.Arch. Environ. Contam. Toxicol. 10(6): 765–777. doi:10.1007/BF01054860. PMID:7198895.
Gorsline, J., and Holmes, W.N. 1982. Adrenocortical Function And Hepatic Naph-thalene Metabolism In Mallard Ducks (Anas Platyrhynchos) ConsumingPetroleum Distillates. Environ. Res. 28(1): 139–146. doi:10.1016/0013-9351(82)90162-1. PMID:7106069.
Gorsline, J., Holmes, W.N., and Cronshaw, J. 1981. The Effects Of Ingested Petro-leum On The Naphthalene-Metabolizing Properties Of Liver Tissue InSeawater-Adapted Mallard Ducks (Anas Platyrhynchos). Environ. Res. 24(2):377–390. doi:10.1016/0013-9351(81)90167-5.
Government of Canada. Canada Oil and Gas Drilling and Production Regulations,Newfoundland Offshore Petroleum Drilling and Production Regulations. 2009.Section 9(k). http://laws-lois.justice.gc.ca/eng/regulations/SOR-2009-315/
Hartung, R. 1963. Wildlife ingestion of oil by waterfowl. Papers of the MichiganAcademy of Science, Arts and Letters 48: 49–55.
Hartung, R. 1964. Some effects of oils on waterfowl. University of Michigan, AnnArbor, MI.
Hartung, R. 1967. Energy Metabolism In Oil-Covered Ducks. J. Wildl. Manage.31(4): 798–804. doi:10.2307/3797987.
Hartung, R., and Hunt, G.S. 1966. Toxicity Of Some Oils To Waterfowl. J. Wildl.Manage. 30(3): 564–570. doi:10.2307/3798748.
Hedd, A., Montevecchi, W.A., Tranquilla, L.M., Burke, C.M., Fifield, D.A.,Robertson, G.J., Phillips, R.A., Gjerdrum, C., and Regular, P.M. 2011. Reducinguncertainty on the Grand Bank: tracking and vessel surveys indicate mortal-ity risks for common murres in the North-West Atlantic. Anim. Conserv.14(6): 630–641. doi:10.1111/j.1469-1795.2011.00479.x.
Hoffman, D.J., and Albers, P.H. 1984. Evaluation Of Potential EmbryotoxicityAnd Teratogenicity Of 42 Herbicides, Insecticides, And Petroleum Contami-nants To Mallard Eggs. Arch. Environ. Contam. Toxicol. 13(1): 15–27. doi:10.1007/BF01055642. PMID:6703782.
Holmes, W.N., Cronshaw, J., and Gorsline, J. 1978. Some Effects Of IngestedPetroleum On Seawater-Adapted Ducks (Anas Platyrhynchos). Environ. Res.17(2): 177–190. doi:10.1016/0013-9351(78)90020-8. PMID:318512.
Holmes, W.N., Gorsline, J., and Cronshaw, J. 1979. Effects Of Mild Cold Stress OnThe Survival Of Seawater-Adapted Mallard Ducks (Anas Platyrhynchos) Main-tained On Food Contaminated With Petroleum. Environ. Res. 20(2): 425–444.doi:10.1016/0013-9351(79)90017-3. PMID:546648.
Hurley, G.V. 2000. Nearshore and offshore environmental effects monitoring atthe Sable Offshore Energy Project. In Understanding the environmental ef-fects of offshore hydrocarbon development. Edited by D.C. Gordon, L.D. Griffiths,G.V. Hurley, A.L. Muecke, D.K. Muschenheim, and P.G. Wells. Canadian Techni-cal Reopot of Fisheries and Aquatic Sciences, 2311.
Husky Oil. 2000. White Rose development environmental comprehensive study,Part I. Husky Oil.
Igunnu, E.T., and Chen, G.Z. 2014. Produced water treatment technologies. Int. J.Low-Carbon Technol. 9(3): 157–177. doi:10.1093/ijlct/cts049.
Irons, D.B., Kendall, S.J., Erickson, W.P., McDonald, L.L., and Lance, B.K. 2000.Nine years after the Exxon Valdez oil spill: Effects on marine bird popula-tions in Prince William Sound, Alaska. Condor, 102(4): 723–737. doi:10.2307/1370300.
Jenssen, B.M. 1994. Review Article: Effects Of Oil Pollution, Chemically TreatedOil, And Cleaning On The Thermal Balance Of Birds. Environ. Pollut. 86(2):207–215. doi:10.1016/0269-7491(94)90192-9. PMID:15091638.
Jenssen, B.M., and Ekker, M. 1988. A Method For Evaluating The Cleaning OfOiled Seabirds. Wildl. Soc. Bull. 16(2): 213–215.
Jenssen, B.M., and Ekker, M. 1991. Dose Dependent Effects Of Plumage-Oiling
294 Environ. Rev. Vol. 24, 2016
Published by NRC Research Press
Env
iron
. Rev
. Dow
nloa
ded
from
ww
w.n
rcre
sear
chpr
ess.
com
by
Env
iron
men
t Can
ada
on 0
9/30
/16
For
pers
onal
use
onl
y.

On Thermoregulation Of Common Eiders Somateria Mollissima Residing InWater. Polar Res. 10(2): 579–584. doi:10.1111/j.1751-8369.1991.tb00675.x.
Khan, R.A., and Ryan, P. 1991. Longterm Effects Of Crude-Oil On CommonMurres (Uria Aalge) Following Rehabilitation. Bull. Environ. Contam. Toxicol.46(2): 216–222. doi:10.1007/BF01691940. PMID:2018868.
King, J.G., and Sanger, G.A. 1979. Oil vulnerability index for marine orientedbirds. In Conservation of Marine Birds of Northern North America. Edited byJ. C. Bartonek and D.N. Nettleship. pp. 227–239.
King, K.A., and Lefever, C.A. 1979. Effects Of Oil Transferred From IncubatingGulls To Their Eggs. Mar. Pollut. Bull. 10(11): 319–321. doi:10.1016/0025-326X(79)90399-0.
Lack, D. 1967. Interrelationships in breeding adaptations as shown by marinebirds. Proc. XIV Inter. Ornithol. Congr.: 3–42.
Lambert, G., Peakall, D.B., Philogène, B.J.R., and Engelhardt, F.R. 1982. Effect OfOil And Oil Dispersant Mixtures On The Basal Metabolic Rate Of Ducks. Bull.Environ. Contam. Toxicol. 29(5): 520–524. doi:10.1007/BF01669614. PMID:7150798.
Lance, B.K., Irons, D.B., Kendall, S.J., and McDonald, L.L. 2001. An evaluation ofmarine bird population trends following the Exxon valdez oil spill, PrinceWilliam Sound, Alaska. Mar. Pollut. Bull. 42(4): 298–309. doi:10.1016/S0025-326X(00)00155-7. PMID:11381751.
Lee, Y.Z., Leighton, F.A., Peakall, D.B., Norstrom, R.J., O’Brien, P.J., Payne, J.F.,and Rahimtula, A.D. 1985. Effects Of Ingestion Of Hibernia And Prudhoe BayCrude Oils On Hepatic And Renal Mixed Function Oxidase In NestlingHerring-Gulls (Larus Argentatus). Environ. Res. 36(1): 248–255. doi:10.1016/0013-9351(85)90022-2. PMID:3967642.
Leighton, F.A. 1991. The toxicity of petroleum oils to seabirds; an overview. InThe effects of oil on wildlife. Edited by J. White. Sheridan Press, Hanover, PA.pp. 43–57.
Leighton, F.A., Peakall, D.B., and Butler, R.G. 1983. Heinz-Body Hemolytic-Anemia From The Ingestion Of Crude-Oil - A Primary Toxic Effect In MarineBirds. Science, 220(4599): 871–873. doi:10.1126/science.6844918.
Levy, E.M. 1980. Oil Pollution And Seabirds - Atlantic Canada 1976–77 And SomeImplications For Northern Environments. Mar. Pollut. Bull. 11(2): 51–56. doi:10.1016/0025-326X(80)90353-7.
Lock, A.R., Brown, R.G.B., and Gerriets, S.H. 1994. Gazetteer of marine birds inAtlantic Canada, an atlas of seabird vulnerability to oil pollution. CanadianWildlife Service, Environmental Conservation Branch, Environment Canada.
McEwan, E.H., and Koelink, A.F.C. 1973. Heat Production Of Oiled Mallards AndScaup. Can. J. Zool. 51(1): 27–31. doi:10.1139/z73-005. PMID:4696079.
Miller, D.S., Butler, R.G., Trivelpiece, W., Janes-Butler, S., Green, B., Peakall, G.,Lambert, G., and Peakall, D.B. 1980. Crude oil ingestion by seabirds: Possiblemetabolic and reproductive effects. Bull. Mt. Desert Isl. Biol. Lab. 20: 137–138.
Mobile Oil. 1985. Hibernia development project environmental impact state-ment. Mobile Oil.
Morandin, L.A., and O’Hara, P.D. 2014. Fish oil disrupts seabird feather micro-structure and waterproofing. Sci. Total Environ. 496: 257–263. doi:10.1016/j.scitotenv.2014.07.025. PMID:25089687.
Munilla, I., Arcos, J.M., Oro, D., Alvarez, D., Leyenda, P.M., and Velando, A. 2011.Mass mortality of seabirds in the aftermath of the Prestige oil spill. Eco-sphere, 2(7). doi:10.1890/es11-00020.1.
Neff, J.M. 2002. Bioaccumulation in Marine Organisms. Effects of Contaminantsfrom Oil Well Produced Water. Elsevier Science, Oxford, UK.
Newman, S.H., Mazet, J.K., Ziccardi, M.H., Lieske, C.L., Fauquier, D.A.,Gardner, I.A., Zinkl, J.G., and Christopher, M.M. 1999. Haematologicalchanges and anaemia associated with captivity and petroleum exposure inseabirds. Comp. Haematol. Int. 9(2): 60–67. doi:10.1007/BF02585537.
O’Hara, P.D., and Morandin, L.A. 2010. Effects of sheens associated with offshoreoil and gas development on the feather microstructure of pelagic seabirds.Mar. Pollut. Bull. 60(5): 672–678. doi:10.1016/j.marpolbul.2009.12.008. PMID:20060137.
Orbell, J.D., Tan, E.K., Coutts, M., Bigger, S.W., and Ngeh, L.N. 1999. Cleansingoiled feathers – magnetically. Mar. Pollut. Bull. 38(3): 219–221. doi:10.1016/S0025-326X(98)00186-6.
Parsons, N.J., and Underhill, L.G. 2005. Oiled and injured African penguins Sphe-niscus demersus and other seabirds admitted for rehabilitation in the West-ern Cape, South Africa, 2001 and 2002. Afr. J. Mar. Sci. 27(1): 289–296. doi:10.2989/18142320509504087.
Peakall, D.B., Hallett, D., Miller, D.S., and Kinter, W.B. 1980. Effects Of IngestedCrude-Oil On Black Guillemots: Combined Field And Laboratory Study.Ambio, 9(1): 28–30.
Peakall, D.B., Hallett, D.J., Bend, J.R., Foureman, G.L., and Miller, D.S. 1982.Toxicity Of Prudhoe Bay Crude Oil And Its Aromatic Fractions To NestlingHerring-Gulls. Environ. Res. 27(1): 206–215. doi:10.1016/0013-9351(82)90071-8.PMID:7067677.
Petro-Canada. 1997. Terra Nova development: offshore petroleum project, envi-ronmental impact statement. Petro-Canada.
Piatt, J.F., Lensink, C.J., Butler, W., Kendziorek, M., and Nysewander, D.R. 1990.
Immediate impact of the “Exxon Valdez” oil spill on marine birds. Auk, 107:387–397. doi:10.2307/4087623.
Pollet, I.L., Ronconi, R.A., Jonsen, I., Leonard, M.L., Taylor, P.D., and Shutler, D.2014. Foraging movements of Leach’s storm-petrels Oceanodroma leucorhoaduring incubation. J. Avian Biol. 45(4): 305–314. doi:10.1111/jav.00361.
Portier, M.P., and Raffy, A. 1934. Mecanisme de la mort des oiseaux dont leplumage est impregne de carbures d'hydrogene. CR Acad. Sci. Paris, 198:851–853.
Prichard, A.K., Roby, D.D., Bowyer, R.T., and Duffy, L.K. 1997. Pigeon guillemotsas a sentinel species: A dose-response experiment with weathered oil in thefield. Chemosphere, 35(7): 1531–1548. doi:10.1016/S0045-6535(97)00223-3.
Rijke, A.M. 1970. Wettability and phylogenetic development of feather structurein water birds. J. Exp. Biol. 52: 469–479.
Robertson, G.J., Ryan, P.C., Dussureault, J., Turner, B.C., Wilhelm, S.I., andPower, K. 2006. Composition of beached marine birds from an oiling event insoutheastern Newfoundland and Labrador, November 2004. Mar. Ornithol.34: 141–146.
Robertson, G.J., Gilliland, S.G., Ryan, P.C., Dussureault, J., Power, K., andTurner, B.C. 2014. Mortality of Common Eider, Somateria mollissima (Linnaeus,1758), and other water birds during two inshore oiling events in southeasternNewfoundland, 2005 and 2006. Can. Field Nat. 128: 235–242.
Ronconi, R.A., Allard, K.A., and Taylor, P.D. 2015. Bird interactions with offshoreoil and gas platforms: Review of impacts and monitoring techniques. J. Environ.Manage. 147: 34–45. doi:10.1016/j.jenvman.2014.07.031. PMID:25261750.
Stephens, S.M., Frankling, S.C., Stagg, R.M., and Brown, J.A. 2000. Sub-lethaleffects of exposure of juvenile turbot to oil produced water. Mar. Pollut. Bull.40(11): 928–937. doi:10.1016/S0025-326X(00)00031-X.
Stephenson, R. 1997. Effects of oil and other surface-active organic pollutants onaquatic birds. Environ. Conserv. 24(2): 121–129. doi:10.1017/S0376892997000180.
Stephenson, R., and Andrews, C.A. 1997. The effect of water surface tension onfeather wettability in aquatic birds. Can. J. Zool. 75(2): 288–294. doi:10.1139/z97-036.
Stone, C.J., Webb, A., Barton, C., Ratcliffe, N., Reed, T.C., Tasker, M.L.,Camphuysen, C.J., and Pienkowski, M.W. 1995. An Atlas of Seabird Distribu-tion in North-West European Waters. Joint Nature Conservation Committee.
Stubblefield, W.A., Hancock, G.A., Ford, W.H., and Ringer, R.K. 1995a. Acute AndSubchronic Toxicity Of Naturally Weathered Exxon-Valdez Crude-Oil In Mal-lards And Ferrets. Environ. Toxicol. Chem. 14(11): 1941–1950. doi:10.1002/etc.5620141116.
Stubblefield, W.A., Hancock, G.A., Prince, H.H., and Ringer, R.K. 1995b. EffectsOf Naturally Weathered Exxon-Valdez Crude-Oil On Mallard Reproduction.Environ. Toxicol. Chem. 14(11): 1951–1960. doi:10.1002/etc.5620141117.
Swennen, C. 1978. Keeping Pelagic Seabirds In Captivity. Ibis, 120(1): 112–113.Tasker, M.L., Hope-Jones, P., Blake, B.F., Dixon, T.J., and Wallis, A.W. 1986. Sea-
birds associated with oil production platforms in the North Sea. RingingMigration, 7: 7–14. doi:10.1080/03078698.1986.9673873.
Trivelpiece, W.Z., Butler, R.G., Miller, D.S., and Peakall, D.B. 1984. ReducedSurvival Of Chicks Of Oil-Dosed Adult Leach’s Storm-Petrels. Condor, 86(1):81–82. doi:10.2307/1367353.
Votier, S.C., Hatchwell, B.J., Beckerman, A., McCleery, R.H., Hunter, F.M.,Pellatt, J., Trinder, M., and Birkhead, T.R. 2005. Oil pollution and climate havewide-scale impacts on seabird demographics. Ecol. Lett. 8(11): 1157–1164. doi:10.1111/j.1461-0248.2005.00818.x. PMID:21352439.
Wiens, J.A., Crist, T.O., Day, R.H., Murphy, S.M., and Hayward, G.D. 2001. Acanonical correspondence analysis of the effects of the Exxon Valdez oilspill on marine birds. Ecol. Appl. 11(3): 828–839. doi:10.1890/1051-0761(2001)011[0828:ACCAOT]2.0.CO;2.
Wiese, F.K., and Robertson, G.J. 2004. Assessing seabird mortality from chronicoil discharges at sea. J. Wildl. Manage. 68(3): 627–638. doi:10.2193/0022-541X(2004)068[0627:ASMFCO]2.0.CO;2.
Wiese, F.K., and Ryan, P.C. 2003. The extent of chronic marine oil pollution insoutheastern Newfoundland waters assessed through beached bird surveys1984–1999. Mar. Pollut. Bull. 46(9): 1090–1101. doi:10.1016/S0025-326X(03)00250-9.PMID:12932490.
Wiese, F.K., Montevecchi, W.A., Davoren, G.K., Huettmann, F., Diamond, A.W.,and Linke, J. 2001. Seabirds at risk around offshore oil platforms in theNorth-west Atlantic. Mar. Pollut. Bull. 42(12): 1285–1290. doi:10.1016/S0025-326X(01)00096-0. PMID:11827114.
Wiese, F.K., Robertson, G.J., and Gaston, A.J. 2004. Impacts of chronic marine oilpollution and the murre hunt in Newfoundland on thick-billed murre Urialomvia populations in the eastern Canadian Arctic. Biol. Conserv. 116(2):205–216. doi:10.1016/S0006-3207(03)00191-5.
Appendix ATables A1 and A2 appear on the following pages.
Moramdin and O’Hara 295
Published by NRC Research Press
Env
iron
. Rev
. Dow
nloa
ded
from
ww
w.n
rcre
sear
chpr
ess.
com
by
Env
iron
men
t Can
ada
on 0
9/30
/16
For
pers
onal
use
onl
y.

Table A1. Sheen occurrence around offshore oil and gas production platforms in the Canada-Newfoundland and Labrador offshore area.
YYYY* MM* DD* Source Weather conditions Reason for sheen or phenomenon Miscellaneous
2003 7 27 SBM on cuttings NA NA NA2003 7 29 SBM on cuttings Winds 26 kn WS, swh 1.1 m,
visibility 15 nmOil from cuttings pile rising to surface Sheen approximately 50 m by 150 m.
2003 9 25 Produced waterdischarge
Winds 5 kn SW, swh 2.3 m,visibility 10 nm
Produced water discharge Grey sheen approximately 50 m × 150 m and progressively became dullas it extended out. PW OIW at 07:00 was 67 mg/L, at 10:00 was31 mg/L, at 14:00 was 34 mg/L.
2003 10 16 Produced waterdischarge
Winds 20 kn SE, swh 2.4 m,visibility 15 nm
Produced water discharge Grey finger-like sheen approximately 30 m by 40 m, that becameprogressively dull as it extended outward.
2003 10 18 Produced waterdischarge
Winds 7 kn W, swh 2.2 m,visibility 15 nm
Produced water discharge NA
2003 10 26 Produced waterdischarge
Winds 7 kn NW; swh 3 mvisibility 15 nm
Produced water discharge Blue–grey finger 50 m wide by 100 m became progressively duller as itextended outward. PW OIW at 06:15 was 61 mg/L.
2003 11 8 Not determined Winds 9kn SEE, swh 2.5 mvisibility 15 nm
Not determined Blue–grey finger approx. 50 m × 300 m, which became progressivelydull as it extended outward. PW OIW at 6:20 was 40 mg/L.
2003 11 17 Produced waterdischarge
Winds 14 kn WSW, swh3.5 m, visibility 15 nm
Produced water discharge Blue–grey finger approx. 100 m by 100 m, which became progressivelydull as it extended outward. PW OIW at 12:00 was 39 mg/L.
2003 11 19 Produced waterdischarge
Winds 9 kn NW, swh 3.5 m,visibility 15 nm
Produced water discharge A blue–grey finger approximately 100 m by 500 m, which becameprogressively dull as it extended outward. PW OIW at 07:00 was46.5 mg/L.
2003 11 24 Produced waterdischarge
Winds 34 kn EN, swh 2.2 m,visibility 3/4 nm
Produced water discharge Blue–grey sheen approximately 100 m by 150 m and becameprogressively dull as it extended outward.
2003 11 26 SBM on cuttings — Discharge of cuttings with low syntheticoil on cuttings resulting in thesynthetic base oil appearing on thesurface
A substance was sighted in the water which had a hydrocarbonappearance to it.
2003 12 6 Produced waterdischarge
Winds light and variableNWN
Produced water discharge A blue–grey sheen approximately 100 m by 100 m and progressivelydull as it extended outward. PW OIW at 07:30 was 112 mg/L.
2003 12 9 Produced waterdischarge
Winds 18 kn SW, swh 4.5,visibility 6 nm
Produced water discharge A blue–grey sheen approximately 100 m by 150 m. The dischargebecame progressively dull as it extended outward. PW OIW at 07:30was 137 mg/L.
2003 12 17 SBM on Cuttings Unknown Discharge of cuttings with low syntheticoil on cuttings resulting in thesynthetic base oil appearing on thesurface
A substance was sighted in the water which had a hydrocarbonappearance to it.
2004 1 19 Produced waterdischarge
Winds 9 kn NNW; swh 2 m;vivibility 8 nm
Possibly from produced waterdischarge
A bluish-grey sheen intermittently covering an area about 150 m by400 m with approx. 15% coverage. PW OIW at 06:00 14.8 mg/L.
2004 4 2 Not determined Winds 19 kn NNW, swh2.3 m visibility 10 nm
None identified A blue–grey sheen about 50 by 150 m that became progressively dullwith distance. PW OIW was 25 mg/L at 06:00.
2004 4 9 SBM on Cuttings Winds 25 kn SES; swh1.2 m; visibility 15 nm
Oil from cuttings pile rising to surface A blue–grey sheen 150 m by 20 m.
2004 4 30 Suspect ProducedWater Discharge
Winds 25 kn NE; swh 2.2 m;visibility 1 nm
Suspect produced water discharge A blue–grey sheen about 30 m by 500 m.
2004 5 3 NA Winds 15 kn ES; swh 2.5 m;visibility 0.25 nm
NA A blue–grey sheen about 200 m by 500 m. PW OIW at 08:00 was28.1 mg/L.
2004 5 19 SBM on Cuttings NA Cuttings A substance was sighted on the ocean.2004 5 27 Not determined Winds 10 kn ENE, swh
2.7 m, visibility 10 nmNot determined A blue–gray sheen 200 m by 100 m. PW OIW at 18:00 was 25 mg/L.
296En
viron.R
ev.Vol.24,2016
Publish
edby
NR
CR
esearchPress
Env
iron
. Rev
. Dow
nloa
ded
from
ww
w.n
rcre
sear
chpr
ess.
com
by
Env
iron
men
t Can
ada
on 0
9/30
/16
For
pers
onal
use
onl
y.

Table A1 (continued).
YYYY* MM* DD* Source Weather conditions Reason for sheen or phenomenon Miscellaneous
2004 6 14 Not determined Winds 0 kn variable; swh1.5 m; visibility 10 nm
Not determined A blue–grey sheen, 100 m × 75 m.
2004 7 1 SBM on Cuttings NA NA Discharge of residual SBM and sediment from cleaning of pits.2004 7 1 Not determined Winds 9 kn S, swh 1.0 m,
visibility 0 nmNot determined A blue–grey sheen 75 m by 200 m. PW OIW content at 14:00 was
39 mg/L.2004 7 13 Not determined winds 7 kn NW, swh 2.0 m,
visibility 15 nmNot determined A blue–grey sheen 50 m × 500 m.
2004 8 12 Suspected Producedwater discharge
Winds NW, 12 kn, swh1.5 m, visibility 15 nm
Seas "very calm" Blue–grey sheen estimated at 100 m × 300 m, PW OIW at 07:00 was42 mg/L; at 10:00 was 33 mg/L; at 14:40 was 33 mg/L; at 17:00 was56.2 mg/L.
2004 8 26 Suspected Producedwater discharge
Winds 35 kn NE; swh 2.1;visibility 5 nm
Possible produced water discharge A blue–grey sheen, 100 m × 500 m. PW OIW at 14:00 was 44.8 mg/L.
2004 10 1 Produced waterdischarge
Winds 28 kn SEE; swh 1.5 mvisibility o nm
Possible produced water discharge A blue–grey sheen 75 m by 100 m was reported on the south side of theinstallation. Oil content of the discharged produced water at 06:30was 85 mg/L. The sheen has been attributed to the produced waterdischarged.
2004 10 16 Produced waterdischarge
NA Oil in water content of produced waterexceeded daily limit, am sample107.7 mg/L pm sample 53.6 mg/L
A silvery sheen approx. 30 m by 20 m. Dissipating with wave action.
2004 10 17 Suspected producedwater discharge
Winds 8 kn NE; swh 1.8 nm,visibility 10 nm
Possible produced water discharge A blue–grey sheen, about 50 m by 200 m.
2004 11 3 Suspected producedwater discharge
Winds 32 kn E by N; swh4.0; visibility 4.0 m;visibility 5/8 nm
Possible produced water discharge A blue–grey sheen. The estimated total size of the sheen was 70 by200 m. PW OIW at 07:00 was 31.7 mg/L.
2004 11 9 Produced waterdischarge
Winds light and variable;swh 2.1 m, visibility 3/8 to2 nm
Startup mode following EPA/ESD A blue–grey sheen approx. 200 by 500 m. PW OIW at 06:30 was 41 mg/L.
2004 11 26 Produced waterdischarge
NA NA Associated with past spill.
2004 11 27–28 Produced waterdischarge
NA NA Sheen approx. 30 × 350 m. associated with past spill.
2004 11 28 Fire Pumpoperations
NA NA Incident of sheen observed.
2004 12 10 Produced waterdischarge
Winds 6 kn S; seas 1 m;visibility 15 nm
Very calm conditions, little dispersionof produced water plume whensurfaced
A blue–grey sheen approx. 100 m by 400 m. PW OIW at 06:30 was26 mg/L; at 15:00 was 31 mg/L.
2004 12 16 Produced waterdischarge
Winds 21 kn ENE; seas2.6 m; visibility 8 nm
High OIW concentrations in PWdischarge
A blue–grey sheen approx. 170 m × 700 m. PW OIW at 07:00 was22.5 mg/L; at 09:30 was 101 mg/L.
2004 12 22 Produced waterdischarge
Winds 25 kn at 250 T; swh5.2 m; visibility 10 nm
NA A sheen, bluish-gray, with light patches of dull brown, was observedapprox. 100 × 600 m. PW OIW 21 mg/L.
2004 12 26 Produced waterdischarge
Winds N at 17 kn; swh2.5 m; visibility 15 nm
NA A blue–gray sheen 1.5 m × 25 m. PW OIW at 06:30 was 28 mg/L; at 15:00was 38 mg/L.
2004 12 29 Suspected producedwater discharge
Winds W 24 kn; swh 4.8 m;visibility 15 nm
NA Bluish-grey sheen about 25 m × 200 m. PW OIW at 07:00 was 25 mg/L.
2004 12 29 Suspected producedwater discharge
Winds W 33 kn; swh 3.8 m;visibility 15 nm
Produced water discharge Bluish-grey sheen, intermittently covering area of 10 m × 50 m.PW OIW was 4 mg/L.
Moram
dinan
dO
’Hara
297
Publish
edby
NR
CR
esearchPress
Env
iron
. Rev
. Dow
nloa
ded
from
ww
w.n
rcre
sear
chpr
ess.
com
by
Env
iron
men
t Can
ada
on 0
9/30
/16
For
pers
onal
use
onl
y.

Table A1 (continued).
YYYY* MM* DD* Source Weather conditions Reason for sheen or phenomenon Miscellaneous
2005 2 1 Suspected producedwater discharge
0830 obs were WS 14 knfrom 350°; swh 4.3 m;MCS 7.2; visibility 15 nm
Possible produced water discharge Surveillance flight reported 0.5 mile by 100 ft sheen. Operatorsubsequently reported as 0.75 nm × 100 ft. PW OIW at 08:40 was41.6 mg/L.
2005 2 2 Produced waterdischarge
WS 10 kn from 010°; swh1.8 m; visibility 15 nm
Produced water discharge Blue–gray sheen approx. 30 m × 100 m fading to small individualpatches. Seas calm. PW OIW was 53.6 mg/L.
2005 2 3 Produced waterdischarge
WS 10 kn from 050°; swh1.5 m; visibility 15 nm
Suspected produced water discharge "Transparent" sheen observed about 30 m wide by 100 m long. Seasvery calm and low winds. PW OIW at 06:30 was 22 mg/L; at 11:30 was19 mg/L.
2005 2 4 Suspected producedwater discharge
WS 40 kn from E; swh1.6 m; visibility 1/8 nm
Suspected produced water discharge Sheen with discontinuous blue–gray patches and spots of light brownobserved. Extended to the south in fractured 20 m wide form toabout 150 m. Sea surface was calm. PW OIW at 05:45 was 25.2 mg/L;at 10:35 was 26.1 mg/L; at 16:00 was 40.9 mg/L; at 17:45 was 37.5 mg/L.
2005 2 7 Produced waterdischarge
Winds 27 kn 070°; swh3.2 m; visibility 8 nm
Produced water discharge Surveillance flight reported 0.5 nm long, 50 foot wide sheen. PW OIWat 08:30 was 29.3 mg/L; at 10:15 was 27.7 mg/L; at 14:45 was 34.5 mg/L.
2005 2 7 Produced waterdischarge
Seas calm Produced water discharge Sheen of discontinuous blue–gray patches observed, 1–2 m wide finger-shaped patches extending to approx. 150 m. PW OIW at 10:15 was27.7 mg/L; at 14:45 was 34.5 mg/L.
2005 2 8 Produced waterdischarge
Winds 13 kn 040°; swh1.5 m; visibility0.5 nm infog
Produced water discharge Non-continuous blue–gray patches of sheen about 30 m by 100 m long.Seas calm in vicinity. PW OIW at 06:50 was 44 mg/L; at 11:30 was46 mg/L; at 14:00 was 28.3.
2005 2 23 Suspected producedwater discharge
Winds 30 kn 070°; swh 2 m Suspected Produced water discharge Blue–gray sheen approx. 100 m × 350 m, in fingers. PW OIW at 06:30was 26.9 mg/L.
2005 3 25 Produced waterdischarge
Winds 29 kn 110°; swh1.5 m; visibility 15 nm
Produced water discharge Light silvery sheen about 100 m long. PW OIW at 17:30 was 39 mg/L.
2005 3 26 Produced waterdischarge
Winds 17 kn 070°; swh0.7 m; visibility 15 nm
Produced water discharge Surveillance flight observed slick/sheen about 2.7 km × 100 m indiscontinuous patches. PW OIW at 06:30 was 74.3 mg/L; at 09:00 was22 mg/L.
2005 3 29 Produced waterdischarge
Winds 10 kn 170°; swh0.5 m; visibility 15 nm
Produced water discharge Light silvery sheen observed 100 m wide and extended to south. PWOIW at 16:30 was 24.9 mg/L.
2005 4 3 Produced waterdischarge
Winds 18 kn 100°T; swh1.5 m; visibility 15 nm
Produced water discharge Silvery sheen observed about 40 m × 60 m extending to south. PW OIWat 07:10 was 41.3 mg/L; at 17:10 was 35.9 mg/L.
2005 4 4 Produced waterdischarge
Winds17 kn SE, swh 1 mvisibility 15 nm
PW discharge A sheen about 100 m by 500 m. Appeared as finger-like patches, alongzones of convergence were non-continuous small dull brown patchesringed in blue grey prior to dispersing. PW OIW at 15:30 was73.8 mg/L; at 17:25 was 28.5 mg/L.
2005 4 17 Residual from spill Winds 18 kn NE; swh 2.7 m;air temp 2 °C; visibility5 nm
Residual from spill Weathered crude.
2005 6 2 Produced waterdischarge
Winds 8 kn E; swh 0.8 mvisibility 8 nm
Produced water discharge A light slivery sheen 30–50 m wide extending in a southerly direction.PW OIW at 06:10 was 21.2 mg/L.
2005 6 13 Produced waterdischarge
Winds 11 knkn N; swh2.1 m, visibility 7 miles
Produced water discharge Transparent sheen extending to south beyond 300 m. Sea conditionscalm. PW OIW at 06:50 was 26.5 mg/L.
2005 6 17 Produced waterdischarge
Winds 7 kn from 260°; SWH1.3 m; visibility 15 nm
Produced water discharge Non-continuous blue–gray sheen observed extending to south infingers 1–2 m wide. Seas calm. PW OIW at 07:00 was 51 mg/L; at 10:00was 42 mg/L.
2005 6 19 Produced waterdischarge
Winds 19 kn from 080°; swh1 m; visibility 7 nm
Produced water discharge Non-continuous blue-gray sheen observed extending south in fingers1–2 m wide. Seas calm. PW OIW at 07:00 was 34.8 mg/L; at 17:00 was38.5 mg/L.
298En
viron.R
ev.Vol.24,2016
Publish
edby
NR
CR
esearchPress
Env
iron
. Rev
. Dow
nloa
ded
from
ww
w.n
rcre
sear
chpr
ess.
com
by
Env
iron
men
t Can
ada
on 0
9/30
/16
For
pers
onal
use
onl
y.
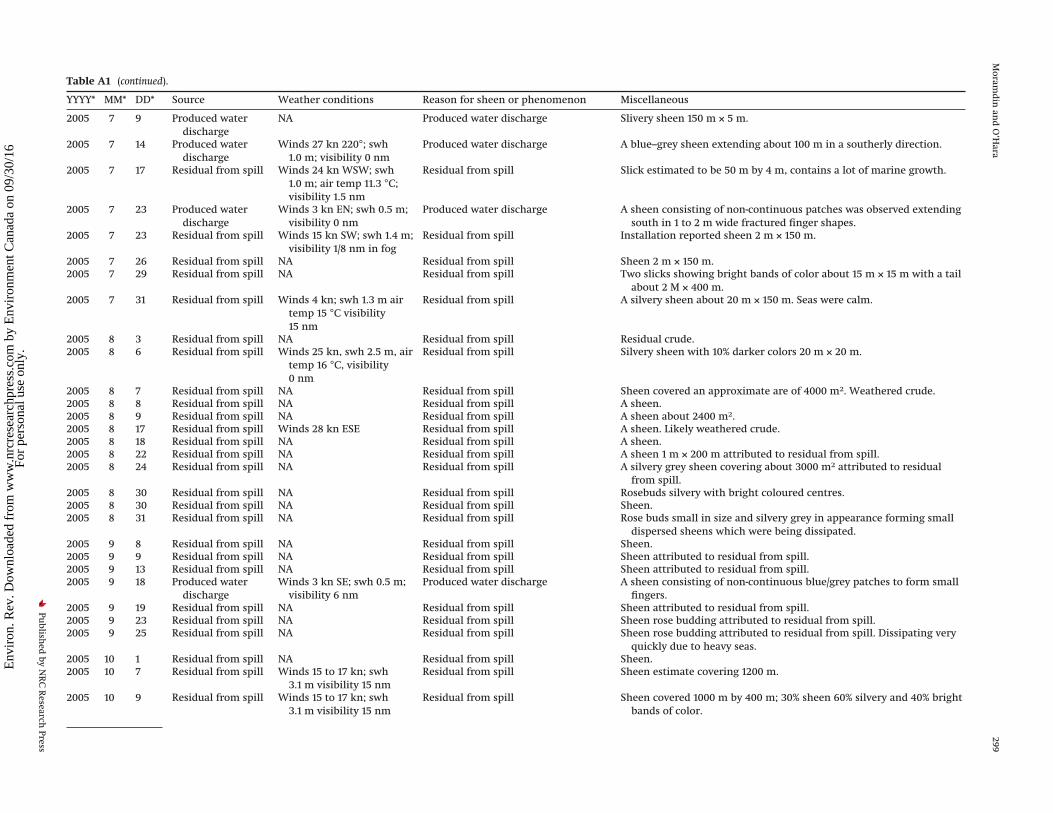
Table A1 (continued).
YYYY* MM* DD* Source Weather conditions Reason for sheen or phenomenon Miscellaneous
2005 7 9 Produced waterdischarge
NA Produced water discharge Slivery sheen 150 m × 5 m.
2005 7 14 Produced waterdischarge
Winds 27 kn 220°; swh1.0 m; visibility 0 nm
Produced water discharge A blue–grey sheen extending about 100 m in a southerly direction.
2005 7 17 Residual from spill Winds 24 kn WSW; swh1.0 m; air temp 11.3 °C;visibility 1.5 nm
Residual from spill Slick estimated to be 50 m by 4 m, contains a lot of marine growth.
2005 7 23 Produced waterdischarge
Winds 3 kn EN; swh 0.5 m;visibility 0 nm
Produced water discharge A sheen consisting of non-continuous patches was observed extendingsouth in 1 to 2 m wide fractured finger shapes.
2005 7 23 Residual from spill Winds 15 kn SW; swh 1.4 m;visibility 1/8 nm in fog
Residual from spill Installation reported sheen 2 m × 150 m.
2005 7 26 Residual from spill NA Residual from spill Sheen 2 m × 150 m.2005 7 29 Residual from spill NA Residual from spill Two slicks showing bright bands of color about 15 m × 15 m with a tail
about 2 M × 400 m.2005 7 31 Residual from spill Winds 4 kn; swh 1.3 m air
temp 15 °C visibility15 nm
Residual from spill A silvery sheen about 20 m × 150 m. Seas were calm.
2005 8 3 Residual from spill NA Residual from spill Residual crude.2005 8 6 Residual from spill Winds 25 kn, swh 2.5 m, air
temp 16 °C, visibility0 nm
Residual from spill Silvery sheen with 10% darker colors 20 m × 20 m.
2005 8 7 Residual from spill NA Residual from spill Sheen covered an approximate are of 4000 m2. Weathered crude.2005 8 8 Residual from spill NA Residual from spill A sheen.2005 8 9 Residual from spill NA Residual from spill A sheen about 2400 m2.2005 8 17 Residual from spill Winds 28 kn ESE Residual from spill A sheen. Likely weathered crude.2005 8 18 Residual from spill NA Residual from spill A sheen.2005 8 22 Residual from spill NA Residual from spill A sheen 1 m × 200 m attributed to residual from spill.2005 8 24 Residual from spill NA Residual from spill A silvery grey sheen covering about 3000 m2 attributed to residual
from spill.2005 8 30 Residual from spill NA Residual from spill Rosebuds silvery with bright coloured centres.2005 8 30 Residual from spill NA Residual from spill Sheen.2005 8 31 Residual from spill NA Residual from spill Rose buds small in size and silvery grey in appearance forming small
dispersed sheens which were being dissipated.2005 9 8 Residual from spill NA Residual from spill Sheen.2005 9 9 Residual from spill NA Residual from spill Sheen attributed to residual from spill.2005 9 13 Residual from spill NA Residual from spill Sheen attributed to residual from spill.2005 9 18 Produced water
dischargeWinds 3 kn SE; swh 0.5 m;
visibility 6 nmProduced water discharge A sheen consisting of non-continuous blue/grey patches to form small
fingers.2005 9 19 Residual from spill NA Residual from spill Sheen attributed to residual from spill.2005 9 23 Residual from spill NA Residual from spill Sheen rose budding attributed to residual from spill.2005 9 25 Residual from spill NA Residual from spill Sheen rose budding attributed to residual from spill. Dissipating very
quickly due to heavy seas.2005 10 1 Residual from spill NA Residual from spill Sheen.2005 10 7 Residual from spill Winds 15 to 17 kn; swh
3.1 m visibility 15 nmResidual from spill Sheen estimate covering 1200 m.
2005 10 9 Residual from spill Winds 15 to 17 kn; swh3.1 m visibility 15 nm
Residual from spill Sheen covered 1000 m by 400 m; 30% sheen 60% silvery and 40% brightbands of color.
Moram
dinan
dO
’Hara
299
Publish
edby
NR
CR
esearchPress
Env
iron
. Rev
. Dow
nloa
ded
from
ww
w.n
rcre
sear
chpr
ess.
com
by
Env
iron
men
t Can
ada
on 0
9/30
/16
For
pers
onal
use
onl
y.

Table A1 (continued).
YYYY* MM* DD* Source Weather conditions Reason for sheen or phenomenon Miscellaneous
2005 10 30 Residual from spill Winds 15 to 17 kn; swh3.1 m visibility 15 nm
Residual from spill Sheen attributed to residual oil.
2005 11 3 Residual from spill Winds 15 to 17 kn; swh3.1 m visibility 15 nm
Residual from spill Sheen reported attributed to residual oil.
2005 12 2 Produced waterdischarge
Winds 19 kn ES; swh 0.7 mvisibility 15 nm
Produced water discharge A light slivery sheen 20–30 m wide extending in a southerly directionin narrow finger-like formations. PW OIW at 07:00 was 26 mg/L.
2005 12 13 Residual from spill Winds SE 32 kn kn; swh2.9 m visibility 0 nm
Residual from spill Believed to be residual oil.
2005 12 26 NA NA NA No further details.2006 1 4 Residual from spill NA Residual from spill Silvery sheen about 30 m by 10 m.2006 2 5 Process area
centrifugeWinds 7 kn NNW; swh
0.7 m; visibility 15 knmOil water interface detection
malfunctionedA light silvery sheen, 20 m × 30 m extending in a southerly direction,
calm conditions.2006 2 7 NA Winds 20 kn SW; swh
2.8 m; visibility 1/8 nmSample taken A light silvery sheen about 20 m × 30 m extending in a northwesterly
direction in long narrow finger-like formations. PW OIW was 24.5 mg/L.2006 2 8 Residual from spill NA Residual from spill A sheen 50 × 4 m.2006 2 24 Residual from spill NA Residual from spill Attributed to residual oil.2006 3 13 NA Winds 20 kn NWW; swh
3.4 m; visibility 15 nmNA A light silvery sheen about 30 m × 60 m in a southerly direction. PW
OIW was 10.5 mg/L.2006 3 16 OIW analyzer
discharge hoseNA NA NA
2006 3 17 Produced waterdischarge
Wind 17 kn, 240°, swh 2 m,visibility 15 nm
Produced water discharge A light silvery sheen measuring 40 m × 60 m and extending tosoutheast.
2006 4 21 Residual from spill NA Residual from spill Attributed to residual oil.2006 4 27 Residual from spill NA Residual from spill Sheen observed about 30 m × 20 m, 95% barely visible 5% silvery sheen.2006 4 28 Residual from spill NA Residual from spill Attributed to residual oil.2006 5 6 Residual from spill Wind 5 kn SSE; swh 2 m air
tem 9 °C; visibility 1/8 nmResidual from spill Sheen about 120 m × 5 m; 40% silvery, 40% trace color and 20% bright
bands.2006 5 7 Residual from spill Winds 21 kn ESE; swh
1.9 m; sea temp –4.9 °C;air temp –8.8 °C; visibility1 1/2 nm on mist
Residual from spill Sliver sheen 100' × 3' volume estimate 0.00225.
2006 5 9 Suspected producedwater discharge
Winds 25 kn ESE; swh 1.5 mvisibility 5 nm light rainand mist
Possibly produced water discharge A light slivery sheen.
2006 5 16 Suspected producedwater discharge
Winds 8 kn NE; swh 0.9 mvisibility 0 nm light rainand mist
Possibly produced water discharge Sheen consisting of broken silvery and grey patches about 10 m × 20 m.Calm seas.
2006 5 18 Residual from spill — Residual from spill Sheen 100 m × 2 m attributed to residual oil.2006 5 18 Suspected produced
water dischargeWinds 4 kn SE by E; swh
1.1 m visibility 0 nm lightrain and mist.
Possibly produced water discharge A sheen patches of silver, grey and occasional tan spots was observedapproximately 10–20 m.
2006 7 4 Suspectedgrey/blackwaterdischarge
Wind 20 kn 240°, swh1.8 m, temp 12 °C
Possibly grey or blackwater related A film/sheen was observed. Very light sheen, fingered, no colours.Analyses determined likely not petroleum.
2006 8 18 Suspected producedwater discharge
NA Possibly produced water discharge Slight sheen. The seas were calm. The cause was not known at thattime; it may be from the produced water or separators.
2006 9 1 Produced waterdischarge
Wind 40 kn NE; swh 3.0 m;visibility 2.5 nm
Possibly produced water discharge A produced water blue–grey sheen, about 50 m × 300 m, was reported.PW OIW at 06:30 was 31.1 mg/L.
300En
viron.R
ev.Vol.24,2016
Publish
edby
NR
CR
esearchPress
Env
iron
. Rev
. Dow
nloa
ded
from
ww
w.n
rcre
sear
chpr
ess.
com
by
Env
iron
men
t Can
ada
on 0
9/30
/16
For
pers
onal
use
onl
y.

Table A1 (continued).
YYYY* MM* DD* Source Weather conditions Reason for sheen or phenomenon Miscellaneous
2006 9 2 Produced waterdischarge
Winds 20 kn NE; swh 2.0 m;visibility 1.5 nm
Possibly produced water discharge A produced water blue–grey sheen, about 50 m × 300 m, was reported.PW OIW at 06:30 was 37.2 mg/L.
2006 9 3 Cuttings NA Possibly sheen from cuttings discharge Sheen estimated 0.137 L likely a result of a buildup of SBM cuttings inthe overboard discharge line.
2006 10 15 Suspected producedwater discharge
Winds 30 kn ESE; swh2.3 m; visibility 100 m
Suspected produced water discharge A sheen about 40 m wide consisting of multiple streamers of silverygrey and blue and dull colors. The sheen appears to have originatedfrom the produced water outlet. Sheen lasted for 10–12 minutes.
2006 10 21 Suspected producedwater discharge
Winds 8 kn E N; swh 1.8 m;visibility 15 nm
Suspected produced water discharge A sheen consisting of broken blue grey colored patched/ fingers. Thesheen was about 100 m × 800 m. Due to calm condition some of theoil remained adjacent to form brown patches 20 m × 5 m. PW OIWwas 31 ppm.
2006 10 28 Suspected producedwater discharge
Winds 31 kn SSE, swh2.5 m; visibility 10 km
Suspected produced water discharge A sheen 2–3 m in width consisting of light silvery streaks interspersedwith occasional rainbow was observed moving in a westerlydirection beyond 300 m.
2006 11 7 Suspected producedwater discharge
Winds 2 kn, WSW, swh0.7 m visibility 15 nm
Suspected produced water discharge A sheen about 3515 by 200 m 50% coverage. Difficult to tell sheen fromwhat appeared to be thermal plume. Conditions very clam with0.5 m waves at the time of the report and low winds. PW OIW was21 ppm.
2006 11 9 Suspected producedwater discharge
Winds 5 kn SE; swh 0.6 m;visibility 8 km
Suspected produced water discharge A sheen consisting of small silvery patches interspersed with occasionsrainbow colors was observed moving in a westerly direction andaccumulating to form a wider sheen beyond 300 m. PW OIW at06:00 was 33.6 ppm.
2006 11 26 Suspected producedwater discharge
Winds 17 kn NW; swh4.1 m; visibility 15 km
Suspected produced water discharge A sheen consisting of small silvery patches interspersed withoccassional rainbow colors was observed moving in a westerlydirection.
2006 12 13 Suspected producedwater discharge
Winds 4.5 kn NW by W,swh 4.5 m; visibility15 nm
Suspected produced water discharge Sheen 3 m in width consisting of small silvery patches interspersedwith occasional rainbow colors was observed moving in a easterlydirection beyond 300 m. Produced water at 13:00 was 51.4 ppm.
2007 2 11 Suspected producedwater discharge
Winds 13 kn WSW Suspected produced water discharge A sheen consisting of silvery patches interposed with rainbow colorswas observed moving in a westerly direction. PW OIW morningsample 25.8 mg/L; at 11:03 was 28.4 mg/L.
2007 4 1 Suspected producedwater discharge
Winds 45 kn NNW, swh2 m, visibility 2 nm
Suspected produced water discharge A light silvery sheen measuring approximately 20–20 m wide andextended off in a southeasterly direction in narrow fingerlikeformations.
2007 4 3 Suspected producedwater discharge
Winds 50 kn N, swh 4 m.visibility 8 nm
Possibly produced water discharge A slivery sheen measuring approximately 10–20 m wide and extendedin a southerly direction in narrow finger-like formations. PW OIW31 mg/L.
2007 5 18 Suspected producedwater discharge
Winds 12 kn SW; swh 2.0 m;visibility 5 nm
Possibly produced water discharge A sheen consisting of silvery finger-like projections 15 to 20 m widewas observed moving in a SW direction. PW OIW at 14:00 32 mg/L.
2007 6 10 Suspected producedwater discharge
Winds 16 kn SW; swh 1.0;visibility 0 nm
Possibly produced water discharge A sheen consisting of slivery finger-like projections approx. 10–15 mwide was observed moving in a southwest direction. Over board OIWat 18:00 was 41 mg/L.
2007 6 20 Suspected producedwater discharge
Winds 11kn SE; swh 1.5 m;visibility 1/8 nm
Possibly produced water discharge A sheen consisting of silvery patches was observed at the southwestcorner of the installation. PW OIW checked and was 32.7 ppm.
2007 6 29 Suspected producedwater discharge
Winds 26 kn Se; swh 1.9 m;visibility 2 nm
Possibly produced water discharge A sheen approx. 10 m wide consisting of silvery finger-like projectionswas observed extending in a westerly direction. Produced water overboard was 27.2 mg/L.
Moram
dinan
dO
’Hara
301
Publish
edby
NR
CR
esearchPress
Env
iron
. Rev
. Dow
nloa
ded
from
ww
w.n
rcre
sear
chpr
ess.
com
by
Env
iron
men
t Can
ada
on 0
9/30
/16
For
pers
onal
use
onl
y.

Table A1 (continued).
YYYY* MM* DD* Source Weather conditions Reason for sheen or phenomenon Miscellaneous
2007 7 6 Suspected producedwater discharge
Winds 29 kn 225°; swh1.0 m; visibility 5 nm
Possibly produced water discharge A sheen approximately 10–15 m wide extending in a northerlydirection. Morning OIW sample was 28 mg/L.
2007 7 27 Suspected producedwater discharge
Winds 20 kn WNW; swh2.0 m; visibility 7 nm
Possibly produced water discharge Sheen, consisting of silvery finger-like projections approximately 20 mwide.
2007 8 27 Suspected producedwater discharge
Winds 8 kn SE; swh 1.5 m;visibility 1/8 nm
Possibly produced water discharge Sheen observed. Instantaneous OIW sample at 6:55 was 67.1 mg/L. OIWsample taken at10:05 was 9.3 mg/L. Average OIW from midnight tonoon was 34.5 mg/L.
2007 8 28 Produced waterdischarge
NA Produced water discharge Sheen attributed to the produced water discharge. Sheen 1200 m2.
2007 8 28 Suspected producedwater discharge
Winds 29 kn N; swh 2 m;visibility 15 nm
Possibly produced water discharge Silvery sheen with trace of color measuring 100m × 150 m.
2007 9 17 Suspected producedwater discharge
Calm; swh 1.8 m; visibility2 nm
Possibly produced water discharge A light silvery sheen originating at the produced water outlet. Thesheen measured approximately 20–30 m wide and extended in asoutheasterly direction in narrow finger-like formations.
2007 9 18 Suspected producedwater discharge
Winds 3 kn; swh 1 m;visibility 6 nm
Possibly produced water discharge A light silvery sheen originating at the produced water outlet 08:00.The sheen measured approximately 20–30 m wide and extended in asoutheasterly direction in narrow finger-like formations.
2007 10 4 Suspected producedwater discharge
Winds 21 kn 230°; swh1.6 m; visibilty 10 nm
Possibly produced water discharge A light silvery sheen orginating at the produced water outlet. Thesheen measured approximately 30–120 m wide extending to thesoutheast.
2007 10 26 Suspected producedwater discharge
Wind NW at 19 kn; swh2 m; visibility 15 miles
Possibly produced water discharge A light silvery sheen was observed consisting of a number of narrowfingers that extended in a south easterly projection.
2007 11 6 Suspected producedwater discharge
Wind 160° at 35 kn; swh3 m; visibility 2 nm
Possibly produced water discharge Light silvery sheen was observed consisting of a number of smallpatches that accumulated and drifted in a northerly direction. OIWreadings at 0600 indicated 90 ppm and at 1030 was 32.2.
2008 2 6 Produced waterdischarge
Winds 20 kn SW; swh 2.9 m;sea temp –0.3 °C; air temp–4.0 °C; visibility 15 nm
NA Sheen on the starboard side of the installation. Produced Water iswithin spec (21 ppm). Very calm sea states and therefore the sheen isbeing attributed to lack of natural dissipation of the produced water.
2008 2 27 Produced waterdischarge
NA Produced water discharge Silvery sheen. Produced water OIW 17 ppm.
2008 3 11 Suspected producedwater discharge
Westerly at 4 kn; swh3.5 m; visibility 12 nm
Possibly produced water A light silvery sheen approximately 10 m wide consisting of silveryfinger-like projections was observed on the south-east side of theinstallation and extending in a southwesterly direction away fromthe installation.
2008 3 12 Suspected producedwater discharge
Southwest (260°) 15 kn; swh1.9 m; visibility 15 nm
Possibly produced water discharge A light silvery sheen approximately 100 m was observed on thesoutheast extending in a southwesterly direction approximately700 m from the installation. OIW readings were 17.9 ppm at 06:32and 18.2 ppm at 18:00.
2008 4 9 Produced wateroutlet
Wind ESE 18 kn; swh 2.0 m;visibility 12 nm
Produced water discharge A light silvery sheen approximately 15 m wide consisting of silveryfinger-like projections was observed on the south side of theinstallation extending in a SW direction. Sheen appears to haveoriginated at the produced water outlet. OIW samples taken at06:40 h indicated a high OIW reading of 94 ppm. Another OIW samplecollected at 07:30 indicated a normal OIW reading of 7 ppm.
2008 5 2 Produced wateroutlet
Wind NNE 23 kn; swh 1.1 m;visibility 8 nm
Produced water discharge A light silvery sheen approximately 30 m wide consisting of silveryfinger-like projections was observed on the southeast area of theinstallation extending in a SE direction. The sheen appears to haveoriginated from the PW discharge. OIW at 07:00 indicated 16 mg/L.
302En
viron.R
ev.Vol.24,2016
Publish
edby
NR
CR
esearchPress
Env
iron
. Rev
. Dow
nloa
ded
from
ww
w.n
rcre
sear
chpr
ess.
com
by
Env
iron
men
t Can
ada
on 0
9/30
/16
For
pers
onal
use
onl
y.

Table A1 (continued).
YYYY* MM* DD* Source Weather conditions Reason for sheen or phenomenon Miscellaneous
2008 5 5 Produced wateroutlet
Wind SW 7 kn; swh 2.0 m;visibility 8 nm
Produced water discharge A light silvery sheen approximately 100 m × 100 m was observed on thesoutheast area of the installation. The sheen appears to haveoriginated from the PW discharge. OIW samples taken at 07:00indicated reading of 16.9 mg/L.
2008 5 11 Produced wateroutlet
Wind ENE 17 kn; swh 2.3 m;visibility 12 nm
Produced water discharge A light silvery sheen approximately 70 m wide consisting of finger-likeprojections was observed to the southeast of the installationextending in a southwesterly direction. OIW samples taken at 07:00indicated reading of 14.9 mg/L.
2008 5 21 Produced wateroutlet
Wind 240° WSW 14 kn; swh1.5 m; visibility 15 nm
Produced water discharge A light silvery sheen starting approximately 3 m wide extendingapproximately 100 M to the east in a northerly direction away fromthe installation. OIW samples taken at 07:00 indicated reading of13.0 mg/L.
2008 6 1 Slops discharge Slops discharge Slops discharge Sheen on starboard side 200 m × 1 m.2008 6 6 Produced water
outletWind 360° N 22 kn; swh 1.7;
visibility 3/4 nmProduced water discharge A light silvery sheen approximately 30 m wide with finger-like
projections was observed at the southwest corner of the installationextending in a south easterly direction. OIW samples taken at 07:00 hindicated 44.9 mg/L. Samples taken at 09:40 h indicated 18.4 mg/L.OIW samples taken at 17:00 h indicated 10.5 mg/L.
2008 6 27 Produced wateroutlet
NA Produced water A sheen was noted overboard and produced water sample wasdiscoloured. Produced water discharge was stopped. The sheen wasapprox. 150 m × 7 m, mostly silvery. Later in morning sheen 40 m ×40 m (60% open water and remaining was 80% silvery sheen) andanother 100 m × 30 m (50% open water and remaining was75% silvery sheen).
2008 7 3 Produced wateroutlet
NA Produced water Sheen at 15:45 local time was 10 m × 20 m. Produced water checkswere OK.
2008 7 6 Suspected fromblack water tank
NA Suspected from black water tank Sheen noted on the starboard side of the installation. Produced waterwas confirmed as being within spec at the time. Black water tankbeing discharged at time to facilitate level transmitter replacement.
2008 7 9 Produced wateroutlet
NA Produced water Sheen reported starboard side installation. Believed to result of PW.PW was in spec. at 20 ppm.
2008 7 20 Produced wateroutlet
Wind 16 kn at 350° N; swh1.4 m; visibility 4 nm
Produced water Light silvery sheen approximately 20 m wide with finger-likeprojections was observed at the southeast corner of the installationextending in a southeast direction. Sheen originated at the producedwater outlet. OIW samples taken at 7 am indicated 15.9 mg/L.
2008 7 29 Produced wateroutlet
Wind 23 kn at 250° WSW;swh 2 m; visibility nil
Produced water Light silvery sheen was observed at the southwest corner of theinstallation. Sheen originated at the produced water outlet. OIWsamples taken at 17:13 indicated 14.7 mg/L.
2008 8 2 Produced wateroutlet
Winds 9 kn 9°, swh 1.8 m,visibility 15 nm.
Produced water Sheen with traces of color at produced water outlet. PW OIW At 7:0021 mg/L.
2008 8 4 Produced wateroutlet
Winds 10 kn 60°. SWH1.5 m, visibility 15 nm.
Produced water Silvery grey sheen on southeast corner of installation. Sheenoriginating at produced water outlet extending away frominstallation in a south easterly direction. Production stable PW OIWat 7:00 16 mg/L.
2008 8 9 Produced wateroutlet
Winds 13 kn, SSE; swh1.2 m; visibility 15 nm
Produced water Silvery grey sheen observed on south side of installation. 40 m wideextending to the south narrowing to 5 m. Produced water 32.2 mg/Lin am and sample at noon was 12 mg/L.
Moram
dinan
dO
’Hara
303
Publish
edby
NR
CR
esearchPress
Env
iron
. Rev
. Dow
nloa
ded
from
ww
w.n
rcre
sear
chpr
ess.
com
by
Env
iron
men
t Can
ada
on 0
9/30
/16
For
pers
onal
use
onl
y.

Table A1 (continued).
YYYY* MM* DD* Source Weather conditions Reason for sheen or phenomenon Miscellaneous
2008 8 11 Produced wateroutlet
Wind 18 kn SE; swh 1.5 m;visibility 15 nm
Produced water Silver grey sheen with some rainbow around the edges observed onthe south side of the installation. Sheen originated in the area of theproduced water discharge extending in an easterly direction. PWOIW am 17 mg/L.
2008 8 29 Produced wateroutlet
Wind 130° ESE at 28 kn;swh 1.8; visibility 6 nm
Produced water Silvery grey sheen with some rainbow coloring around edges wasobserved on south side of installation extending in a southeastdirection. OIW samples taken in am indicated 24.6 mg/L.
2008 10 12 Produced wateroutlet
Wind 010° N 18 kn; swh2.2 m; visibility 15 nm
Produced water Light silvery sheen approximately 80 m wide with finger-likeprojections was observed at the southeast corner of the installationextending in a southwest direction. Sheen originated at the PWoutlet. OIW samples taken at 07:00 indicated 27.3 mg/L. Second OIWsample taken at 14:32 resulted in 31.4 mg/L.
2008 10 13 Produced wateroutlet
Wind 030° NE 15 kn; swh3 m; visibility 15 nm
Produced water A light silvery sheen at the south and east sides of the installation andstayed close to the installation. Sheen originated at the PW outlet.OIW samples taken at 07:00 indicated 24 mg/L. Second OIW sampletaken at 14:45 resulted in 46 mg/L.
2008 10 15 Produced wateroutlet
Wind 220° NE 17 kn; swh2.3 m; visibility 15 nm
Produced water A sheen was observed on the southeast corner of the installation alongthe east side. A second string like sheen was observed on the westside. The patchy silver sheen on the east side intensified to traces ofcolor. Sheen originated at the PW outlet. OIW samples taken at07:00 indicated 41.2 mg/L.
2008 10 17 Produced wateroutlet
Wind 080° NE 12 kn; swh1.8 m; visibility 5/8 nm
Produced water A light silvery sheen was observed on the south east corner of theinstallation and stayed close to the installation. OIW samples takenat 07:00 indicated 34.2 mg/L.
2008 10 19 Produced wateroutlet
Wind 360° N 16 kn; swh3.0 m; visibility 15 nm
Produced water A light silvery sheen was observed at the south east corner of theinstallation and stayed close to the installation. OIW samples taken at07:00 indicated 34.2 mg/L. A second sample taken at 10:00 was 25.1 mg/L.
2008 11 24 Produced wateroutlet
Wind 080° NE 16 kn; swh2.9 m; visibility 15 nm
Produced water A light silvery sheen was observed at the South East corner of theinstallation and stayed close to the installation. OIW sample taken at07:00 h was 32.1 mg/L.
2008 11 25 Produced wateroutlet
Wind 340° NW 26 kn; swh2.4 m; visibility 15 nm
Produced water A light silvery sheen was observed at the south east corner of theinstallation extending away from the installation in a finger-likepattern. OIW sample taken at 07:00 h was 21.3 mg/L.
2008 12 29 Produced wateroutlet
Very light variable winds;swh 3 m; visibility 15 nm
Produced water A light silvery sheen was observed on the South West side of theinstallation and stayed close to the installation. OIW sample taken at07:00 h was 26.0 mg/L. PW at 11:32 was 11.0 mg/L.
2009 4 20 Produced wateroutlet
Wind 290° westerly at 5 kn;swh 1.2 m; visibility 15 nm
Produced water A light silvery sheen was observed on the south east corner of theinstallation. OIW sample taken at 07:00 h was 21.6 mg/L.
2009 5 12 Produced wateroutlet
NA Produced water NA
2009 6 7 Produced wateroutlet
Wind NNE 46 kn; swh2.8 m; visibility 10 nm
Produced water A light silvery sheen with finger-like projections was observed at theSE corner of the installation dispersing quickly as it moved in a SSWdirection. The OIW sample taken at 18:00 h indicated 31.3 mg/L.
2009 6 11 Produced wateroutlet
Wind N 6 kn; swh 1.4 m;visibility 15 nm
Produced water Light silvery sheen with finger-like projections was observed at theSouth East corner of the installation dispersing quickly as it movedin a SSE direction.
2009 7 1 Produced wateroutlet
Wind 120° at 6 kn; swh1.6 m; visibility 10 nm
Produced water A light silvery sheen was observed at the SE corner of the installationmoving in westerly direction.
304En
viron.R
ev.Vol.24,2016
Publish
edby
NR
CR
esearchPress
Env
iron
. Rev
. Dow
nloa
ded
from
ww
w.n
rcre
sear
chpr
ess.
com
by
Env
iron
men
t Can
ada
on 0
9/30
/16
For
pers
onal
use
onl
y.

Table A1 (continued).
YYYY* MM* DD* Source Weather conditions Reason for sheen or phenomenon Miscellaneous
2009 7 1 Produced wateroutlet
NA Produced water Reported a sheen on the port side of the installation. PW oil content at16 mg/L.
2009 7 1 Produced wateroutlet
Winds 22° 9 kn; swh 1.95 m6.74 s
Produced water Sheen observed starboard side of installation.
2009 7 7 Produced wateroutlet
NA Produced water Reported a sheen on the starboard side of the installation.
2009 7 13 Produced wateroutlet
Wind 250° 8 kn; swh 1.5 m;visibility 15 nm
Produced water A light silvery sheen with finger-like projections was observed at theNE corner of the installation moving in a NE direction.
2009 7 28 Produced wateroutlet
Wind 155 T 10 kn, seas 1.3 mHs 5.7 s
Produced water Sheen observed on the starboard side of installation. 50% silvery sheen,50% trace of color measuring 10 m × 5 m. Produced water in spec lessthan 20 ppm.
2009 8 7 Produced wateroutlet
Wind 24 kn, wind direction200'T, Heading 230'T, seas1.9 m 6.1 s
Produced water Rosebuds forming on port side of installation developing into sheen.Silvery sheen 200 m × 2 m.
2009 8 10 Produced wateroutlet
16 kn of wind 188"T, winddirection 199'T, heading1.0 m 5.3 s
Produced water Rosebuds forming sheen reported on starboard side of installation.200 m × 3 m. Silvery sheen. PW in spec as less than 25 ppm.
2009 8 12 Produced wateroutlet
21 kn 293'T, wind direction226'T, heading 2.2 m 5.9 s
Produced water Rosebuds forming sheen reported on the port side of installation.150 m long by 3 m wide. 5% silvery sheen, 25% trace of color.
2009 10 2 Produced wateroutlet
Significant sea state 1.77 m@ 5.9 s, wind 12 kn, winddirection 299'T, heading260'T
Produced water Rosebuds forming sheen observed on the port side of the installation.100 m × 5 m silvery sheen 25% trace of color.
2009 10 19 Produced wateroutlet
Wind 115 T 20 kn, seas2.3 m Hs 6.8 s
Produced water Sheen observed on the port side of installation 95% silvery sheen,5% trace of color measuring 15 m × 5 m. Produced water in spec lessthan 20 ppm.
2009 10 20 Produced wateroutlet
Wind 320° at 18 kn; swh2.2 m; visibility 3/9 nm indrizzle and fog
Produced water A light silver or bluish sheen with finger-like projections was observedat the SE corner of the installation moving in a south easterlydirection.
2009 10 23 Produced wateroutlet
Wind 130 T 13 kn, seas1.5 m Hs 6.2 s
Produced water Sheen observed on port and starboard side of installation: port side15 m × 5 m silvery sheen; starboard side 50 m × 5 m silvery sheen.Produced water in spec less than 20 ppm. Drains discharge 11 ppm.
2009 11 2 Produced wateroutlet
Significant sea state 1.77 m5.9 s, wind 12 kn, winddirection 299'T, heading260'T
Produced water Rosebuds forming sheen observed on the port side of the installation.100 m × 5 m silvery sheen 25% trace of color.
2009 11 4 Produced wateroutlet
Significant sea state 2.97 m7.1 s, wind 23 kn, winddirection 255'T, heading211'T
Produced water Sheen observed on starboard side of installation 50 m × 50 m silvery incolor. Produced water in spec.
2009 11 8 Produced wateroutlet
Significant sea state 4.9 m4.9 s, wind 16 kn, winddirection 291'T, heading296'T
Produced water Sheen observed on starboard side of installation 100 m × 1 m 95%silvery in color 5% trace of color. Produced water with in spec.
2009 11 11 Produced wateroutlet
Significant sea state 1.99 m6.47 s, wind 11 kn winddirection 303'T
Produced water Silvery sheen, 75 m × 3 m, observed on port side with rose buds notedtoward midway along side of installation. PW in spec.
Moram
dinan
dO
’Hara
305
Publish
edby
NR
CR
esearchPress
Env
iron
. Rev
. Dow
nloa
ded
from
ww
w.n
rcre
sear
chpr
ess.
com
by
Env
iron
men
t Can
ada
on 0
9/30
/16
For
pers
onal
use
onl
y.

Table A1 (continued).
YYYY* MM* DD* Source Weather conditions Reason for sheen or phenomenon Miscellaneous
2009 11 13 Produced wateroutlet
Wind 20 kn, wind direction280'T, heading 330 T
Produced water Sheen at port side and aft of installation. Sheen estimated at 100 m ×3 m silvery in color. PW in spec.
2009 11 14 Produced wateroutlet
Significant sea state 3.87 m7.8 s, wind 21 kn, winddirection 325'T, heading005 T
Produced water Sheen observed midway along port side of installation 150 m × 3 msilver 95% trace of color 5%. Produced water in spec.
2009 11 22 Produced wateroutlet
Significant sea state 3.5 m7.8 s, wind 25 kn, winddirection 280 T
Produced water Silvery sheen on port and starboard side of installation, 2 m × 50 mport and 5 m × 50 m starboard. PW OIW at 25 ppm.
2009 11 24 Produced wateroutlet
Significant sea state 3.0 m6.8 s, wind 22 kn, winddirection 290 T
Produced water Silvery sheen on port side 5 m × 50 m. Volume estimate 0.02 L. PWOIW 25 ppm.
2009 11 25 Produced wateroutlet
Sea heights: 2.1 m(significant), wind: 280 at21 kn, current: 1.8 knsetting to 075, visibility:10 nm
Produced water Sheen on the port commencing slightly aft of the overboard caissonextending forward for the length of the installation.
2009 12 5 Produced wateroutlet
Significant sea state 4.1 m8.5 s, wind 23 kn, winddirection 290 T
Produced water Silvery sheen on port and starboard side, 5 m × 50 m. PW OIW 25 ppm.
2009 12 14 Produced wateroutlet
Significant sea state 3.9 m7.8 s, wind 11 kn, winddirection 311 T
Produced water Silvery sheen on port side, 3 m × 60 m. PW OIW 25 ppm.
2009 12 15 Produced wateroutlet
Significant sea state 2.18 m7.4 s, wind 6 kn, winddirection 323 T
Produced water Silvery sheen on starboard side of installation, 150 m × 50 m. PW OIWless than 25 ppm.
2009 12 28 Produced wateroutlet
Significant sea state 3.1 m8.3 s, wind 8 kn, winddirection 271 T
Produced water Silvery sheen, 200 m × 3 m. PW OIW less than 25 ppm.
2009 12 30 Produced wateroutlet
Significant sea state 5.7 m9.4 s, wind 18 kn, winddirection 190 T
Produced water Silvery sheen 50 m × 3 m. PW OIW less than 25 ppm.
2010 1 3 Produced wateroutlet
Significant sea state 4.1 m8.6 s, wind 29 kn, winddirection 100 T
Produced water Silvery sheen 150 m × 5 m. PW OIW less than 25 ppm.
2010 1 5 Produced wateroutlet
Significant sea state 4.2 m8.3 s, wind 28 kn, winddirection 210 T
Produced water Silvery sheen 50 m × 5 m. PW OIW less than 25 ppm.
2010 1 6 Produced wateroutlet
Significant sea state 3.6 m8.6 s, wind 21 kn, winddirection 120 T
Produced water Silvery sheen 6 m × 30 m, 50% trace of color. 6 m × 80 m silvery sheen.PW OIW less than 25–40 ppm.
2010 1 6 Produced wateroutlet
Wind ESE 31 kn;waveheight 3 m; visibility4 nm
Produced water A sheen consisting of dispersed silver–blueish patches becomingwindrowed as it extended further from the installation and wasobserved coming from the south east corner of the installationextending in a south westerly direction.
2010 1 14 Produced wateroutlet
Wind N 40 kn; waveheight3.2 m; visibility 3 nm
Produced water A silvery grey sheen was observed extending from the installation infinger-like formation in a south easterly direction.
306En
viron.R
ev.Vol.24,2016
Publish
edby
NR
CR
esearchPress
Env
iron
. Rev
. Dow
nloa
ded
from
ww
w.n
rcre
sear
chpr
ess.
com
by
Env
iron
men
t Can
ada
on 0
9/30
/16
For
pers
onal
use
onl
y.

Table A1 (continued).
YYYY* MM* DD* Source Weather conditions Reason for sheen or phenomenon Miscellaneous
2010 1 23 Produced wateroutlet
Significant sea state 3.9 m7.1 s, wind 23 kn, winddirection 270 T
Produced water Silvery sheen 200 m × 4 m silvery sheen PW OIW less than 25 ppm.
2010 2 10 Produced wateroutlet
— Produced water Silvery sheen observed on starboard side of installation approx. 20 m ×2 m. Produced water within spec.
2010 2 15 Produced wateroutlet
Significant sea state 4.8 m8.6 s, wind 35 kn, winddirection 15 T
Produced water Sheen was observed on port side of installation, approx. 1 m × 30 m.PW OIW 25–40 ppm.
2010 2 17 Produced wateroutlet
Significant sea state 4.0 m,wind variable, winddirection 240 T
Produced water Sheen was observed approx. 10 m × 2 m. PW OIW 0–25 ppm.
2010 2 20 Produced wateroutlet
Significant sea state 3.3 m,wind 12 kn, winddirection 100
Produced water Silvery sheen was observed approx. 3 m × 1 m. PW OIW 0–25 ppm.
2010 2 27 Produced wateroutlet
Significant sea state 2.2 m8 s, wind light
Produced water Sheen was observed approx. 10 m × 100 m. Produced water in spec.
2010 3 2 Produced wateroutlet
Significant sea state 4.1 m7.7 s, wind 31 kn 85 T
Produced water Silvery sheen was observed approx. 50 m × 100 m. Produced water inspec.
2010 3 3 Produced wateroutlet
Significant sea state 5.3 m9.5 s, wind 11 kn 200 T
Produced water Silvery sheen was observed approx. 5 m × 50 m. Produced water inspec.
2010 3 9 Produced wateroutlet
Significant sea state 2.8 m,wind 34 kn 190 T
Produced water Silvery sheen was observed approx. 75 m × 1 m. Produced water in spec0–25 ppm.
2010 3 10 Produced wateroutlet
Significant sea state 2.5 m3.6 s, wind 14 kn 300 T
Produced water Silvery sheen was observed approx. 100 m × 2 m. Produced water inspec 0–25 ppm.
2010 3 14 Produced wateroutlet
Wind North 30 kn;waveheight 3 m; visibility15 nm
Produced water Silvery grey sheen was observed projecting from installation infinger-like formation, moving in a south easterly direction. OIWsample taken this morning was 36.4 mg/L.
2010 3 17 Produced wateroutlet
Significant sea state 2.6 m6.8 s, wind 18 kn 257 T
Produced water Silvery sheen was observed approx. 100 m × 25 m, 5% trace of color.Produced water in spec 0–25 ppm.
2010 3 24 Produced wateroutlet
Wind ESE 32 kn;waveheight 2.8 m;visibility 15 nm
Produced Water Silvery gray sheen was observed projecting from installation in finger-like formation moving in a south westerly direction. OIW sample inthe morning was 55.4 mg/L.
2010 3 30 Produced wateroutlet
Significant sea state 2.3 m8.2 s, wind 10 kn 160 T
Produced water Silvery sheen was observed approx. 5 m × 25 m. Produced water inspec.
2010 4 4 Produced wateroutlet
Wind NW 16 kn;waveheight N/A; visibility15 nm
Produced Water Silvery gray sheen was observed projecting from installation in finger-like formation moving in a south easterly direction. PW OIW sampletaken in morning was 42.4 mg/L.
2010 4 7 Produced wateroutlet
Significant sea state 1.7 m5.0 s, wind 27 kn 275 T
Produced water Silvery sheen was observed approx. 5 m × 100 m, 95% silvery, 5% traceof color. Produced water in spec.
2010 4 14 Produced wateroutlet
Significant sea state 1.9 m,wind 19 kn 341 T
Produced water Silvery sheen was observed approx. 200 m × 4 m, 95% sheen,75% silvery 25% open water. PW OIW 0–25 mg/L [lab result 13.1 mg/L].
2010 4 15 Produced wateroutlet
Significant sea state 1.1 m4.7 s, wind 12 kn 345 T
Produced water Silvery sheen was observed approx. 200 m × 2 m, 75%, 35% silvery,25% open water. PW OIW 0–25 mg/L [lab result 13.1 mg/L].
2010 4 19 Produced wateroutlet
Wind ESE 110° 40 kn;waveheight 2.7 m;visibility 5 nm
Produced water A silvery gray sheen was observed projecting from installation infinger-like formation moving in a south westerly direction. OIWsample from morning was 27.3 mg/L.
2010 4 20 Produced wateroutlet
Significant sea state 3.4 m7.1 s, wind 14 kn 207 T
Produced water Sheen observed on port side of installation approx. 100 m × 2 m,95% silvery, 5% trace of color. Produced water in spec.
Moram
dinan
dO
’Hara
307
Publish
edby
NR
CR
esearchPress
Env
iron
. Rev
. Dow
nloa
ded
from
ww
w.n
rcre
sear
chpr
ess.
com
by
Env
iron
men
t Can
ada
on 0
9/30
/16
For
pers
onal
use
onl
y.

Table A1 (continued).
YYYY* MM* DD* Source Weather conditions Reason for sheen or phenomenon Miscellaneous
2010 4 21 Produced wateroutlet
Significant sea state 2.6 m6.8 s, wind 16 kn 248 T
Produced water Sheen observed on port side of installation approx. 150 m × 1 m, 95%silvery, 5% trace of color. Produced water in spec.
2010 5 2 Produced wateroutlet
Significant sea state 2.6 m7.5 s, wind 20 kn 125 T
Produced water Sheen observed on port side midway along installation approx. 100 m ×3 m, 95% silvery, 5% yellowish brown. Produced water in spec.
2010 5 3 Produced wateroutlet
Significant sea state 1.9 m6.9 s, wind 7 kn 288 T
Produced water Sheen observed on port side midway along installation approx. 200 m ×3 m, 95% silvery, 5% yellowish brown. Produced water in spec.
2010 5 13 Produced wateroutlet
Significant sea state 2.3 m6.8 s, wind 6 kn 180 T
Produced water Sheen approx. 3 m × 100 m, 95% silvery, 5% trace of color. Producedwater in spec.
2010 5 28 Produced wateroutlet
Significant sea state 2.1 m7.7 s, wind 17 kn 70 T
Produced water Sheen port side midway along installation approx. 3 m × 150 m, 95%silvery, 5% trace of color. Produced water in spec.
2010 5 28 Produced wateroutlet
Wind ESE 100° 20 kn;waveheight 1.4 m;visibility 3 nm
Produced water Silvery gray sheen was observed projecting from installation in finger-like formation moving in a south westerly direction. OIW samplelast night was 4.6 mg/L. OIW sample from morning was 26.5 mg/L.
2010 6 2 Produced wateroutlet
Significant sea state 3.0 m,wind 12 kn 16 T
Produced water Sheen starboard side approx. 3 m × 50 m. Produced water in spec.
2010 6 9 Produced wateroutlet
Significant sea state 2.8 m6.8 s, wind 34 kn 170 T
Produced water Sheen starboard side approx. 2 m × 150 m, Produced water in spec.
2010 6 12 Produced wateroutlet
Significant sea state 1.3 m5.6 s, wind 10 kn 90 T
Produced water Silvery sheen starboard side approx. 2 m × 100 m. Produced water inspec.
2010 6 13 Produced wateroutlet
Significant sea state 1.6 m7.3 s, wind 3 kn 316 T
Produced water Sheen starboard side approx. 3 m × 100 m. Produced water in spec.
2010 6 18 Produced wateroutlet
Wind S 44 kn; waveheight2.0 m; visibility 2 nm inlight rain
Produced water Silvery grey or bluish sheen was observed originating from producedwater outlet and projecting out from the installation in long finger-like formation, moving in a south westerly direction.
2010 6 26 Produced wateroutlet
Significant sea state 1.2 m4.5 s, wind 18 kn 315 T
Produced water Sheen starboard side approx. 5 m × 100 m, 95% silvery, 5% trace ofcolor. Produced water in spec.
2010 7 5 Produced wateroutlet
Significant sea state 1.4 m5.2 s, wind 13 kn 315 T
Produced water Sheen approx. 2 m × 100 m, 95% silvery, 5% trace of color. Poducedwater in spec.
2010 7 5 Produced wateroutlet
Significant sea state 1.4 m5.2 s, wind 13 kn 315 T
Produced water Sheen approx. 20 m × 200 m, 75% silvery, 15% trace of color, 5% dullcolor, 5% dark color.
2010 7 6 Produced wateroutlet
Significant sea state 1.6 m5.7 s, wind 13 kn 121 T
Produced water Sheen observed port side midway along installation approx. 50 m ×25 m, 25% silvery, 5% trace of color, 70% open water.
2010 7 7 Produced wateroutlet
Significant sea state 1.7 m6.0 s, wind 22 kn 248 T
Produced water Sheen approx. 100 m × 3 m, 75% silvery, 25% trace of color.
2010 7 8 Produced wateroutlet
Wind calm at 0 kn; swh1.1 m; visibility 15 nm
Produced water Silvery grey sheen observed originating from produced water outletand projecting out from the installation in finger-like formation,moving in a southeasterly direction. PW OIW sample taken in themorning was 6.1 mg/L.
2010 7 8 Produced wateroutlet
Significant sea state 1.4 m5.8 s, wind 22 kn 248 T
Produced water Sheen approx. 150 m × 50 m, 40% open water 50% silvery, 8% trace ofcolor, 2% dull color.
2010 8 10 Produced wateroutlet
Significant sea state 1.3 m5.7 s, wind 14 kn 200 T
Produced water Sheen approx. 20 m × 50, 95% silvery, 5% trace of color.
2010 8 11 Produced wateroutlet
Wind 150° at 4 kn; swh 0;visibility zero
Produced water A silvery grey sheen was observed originating from produced wateroutlet and projecting out from the installation in finger-likeformation, moving in a southwesterly direction.
2010 8 12 Produced wateroutlet
Significant sea state 1.84 m5.8 s, wind 10 kn 240 T
Produced water Sheen approx. 3 m × 100 m, 95% silvery, 5% trace of color.
308En
viron.R
ev.Vol.24,2016
Publish
edby
NR
CR
esearchPress
Env
iron
. Rev
. Dow
nloa
ded
from
ww
w.n
rcre
sear
chpr
ess.
com
by
Env
iron
men
t Can
ada
on 0
9/30
/16
For
pers
onal
use
onl
y.

Table A1 (continued).
YYYY* MM* DD* Source Weather conditions Reason for sheen or phenomenon Miscellaneous
2010 8 14 Produced wateroutlet
Significant sea state 1.0 m602 s, wind 8 kn 145 T
Produced water Sheen approx. 20 m × 100 m, 95% silvery, 5% trace of color.
2010 8 18 Produced wateroutlet
Sea state 1.5 4.9 s, wind13 kn 276 T
Produced water Sheen observed on starboard side approx. 100 m × 2 m, 100% silvery.
2010 8 19 Produced wateroutlet
Sea state 1.0 5.9 s, wind3 kn 290 T
Produced water Sheen observed on port side approx. 100 m × 100 m, 60% open water,40% silvery.
2010 8 19 Produced wateroutlet
Sea state 0.95 5.7 s, wind7 kn 226 T
Produced water Sheen observed on port side approx. 100 m × 3 m, 95% silvery 5% traceof color.
2010 8 20 Produced wateroutlet
Sea state 1.3 5.9 s, wind6 kn 084 T
Produced water Sheen observed on port side approx. 100 m × 100 m, 50% open water,50% silvery.
2010 8 21 Produced wateroutlet
Wind 070° 31 kn; swh 1.7 m;visibility 15 nm
Produced water A silvery grey sheen was observed originating from produced wateroutlet moving in a south westerly direction.
2010 8 23 Produced wateroutlet
Sea state 1.8 m 5.7 s, wind17 kn 016 T
Produced water Rosebuds developing into sheen observed on starboard side ofinstallation.100 m × 2 m, 75% silvery sheen, 20% open water, 5% tracecolour.
2010 8 24 Produced wateroutlet
Sea state 1.6 m 6.7 s, wind10 kn 045 T
Produced water Rosebuds developing into sheen observed on port side of installation.150 m × 25 m: 65% silvery sheen, 30% open water, 5% trace colour.
2010 8 25 Produced wateroutlet
Sea state 1.2 m 6.6 s, wind3 kn 026 T
Produced water Rosebuds developing into sheen observed on port side of installationapprox. 150 m × 50 m, 40% open water, 50% silvery, 10% trace ofcolor.
2010 8 25 Produced wateroutlet
Wind NE 050° 15 kn; swh1.4 m; visibility 15 nm
Produced water A silvery grey sheen was observed originating from produced wateroutlet and stayed in close proximity to installation.
2010 8 27 Produced wateroutlet
Sea state 1.67 m 6.3 s, wind4 kn 170 T
Produced water Rosebuds developing into sheen observed on port side of installationapprox. 150 m × 5 m, 95% silvery, 5% trace of color.
2010 8 29 Produced wateroutlet
Sea state 3.06 m 9.2 s, wind5 kn 027 T
Produced water Sheen observed on port side approx. 150 m × 3 m, 95% silvery, 5% traceof color.
2010 8 30 Produced wateroutlet
Sea state 3.42 m, wind 13 kn Produced water Sheen observed on port side approx. 100 m × 5 m, 95% silvery, 5% traceof color.
2010 8 30 Produced wateroutlet
— Produced water Sheen observed on port side approx. 50 m × 50 m.
2010 9 2 Produced wateroutlet
Sea state 3.452 m 6.47 s,wind 20 kn
Produced water Sheen observed on port side approx. 150 m × 5 m, 70% silvery,30% trace of color.
2010 9 3 Produced wateroutlet
Sea state 1.9 m 7.14 s, wind10 kn 300
Produced water Sheen observed on port side approx. 100 m × 3 m, 75% silvery,25% trace of color.
2010 9 4 Produced wateroutlet
Sea state 2.0 m 6.7 s, wind20 kn 198
Produced water Sheen observed on port side approx. 150 m × 3 m, 95% silvery, 5% trace ofcolor, 50 m × 50 m 75% open water, 20% slivery sheen, 5% trace of color.
2010 9 9 Produced wateroutlet
Sea state 2.1 m 5.9 s, wind9 kn 350
Produced water Sheen observed approx. 100 m × 3 m, 95% silvery, 5% trace of color.
2010 9 12 Produced wateroutlet
Sea state 2.2 m 6.8s, wind11 kn 290
Produced water Sheen observed approx. 100 m × 5 m, 95% silvery, 5% trace of color.
2010 9 18 Produced wateroutlet
Wind westerly at 52 kn;swh 2.8 m; visibility 4 nm
Produced water A silvery grey sheen with finger-like projections was observed originatingfrom produced water outlet moving in a north easterly direction.
2010 10 15 Produced wateroutlet
Sea state 2.6 m 6.3 s, wind17 kn 350
Produced water Sheen observed approx. 150 m × 4 m, 95% silvery, 5% trace of color.
2010 11 1 Produced wateroutlet
Sea state 3.1 m 7.3 s, wind15 kn 100
Produced water Sheen observed approx. 5 m × 100 m, 95% silvery, 5% trace of color.
2011 1 4 Produced wateroutlet
Sea state 3.0 m 7.37, wind15 kn 121
Produced water Sheen observed approx. 150 m × 3 m, 95% silvery, 5% trace of color.
Moram
dinan
dO
’Hara
309
Publish
edby
NR
CR
esearchPress
Env
iron
. Rev
. Dow
nloa
ded
from
ww
w.n
rcre
sear
chpr
ess.
com
by
Env
iron
men
t Can
ada
on 0
9/30
/16
For
pers
onal
use
onl
y.

Table A1 (continued).
YYYY* MM* DD* Source Weather conditions Reason for sheen or phenomenon Miscellaneous
2011 5 4 Produced wateroutlet
Wind NE 5 kn; wave height1.7 m; visibility 15 nm
Produced water Silvery sheen with a trace of brown colour was observed originatingfrom the produced water outlet.
2011 5 6 Produced wateroutlet
Wind NE 26 kn; waveheight 0.9 m; visibility4 nm
Produced water A barely visible sheen was observed originating from produced wateroutlet. The sheen was moving in a southerly direction away from theinstallation.
2011 5 20 Produced wateroutlet
Winds 15 kn 17; waves 1.35.5 s; visibility 5 nm
Produced water Rosebuds developing into sheen observed port side of installation150 m × 30 m. PW OIW in spec 0–25 ppm.
2011 5 25 Produced wateroutlet
Winds 15 kn 296; waves 1.87.4 s; visibility 1/2 nm
Produced water Rosebuds developing into sheen observed port side of installation. PWOIW in spec 0–25 ppm. Sheen measured 100 m × 50 m, 70% open30% silvery.
2011 6 17 Produced wateroutlet
27 kn from 10°; swh 2.5 m;visibility 8 nm
Produced water A barely visible sheen was observed originating from the producedwater outlet. The sheen was moving in a southerly direction awayfrom the installation.
2011 7 2 Produced wateroutlet
Winds were 16 kn at 260 Tseas 2.3 m and visibilitywas 1/8 mile
Produced water A sheen was reported measuring 5 m × 100 m.
2011 7 5 Produced wateroutlet
18 kn from 210°; swh 1.5 m;visibility 0.5 nm
Produced water A silvery sheen with a trace of brown color was observed originatingfrom the produced water outlet moving in a north easterly direction.
2011 7 17 Produced wateroutlet
Winds were 27 kn at 201 Tseas 2.5 m 5.7 s andvisibility was 1/8 mile
Produced water Rosebuds developing into sheen on port side side of the installation,50 m × 4 m, 80% open water 20% silvery sheen.
2011 7 26 Produced wateroutlet
10 kn from 180°; swh 1.5 m;visibility 12 nm
Produced water A silvery gray transparent sheen originating from the produced wateroutlet was reported moving away from the installation in a northwesterly direction.
2011 7 30 Produced wateroutlet
11 kn from 080°; swh 1.0 m;visibility 6 nm
Produced water A silvery gray transparent sheen originating from the produced wateroutlet was reported moving away from the installation in a northeasterly direction. PW samples were within regulatory limits.
2011 8 9 Produced wateroutlet
8 kn from WNW; swh0.4 m; visibility 6 nm
Produced water A silvery gray sheen with finger-like projections was observedoriginating from the produced water outlet.
2011 9 15 Produced wateroutlet
Winds were 19 kn at250 seas 1.7 m 7.1 s andvisibility was 1/8 mile
Produced water Rosebuds on port side side of the installation forming sheen 200 m ×4 m, 95% silvery sheen 5% trace of color.
2011 10 8 Produced wateroutlet
Winds were 10 kn at315 seas 2.3 m 6.9 s andvisibility was 15 mile
Produced water Sheen 5 m × 100 m, 95% silvery 5% trace of color.
2011 10 24 Produced wateroutlet
18 kn from 340°; swh 2.4 m;visibility 8 nm
Produced water Silvery sheen with finger-like projections observed originating fromthe produced water outlet and moving slowly away from theinstallation.
2011 10 25 Produced wateroutlet
12 kn from 360°; swh 2.0 m;visibility 15 nm
Produced water A silvery sheen with finger-like projections was observed originatingfrom the produced water outlet and moving away from theinstallation slowly. PW OIW at 06:17 was 19.7 mg/L.
2011 11 20 Produced wateroutlet
Winds were 30 kn at 240seas 4.1 m 7.5 s andvisibility was 5 nm
Produced water Sheen 5 m x 100 m, 95% silvery sheen 5% trace color, observed onstarboard side of installation, PW OIW within spec (0–25 ppm).
2011 12 1 Produced wateroutlet
Winds were 33 kn at 215seas 2.0 m 5.2 s andvisibility was 6 nm
Produced water Sheen 5 m × 10 m, 90% silvery sheen 10% trace of color, observed onport side of installation. PW OIW within spec (0–25 ppm).
310En
viron.R
ev.Vol.24,2016
Publish
edby
NR
CR
esearchPress
Env
iron
. Rev
. Dow
nloa
ded
from
ww
w.n
rcre
sear
chpr
ess.
com
by
Env
iron
men
t Can
ada
on 0
9/30
/16
For
pers
onal
use
onl
y.

Table A1 (continued).
YYYY* MM* DD* Source Weather conditions Reason for sheen or phenomenon Miscellaneous
2011 12 13 Produced wateroutlet
Winds were 11 kn at310 seas 3.1 m 7.0 s andvisibility was 15 nm
Produced water Sheen 100 m × 5 m, 95% silvery sheen 5% trace of colour, observed onport side. Produced water in spec.
2011 12 23 Produced wateroutlet
Winds were 5 kn at 290 seas3.9 m 7.7 s and visibilitywas 15 nm
Produced water Sheen 3 m × 80 m, 95% silvery sheen 5% trace of color. PW within spec0–20.7 ppm.
2011 12 26 Produced wateroutlet
Winds were 7 kn at 270 seas2.9 m 7.6 s and visibilitywas 15 nm
Produced water Sheen 3 m × 60 m, 95% silvery sheen 5% trace of color. Produced waterwithin spec 0–19 ppm.
2012 1 10 Produced wateroutlet
Winds were 7 kn at 145 seas2.0 m 7.5 s and visibilitywas 15 nm
Produced water Sheen 75 m × 3 m, 85% silvery sheen 5% trace of color, 10% open water.Produced water in spec.
2012 1 22 Produced wateroutlet
Winds were 6 kn at 170 seas2.2 m 7.0 s and visibilitywas 8 nm
Produced water Sheen 200 m × 2 m, 80% silvery sheen 10% trace of color, 10% openwater. Additional area within sheen 7 m × 7 m 50% silvery sheen and50% yellowish brown. Produced water within spec 0–30 ppm.
2012 3 30 Produced wateroutlet
Wind 070° at 18 kn; swh1.9 m; visibility 15 nm
Produced water Barely visible sheen observed originating from the produced wateroutlet.
2012 4 7 Produced wateroutlet
Winds were 17 kn at090 seas 2.2 m andvisibility was 8 nm
Produced water Sheen 3 m × 50 m, 80% silvery sheen 10% barely visible, Produced waterin spec.
2012 4 18 Produced wateroutlet
Wind 220° 15 kn; swh 1.0 m;visibility 0.25 nm
Produced water A silvery sheen with finger-like projections was observed originatingfrom the produced water outlet.
2012 4 19 Produced wateroutlet
Wind 280° 6 kn; swh 0.4 m;visibility 1–2 nm
Produced water A silvery sheen was observed originating from the produced wateroutlet slowly drifting in a southerly direction.
2012 5 8 Produced wateroutlet
Wind 070° 20 kn; swh1.5 m; visibility 12 nm
Produced water A barely visible sheen was observed originating from the producedwater outlet. The sheen is moving away from installation in a finger-like pattern going out 1 km.
2012 5 9 Produced wateroutlet
Wind 000° 0 kn; swh 1.8 m;visibility 10 nm
Produced water A barely visible sheen was observed originating from the produced wateroutlet. The sheen pattern is scattered patches, hovering around southend of installation to further than 0.5 km from installation.
2012 5 24 Produced wateroutlet
Wind 35 kn 360 T; swh1.6 m; visibility 4 nm
Produced water Sheen observed midway along starboard side of installation 2 m ×100 m: 20% open water, 10% barely visible, 70% silvery sheen. PWOIW in spec (0–20 ppm).
2012 5 27 Produced wateroutlet
Wind 330°; 20 kn; swh0.9 m; visibility 8 nm
Produced water A silvery sheen was observed originating from the produced wateroutlet slowly drifting in a southeasterly direction.
2012 5 27 Produced wateroutlet
Wind 18 kn 220 T; swh 1.1–2.0 m; visibility 1/8 nm
Produced water Sheen observed starboard side midway along installation 3 m × 150 m:30% open water, 10% barelyvisible, 60% silvery sheen. Produced waterwithin spec (0–25 ppm).
2012 6 5 Produced wateroutlet
Wind 50° 6 kn; swh 0.4 m;visibility 1/8 nm
Produced water A silvery sheen was observed originating from the produced wateroutlet slowly drifting in a south easterly direction. Production andproduced water numbers were normal.
2012 6 11 Produced wateroutlet
Wind 90° 12 kn; swh 0.8 m;visibility 6+ nm
Produced water A silvery sheen was observed originating from the produced water outletslowly drifting slowly in a southerly direction. OIW analyzer trendinglow with no spikes. OIW sample from morning was 26.2 mg/L.
2012 6 14 Produced wateroutlet
Wind 90° 25 kn; swh 1.0 m;visibility 8 nm
Produced water A silvery sheen was observed originating from the produced wateroutlet slowly drifting in a westerly direction from the south end ofthe installation. OIW analyzer trending low with no spikes. OIWsample taken last night was 33.5 mg/L and this morning sample at06:20 was 31.1 mg/L.
Moram
dinan
dO
’Hara
311
Publish
edby
NR
CR
esearchPress
Env
iron
. Rev
. Dow
nloa
ded
from
ww
w.n
rcre
sear
chpr
ess.
com
by
Env
iron
men
t Can
ada
on 0
9/30
/16
For
pers
onal
use
onl
y.

Table A1 (continued).
YYYY* MM* DD* Source Weather conditions Reason for sheen or phenomenon Miscellaneous
2012 6 16 Produced wateroutlet
Wind 60° 26 kn; swh 1.3 m;visibility 15 nm
Produced water A barely visible sheen was observed originating from the produced wateroutlet slowly drifting in a southerly direction from the south end of theinstallation. The formation of the sheen is finger-like projections outapproximately 800 m from the installation. OIW sample taken lastnight was 23.5 mg/L and this morning sample was 17.5 mg/L.
2012 6 18 Produced wateroutlet
Wind 60° 8 kn; swh 1.0 m;visibility 15 nm
Produced water A silvery sheen was observed originating from the produced wateroutlet slowly drifting in a south westerly direction from the southend of the installation. The sheen is a meandering narrow bandprojecting out approximately 5 km. OIW analyzer trending low withno spikes. OIW sample taken last night was 41.4 mg/L and thismorning sample was 22.8 mg/L.
2012 6 19 Produced wateroutlet
Wind 130° 6 kn; swh 0.8 m;visibility 15 nm
Produced water A silvery sheen was observed originating from the produced water outletslowly drifting in a north westerly direction from the south end of theinstallation. OIW analyzer trending low with no spikes. OIW sampletaken last night was 23.3 mg/L and this morning sample was 76.6 mg/L.and a second morning sample taken 1.5 h later was 20.8 mg./L.
2012 6 20 Produced wateroutlet
Wind 0° 0 kn; swh 1.0 m;visibility 2 nm
Produced water A silvery-greyish sheen was observed originating from the producedwater outlet and around the full perimeter of the installation. Thesheen extends outward from the west side of the installation. OIWanalyzer trending low with no spikes. OIW sample taken last nightwas 21.4 mg/L and this morning sample was 10.0 mg/L.
2012 6 21 Produced wateroutlet
Wind 130° 25 kn; swh 1.2 m;visibility 1/8 nm
Produced water A silvery-greyish sheen was observed originating from the producedwater outlet around the south end of the installation, and extendingin a southerly direction. OIW analyzer trending low with no spikes.OIW sample taken last night was 16.7 mg/L and this morning samplewas 10.0 mg/L.
2012 6 25 Produced wateroutlet
Wind 060° 8 kn; swh 1.2 m;visibility 8 nm
Produced water A silvery-greyish sheen was observed originating from the producedwater on the south end of the installation and extending in a southwesterly direction in a narrow band out approximately 4 km. OIWanalyzer trending low with no spikes. OIW sample taken last nightwas 35.0 mg/L and this morning sample was 32.5 mg/L.
2012 6 26 Produced wateroutlet
Wind 110° 9 kn; swh 1.3 m;visibility 15 nm
Produced water A silvery sheen was observed originating from the produced water onthe south end of the installation and extending in a southerlydirection out approx. 400 m. OIW analyzer trending low with nospikes. OIW sample taken last night was 37.8 mg/L and this morningsample was 24.9 mg/L.
2012 6 28 Produced wateroutlet
Wind SSW 20 kn; swh1.75 m; visibility 3/8 nm
Produced water A silvery sheen was reported originating from the produced water onthe south end of the installation and extending in a north westerlydirection approximately 1 nm. OIW in the AM was 42 mg/L, and43 mg/L in the PM.
2012 6 29 Produced wateroutlet
Wind 210° 30 kn; swh 3.1 m;visibility 1/2 nm
Produced water A sheen with a trace of bronze was reported originating from theproduced water outlet. The sheen approx. 500 m × 300 m is stayingclose to the southeast corner of the installation. OIW in the AM ofwas 49 mg/L.
312En
viron.R
ev.Vol.24,2016
Publish
edby
NR
CR
esearchPress
Env
iron
. Rev
. Dow
nloa
ded
from
ww
w.n
rcre
sear
chpr
ess.
com
by
Env
iron
men
t Can
ada
on 0
9/30
/16
For
pers
onal
use
onl
y.

Table A1 (continued).
YYYY* MM* DD* Source Weather conditions Reason for sheen or phenomenon Miscellaneous
2012 7 14 Produced wateroutlet
Wind 0° 0 kn; swh 1.0 m;visibility 15 nm
Produced water A silvery sheen was reported originating from the produced wateroutlet and staying close to the installation from the southwestcorner along the south side and east side to the northeast corner.OIW in the AM was 33.2 mg/L.
2012 7 15 Produced wateroutlet
Wind 330° 14 kn; swh2.5 m; visibility 15 nm
Produced water A silvery sheen with traces of brown was reported originating from theproduced water on the southeast end of the installation. The sheenis moving away from the installation in a westerly direction outapproximately 1 km away from installation. OIW in the AM was 29.9 mg/L.
2012 7 18 Produced wateroutlet
Wind 060° 8 kn; swh 1.0 m;visibility 15 nm
Produced water A silvery sheen was observed originating from the produced wateroutlet and slowly drifting in a south westerly direction from thesouth end of the installation. The formation of the sheen is a narrowband extending out approximately 5 km. OIW analyzer trending lowwith no spikes. OIW sample taken last night was 41.4 mg/L and thismorning sample was 22.8 mg/L.
2012 7 25 Produced wateroutlet
Wind 090° 12 kn; swh0.8 m; visibility 0.5 nm
Produced water A silvery bluish sheen with faint traces of brown was reportedoriginating from the produced water on the southeast end of theinstallation and trailing off in a south west direction. The fainttraces of brown in the sheen dispersed quickly as the sheen movedaway from the installation. OIW sample in the PM of Jul 24/12 was18.3 mg/L. OIW sample in the AM of July 25/12 was 25.8 mg/L.
2012 8 10 Produced wateroutlet
Wind 360 at 9 kn; swh1.0 m; visibility 0 nm
Produced water A silvery bluish sheen was reported originating from the producedwater on the southeast end of the installation and staying within200 m from installation. OIW sample in the PM of Aug 9/12 was24.4 mg/L. OIW sample in the AM of Aug 10/12 was 29.9 mg/L.
2012 8 11 Produced wateroutlet
Wind 360 at 9 kn; swh1.0 m; visibility 0 nm
Produced water A silvery bluish sheen was reported originating from the producedwater on the southeast end of the installation and drifting in a southeasterly direction out approximately 500 m. OIW sample in the PMof Aug 10/12 was 33.8 mg/L. OIW sample in the AM of Aug 11/12 was43.0 mg/L.
2012 11 1 Produced wateroutlet
Wind 080° 5 kn; swh 2.2 m;visibility 3 nm
Produced water A silvery bluish sheen was reported originating from the producedwater on the southeast end of the installation and drifting in asoutherly direction out approximately 750 m. OIW sample in the PMof Oct 31/12 was 14.5 mg/L. OIW sample in the AM of Nov 1/12 was13.5 mg/L. PM sample for Nov1 was 33.1 mg/L.
2012 12 12 Produced wateroutlet
Wind 280° 29 kn; swh4.0 m; visibility 6+ nm
Produced water A silvery bluish sheen was reported originating from the producedwater on the southeast end of the installation and was drifting in aneasterly direction out approximately 750 m.
2013 4 11 Produced wateroutlet
Wind 35 kn 258; swh 1.9 m5.5 s; visibility 12 nm
Produced water Sheen 5% open water 5% trace of color, 90% silvery sheen measuring10 m × 10 m mid ship Starboard side of installation. Produced waterwithin spec (0–17 ppm).
2013 5 22 Produced wateroutlet
Wind 15 kn 280; swh 1.5 m6.4 s; visibility 12 nm
Produced water Sheen observed off midway along port side about 2 m × 50 m, 5% openwater, 5% trace of color. 90% silvery sheen. Produced water in spec(0–8 ppm).
2013 5 24 Produced wateroutlet
Wind 250° 5 kn; swh 0.3 m;visibility 1/2–1 nm
Produced water A silvery bluish sheen was reported originating from the producedwater on the southeast end of the installation. The sheen wasdrifting in a north easterly direction Production was steady. Therewere no sea birds in the area encompassed by the sheen.
Moram
dinan
dO
’Hara
313
Publish
edby
NR
CR
esearchPress
Env
iron
. Rev
. Dow
nloa
ded
from
ww
w.n
rcre
sear
chpr
ess.
com
by
Env
iron
men
t Can
ada
on 0
9/30
/16
For
pers
onal
use
onl
y.

Table A1 (continued).
YYYY* MM* DD* Source Weather conditions Reason for sheen or phenomenon Miscellaneous
2013 6 5 Produced wateroutlet
Winds 22 kn 276 T SWH2.3 m 5.5 s visibility 10 nm.
Produced water Slivery sheen 100 m × 50 m 50% open water Sheen midway along portside. Produced water with in spec, 0–25 ppm.
2013 6 7 Produced wateroutlet
Wind 234° at 12 kn visibility18 nm seas 1.3 m at5.1 s interval, vesselheading 200°
Produced water Sheen on port side approx. 175 m × 35 m, 25% barely visible,75% silvery. Source is identified as produced water. PW in spec.
2013 6 8 Produced wateroutlet
Northerly 10 kn, visibility14 (95/90) nm, seas0.9 m, vessel heading(97/92) 109 true
Produced water Sheen 100 m × 100 m, 70% open water, 30% silvery sheen. Producedwater is in spec.
2013 6 8 Produced wateroutlet
Wind 220° 16 kn; swh 1.2 m;visibility 10 nm
Produced water A silvery grey sheen was reported originating from the produced wateron the southeast end of the installation and extending about 200 mand then drifting in a northeasterly direction for about 6–700 m.
2013 6 16 Produced wateroutlet
Wind 060° 26 kn; swh1.3 m; visibility 15 nm
Produced water A barely visible sheen was observed originating from the producedwater outlet slowly drifting in a southerly direction from the southend of the installation in finger-like projection out approximately800 meters from installation. OIW sample taken last night was23.5 mg/L and this morning sample was 17.5 mg/L.
2013 7 2 Produced wateroutlet
— Produced water Sheen reported port side of installation 100 m × 30 m 5% open water,90% silvery sheen, 5% yellowish brown. Produced water in spec0–25 ppm.
2013 7 7 Produced wateroutlet
Wind 160° 6 kn; swh 0.2 m;visibility 10 nm
Produced water A silvery bluish sheen was reported originating from the producedwater on the southeast end of the installation and drifting in asouthwest direction. PW OIW in am was 12.4 mg/L.
2013 7 9 Produced wateroutlet
Winds 3 kn 220 T; swh0.8 m 5.7 s; visibility1/8–1/2 nm in mist
Produced water Sheen midway along port side 80 m × 3 m, 20% open water, 80% silverysheen. Produced water in spec.
2013 7 11 Produced wateroutlet
Winds 9 kn 113 T; SWH1.44 m 4.61 s; visibility0–1/2 nm
Produced water Sheen on port side 50 m × 20 m, 80% open water, 15% silvery sheen,5% trace of color. Produced water in spec.
2013 7 13 Produced wateroutlet
Winds 16 kn; swh 1.1 m4.8 s; visibility 0 nm
Produced water Sheen on starboard side 30 m × 20 m, 60% open water, 40% silverysheen, 50 m × 2 m, 30% open water, 70% silvery sheen. Producedwater in spec.
2013 7 14 Produced wateroutlet
Winds 10 kn; swh 0.8 m4.5 s; visibility 0 nm
Produced water Sheen on port side 175 m × 30 m, 75% open water 25% silvery sheensecond sheen starboard side 2 m × 10 m, 95% open water, 5% silverysheen. Produced water in spec.
2013 7 17 Produced wateroutlet
Winds 19 kn; swh 2.35 m5.97 s; visibility 2 0 nm
Produced water Sheen midway along port side 150 m × 30 m, 85% open water,15% silvery sheen. Produced water in spec.
2013 7 24 Produced wateroutlet
Winds 22 kn 156 T; swh0.92 m 3.9 s; visibility0 nm
Produced water Sheen on starboard side 100 m × 30 m, 90% open water, 10% silvery.Produced water in spec.
2013 7 26 Produced wateroutlet
Winds 22 kn 156 T; swh0.92 m 3.9 s; visibility0 nm
Produced water Sheen on starboard side 175 m × 30 m 85% open water, 10% silverysheen, 5% barely visible. Produced water in spec 19.9 ppm.
2013 7 28 Produced wateroutlet
Winds 30 kn 240; swh1.2 m; visibility 1/8 nm
Produced water A dull grey to silver sheen originating from the produced water on thesoutheast end of the installation and drifting in a south southwestdirection from the installation in a triangular shape. PW OIW in AMwas 24.6 mg/L.
314En
viron.R
ev.Vol.24,2016
Publish
edby
NR
CR
esearchPress
Env
iron
. Rev
. Dow
nloa
ded
from
ww
w.n
rcre
sear
chpr
ess.
com
by
Env
iron
men
t Can
ada
on 0
9/30
/16
For
pers
onal
use
onl
y.

Table A1 (concluded).
YYYY* MM* DD* Source Weather conditions Reason for sheen or phenomenon Miscellaneous
2013 8 3 Produced wateroutlet
Winds 24 kn 165 T; swh1.2 m 3.8 s; visibility3/4 nm in mist
Produced water Sheen midway along starboard side 50 m × 3 m, 20% open water,80% silvery sheen. Produced water in spec 0–14 ppm.
2013 8 29 Produced wateroutlet
Winds 23 kn 040°; swh1.5 m; visibility 6 nm
Produced water A silvery sheen was reported originating from the produced water onthe southeast end of the installation and drifting in a south-southeast direction. Immediately below the installation the sheenwas triangular shaped and the edge of the sheen had a dull color. Asyou moved away from the installation the sheen quickly trailed offwith many small striated patches.
2013 8 31 Produced wateroutlet
Winds 39 kn; shw 5.5 m 7.9;visibility 4 nm
Produced water Sheen on port side 100 m × 15 m, 90% open water, 5% barely visible,5% silvery sheen. Produced water in spec 1 ppm.
2013 9 2 Produced wateroutlet
Winds 17 kn Produced water Sheen on starboard side 125 m × 50 m, 95% open water, 5% barelyvisible.
2014 1 6 Produced wateroutlet
Wind 16 kn 330, swh 5.8 m8.3 s, visibility 22 nm
Produced water Sheen midway along port side 150 m × 3 m 100% silvery. Producedwater in spec 0–25 ppm.
2014 2 17 Produced wateroutlet
Winds 34 kn 241 T, swh5.9 m 8.6 s
Produced water Sheen midway along port side 100 m × 30 m, 95% open water,5% silvery sheen. Produced water in spec at 27.5 ppm.
2014 3 20 Produced wateroutlet
Winds 3 kn 210 T, swh2.7 m 8.2 s
Produced water Sheen midway along port side 150 m × 15 m, 98% open water 2% silvery,Produced water in spec at 12.1 ppm
2014 4 1 Produced wateroutlet
Winds 25 kn 70 T, swh2.6 m 6.2 s, visibility0.5 nm
Produced water Sheen midway along port side 150 m × 30 m, 90% open water,10% silvery sheen. Produced water 15.9 ppm.
2014 5 5 Produced wateroutlet
Winds 1 kn 305 T, swh 3 m11 s, visibility 0.0 nm
Produced water Sheen midway along port side 150 m × 100 m, 85% open water,12% silvery, 3% dull color. Produced water 19.9 ppm.
2014 7 16 Produced wateroutlet
Winds 15 kn 285 T, swh1.3 m 4.8 s, visibility1/4 nm in fog
Produced water Sheen midway along port side, 80 m × 3 m, 8% open water, 90% silvery,3% dull color. Produced water 0–25 ppm.
2014 8 6 Produced wateroutlet
Winds 9 kn 170 T, swh0.14 m 7.7s, visibility15 nm
Produced water Sheen midway along starboard side, 50 m × 3 m, 10% open water,10% barely visible, 80% silvery. Produced water 27.2 ppm.
2014 9 18 Produced wateroutlet
Winds 20 kn 110 T, swh 2 m5.5 s, visibility 7 nm
Produced water Sheen midway along starboard side, 150 m × 15 m, 98% open water,2% silvery sheen.
2014 9 19 Produced wateroutlet
Winds 10 kn 280 T, swh1.5 m 6.5 s, visibility 6 nm
Produced water Sheen midway along starboard side, 200 m × 10 m, 95% open water,5% silvery sheen.
2014 12 26 Produced wateroutlet
Winds 17 kn 239 T, swh3.4 m 8.5 s, visibility 1 nm
Produced water Sheen along starboard side, 200 m × 10 m, 95% open water, 5% silvery.
2015 2 9 Produced WaterOutlet
Winds NNE 11 kn, swh0.8 m, visibility 6+ nm
Produced water Silvery sheen reported originating from the produced water on thesoutheast end of the installation and drifting in a southeast direction asmany small striated patches. PW OIW in AM was 20.7 mg/L.
2015 2 15 Produced WaterOutlet
Winds light and variable285 T, swh 4 m 8.6 s,visibility 15 nm
Produced water Sheen observed 2 m × 50 m, 5% open water, 95% silvery sheen.
2015 2 24 Produced WaterOutlet
Winds 4 kn 280 T, swh2.6 m 7.5 s, visibility2 nm
Produced water Sheen 250 m × 10 m, 80% open water, 10% silvery sheen, 5% trace ofcolor, 4% bright bands of color, 1% dull color. Produced water in spec23.6 ppm.
2015 5 11 Produced WaterOutlet
NA Produced water Sheen observed on midway along starboard side of installation 10 m ×100 m (60% open water, 5% silvery sheen, 15% trace of colour,20% bright band of colours). PW OIW in spec: am sample 18 ppm.
Note: Data was obtained from the Canadian-Newfoundland and Labrador Offshore Petroleum Board (C-NLOPB) with platform identification removed for privacy. Sheen observation protocol and effort was notsupplied with these data.
Moram
dinan
dO
’Hara
315
Publish
edby
NR
CR
esearchPress
Env
iron
. Rev
. Dow
nloa
ded
from
ww
w.n
rcre
sear
chpr
ess.
com
by
Env
iron
men
t Can
ada
on 0
9/30
/16
For
pers
onal
use
onl
y.

Table A2. Laboratory and field controlled-dose studies of effects of oil, internally and externally on marine birds.
Age Species tested Factors tested Oil type Test conditions Results Reference
External dosingAdults Sanderlings (Calidris alba);
semi-palmated plovers(Charadrius semipalmatus)
Behaviour Nigerian lightcrude oil
Observation of naturally oiled birds fromlightly (1%–15%) to heavily (>30%) oiled(note: this was not controlled dosing)
Heavily oiled birds experienced decreasedtime feeding and preening andincreased time standing
Burger (1997)
Adults Sanderlings (Calidris alba) Behaviour and weight Nigerian lightcrude oil
Fresh and weathered oil swabbed onbelly feathers to simulate 20% oiling
Oiled birds spent less time resting, moretime preening and bathing, were moreaggressive, declined in average weightby 10%, and food consumption by 59%
Burger andTsipoura(1998)
Adults Leach’s storm petrels(Oceanodroma leucorhoa)
Metabolic rate PBCO 1.0 mL PBCO on breast and abdominalplumage and held in 16–21 °C air (noton water)
No change in metabolic rate Butler et al.(1986)
Adults Adélie penguins(Pygoscelis adeliae)
Metabolic rate Vegetable oil Oral dose of oil spread on feathers whilepreening “lightly oiled”; metabolismmeasured in air and on water
Increased heart rate, erratic behaviour,and metabolic rate 50% higher afteroiling and when in/on 2–6 °C water
Culik et al. (1991)
Adults Magellanic penguins(Spheniscus magellanicus)
Hormonal,reproductive
Crude oil Measured hormones of live birds lightlyto moderately oiled from spill (note:this was not controlled dosing)
Hormone disruption in oiled birds andeven lightly oiled birds did notestablish nests with eggs
Fowler et al.(1995)
Adults Mallard ducks (Anasplatytyrhynchos); Blackducks (Anas rubripes)
Metabolic rate Various 5–50 g applications metabolic ratemeasured ducks in air at varioustemperatures
Dose-dependent increase in metabolicrate up to 100%
Hartung (1967)
Adults Common eiders(Somateria mollissima);Mallard ducks (Anasplatyrhynchos)
Heat loss Statfjord crudeoil
2.5–70 mL applications metabolic heatproduction resting in 5.5–6.5 °C water
Dose-dependent increase in heat losswhen dose higher than 2.5 mL; 369%higher than normal in 70 mL group,and hypothermic within 70 min
Jenssen andEkker (1991)
Adults Common murres (Uriaaalge); thick-billedmurres (Uria lomvia)
Pathology; weightloss
Crude oil Lightly to moderately contaminated onthe breast, wings, feet, and head
Liver, kidney, and intestine necrosis;hematocrit values 43% below normal;weight loss of 7 fold
Khan and Ryan(1991)
Adults Mallard ducks (Anasplatytyrhynchos)
Metabolic rate PBCO 50 �m thick simulated oil slick inswimming tank with seawater
13% increase in metabolic rate Lambert et al.(1982)
Adults Mallard ducks (Anasplatytyrhynchos); Scaup
Metabolic rate;thermalconductance
Boundary Lakecrude
Ducks placed on water with 50–400 mLoil, metabolic rate measured in air
Dose-, length-of-exposure-, andtemperature-dependent increase inthermal conductance up to 98%;increase in metabolic rate by 33%
McEwan andKoelink (1973)
Adults,embryos
Leach’s storm petrels(Oceanodroma leucorhoaViellot)
Oil transfer and egghatching
PBCO Syringe used to apply 0.10 mL, or 0.50 mLPBCO on abdominal plumage andbreast; intubation of 0.02 or 0.10 mLPBCO
Reduced attendance at burrow; parentsoiled with 0.5 mL rejected up to 88% ofvisibly oiled eggs, 8% hatching success;20% hatching success with intubatedparents
Butler et al.(1988)
Embryos Mallard ducks (Anasplatyrhynchos)
Oil transfer and egghatching
PBCO Adults exposed to slicks 0.1 and 0.005mm thick
Oil transferred to eggs; lower hatchingsuccess in dose-dependent fashionsignificant at 0.1 mm thick
Albers (1980)
Embryos Leghorn chickens Pathology PBCO and SLCO 5 to 20 �L applied to shells of fertile eggsat various stages
5 �L of PBCO 100% mortality in 8–8.5 dold embryos; liver necrosis, edema,distention of heart, enlarged spleen;dose related
Couillard andLeighton(1989, 1990,1991)
Embryos Mallard ducks (Anasplatyrhynchos)
LD50 Crude and refinedpetroleum
Applied to eggs in various doses Embryotoxic and moderately teratogenic;LD50s of 0.3 to 5 �L per egg
Hoffman andAlbers (1984)
316En
viron.R
ev.Vol.24,2016
Publish
edby
NR
CR
esearchPress
Env
iron
. Rev
. Dow
nloa
ded
from
ww
w.n
rcre
sear
chpr
ess.
com
by
Env
iron
men
t Can
ada
on 0
9/30
/16
For
pers
onal
use
onl
y.

Table A2 (continued).
Age Species tested Factors tested Oil type Test conditions Results Reference
Embryos Laughing gulls (Larusatricilla)
Oil transfer and egghatching
No. 2 fuel oil Syringe used to apply 2.5 mL No. 2 fueloil to breast feathers
41% embryonic mortality compared to 2%in controls
King and Lefever(1979)
Internal dosingAdults Cassin’s auklets
(Ptychoramphus aleuticus)Egg hatching Bunker C fuel oil,
PBCOFed gelatin capsule of 300, 600, or 1000 mg
bunker C fuel oil or 1000 mg PBCOReduced egg laying and egg hatching at
medium and high dosesAinley et al.
(1981)Adults Leach’s storm petrels
(Oceanodroma leucorhoa)Metabolic rate PBCO Intubation with 0.1 mL PBCO Increased metabolic rate by up to 25% Butler et al.
(1986)Adults Mallard ducks (Anas
platyrhynchos)Hormonal,
reproductiveSLCO 3 mL crude oil per 100 g dry food for
50 days (no estimate of actual oil amountconsumed per bird) to females
Reproductive hormone levels weredepressed and egg laying delayedcompared to controls
Cavanaugh andHolmes (1987)
Adults Mallard ducks (Anasplatyrhynchos)
Hepatic enzymeinduction,corticosteronelevels; foodconsumption
Kuwait, SLCO andSanta Barbarachannel crudeoil, No. 2 fueloil, PBCO
Fed various concentrations of petroleumestimated to range from 0.4 to 7 mL/kgbody weight per day for 50 d (10 d1982 study)
Chronic exposure resulted in increases inhepatic liver enzymes; tolerated thecontaminated food with few signs of“overt distress”
Gorsline andHolmes (1981,1982); Gorslineet al. (1981)
Adults Mallard ducks (Anasplatyrhyncho)
Toxicity, various Light fuel oil No. 1;diesel oil; SAE10 W lube oil;SAE 10-W-30 lubeoil; cutting oil
Intubated with 2 g/kg fuel oil; 2–24 mL/kgdiesel oil; 2 mL/kg 10-W-30 lube oil; 1, 2,or 5 mL/kg cutting oil
Up to 61% lipid pneumonia in pollution-killed ducks; increased diarrhea,anemia, GI irritation, liver, kidney andpancreatic damage; increased weight ofadrenal glands; motor disturbances;LD
50s ranged from 7 to 24 mL/kg and
decreased LD50s at lower temperatures
Hartung andHunt (1966)
Adults Pekin ducks (Anasplatyrhynchos)
Food consumption,osmo-regulation,mortality
Kuwait, SLCO,No. 2 fuel oil,PBCO
Fed various amounts from 6 mL SLCO,6 mL of Kuwait crude oil, or 3 mL ofNo. 2 oil for 50 d (1978); approximately1–7 mg/kg body weight per day for 50 d(1979); evaluated at 27 and 3 °C
Hyperphagia possibly due to impairedintestinal absorption; increasedmortality; cold stress increasedmortality effects of ingested petroleumoils
Holmes et al.(1978, 1979)
Adults Rhinoceros auklets(Cerrorhinca monocerata)
Blood: packedcell volume,haemoglobinconcentration etc.
PBCO 0, 2.5, or 10 mL oil/kg of body weight for5 consecutive days
No differences between groups in anyblood parameters.
Newman et al.(1999)
Adults,chicks
Herring gulls (Larusargentatus); Leach’sstorm petrels(Oceanodroma leucorhoa)
Effects on chickmetabolism; effectsof adult dosing onchicks
PBCO Intubation of chicks 1 mL; intubation ofadults with 0.1 mL PBCO when chicks3–5 d or 15 d old.
Increase in metabolic rate of chicks dosedwith oil; when adults dosed, increasedmortality in chicks 3–5 d old; reducedweight gain at 15 d; nest visitationunchanged; nasal and adrenal glandweights and thyroxine levels increased
Miller et al.(1980)
Adults,chicks
Mallard ducks (Anasplatyrhynchos)
LD/LC50, foodconsumption,weight, growth,systemic toxicity
Weathered ExxonValdez crude oil
Oral feeding; birds monitored fortoxicity and mortality
No acute or subacute effects on adults(LD50 > 5000 mg/kg) or ducklings(LC50 > 50 000 mg/kg diet)
Stubblefieldet al. (1995a)
Adults,chicks
Leach’s storm petrels(Oceanodroma leucorhoa)
Chick survival;weight gain; organweights
PBCO Intubation with 0.1 mL in adults or0.05 mL in chicks
Chick survival reduced by 30% with oneparent oiled and 48% when both oiled;decreased weight in chicks after adultsdosed; adult nasal and adrenal glandweight increased
Trivelpiece et al.(1984)
Moram
dinan
dO
’Hara
317
Publish
edby
NR
CR
esearchPress
Env
iron
. Rev
. Dow
nloa
ded
from
ww
w.n
rcre
sear
chpr
ess.
com
by
Env
iron
men
t Can
ada
on 0
9/30
/16
For
pers
onal
use
onl
y.

Table A2 (concluded).
Age Species tested Factors tested Oil type Test conditions Results Reference
Adults,chicks,eggs
Mallard ducks (Anasplatyrhynchos)
Mortality, bodyweight, foodintake,reproductive,hatching success;shell thickness
Weathered ExxonValdez crude oil
Multiple acute and subchronic toxicitytests including oral feeding including5000 mg/kg body weighted 200 mg,2000 mg, 20000 mg/kg; 1/3–1/6 eggcovered
No significant differences in mortality,body weight, food consumption,reproductive parameters, or hatching;egg shell thickness decreased at highestdosage; increased embryo mortality athigh doses of 125 mg/egg
Stubblefied et al.(1995b)
Chicks Herring gulls (Larusargentatus)
Growth rate;behaviour;mortality
Weathered SLCO Chicks intubated with 0.2 mL oil, 0.5 mLoil, and corn oil
Depressed weight gains; no significantbehavioural changes; higher mortalityat 0.5 mL (59%) than 0.2 mL (35%) orcontrols (38%)
Butler andLukasiewicz(1979)
Chicks Herring gulls (Larusargentatus); Leach’sstorm petrels(Oceanodroma leucorhoa)
Growth rates, organweights, mortality
Weathered SLCO,PBCO
Chicks intubated with 1 mL of PBCO orequivalent aromatic fraction in 1 mL ofPBCO
Depressed growth rates and increasednasal gland and adrenal weights inwhole oil and AR-2 fraction; AR-2 liverhypotrophy; 53% of chicks of dosedparents survived (100% of controlssurvived)
Butler et al.(1979)
Chicks Mallard ducks (Anasplatyrhyncho)
Hepatic enzymeinduction;corticosteronelevels
SLCO orfractionate
Fed 3 mL crude oil per 100 g dry food orone of four proportionate fractionatesseparated by boiling point
Whole and two fractions of oil inducedhepatic napthalene metabolism anddecreased levels of corticosterone
Gorsline andHolmes (1982)
Chicks Herring gulls (Larusargentatus)
Enzyme induction PBCO, HCO Intubated with 0, 4, or 10 mL/kg PBCO or10 mL/kg HCO for 6 d
Hepatic cytochrome P-450 activityincreased 4-fold; renal and liver mixed-function oxidase activity induced
Lee et al. (1985)
Chicks Herring gulls (Larusargentatus); Atlanticpuffins (Fraterculaarctica)
Hemolytic anemia,Heinz bodyformation,oxidative stress
PBCO Gulls fed gelatin capsule of either 1, 4,10, or 20 mL/kg PBCO per day; puffinsfed 5 or 10 mL/kg PBCO per day
Severe hemolytic anemia (>50% decreasein packed cell volume andhemoglobin); increased oxidative stress(99% increase in Heinz body formation)
Leighton et al.(1983)
Chicks Black guillemots (Cepphusgrylle)
Growth rates, organweights, osmo-regulation
Weathered SLCO Chicks intubated with a single dose of0.1, 0.2, or 0.5 mL
Depressed growth rates; increased nasalgland and adrenal weight (3×),transient rise in sodium, no significantchange in liver weight or Na, K-ATPaseactivities
Peakall et al.(1980)
Chicks Herring gulls (Larusargentatus)
Weight gain, organweights, sodiumlevels
PBCO Chicks intubated with 1 mL PBCO orPBCO aromatic fraction of high or lowmolecular weight
Depressed weight gain, increased adrenaland nasal gland weight, and transientincrease in sodium levels in treatmentswith PBCO and AR-2 fraction
Peakall et al.(1982)
Chicks Pigeon guillemots(Cepphus columba)
Blood proteins,sodium levels,enzyme induction,growth and bodymass
Weathered PBCO Fed 0.05 or 0.20 mL Weak effect on blood proteins; no effectson sodium levels, liver enzymes,growth and body mass; concluded thatlack of significant effects may be due tooil being “weathered”
Prichard et al(1997)
Note: PBCO, Prudhoe Bay crude oil; SLCO, South Louisiana crude oil.
318En
viron.R
ev.Vol.24,2016
Publish
edby
NR
CR
esearchPress
Env
iron
. Rev
. Dow
nloa
ded
from
ww
w.n
rcre
sear
chpr
ess.
com
by
Env
iron
men
t Can
ada
on 0
9/30
/16
For
pers
onal
use
onl
y.