Offshore disasters: wave forces on offshore and coastal ... · damage to onshore and offshore...
20
Offshore disasters: wave forces on offshore and coastal structures due to Tsunamis A. R. Foroughi, W. Sleeman & R. Scott School of Construction and Civil Engineering, Newcastle College, England, UK Abstract Every year natural disasters result in considerable damage to offshore structures, coastal zones and other vulnerable areas. In Tsunami disasters direct damage occurs, such as the destruction of structures and loss of life due to wave forces and the run-up Tsunami. Tsunamis are characterised as shallow water waves of long period wavelength with extreme height and force. They are often observed with wavelengths in excess of 150 Km and with periods of over 1.5 hours. Due to their large wavelength and wave force, Tsunamis propagate high wave forces and loads. This paper has three main sections. Characteristics of waves, which includes waves with a crest at the top and a trough at the bottom, wave forces and damage to offshore structures, the design of wave methodology for safer structures; Physical characteristics of Tsunamis, considering the mitigation of risk and hazard, wave force estimation, design of offshore and coastal structures to allow for Tsunamis; Managing natural disasters. This paper provides a close study and literature review on the engineering approach to the design of wave forces and reports on a proposed structural design method for Tsunami refuge building based upon a literature survey of previous theoretical and experimental research on Tsunami forces and loads to offshore and coastal structures. The paper also proposes a verification approach requiring a generalised model of the structure of interest to minimise the risk and damage to structures. Disaster Management and Human Health Risk 251 doi:10.2495/DMAN090231 © 2009 WIT Press www.witpress.com, ISSN 1743-3509 (on-line) WIT Transactions on The Built Environment, Vol 110,
Transcript of Offshore disasters: wave forces on offshore and coastal ... · damage to onshore and offshore...

Offshore disasters: wave forces on offshore and coastal structures due to Tsunamis
A. R. Foroughi, W. Sleeman & R. Scott
School of Construction and Civil Engineering, Newcastle College, England, UK
Abstract
Every year natural disasters result in considerable damage to offshore structures, coastal zones and other vulnerable areas. In Tsunami disasters direct damage occurs, such as the destruction of structures and loss of life due to wave forces and the run-up Tsunami. Tsunamis are characterised as shallow water waves of long period wavelength with extreme height and force. They are often observed with wavelengths in excess of 150 Km and with periods of over 1.5 hours. Due to their large wavelength and wave force, Tsunamis propagate high wave forces and loads. This paper has three main sections. Characteristics of waves, which includes waves with a crest at the top and a trough at the bottom, wave forces and damage to offshore structures, the design of wave methodology for safer structures; Physical characteristics of Tsunamis, considering the mitigation of risk and hazard, wave force estimation, design of offshore and coastal structures to allow for Tsunamis; Managing natural disasters. This paper provides a close study and literature review on the engineering approach to the design of wave forces and reports on a proposed structural design method for Tsunami refuge building based upon a literature survey of previous theoretical and experimental research on Tsunami forces and loads to offshore and coastal structures. The paper also proposes a verification approach requiring a generalised model of the structure of interest to minimise the risk and damage to structures.
Disaster Management and Human Health Risk 251
doi:10.2495/DMAN090231
© 2009 WIT Press www.witpress.com, ISSN 1743-3509 (on-line)
WIT Transactions on The Built Environment, Vol 110,

1 Introduction
The phenomenon we call a tsunami (soo-nah-mee) is a series of waves of extremely long wave length and long period, generated in a body of water by an impulsive disturbance that displaces the water. This disturbance can be the result of a geological event such as an earthquake, a landslide or sub-marine volcanic eruption. The term tsunami was adopted for general use in 1963 by an international scientific conference. Tsunami is a Japanese word represented by two characters: “tsu” and “nami”. The character “tsu” means harbour, while the character “nami” means wave. In the past, tsunamis were often referred to as “tidal waves” by many English speaking people. Tides are the result of gravitational influence of the moon, sun, and planets. Tsunamis are not caused by the tides, nor are they related to the tides, though a tsunami striking a coastal area is influenced by the tide level at the point of impact. The vulnerability of offshore structures to tsunami is an important component of ongoing work directed at assessing the risks posed by tsunami hazards near to coastal zones. In recent years the tsunami which have generated the most devastating damage in history have affected many coastal nations along the Indian Ocean fringe, the islands of Japan and in the Pacific Ocean. Geological activity in these regions around the tectonic plate boundaries has produced not only ground shaking but also high tsunami ocean waves affecting many cities along the coasts. Since 1960 there have been three major tsunami events that have propagated across ocean basins to cause high levels of damage far from the epicentre of the geological disturbance. This includes tsunami generated from earthquakes in Indonesia. These events caused damage not only to offshore structures in the immediate vicinity of the epicentre but also resulted in major damage in locations such as Japan, Hawaii and the west coast of the USA as the tsunami travelled across the Pacific Ocean. At some stage the design of offshore structures should include study of the complex behaviour of fluid flow around a structure to provide guidance for agreed hazard definition of the effects of the tsunami wave loads on coastal and offshore structures. Review and research of the effect of forces on a structure due to fluid flow should be carried out for both horizontal and vertical tsunami wave loads, hydrostatic loads, hydrodynamic loads and wind forces generated by atmospheric flow. This paper provides a review of research and study and analysis of the existing research related to the tsunami wave loads which may cause extensive damage to onshore and offshore structures. A new approach is considered for establishing the tsunami loads and the design characteristic methodology for load equations based on the validity of tsunami wave load equations of known tsunami and for previous research. In addition this paper also discusses the mitigation of risk and hazards.
252 Disaster Management and Human Health Risk
© 2009 WIT Press www.witpress.com, ISSN 1743-3509 (on-line)
WIT Transactions on The Built Environment, Vol 110,
2 Tsunami waves: types and characteristics
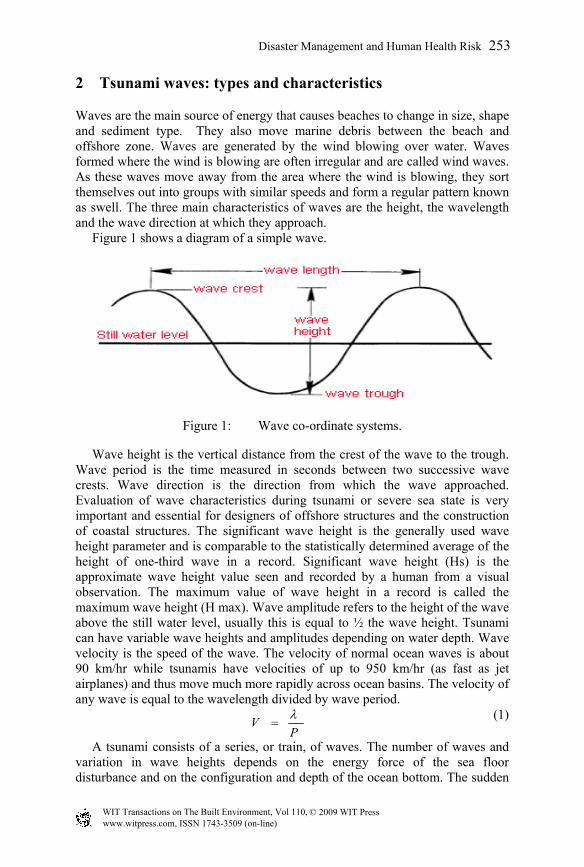
Waves are the main source of energy that causes beaches to change in size, shape and sediment type. They also move marine debris between the beach and offshore zone. Waves are generated by the wind blowing over water. Waves formed where the wind is blowing are often irregular and are called wind waves. As these waves move away from the area where the wind is blowing, they sort themselves out into groups with similar speeds and form a regular pattern known as swell. The three main characteristics of waves are the height, the wavelength and the wave direction at which they approach. Figure 1 shows a diagram of a simple wave.
Figure 1: Wave co-ordinate systems.
Wave height is the vertical distance from the crest of the wave to the trough. Wave period is the time measured in seconds between two successive wave crests. Wave direction is the direction from which the wave approached. Evaluation of wave characteristics during tsunami or severe sea state is very important and essential for designers of offshore structures and the construction of coastal structures. The significant wave height is the generally used wave height parameter and is comparable to the statistically determined average of the height of one-third wave in a record. Significant wave height (Hs) is the approximate wave height value seen and recorded by a human from a visual observation. The maximum value of wave height in a record is called the maximum wave height (H max). Wave amplitude refers to the height of the wave above the still water level, usually this is equal to ½ the wave height. Tsunami can have variable wave heights and amplitudes depending on water depth. Wave velocity is the speed of the wave. The velocity of normal ocean waves is about 90 km/hr while tsunamis have velocities of up to 950 km/hr (as fast as jet airplanes) and thus move much more rapidly across ocean basins. The velocity of any wave is equal to the wavelength divided by wave period.
PV
(1)
A tsunami consists of a series, or train, of waves. The number of waves and variation in wave heights depends on the energy force of the sea floor disturbance and on the configuration and depth of the ocean bottom. The sudden
Disaster Management and Human Health Risk 253
© 2009 WIT Press www.witpress.com, ISSN 1743-3509 (on-line)
WIT Transactions on The Built Environment, Vol 110,

causative movement creates a series of waves that travel across the open ocean almost unnoticed until they approach a shallow coastal area. On the ocean surface the waves have low height (one meter or less), a long wavelength (up to 200 km), varying wave periods (five minutes to several hours between wave crests), and a velocity of up to 60 km per hour. Tsunami characteristics (such as wave height, period and velocity) can vary due to offshore topographic irregularities. As the tsunami approaches a coastal region where the water depth decreases the waves are restricted by the shallow bottom. The wave velocity decreases to about 32 km per hour, wave height increases (up to 9 or more) and the tremendous wave energy strikes the shoreline. Waves that are generated by seismic forces are stronger and retain their height longer than waves generated by wind. The destructive power of tsunamis is due to the speed and force with which they strike a coastal area. Tsunami are characterised as shallow water waves. These are different from the waves most of us observe on the beach, which are caused by the wind blowing across the ocean’s surface. Wind generated waves usually have a period of 5-20 seconds and a wavelength of 100-200 metres. Tsunami can have periods in the range of 10 minutes to 2 hours and wavelengths over 500 Kilometre. A normal wave is characterised as a shallow water wave when the ratio of the water depth and wavelength is very small. The velocity of the shallow water wave is also equal to the square root of the product of the acceleration of gravity, g (10 m/sec²) and the depth of the water, d.
gdVs (2)
Detecting tsunami is very difficult to monitor. When a wave begins in the deep ocean waters it may only have a height of 32 cm – 52 cm and it looks like a gentle rise and fall of the sea surface. As wind passes over the water’s surface small ripples are formed. These ripples grow exponentially and form fully developed waves. This phenomenon is illustrated in the figure below. Figure 2 Regular wind generated wave. There are two main factors that cause ripples to form:
1. Pressure Effect: As wind passes over the surface of the water, small fluctuations in the wind speed cause variations in air pressure on the surface which produce Capillary waves. These pressure variations with fluctuations in velocity are best explained using Bernoulli’s Equation:
tconsZg
V
y
Ptan
2
2
(3)
From this equation it can be seen that faster moving winds produce lower pressure whereas slower moving winds produce higher pressure. Furthermore, the effects of the pressure fluctuations are magnified because as the wind moves over the crests of the wave, the velocity profile near the water surface increases and cause the pressure to decrease. Similarly, as the wind moves over the trough of the wave the velocity profile near the water surface decreases and causes the pressure to increase. These pressure effects are illustrated in the figure below (Fig. 3).
254 Disaster Management and Human Health Risk
© 2009 WIT Press www.witpress.com, ISSN 1743-3509 (on-line)
WIT Transactions on The Built Environment, Vol 110,

Figure 2: Diagram for regular wind generated waves (US Army Corps of Engineers, 1981).
Figure 3: Shear and pressure effect of wind generated waves.
2. Shear Effect: As wind passes over the surface of the water the surface is stretched which causes the surface to wrinkle. This is similar to the wrinkles that are formed by stretching a piece of plastic food wrap ‘Cling-Film’. Furthermore, the friction forces between the air and the water surface allow shear forces to develop within the water. These shear forces push the water molecules and form small hills of water which are held down by surface tension and gravity forces. These shear effects are illustrated in Fig. 3. There are three main factors that influence wave growth: wind speed, wind duration, and fetch (length over which wind blows). The effects of these factors
Disaster Management and Human Health Risk 255
© 2009 WIT Press www.witpress.com, ISSN 1743-3509 (on-line)
WIT Transactions on The Built Environment, Vol 110,

are best explained by the following main theories: Phillips (1957, 1960), Miles (1957) and wave theories. Turbulent eddies in wind fields exert a fluctuating pressure on the water surface. Pressure fluctuations very in magnitude and frequency and move forward at a range of speeds. Pressure fluctuations cause water surface undulations to develop and grow. The key to their growth is that a resonant interaction occurs between forward moving pressure fluctuations and free waves that propagate at the same speed as the pressure fluctuations. As wind blows over a forward moving wave, a complex air flow pattern develops over the wave. This involves a secondary air circulation that is set up around an axis that is parallel to the wave crest by the wind velocity profile acting over a moving wave surface profile. Below a point on the velocity profile where the wind velocity equals the wave celerity air flow is reversed relative to the forward moving wave profile. Above this point, air flow is in the direction of the wave motion. This results in a relative flow circulation in a vertical plane above the wave surface that causes a pressure distribution on the surface that is out of phase with the surface displacement. The result is a momentum transfer to the wave that selectively amplifies the steeper waves. There are many other theories that attempt to explain how waves grow but the one that is most logical says that the ripples on the water’s surface create more friction which allows for more energy to be transferred from the wind to the waves. The wind energy is then continually transferred to the waves causing the ripples to increase in size (height and period). As wind energy is transferred to the water there comes a point where the water waves reach their maximum wave height and there is no more growth. These waves can either be fully developed or non-fully developed (fetch limited or duration limited). These maximum wave growths are defined as follows: Fully Developed: The wind energy is continually transferred to the waves until it is balanced with the friction and gravity forces acting on the water molecules. Fetch Limited: The distance over which the wind is blowing is not enough to allow for full development of the waves. Duration Limited: The wind has not been in contact with the water surface long enough to allow for full development of the waves.
2.1 Breaking waves
Waves break as they encounter shallow water because the “bottom” portion of the wave hits either the near shore shelf or reef while the “top” portion of the wave continues to move forward and ultimately steepens and falls over. The condition for wave breaking is when a wave reaches the shore and enters water that is approximately 1.3 times as deep as the wave is high. At this depth the wave becomes unstable and the crest is thrown forward into what we observe as white water and turbulence. The reason a wave breaks is that the wave becomes overly steep particularly at the peak of its crest. This over steepening is due to the water particles in the wave crest exceeding the velocity of the wave form. In this situation the crest surges ahead, resulting in the breaking wave.
256 Disaster Management and Human Health Risk
© 2009 WIT Press www.witpress.com, ISSN 1743-3509 (on-line)
WIT Transactions on The Built Environment, Vol 110,

2.2 Types of breaking waves
1. Spilling Breakers - Very flat nearly horizontal beach 2. Plunging Breakers - Steep beach 3. Surging Breakers - Very steep beach
Spilling breakers are waves that gradually peak until the crest becomes unstable and cascades down in bubble and foam known to most as “white water”. Plunging breakers describes a wave where the wave face becomes vertical and then curls over plunging forward and downward as an intact mass of water (such waves are generally observed on the Hawaiian and California coasts). Surging breakers look like they are going to plunge but then the base of the wave runs up the beach face resulting in the collapse and disappearance of the crest. Surf Zone - near shore area in which bore-like waves occur following wave breaking. This portion of the near shore extends from the inner breakers shoreward to the swash zone. Swash Zone - near shore area of the beach face that is intermittently covered by run-up of the wave swash and then exposed by the backwash. Incident Wave - Waves approaching the shoreline at angles rather than perpendicular to the shoreline.
2.3 Wave data analysis
Wave data analysis through either: Statistical Analysis (Zero Crossing Analysis) Spectral Analysis
Statistical analysis provides basic information on the wave climate such as maximum wave height of the record, average wave height and root mean-square wave height. A generally accepted method applied to extract representative statistics from raw wave data is the zero crossing method. According to this method waves are defined as the portion of a record between two successive zeros up crossings. For each recorded burst of wave data the waves are ranked by height (with their corresponding periods) and the following statistics computed: H10 Average height of the waves, which comprise the top 10% of the recorded heights. Maximum Wave Height (Hmax) - Maximum wave height for a given interval of time (typically 17 or 20 minutes). Mean wave height (Hmean) Mean Period or Zero crossing period (Tz) Root Mean Square Wave Height (Hrms) Significant Wave Height (Hsig) - Average of the height test one third of the waves measured over a given interval of time. It has been shown that significant wave height corresponds to a visual estimate of waves in that the observer tends to place more emphasis on larger waves. This statistical measurement gained usage based on the impression that in many applications the larger waves are more “significant” than smaller waves and thus the significant wave height is more representative than the average wave height.
Disaster Management and Human Health Risk 257
© 2009 WIT Press www.witpress.com, ISSN 1743-3509 (on-line)
WIT Transactions on The Built Environment, Vol 110,

Significant Wave Period (Tsig) - Average period of the highest one-third of the waves determined from large, well defined groups of waves. Wave analysis by the zero crossing method has limitations, one of which is that the wave period is poorly defined. For example analysis of a swell with a dominant period of 10 seconds will show a reduction in Tz if locally generated sea is superimposed. Structure and beach response may be strongly dependent on wave period. In these cases an analysis which accounts for all components of wave period, such as spectral analysis, should be used. Spectral Analysis, also referred to harmonic analysis, provides a tool capable of generating information on the complicated mixture of waves produced by different storms. Spectral analysis is based on the mathematics of Fourier. Spectral analysis better describes the complete distributions of wave energies and periods than statistical analysis. Spectral analysis works backward from the complexity of a wave climate to determine the simple components that combine to produce complex wave signals. Another simplified way to describe spectral analysis is that it provides a method to examine the energy level of a range of wave periods. Spectral analysis makes it possible to determine the period of the waves with the most energy. This statistic yields a more representative wave period for ocean waves than what the zero crossing method can provide. Directional Wave Spectrum provides the most complete description of a wave climate. This type of analysis provides direction of wave approach as well as the wave energy at a specific period or frequency. The approach angle of waves is instrumental in the generation of current and transport.
2.4 Types of tsunami
Tsunamis are impulse generated water waves, that is, waves resulting from any short duration disturbance of a body of water, such as the “bumping” effect of an earthquake. Their name is taken from a Japanese word meaning “harbour wave”. Closely related waves are generated by the operation of gates controlling flows through water management infrastructure such as hydropower canals, flood control scheme and irrigation schemes. This provides an opportunity to study tsunami behaviour under controlled conditions. Hydropower canals are particularly suitable for experimentation as sudden gate adjustments are a routine part of their operation, and the resulting waves are comparable in size to full scale ocean tsunamis. The following notes rely heavily on extensive observations of the propagation of controlled tsunamis approximately 1m high through a large canal over 10m deep and 25 km long. Three types of tsunami are well known:
1. Immediate waves This type of tsunami wave is generated locally by sudden lateral movements of walls. The water is pushed out of the way as illustrated in Fig. 4 and initially has nowhere to go but upwards. This temporary hump then collapses outwards in both directions forming an almost instant response to the ground movement. Type 1 (immediate) waves may climb very high although the water volume involved is not large.
258 Disaster Management and Human Health Risk
© 2009 WIT Press www.witpress.com, ISSN 1743-3509 (on-line)
WIT Transactions on The Built Environment, Vol 110,

Figure 4: Immediate waves.
Alternatively there may be a “pull” effect if a steep wall is dragged away from the water, but in this case the water will detach from the wall if the wall movement is sufficiently violent. Figure 4 shows the immediate tsunami wave type.
2. Seismic seiches
These are generated by variations in the local vertical ground displacement (tilting effects). The Type 2 wave is called a seiche because the response of the water body is dependent on its resonance properties and will take the form of waves recurring at time intervals determined by the various natural frequencies. This type includes propagating waves generated by the collapse of Immediate Waves, but these tend to be minor compared with the effects of seismic tilting. Only in partly enclosed water bodies such as harbours or estuaries is a distinction important between Type 2 waves and Type 3 waves (classical tsunamis) because Type 2 waves are generated internally while Type 3 waves form in response to external forcing from the open sea. Figure 5 illustrates the Seismic types of tsunami waves.
2.4.1 Classical tsunamis These types of waves are open sea waves resulting from the action of gravity following the initiating short duration disturbance (or “bump”) with particular emphasis on the interaction between these waves and coastlines. If seabed displacement results from an earthquake, volcanic action or submarine landslide the response will be as shown in Fig. 6. An original wave is generated with a surface form approximating the seabed displacement. On an
Disaster Management and Human Health Risk 259
© 2009 WIT Press www.witpress.com, ISSN 1743-3509 (on-line)
WIT Transactions on The Built Environment, Vol 110,

Figure 5: Seismic seiche wave.
uplifted side a positive wave (or “hump”) will form, so under gravity the water will start to fall outwards down each side (solid double-ended arrow). On a downthrust side a negative wave (or “hole”) will form, so under gravity the water will start to fall inwards down each side (solid arrows). The water falling away from the hump piles up to create a fresh hump alongside to the right in the diagram and similarly water falling towards the hole creates a fresh hole alongside to the left in the diagram, so the collapse of this original surface form under gravity sets off wave disturbances travelling in opposite directions (dotted arrows). In deep water the response is very fast, which is why the waves move so fast, but notice that the water itself is not moving fast – only the “humps” and “holes” passing through the water. Figure 6 illustrates the Classical tsunami waves. At a coast on a downthrust side (the coast to the left in the figure) a “hole” will arrive first so the sea will withdraw before rushing in again. However the opposite will happen at a coast on the upthrust side (the coast to the right in the diagram) where a “hump” will arrive first and the sea will rush in without any warning signs of initial withdrawal. An explosion of volcanic origin, a nuclear bomb blast or a meteorite strike will also displace the water surface and generate Type 3 waves but the character of these waves will depend on the precise surface displacement pattern initially generated in this case. For this reason it may be very difficult to forecast the positive and negative wave response to such events
260 Disaster Management and Human Health Risk
© 2009 WIT Press www.witpress.com, ISSN 1743-3509 (on-line)
WIT Transactions on The Built Environment, Vol 110,

and again there can be no guarantee of a warning withdrawal before the sea rushes in towards the coast. Evolving wave patterns derive from the interaction between the displacement event (which may be remote), the propagation characteristics of the intervening water bodies and reflections from other coastlines and undersea features. Initially the average wave height will decrease as the energy radiates outwards from the source, but in the Pacific Ocean it is possible for these waves to pass halfway round the globe, after which this outward radiation reverses. In deep water even the higher waves will be difficult to detect because the slopes of the sides of the wave will still be almost flat. In shallower water the waves will steepen at the front, but rarely enough to break, so they are still hard to detect visually. Even if they do break tsunamis will not topple over from the crest as wind generated waves do but will break from the bottom upwards, more like violently broken surges seen at the bottom of a dam spillway or similar steep channel. Tsunamis may gain height in shallow water because they slow down, causing the water behind to pile up. Passing over a shallow bed also causes friction which tends to reduce the wave height, so any gain or loss of height depends on the balance between the slowing effect and the friction effect. However if the wave channel is tapering horizontally, narrowing towards the shore, a gain in wave height may be rapid. This behaviour can be compared with the lash of a whip in which the wave energy produces increasingly violent displacement as the wave progresses from the thick part of the whip to the narrow whiplash.
Figure 6: Classical tsunami waves.
Disaster Management and Human Health Risk 261
© 2009 WIT Press www.witpress.com, ISSN 1743-3509 (on-line)
WIT Transactions on The Built Environment, Vol 110,

Where tsunamis reach a coastline the resonance properties of harbours and inlets further complicate local responses. This can be compared with the slopping of water in a household basin, which will grow rapidly in violence if the basin is pushed rhythmically in time with successive returns of the wave Because tsunamis come from different source positions they will have interacted with different coastlines and undersea features on their approach, so will have different intervals between upwards and downwards movements. This is why a small tsunami which pushes a harbour in time with the “slop” period may produce a greater harbour wave inside than a large tsunami which forces the harbour to respond at some other period. Figure 7 shows this “slop” effect for the case where the side of the basin is a steep wall high enough to contain the highest wave. This wall may be the natural coast or an artificial stopbank the effect is to double the height of the approaching wave as it is reflected back. This explains why the height of a wave measured on a building wall blocking a wave may be considerably above the wave height measured on a wall running parallel with the wave direction. Accordingly a stopbank should be designed to be high enough to contain the wave reflection as well as the approaching wave. Where the tsunami slop overruns the coastal defences, the situation becomes that shown in Fig. 7. A steep-fronted broken surge known as a “bore” then penetrates inland at high speed. The damage-causing potential of such a bore and the hazard to humans can be estimated quite accurately for any height of approaching tsunami and defensive wall. This analysis shows that construction of coastal stopbank defences will reduce the scale of the disaster even if a tsunami proves to be more extreme than anticipated.
2.5 Tsunami wave loads
Design and calculation of tsunami wave loads requires information about expected wave heights, which for this purpose will be limited by water depth at
Figure 7: Classical tsunami waves type (coast overrun).
262 Disaster Management and Human Health Risk
© 2009 WIT Press www.witpress.com, ISSN 1743-3509 (on-line)
WIT Transactions on The Built Environment, Vol 110,

the site of interest. The designers use the wave height analysis model data to calculate tsunami wave loads. Tsunami wave forces can be classified into four categories: 1. Those from non-breaking waves (these forces can usually be computed as
hydrostatics forces against walls and hydrodynamic forces against piles). 2. Those from breaking waves (these forces will be of short duration, but
large magnitude). 3. Those from broken waves (these are similar to hydrodynamic forces
caused by flowing or surging water). 4. Uplift forces (these forces are often caused by wave run-up, deflection, or
peaking against under side of horizontal surfaces). 5. The forces from breaking waves are the highest and produce the most
severe loads. Therefore the offshore engineering designer recommends that the breaking wave load be used as the design wave load.
2.5.1 Breaking wave loads on vertical piles and vertical walls
We assumed that the breaking wave load on a pile can happen at the still water level and is calculated by the following equation:
2
2bdb DHC
F
(4)
where: F = drag force acting at the Stillwater level Cdb = breaking wave drag coefficient (recommended values are 2.25 for
square or rectangular piles and 1.75 for round piles) γ = specific weight of water D = Piles diameter and Hb = breaking wave height
2.5.2 Breaking wave loads on vertical walls Breaking wave loads on vertical walls are best calculated according to the procedure outlined in Criteria for Evaluating Coastal Flood-Protection Structures (Walton, et. al 1989). This procedure is suitable for use in wave conditions typical during coastal flood and storm events. The relationship developed for breaking wave load per unit length of wall is shown in following equations: Case 1. Assuming enclosed dry space behind wall therefore,
f brkw = 1.1 Cp γd²s + 2.41γd²s (5) Case 2. If equal Stillwater level on both sides of wall,
f brkw = 1.1 Cp γd²s + 1.91γd²s (6)
where: fbrkw is total breaking wave load per unit length of wall acting at the Stillwater level.
Disaster Management and Human Health Risk 263
© 2009 WIT Press www.witpress.com, ISSN 1743-3509 (on-line)
WIT Transactions on The Built Environment, Vol 110,

Fbrkw is total breaking wave load acting at Stillwater level = fbrkw W is width of wall in meter. Cp is dynamic pressure coefficient. Dynamic coefficient is function of probabilities and is varies for different types of structures. Cp = 1.6 for accessory structure, low hazard to human life or property in the event of failure and Cp = 2.8 for coastal residential building and finally Cp = 3.2 for high occupancy building or critical facility. γ is the specific weight of water. ds is the design still water wave height. The procedure assumes that the vertical wall causes a reflected or standing wave to form against the seaward side of the wall and that the crest of the wave reaches a height of 1.2ds above the Stillwater elevation. The resulting dynamic, static and total pressure distributions against the wall and the resulting loads are as shown in Fig. 8 This procedure allows us to analysis two cases: (1) where a wave breaks against a vertical wall of an enclosed dry space and (2) where the Stillwater level on both sides of the wall is equal. Case 1 is equivalent to a situation where a wave breaks against an enclosure in which there is no wave pressure below the Stillwater level; Case 2 is equivalent to a situation in which a wave breaks against a breakaway wall or a wall equipped with openings that allow water pressure to be equalized on both sides of the wall. In both cases waves are normally incident (i.e., wave crests parallel to the wall). If breaking waves are obliquely incident (i.e., wave crests would not be parallel to the wall), therefore the calculated loads would be lower.
Figure 8: Dynamic, static and total load distributions against a wall.
264 Disaster Management and Human Health Risk
© 2009 WIT Press www.witpress.com, ISSN 1743-3509 (on-line)
WIT Transactions on The Built Environment, Vol 110,

It is important to note that the wave pressures are much higher than typical wind pressures that act on offshore structures, even wind pressures that occur during a hurricane or typhoon. However the duration of the wave pressures and loads is brief; peak pressures probably occur within 0.1 to 0.3 second after the wave breaks against the wall (see [19] for a detailed discussion on breaking wave pressures and durations). Tsunami damage inspections show that breaking wave loads have destroyed virtually all wood-frame or unreinforced masonry walls below the wave crest elevation-only highly engineered, massive structural elements are capable of withstanding breaking wave loads.
2.5.3 Tsunami forces on a group of vertical piles This paper and presentation describes the theoretical study of the total Tsunami wave forces acting on a group of eight cylindrical vertical piles using the linear wave theory. It considered all piles are struck by the waves at the same instant ”t” for a given angle of wave incidence “a” as shown in Fig. 9. The maximum horizontal force is found by examining this case for a given range of time and angles of incidence. In order to carry out this investigation the pile distance “z” was calculated for various angles of “a”. For this purpose software was developed. A regular wave of height H is assumed to propagate in the x-direction and interact with an 8 legged structure. The vertical centreline of the structure is located on the y-axis and y = 0 planes represent the mean free surface. The undisturbed incident wave is represented by the linear wave theory. The fluid is assumed incompressible and the flow irrigational in the region bounded by the free, the bottom and the cylindrical surfaces. The undisturbed incident wave is represented by linear wave theory and accordingly, the surface elevation is described by:
cos20
H (7)
The velocity potential representing the wave/structure interaction is time dependent as like e-iσt and therefore, may be expressed in the form, Re[ø(x,y,z) e-
iσt], where Re denotes the real part. Furthermore, the complex potential ø may be expressed as the sum of ø = ø1+ ød, where ø1 denotes the potential associated with the scattered waves caused by the structure (Boreel [4]). Again we assume that the superstructure consists of eight vertical piles with of 2m diameter. The Tsunami forces acting on the piles and structures were dealt with using the Morison’s equation on the basis of wave kinematics. To determine the flow field encountered by the eight piles, it is necessary to begin with the expression for velocity. For example the horizontal component of velocity resulting from the wave interaction of the incident Tsunami wave force is obtained by differentiating the total velocity potential with respect to x (based on the linear theory).
cos
cosh
cosh
2,,,
kd
dykkgHtzyx R e
(8)
Using the resulting values of velocity and acceleration in the Morison’s equation to calculate the loads on the piles the horizontal forces and overturning
Disaster Management and Human Health Risk 265
© 2009 WIT Press www.witpress.com, ISSN 1743-3509 (on-line)
WIT Transactions on The Built Environment, Vol 110,

moment about a point on the centre of the structure on the mud line associated with eight vertical piles was evaluated from the Morison’s equation, respectively, (Boreel [4]) as:
(9)
dytzyxtzyxyDCdytzyxyDCtF DId
),,,(),,,()(2
8),,,()(
4
8)( 2
(10) where D(y) denotes the y dependent diameter of the piles and integration is carried out in the y-direction and from the bottom to the free surface. For the purpose of evaluating equations above for the present structure the drag and inertia coefficients were taken as CD =1.0 and C1=2.0. To discuss this theory further we can investigate a group of eight vertical piles each of 2 m diameter situated in water of 200 m depth subject to Tsunami waves of 30.3 m in height, 543.4 m in length and 18.5 sec. period. A plane view of the structure is shown in Fig. 9. The piles were 16 m and 12 m distance apart along the x and y axis respectively. Now we can compute the total wave force exerted on the system and find its maximum value by examining the case for seven different values of “a”, i.e. 0, 15, 30, 45, 60, 75, and 90 degrees.
Figure 9: Definition sketch.
dytzyxtzyxydyCdytzyxydyDCtM DI ),,,(),,,())((2
8),,,()()(
4
8)( 2
266 Disaster Management and Human Health Risk
© 2009 WIT Press www.witpress.com, ISSN 1743-3509 (on-line)
WIT Transactions on The Built Environment, Vol 110,

Table 1: Variation of force with angle of wave incidence.
Angle “a” (degrees) Maximum Tsunami Force (KN) 0 18915
15 18930 30 18650 45 18320 60 18.085 75 17880 90 17790
0 15
30
45
60
7590
17600
17800
18000
18200
18400
18600
18800
19000
19200
0 20 40 60 80 100
Max
imum
For
ce (
KN
)
Angle
Figure 10: Maximum wave forces and variation of wave incident.
To calculate and determine the total forces a computer programme is used for accurate results. In order to carry out this investigation the pile distances z have to be calculated first for various angles “a” and then entered as input-data values. For this purpose computer software was developed. This software computes the distances for any angles respectively. The final results are given in Table 1. The above results are plotted in Fig. 10 and show that the maximum force occurs somewhere between 0 and 20 degrees of the angle of incidence. In general the force in the y direction for pile No. 1 is 0, due to symmetry of the geometry of the three legged structure about the x-axis. The force on a single pile in the y direction is 0. The forces are generally small except at large z values and at particularly large “a” values. The four pile configuration is such that their centre makes a square. The square is laid in two different ways with respect to the wave direction, i.e. in one case the centre line made a right angle to the incident wave direction. The forces on the two piles are again the same because of symmetry. The x and y direction forces on pile 2 and 7 are the same. A large number of computer runs are required to describe the maximum forces accurately because of their oscillating nature. However, since the pile
Disaster Management and Human Health Risk 267
© 2009 WIT Press www.witpress.com, ISSN 1743-3509 (on-line)
WIT Transactions on The Built Environment, Vol 110,

spacing is large the effects of the neighbouring piles on the forces will generally become small.
2.6 Managing natural disasters: mitigation of risks and hazards
Within the last century there were over 125 destructive Tsunami which resulted in over 95,000 deaths. Despite the fact that Tsunami warning systems have been in place in the Pacific Ocean and the Indian Ocean basin since 1950 deaths still result from Tsunami, especially when the source of the earthquake is so close to a coast that there is little time for a warning, or when people do not heed the warning, or follow instructions associated with the warning. These factors point out the inadequacy of not having a Tsunami warning system in place in the Indian Ocean where in one event the death toll from Tsunami was increased by a factor of 8 over all previous events. For areas located at great distances from earthquakes that could potentially generate a tsunami there is usually plenty of time for warnings to be sent and coastal areas evacuated even though tsunami travel at high velocities across the oceans. Hawaii is a good example of an area located far from most of the sources of tsunami where early warning is possible and has saved lives. For earthquakes occurring anywhere on the subduction margins of the Pacific Ocean there is a minimum of 3 hours of warning before a tsunami would strike any of the Hawaiian Islands. In order to be able to issue warnings about tsunami generated within 70 to 850 km of an earthquake several regional warning centres have been set up in areas prone to tsunami generating earthquakes. These include centres in Japan, Kamchatka, Alaska, Hawaii, French Polynesia and Chile. For effective monitoring and early warning about coastal zone natural hazards there is an integrated monitoring system. This system incorporates the latest technologies of meteorological instruments coupled with suitable networking mechanisms and dissemination systems. It is imperative for coastal zone management that the integrated observations both from land and sea should be evaluated. The monitoring of sea state and other parameters is a complex, logistically difficult and expensive proposition. Sea platforms like data buoys, instruments on board ships, etc. need to be deployed supplemented with merchant navy ships. Recent development of polar orbit satellites has complemented inaccessible data sets. However standardization and calibration of weather parameters yet remains a problem. Integrated management strategies to ensure safety against natural hazards such as high waves, storm surges and Tsunamis have to be evolved and made operational. In urban coastal zones the vulnerability of support systems like waste management facilities, water supply and roads need to be taken into account. Disaster prevention facilities along the coast may have to be strengthened keeping in view present and potential (including those due to climate change) damage threats. Increased water table due to sea-level rise may weaken coastal structures and predispose them to other natural hazards like earthquakes and storm related damage.
268 Disaster Management and Human Health Risk
© 2009 WIT Press www.witpress.com, ISSN 1743-3509 (on-line)
WIT Transactions on The Built Environment, Vol 110,

2.7 Conclusion and future recommendations
The purposes of this paper and study can be summarised as: a. An extensive review and research of existing literature and methods of
handling Tsunami forces is conducted and discussed. b. Discussion and load determinations for Tsunami forces on offshore
structures based on the result of the Tsunami’s design load for offshore structures is determined.
c. A discussion of the design equations for Tsunami forces is conducted base on past research as well as design methods and data obtained by this research. The validity of the equations for Tsunami forces was discussed for design purposes.
d. As mentioned and studied in this paper the maximum force accrued on the group of piles is when the angle of wave incident is 0˚ and 20˚. Therefore the balance approach between both the wave direction and the angle of wave incident is necessary in planning and designing the offshore structures subject to Tsunami wave forces in order to obtain good results.
e. In this paper we examine the process of risk reduction and summarise the significant issues as:
Evolving efficient monitoring and surveillance system, Evolving accurate early warning system, Putting in place an efficient warning dissemination system, Evolving pre-disaster hazard, vulnerability and risk assessment
inventories, Evolving an efficient post-disaster management and mitigation
strategy, Public awareness.
References
[1] Annual Review of Natural Disasters 1999 (supplementary data and analysis provided by Munich Reinsurance Group/Geosciences Research Group, MRNatCatSERVICE). Munich Germany PP46, 1999.
[2] Barnett, A.G., S. Beanland and R.G. Tylor, Tsunami and Seiche Computation for Wellington Harbour. Proc. Pacific Conf. on Earthquake Engineering, Auckland 1991.
[3] Berbbia, C.A., Walker, S. and Kevanagh, M. Wave Oscillation Problems in Deep and Shallow Water. Proc. Intstn. Conf. on Offshore Structures, Rio de Janeiro, VFRJ Sep. 1977.
[4] Boreel, L.J. Wave Action on Large Offshore Structures. Proc. Conf. on Coastal Engin. ICE London 1974.
[5] Berbbia, C.A., Walker, S. and Kevanagh, M. Wave Oscillation Problems in Deep and Shallow Water. Proc. Intstn. Conf. on Offshore Structures, Rio de Janeiro, VFRJ Sep. 1977.
[6] Bundgaard, H.I.R. Warren and A.G. Barnett, Modelling of Tsunami Generation and Run-up. Science of Tsunami Hazards, Vol.9 No.1, 1991, PP23-29.
Disaster Management and Human Health Risk 269
© 2009 WIT Press www.witpress.com, ISSN 1743-3509 (on-line)
WIT Transactions on The Built Environment, Vol 110,

[7] Chakrabarti, S.K., Wolbert, A.L. and Tan, W.A. Wave Forces on Vertical Circular Cylinder. Proc. ASCE Waterways, Harbours and Coastal Engin. Div., 102, May 1976.
[8] Chakrabarti, S.K., Wolbert, A.L. and Tan, Wave forces on a Randomly Oriented Tube. OTC-2190, Proc Offsh. Tech. Conf. Houston U.S.A. 1975.
[9] Chakrabarti, S.K. and Naftzger, R.A. Non Linear Wave Forces on Half Cylinder and Hemisphere. Proc. ASCE (Waterways, Harbour and Coastal Engin. Div.), 100 WW3, Aug. 1974.
[10] Dean, R.G., and Dalrymple, R.A. Water Wave Mechanics for Engineers and Scientist. Princes Hall, New Jersey, 1984.
[11] Foroughi, A.R. Uncertainties and Error in Wave Faeces Computation for Offshore Structures. The First Int. Conf. of Marine Structures, Tehran, May 1990.
[12] Ikeno, M. and Tanaka H.: Experimental study on Impulse Force of Drift Body and Tsunami Running up to Land, Proceedings of Costal Engineering, JSCE, Vol.50,2003.
[13] Japan Society of Civil Engineers, Committee of Nuclear Power Facilities: Tsunami Assessment Technology for Nuclear Power Facilities, 2002.
[14] National Oceanic and Atmospheric Administration; Tsunami, The Great Waves, 1994.
[15] Peiris, N. Vulnerability Functions for Tsunami loss estimation. First European Conference on Earthquake Engineering and Seismology, Geneva, Switzerland, 2006.
[16] Peiris, N. and Pomonis, December 26, 2004 Indian Ocean Tsunami: Vulnerability Functions for Loss Estimation in Sri Lanka. In: Chu, J., Phoon, K.K. and Young, K.Y. (eds.) International Conference on Geotechnical Engineering for Disaster Mitigation and Rehabilitation, 2006.
[17] U.S. Army Corps of Engineers. Shore protection Manual. Costal Engineering research Centre, Waterways Experiment Station, D.C.: U.S. Government Printing Office. 2 Vols 1984.
[18] NOAA Wavewach. National Oceanic and Atmospheric Administration. http://polar.wwb.noaa.gov/waves.
[19] ASCE 1995. Wave Forces on Inclined and Vertical Wall Surfaces.
270 Disaster Management and Human Health Risk
© 2009 WIT Press www.witpress.com, ISSN 1743-3509 (on-line)
WIT Transactions on The Built Environment, Vol 110,