
Offshore book 2014
110
-
Upload
morten-holmager -
Category
Technology
-
view
50 -
download
6
Transcript of Offshore book 2014

The copyright of OffshoreBook Oil & Gas rests with Offshoreenergy.dk. All rights reserved.
The information contained herein is the property of Offshore energy.dk and is supplied without liability for errors or omissions. No part of the text or illustra-tions may be reproduced or used except as author-ised by contract or other written permission.
OffshoreBook Oil & Gas, 3rd edition May 2014Editor: Morten Holmager [email protected] staff: Søren Dybdahl [email protected] production: Farmer & Co. Communication
Publisher:
Dokvej 36700 EsbjergDenmarkwww.offshoreenergy.dk
1O F F S H O R E B O O K 2 0 1 4
An overview of the North Sea offshore industry
OffshoreBook Oil & Gas serves as an introduction to the offshore oil and gas industry. Through a number of easy to read and clear chapters, the industry is presented at a basic level, suitable for everybody.
The target group is new employees, students and employees in need for an overview or insight into specialities different from their own. OffshoreBook Oil & Gas is mainly focused on Danish and North Sea conditions but is also suitable for offshore industries based elsewhere.
OffshoreBook Oil & Gas is 3rd edition of the OffshoreBook edited by the Danish knowledge center and innovation network Offshoreenergy.dk in collaboration with external editors. Offshoreenergy.dk wishes to thank all members who have contributed to the book and especially those who have helped in the editing work including, but not limited to: Ramboll Oil & Gas, DONG Energy, Wintershall, Semco Maritime, MacArtney, SubC Partner, ABB, GEUS, the Danish Energy Authority, Aalborg University Esbjerg, the University of Southern Denmark and the technical school in Esbjerg - EUC Vest.
This 3rd edition of OffshoreBook is funded by Offshoreenergy.dk with support from the Ministry of Higher Education and Science.

3O F F S H O R E B O O K 2 0 1 4
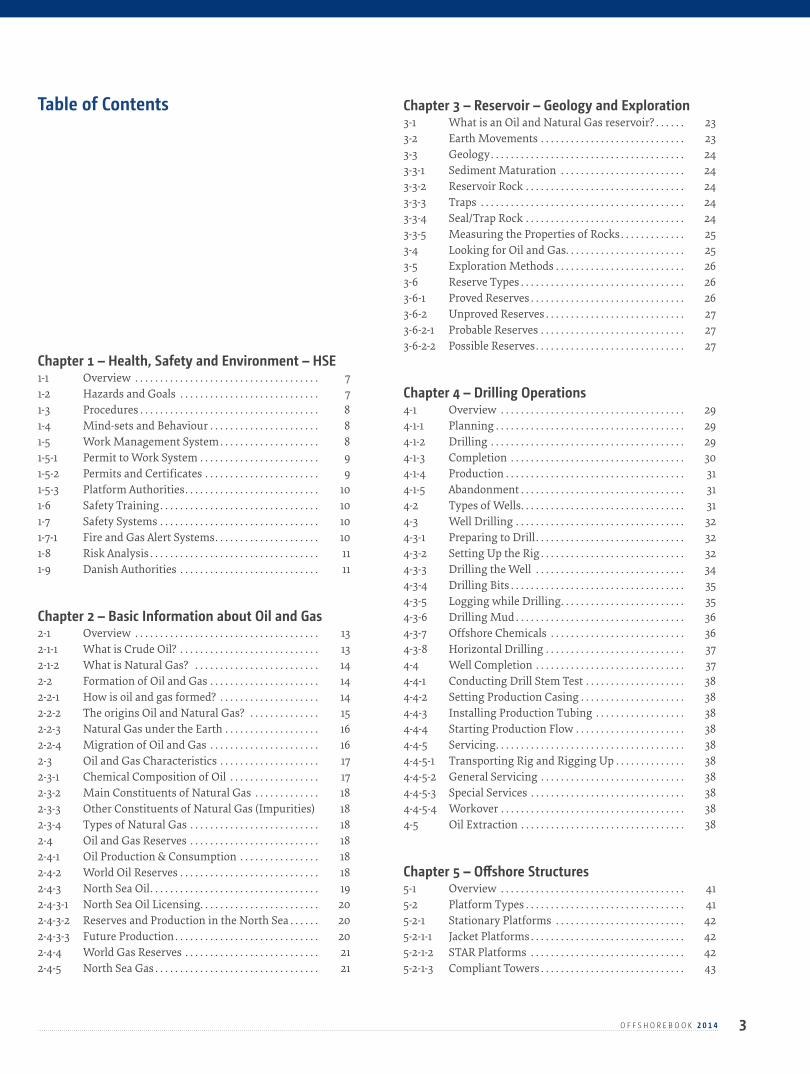
Table of Contents
Chapter 1 – Health, Safety and Environment – HSE1-1 Overview . . . . . . . . . . . . . . . . . . . . . . . . . . . . . . . . . . . . . 71-2 Hazards and Goals . . . . . . . . . . . . . . . . . . . . . . . . . . . . 71-3 Procedures . . . . . . . . . . . . . . . . . . . . . . . . . . . . . . . . . . . . 81-4 Mind-sets and Behaviour . . . . . . . . . . . . . . . . . . . . . . 81-5 Work Management System . . . . . . . . . . . . . . . . . . . . 81-5-1 Permit to Work System . . . . . . . . . . . . . . . . . . . . . . . . 91-5-2 Permits and Certificates . . . . . . . . . . . . . . . . . . . . . . . 91-5-3 Platform Authorities. . . . . . . . . . . . . . . . . . . . . . . . . . . 101-6 Safety Training. . . . . . . . . . . . . . . . . . . . . . . . . . . . . . . . 101-7 Safety Systems . . . . . . . . . . . . . . . . . . . . . . . . . . . . . . . . 101-7-1 Fire and Gas Alert Systems. . . . . . . . . . . . . . . . . . . . . 101-8 Risk Analysis . . . . . . . . . . . . . . . . . . . . . . . . . . . . . . . . . . 111-9 Danish Authorities . . . . . . . . . . . . . . . . . . . . . . . . . . . . 11
Chapter 2 – Basic Information about Oil and Gas2-1 Overview . . . . . . . . . . . . . . . . . . . . . . . . . . . . . . . . . . . . . 132-1-1 What is Crude Oil? . . . . . . . . . . . . . . . . . . . . . . . . . . . . 132-1-2 What is Natural Gas? . . . . . . . . . . . . . . . . . . . . . . . . . 142-2 Formation of Oil and Gas . . . . . . . . . . . . . . . . . . . . . . 142-2-1 How is oil and gas formed? . . . . . . . . . . . . . . . . . . . . 142-2-2 The origins Oil and Natural Gas? . . . . . . . . . . . . . . 152-2-3 Natural Gas under the Earth . . . . . . . . . . . . . . . . . . . 162-2-4 Migration of Oil and Gas . . . . . . . . . . . . . . . . . . . . . . 162-3 Oil and Gas Characteristics . . . . . . . . . . . . . . . . . . . . 172-3-1 Chemical Composition of Oil . . . . . . . . . . . . . . . . . . 172-3-2 Main Constituents of Natural Gas . . . . . . . . . . . . . 182-3-3 Other Constituents of Natural Gas (Impurities) 182-3-4 Types of Natural Gas . . . . . . . . . . . . . . . . . . . . . . . . . . 182-4 Oil and Gas Reserves . . . . . . . . . . . . . . . . . . . . . . . . . . 182-4-1 Oil Production & Consumption . . . . . . . . . . . . . . . . 182-4-2 World Oil Reserves . . . . . . . . . . . . . . . . . . . . . . . . . . . . 182-4-3 North Sea Oil. . . . . . . . . . . . . . . . . . . . . . . . . . . . . . . . . . 192-4-3-1 North Sea Oil Licensing. . . . . . . . . . . . . . . . . . . . . . . . 202-4-3-2 Reserves and Production in the North Sea . . . . . . 202-4-3-3 Future Production . . . . . . . . . . . . . . . . . . . . . . . . . . . . . 202-4-4 World Gas Reserves . . . . . . . . . . . . . . . . . . . . . . . . . . . 212-4-5 North Sea Gas . . . . . . . . . . . . . . . . . . . . . . . . . . . . . . . . . 21
Chapter 3 – Reservoir – Geology and Exploration3-1 What is an Oil and Natural Gas reservoir? . . . . . . 233-2 Earth Movements . . . . . . . . . . . . . . . . . . . . . . . . . . . . . 233-3 Geology. . . . . . . . . . . . . . . . . . . . . . . . . . . . . . . . . . . . . . . 243-3-1 Sediment Maturation . . . . . . . . . . . . . . . . . . . . . . . . . 243-3-2 Reservoir Rock . . . . . . . . . . . . . . . . . . . . . . . . . . . . . . . . 243-3-3 Traps . . . . . . . . . . . . . . . . . . . . . . . . . . . . . . . . . . . . . . . . . 243-3-4 Seal/Trap Rock . . . . . . . . . . . . . . . . . . . . . . . . . . . . . . . . 243-3-5 Measuring the Properties of Rocks . . . . . . . . . . . . . 253-4 Looking for Oil and Gas. . . . . . . . . . . . . . . . . . . . . . . . 253-5 Exploration Methods . . . . . . . . . . . . . . . . . . . . . . . . . . 263-6 Reserve Types . . . . . . . . . . . . . . . . . . . . . . . . . . . . . . . . . 263-6-1 Proved Reserves . . . . . . . . . . . . . . . . . . . . . . . . . . . . . . . 263-6-2 Unproved Reserves . . . . . . . . . . . . . . . . . . . . . . . . . . . . 273-6-2-1 Probable Reserves . . . . . . . . . . . . . . . . . . . . . . . . . . . . . 273-6-2-2 Possible Reserves. . . . . . . . . . . . . . . . . . . . . . . . . . . . . . 27
Chapter 4 – Drilling Operations4-1 Overview . . . . . . . . . . . . . . . . . . . . . . . . . . . . . . . . . . . . . 294-1-1 Planning . . . . . . . . . . . . . . . . . . . . . . . . . . . . . . . . . . . . . . 294-1-2 Drilling . . . . . . . . . . . . . . . . . . . . . . . . . . . . . . . . . . . . . . . 294-1-3 Completion . . . . . . . . . . . . . . . . . . . . . . . . . . . . . . . . . . . 304-1-4 Production . . . . . . . . . . . . . . . . . . . . . . . . . . . . . . . . . . . . 314-1-5 Abandonment . . . . . . . . . . . . . . . . . . . . . . . . . . . . . . . . . 314-2 Types of Wells. . . . . . . . . . . . . . . . . . . . . . . . . . . . . . . . . 314-3 Well Drilling . . . . . . . . . . . . . . . . . . . . . . . . . . . . . . . . . . 324-3-1 Preparing to Drill . . . . . . . . . . . . . . . . . . . . . . . . . . . . . . 324-3-2 Setting Up the Rig . . . . . . . . . . . . . . . . . . . . . . . . . . . . . 324-3-3 Drilling the Well . . . . . . . . . . . . . . . . . . . . . . . . . . . . . . 344-3-4 Drilling Bits . . . . . . . . . . . . . . . . . . . . . . . . . . . . . . . . . . . 354-3-5 Logging while Drilling. . . . . . . . . . . . . . . . . . . . . . . . . 354-3-6 Drilling Mud . . . . . . . . . . . . . . . . . . . . . . . . . . . . . . . . . . 364-3-7 Offshore Chemicals . . . . . . . . . . . . . . . . . . . . . . . . . . . 364-3-8 Horizontal Drilling . . . . . . . . . . . . . . . . . . . . . . . . . . . . 374-4 Well Completion . . . . . . . . . . . . . . . . . . . . . . . . . . . . . . 374-4-1 Conducting Drill Stem Test . . . . . . . . . . . . . . . . . . . . 384-4-2 Setting Production Casing . . . . . . . . . . . . . . . . . . . . . 384-4-3 Installing Production Tubing . . . . . . . . . . . . . . . . . . 384-4-4 Starting Production Flow . . . . . . . . . . . . . . . . . . . . . . 384-4-5 Servicing. . . . . . . . . . . . . . . . . . . . . . . . . . . . . . . . . . . . . . 384-4-5-1 Transporting Rig and Rigging Up . . . . . . . . . . . . . . 384-4-5-2 General Servicing . . . . . . . . . . . . . . . . . . . . . . . . . . . . . 384-4-5-3 Special Services . . . . . . . . . . . . . . . . . . . . . . . . . . . . . . . 384-4-5-4 Workover . . . . . . . . . . . . . . . . . . . . . . . . . . . . . . . . . . . . . 384-5 Oil Extraction . . . . . . . . . . . . . . . . . . . . . . . . . . . . . . . . . 38
Chapter 5 – Offshore Structures5-1 Overview . . . . . . . . . . . . . . . . . . . . . . . . . . . . . . . . . . . . . 415-2 Platform Types . . . . . . . . . . . . . . . . . . . . . . . . . . . . . . . . 415-2-1 Stationary Platforms . . . . . . . . . . . . . . . . . . . . . . . . . . 425-2-1-1 Jacket Platforms . . . . . . . . . . . . . . . . . . . . . . . . . . . . . . . 425-2-1-2 STAR Platforms . . . . . . . . . . . . . . . . . . . . . . . . . . . . . . . 425-2-1-3 Compliant Towers . . . . . . . . . . . . . . . . . . . . . . . . . . . . . 43
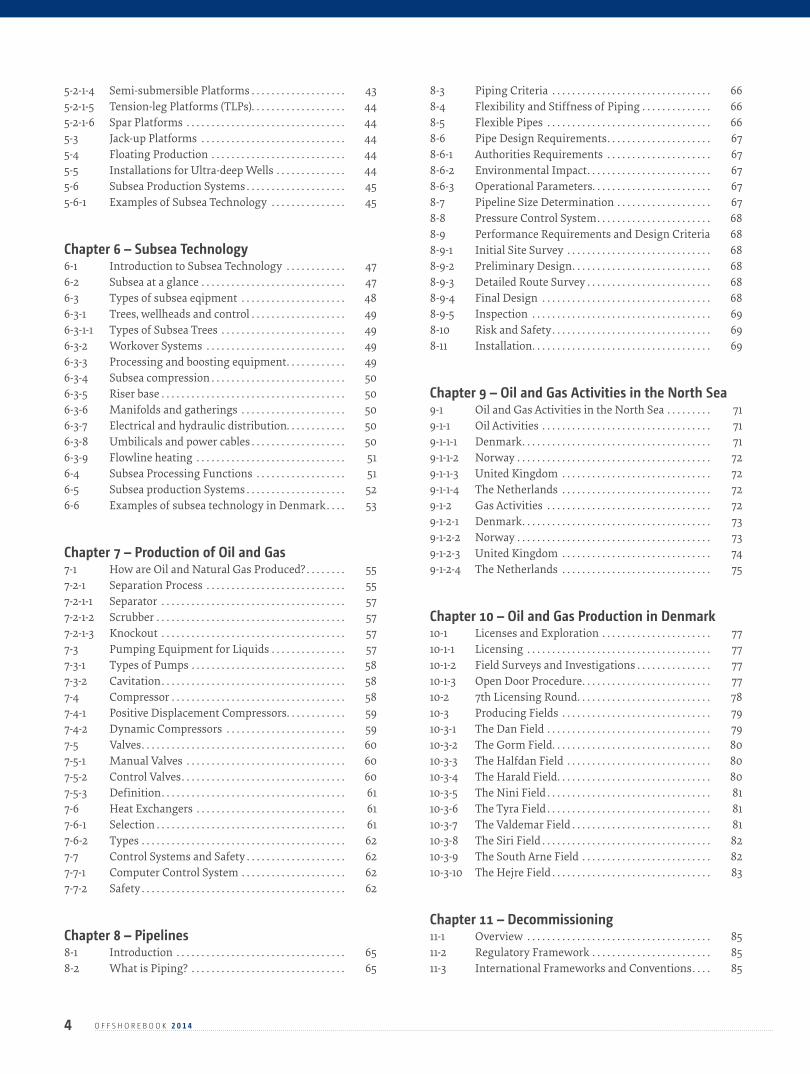
5-2-1-4 Semi-submersible Platforms . . . . . . . . . . . . . . . . . . . 435-2-1-5 Tension-leg Platforms (TLPs). . . . . . . . . . . . . . . . . . . 445-2-1-6 Spar Platforms . . . . . . . . . . . . . . . . . . . . . . . . . . . . . . . . 445-3 Jack-up Platforms . . . . . . . . . . . . . . . . . . . . . . . . . . . . . 445-4 Floating Production . . . . . . . . . . . . . . . . . . . . . . . . . . . 445-5 Installations for Ultra-deep Wells . . . . . . . . . . . . . . 445-6 Subsea Production Systems . . . . . . . . . . . . . . . . . . . . 455-6-1 Examples of Subsea Technology . . . . . . . . . . . . . . . 45
Chapter 6 – Subsea Technology6-1 Introduction to Subsea Technology . . . . . . . . . . . . 476-2 Subsea at a glance . . . . . . . . . . . . . . . . . . . . . . . . . . . . . 476-3 Types of subsea eqipment . . . . . . . . . . . . . . . . . . . . . 486-3-1 Trees, wellheads and control . . . . . . . . . . . . . . . . . . . 496-3-1-1 Types of Subsea Trees . . . . . . . . . . . . . . . . . . . . . . . . . 496-3-2 Workover Systems . . . . . . . . . . . . . . . . . . . . . . . . . . . . 496-3-3 Processing and boosting equipment. . . . . . . . . . . . 496-3-4 Subsea compression . . . . . . . . . . . . . . . . . . . . . . . . . . . 506-3-5 Riser base . . . . . . . . . . . . . . . . . . . . . . . . . . . . . . . . . . . . . 506-3-6 Manifolds and gatherings . . . . . . . . . . . . . . . . . . . . . 506-3-7 Electrical and hydraulic distribution. . . . . . . . . . . . 506-3-8 Umbilicals and power cables . . . . . . . . . . . . . . . . . . . 506-3-9 Flowline heating . . . . . . . . . . . . . . . . . . . . . . . . . . . . . . 516-4 Subsea Processing Functions . . . . . . . . . . . . . . . . . . 516-5 Subsea production Systems . . . . . . . . . . . . . . . . . . . . 526-6 Examples of subsea technology in Denmark. . . . 53
Chapter 7 – Production of Oil and Gas7-1 How are Oil and Natural Gas Produced? . . . . . . . . 557-2-1 Separation Process . . . . . . . . . . . . . . . . . . . . . . . . . . . . 557-2-1-1 Separator . . . . . . . . . . . . . . . . . . . . . . . . . . . . . . . . . . . . . 577-2-1-2 Scrubber . . . . . . . . . . . . . . . . . . . . . . . . . . . . . . . . . . . . . . 577-2-1-3 Knockout . . . . . . . . . . . . . . . . . . . . . . . . . . . . . . . . . . . . . 577-3 Pumping Equipment for Liquids . . . . . . . . . . . . . . . 577-3-1 Types of Pumps . . . . . . . . . . . . . . . . . . . . . . . . . . . . . . . 587-3-2 Cavitation. . . . . . . . . . . . . . . . . . . . . . . . . . . . . . . . . . . . . 587-4 Compressor . . . . . . . . . . . . . . . . . . . . . . . . . . . . . . . . . . . 587-4-1 Positive Displacement Compressors. . . . . . . . . . . . 597-4-2 Dynamic Compressors . . . . . . . . . . . . . . . . . . . . . . . . 597-5 Valves. . . . . . . . . . . . . . . . . . . . . . . . . . . . . . . . . . . . . . . . . 607-5-1 Manual Valves . . . . . . . . . . . . . . . . . . . . . . . . . . . . . . . . 607-5-2 Control Valves. . . . . . . . . . . . . . . . . . . . . . . . . . . . . . . . . 607-5-3 Definition. . . . . . . . . . . . . . . . . . . . . . . . . . . . . . . . . . . . . 617-6 Heat Exchangers . . . . . . . . . . . . . . . . . . . . . . . . . . . . . . 617-6-1 Selection . . . . . . . . . . . . . . . . . . . . . . . . . . . . . . . . . . . . . . 617-6-2 Types . . . . . . . . . . . . . . . . . . . . . . . . . . . . . . . . . . . . . . . . . 627-7 Control Systems and Safety . . . . . . . . . . . . . . . . . . . . 627-7-1 Computer Control System . . . . . . . . . . . . . . . . . . . . . 627-7-2 Safety . . . . . . . . . . . . . . . . . . . . . . . . . . . . . . . . . . . . . . . . . 62
Chapter 8 – Pipelines8-1 Introduction . . . . . . . . . . . . . . . . . . . . . . . . . . . . . . . . . . 658-2 What is Piping? . . . . . . . . . . . . . . . . . . . . . . . . . . . . . . . 65
8-3 Piping Criteria . . . . . . . . . . . . . . . . . . . . . . . . . . . . . . . . 668-4 Flexibility and Stiffness of Piping . . . . . . . . . . . . . . 668-5 Flexible Pipes . . . . . . . . . . . . . . . . . . . . . . . . . . . . . . . . . 668-6 Pipe Design Requirements. . . . . . . . . . . . . . . . . . . . . 678-6-1 Authorities Requirements . . . . . . . . . . . . . . . . . . . . . 678-6-2 Environmental Impact. . . . . . . . . . . . . . . . . . . . . . . . . 678-6-3 Operational Parameters. . . . . . . . . . . . . . . . . . . . . . . . 678-7 Pipeline Size Determination . . . . . . . . . . . . . . . . . . . 678-8 Pressure Control System. . . . . . . . . . . . . . . . . . . . . . . 688-9 Performance Requirements and Design Criteria 688-9-1 Initial Site Survey . . . . . . . . . . . . . . . . . . . . . . . . . . . . . 688-9-2 Preliminary Design. . . . . . . . . . . . . . . . . . . . . . . . . . . . 688-9-3 Detailed Route Survey . . . . . . . . . . . . . . . . . . . . . . . . . 688-9-4 Final Design . . . . . . . . . . . . . . . . . . . . . . . . . . . . . . . . . . 688-9-5 Inspection . . . . . . . . . . . . . . . . . . . . . . . . . . . . . . . . . . . . 698-10 Risk and Safety. . . . . . . . . . . . . . . . . . . . . . . . . . . . . . . . 698-11 Installation. . . . . . . . . . . . . . . . . . . . . . . . . . . . . . . . . . . . 69
Chapter 9 – Oil and Gas Activities in the North Sea9-1 Oil and Gas Activities in the North Sea . . . . . . . . . 719-1-1 Oil Activities . . . . . . . . . . . . . . . . . . . . . . . . . . . . . . . . . . 719-1-1-1 Denmark. . . . . . . . . . . . . . . . . . . . . . . . . . . . . . . . . . . . . . 719-1-1-2 Norway . . . . . . . . . . . . . . . . . . . . . . . . . . . . . . . . . . . . . . . 729-1-1-3 United Kingdom . . . . . . . . . . . . . . . . . . . . . . . . . . . . . . 729-1-1-4 The Netherlands . . . . . . . . . . . . . . . . . . . . . . . . . . . . . . 729-1-2 Gas Activities . . . . . . . . . . . . . . . . . . . . . . . . . . . . . . . . . 729-1-2-1 Denmark. . . . . . . . . . . . . . . . . . . . . . . . . . . . . . . . . . . . . . 739-1-2-2 Norway . . . . . . . . . . . . . . . . . . . . . . . . . . . . . . . . . . . . . . . 739-1-2-3 United Kingdom . . . . . . . . . . . . . . . . . . . . . . . . . . . . . . 749-1-2-4 The Netherlands . . . . . . . . . . . . . . . . . . . . . . . . . . . . . . 75
Chapter 10 – Oil and Gas Production in Denmark10-1 Licenses and Exploration . . . . . . . . . . . . . . . . . . . . . . 7710-1-1 Licensing . . . . . . . . . . . . . . . . . . . . . . . . . . . . . . . . . . . . . 7710-1-2 Field Surveys and Investigations . . . . . . . . . . . . . . . 7710-1-3 Open Door Procedure. . . . . . . . . . . . . . . . . . . . . . . . . . 7710-2 7th Licensing Round. . . . . . . . . . . . . . . . . . . . . . . . . . . 7810-3 Producing Fields . . . . . . . . . . . . . . . . . . . . . . . . . . . . . . 7910-3-1 The Dan Field . . . . . . . . . . . . . . . . . . . . . . . . . . . . . . . . . 7910-3-2 The Gorm Field. . . . . . . . . . . . . . . . . . . . . . . . . . . . . . . . 8010-3-3 The Halfdan Field . . . . . . . . . . . . . . . . . . . . . . . . . . . . . 8010-3-4 The Harald Field. . . . . . . . . . . . . . . . . . . . . . . . . . . . . . . 8010-3-5 The Nini Field . . . . . . . . . . . . . . . . . . . . . . . . . . . . . . . . . 8110-3-6 The Tyra Field . . . . . . . . . . . . . . . . . . . . . . . . . . . . . . . . . 8110-3-7 The Valdemar Field . . . . . . . . . . . . . . . . . . . . . . . . . . . . 8110-3-8 The Siri Field . . . . . . . . . . . . . . . . . . . . . . . . . . . . . . . . . . 8210-3-9 The South Arne Field . . . . . . . . . . . . . . . . . . . . . . . . . . 8210-3-10 The Hejre Field . . . . . . . . . . . . . . . . . . . . . . . . . . . . . . . . 83
Chapter 11 – Decommissioning11-1 Overview . . . . . . . . . . . . . . . . . . . . . . . . . . . . . . . . . . . . . 8511-2 Regulatory Framework . . . . . . . . . . . . . . . . . . . . . . . . 8511-3 International Frameworks and Conventions. . . . 85
4 O F F S H O R E B O O K 2 0 1 4
11-4 Decommissioning Options . . . . . . . . . . . . . . . . . . . . 8711-4-1 Possible Decommissioning Options . . . . . . . . . . . . 8711-4-2 Criteria for Decommissioning Solution . . . . . . . . 8711-5 Reuse . . . . . . . . . . . . . . . . . . . . . . . . . . . . . . . . . . . . . . . . . 8711-6 Decommissioning of Offshore Installations in Europe . . . . . . . . . . . . . . . . . . . . . . . . . . . . . . . . . . . . . 8811-6-1 Information Exchange. . . . . . . . . . . . . . . . . . . . . . . . . 8811-6-2 Challenges of Offshore Installations in Europe . 8811-6-2-1 Technical Challenges . . . . . . . . . . . . . . . . . . . . . . . . . . 8811-6-2-2 Health and Safety Challenges . . . . . . . . . . . . . . . . . . 8911-6-2-3 Environmental Challenges . . . . . . . . . . . . . . . . . . . . . 8911-6-2-4 Economic Challenges . . . . . . . . . . . . . . . . . . . . . . . . . . 8911-6-2-5 Construction Challenges. . . . . . . . . . . . . . . . . . . . . . . 8912-7 Decommissioning of Offshore Installations in the North Sea . . . . . . . . . . . . . . . . . . . . . . . . . . . . . . . 8911-8 Decommissioning of Offshore Installations in Denmark becomes commercial . . . . . . . . . . . . . . . . 90
Chapter 12 – Upstream and Downstream Logistics12-1 Why Logistics matter. . . . . . . . . . . . . . . . . . . . . . . . . . 9312-2 Upstream and Downstream Logistics . . . . . . . . . . 9312-2-1 Logistics upstream . . . . . . . . . . . . . . . . . . . . . . . . . . . . 9412-2-2 Logistics downstream . . . . . . . . . . . . . . . . . . . . . . . . . 9412-3 Global Patterns of Oil Trade. . . . . . . . . . . . . . . . . . . . 9412-3-1 The Nearest Market First . . . . . . . . . . . . . . . . . . . . . . 9412-3-2 Quality, Industry Structure, and Governments . 9512-3-3 Crude versus Products. . . . . . . . . . . . . . . . . . . . . . . . . 9512-4 Transportation of Oil and Gas. . . . . . . . . . . . . . . . . . 9512-4-1 Oil Transportation and Environment . . . . . . . . . . . 9512-4-1-1 Maritime Transport . . . . . . . . . . . . . . . . . . . . . . . . . . . 9512-4-1-2 Oil Transportation by Land . . . . . . . . . . . . . . . . . . . . 9612-5 Oil Storage in Tank Farms . . . . . . . . . . . . . . . . . . . . . 9612-6 Gas Transport and Supply . . . . . . . . . . . . . . . . . . . . . 9612-7 Gas Storage Facilities . . . . . . . . . . . . . . . . . . . . . . . . . . 97
Chapter 13 – Downstream13-1 Downstream . . . . . . . . . . . . . . . . . . . . . . . . . . . . . . . . . . 9913-2 Oil Refinery Operation . . . . . . . . . . . . . . . . . . . . . . . . 9913-2-1 Light distillate. . . . . . . . . . . . . . . . . . . . . . . . . . . . . . . . . 10013-2-2 Middle distillate. . . . . . . . . . . . . . . . . . . . . . . . . . . . . . . 10113-2-3 Heavy distillates and residuum . . . . . . . . . . . . . . . . 10113-3 Safety and Environmental Concerns . . . . . . . . . . . 10213-3-1 Common Process Units found in a Refinery . . . . 10413-4 Petrochemicals . . . . . . . . . . . . . . . . . . . . . . . . . . . . . . . . 10413-5 Transportation Oil and Gas Pipelines. . . . . . . . . . . 105
Chapter 14 – Education and Training in Denmark14-1 Overview . . . . . . . . . . . . . . . . . . . . . . . . . . . . . . . . . . . . . 107
5O F F S H O R E B O O K 2 0 1 4
1C H A P T E R
7O F F S H O R E B O O K 2 0 1 4
1-1 Overview HSE – Health, Safety and Environment – is one of the most important concepts within the offshore industry. Virtually all compa-nies involved in the offshore business have an HSE policy. There are several reasons for the big focus on HSE:
The main aims are to protect the health, safety and welfare of people at work, and to safeguard others, e.g. surroundings and supply, who may be exposed to risks from the way work is carried out.
Focus on HSE is to decide what is reasonably practicable within safety and environment. Management must take account of the degree of risk on the one hand, and on the other the sacrifice, whether in money, time or trouble, involved in the measures neces-sary to avert the risk.
Unless it can be shown that there is gross disproportion between these factors and that the risk is insignificant in relation to the cost, the management must take measures and incur costs to reduce the risk.
The economy in the overall picture will be reduced. Less accidents = less expenditure.
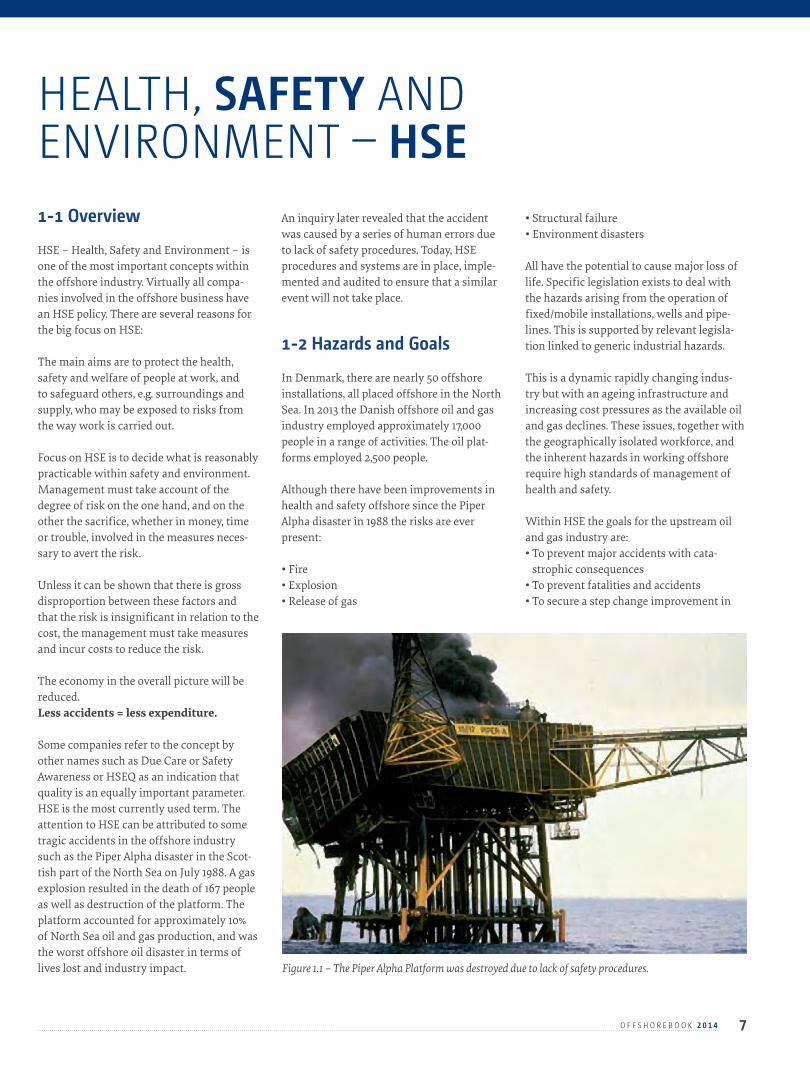
Some companies refer to the concept by other names such as Due Care or Safety Awareness or HSEQ as an indication that quality is an equally important parameter. HSE is the most currently used term. The attention to HSE can be attributed to some tragic accidents in the offshore industry such as the Piper Alpha disaster in the Scot-tish part of the North Sea on July 1988. A gas explosion resulted in the death of 167 people as well as destruction of the platform. The platform accounted for approximately 10% of North Sea oil and gas production, and was the worst offshore oil disaster in terms of lives lost and industry impact.
An inquiry later revealed that the accident was caused by a series of human errors due to lack of safety procedures. Today, HSE procedures and systems are in place, imple-mented and audited to ensure that a similar event will not take place.
1-2 Hazards and Goals In Denmark, there are nearly 50 offshore installations, all placed offshore in the North Sea. In 2013 the Danish offshore oil and gas industry employed approximately 17,000 people in a range of activities. The oil plat-forms employed 2,500 people.
Although there have been improvements in health and safety offshore since the Piper Alpha disaster in 1988 the risks are ever present:
• Fire• Explosion• Release of gas
• Structural failure• Environment disasters
All have the potential to cause major loss of life. Specific legislation exists to deal with the hazards arising from the operation of fixed/mobile installations, wells and pipe-lines. This is supported by relevant legisla-tion linked to generic industrial hazards.
This is a dynamic rapidly changing indus-try but with an ageing infrastructure and increasing cost pressures as the available oil and gas declines. These issues, together with the geographically isolated workforce, and the inherent hazards in working offshore require high standards of management of health and safety.
Within HSE the goals for the upstream oil and gas industry are:• To prevent major accidents with cata-
strophic consequences• To prevent fatalities and accidents• To secure a step change improvement in
HEALTH, SAFETY AND ENVIRONMENT – HSE
Figure 1.1 – The Piper Alpha Platform was destroyed due to lack of safety procedures.
8 O F F S H O R E B O O K 2 0 1 4
injury rates and work related health and consequent days lost from work
• To support industry’s goal to be the world’s safest offshore sector
• To secure more effective workplace in-volvement
• To maintain an effective regulatory frame-work
1-3 Procedures The backbones of HSE procedures are stand-ards (also referred to as norms). The main standardisation organisations within the offshore industry are:
• ISO - International Standardization Organ-ization
• CEN – Committee Europeen de Normali-sation
• API - American Petroleum Institute• NORSOK - Norsk Sokkels Konkuransepo-
sisjon
For the North Sea it is also worth to mention Dansk Standard (Danish Standard) and NORSOK Petroleum. These organisations all develop and adopt standards that are used throughout the offshore industry.
Important standards within HSE include:
• DS/OHSAS 18000 series (Health & Safety)• DS/EN ISO 14000 series (Environment)
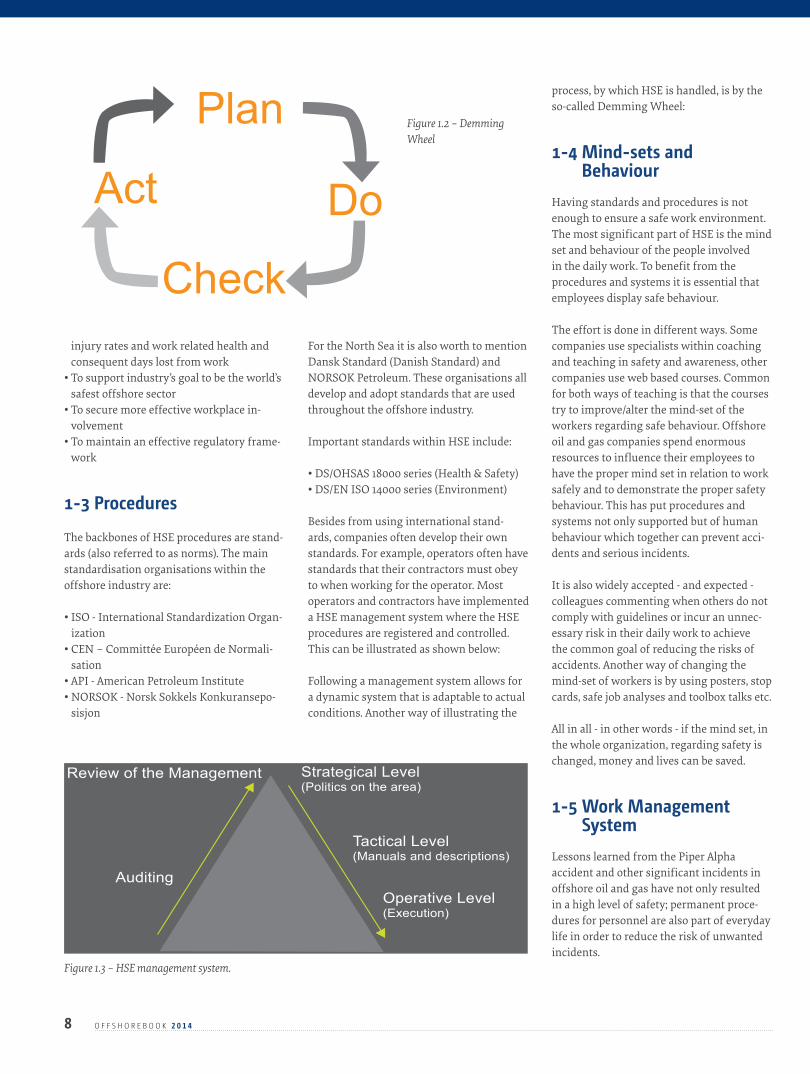
Besides from using international stand-ards, companies often develop their own standards. For example, operators often have standards that their contractors must obey to when working for the operator. Most operators and contractors have implemented a HSE management system where the HSE procedures are registered and controlled. This can be illustrated as shown below:
Following a management system allows for a dynamic system that is adaptable to actual conditions. Another way of illustrating the
process, by which HSE is handled, is by the so-called Demming Wheel:
1-4 Mind-sets and Behaviour
Having standards and procedures is not enough to ensure a safe work environment. The most significant part of HSE is the mind set and behaviour of the people involved in the daily work. To benefit from the procedures and systems it is essential that employees display safe behaviour.
The effort is done in different ways. Some companies use specialists within coaching and teaching in safety and awareness, other companies use web based courses. Common for both ways of teaching is that the courses try to improve/alter the mind-set of the workers regarding safe behaviour. Offshore oil and gas companies spend enormous resources to influence their employees to have the proper mind set in relation to work safely and to demonstrate the proper safety behaviour. This has put procedures and systems not only supported but of human behaviour which together can prevent acci-dents and serious incidents.
It is also widely accepted - and expected - colleagues commenting when others do not comply with guidelines or incur an unnec-essary risk in their daily work to achieve the common goal of reducing the risks of accidents. Another way of changing the mind-set of workers is by using posters, stop cards, safe job analyses and toolbox talks etc.
All in all - in other words - if the mind set, in the whole organization, regarding safety is changed, money and lives can be saved.
1-5 Work Management System
Lessons learned from the Piper Alpha accident and other significant incidents in offshore oil and gas have not only resulted in a high level of safety; permanent proce-dures for personnel are also part of everyday life in order to reduce the risk of unwanted incidents.
Review of the Management Strategical Level(Politics on the area)
Auditing
Tactical Level(Manuals and descriptions)
Operative Level(Execution)
Figure 1.2 – Demming Wheel
Plan
Do
Check
Act
Figure 1.3 – HSE management system.
9O F F S H O R E B O O K 2 0 1 4
An important tool is the Work Management System, which is to ensure an overview of who are working on board an installation and of the tasks that have been planned. The Work management System falls into the following categories:
Maintenance Management System This is a computer-controlled system for control and management of tasks and spare parts to do with everyday maintenance. The best known systems are Maximo, SAP and AMOS, and these systems basically do not differ from systems in other industries.
Document Control System This system controls and manages work documents, drawings, permits, reports and suchlike. As applies to the Maintenance Management System, software solutions known from other industries are used.
Management of Change System This system is designed to handle all kinds of changes on an installation from changes to drawings and design through to changes made to procedures.
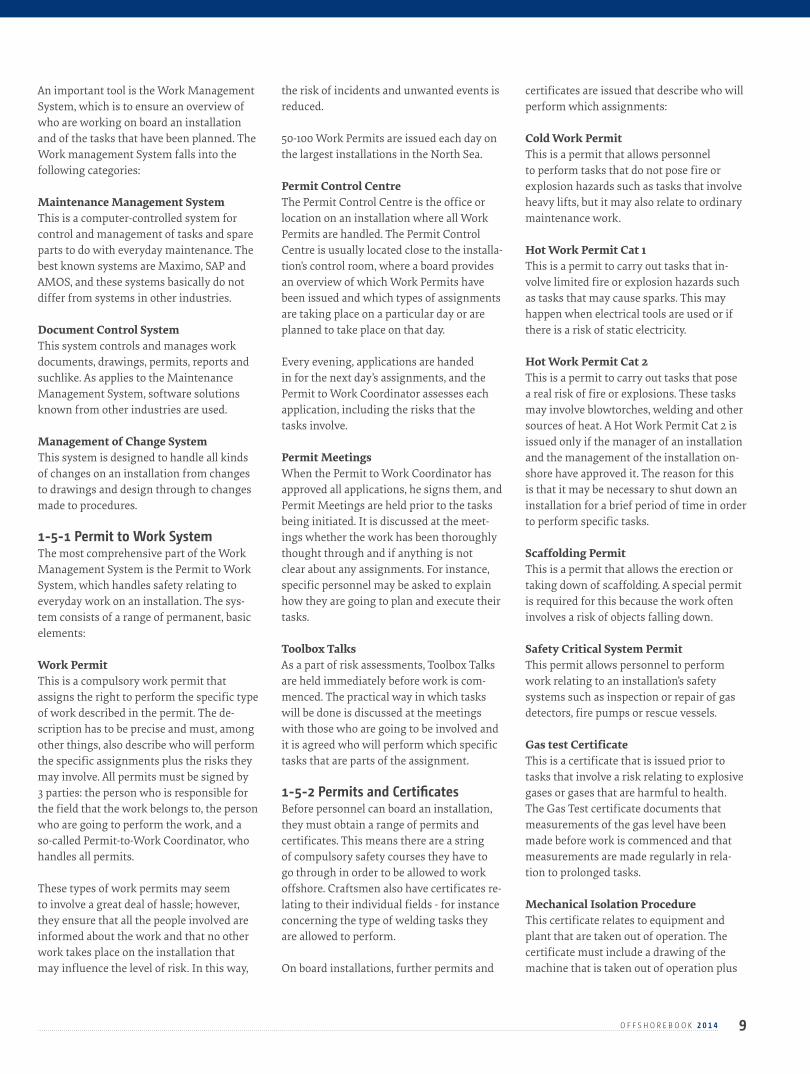
1-5-1 Permit to Work SystemThe most comprehensive part of the Work Management System is the Permit to Work System, which handles safety relating to everyday work on an installation. The sys-tem consists of a range of permanent, basic elements:
Work Permit This is a compulsory work permit that assigns the right to perform the specific type of work described in the permit. The de-scription has to be precise and must, among other things, also describe who will perform the specific assignments plus the risks they may involve. All permits must be signed by 3 parties: the person who is responsible for the field that the work belongs to, the person who are going to perform the work, and a so-called Permit-to-Work Coordinator, who handles all permits.
These types of work permits may seem to involve a great deal of hassle; however, they ensure that all the people involved are informed about the work and that no other work takes place on the installation that may influence the level of risk. In this way,
the risk of incidents and unwanted events is reduced.
50-100 Work Permits are issued each day on the largest installations in the North Sea.
Permit Control Centre The Permit Control Centre is the office or location on an installation where all Work Permits are handled. The Permit Control Centre is usually located close to the installa-tion’s control room, where a board provides an overview of which Work Permits have been issued and which types of assignments are taking place on a particular day or are planned to take place on that day.
Every evening, applications are handed in for the next day’s assignments, and the Permit to Work Coordinator assesses each application, including the risks that the tasks involve.
Permit Meetings When the Permit to Work Coordinator has approved all applications, he signs them, and Permit Meetings are held prior to the tasks being initiated. It is discussed at the meet-ings whether the work has been thoroughly thought through and if anything is not clear about any assignments. For instance, specific personnel may be asked to explain how they are going to plan and execute their tasks.
Toolbox Talks As a part of risk assessments, Toolbox Talks are held immediately before work is com-menced. The practical way in which tasks will be done is discussed at the meetings with those who are going to be involved and it is agreed who will perform which specific tasks that are parts of the assignment.
1-5-2 Permits and CertificatesBefore personnel can board an installation, they must obtain a range of permits and certificates. This means there are a string of compulsory safety courses they have to go through in order to be allowed to work offshore. Craftsmen also have certificates re-lating to their individual fields - for instance concerning the type of welding tasks they are allowed to perform.
On board installations, further permits and
certificates are issued that describe who will perform which assignments:
Cold Work Permit This is a permit that allows personnel to perform tasks that do not pose fire or explosion hazards such as tasks that involve heavy lifts, but it may also relate to ordinary maintenance work.
Hot Work Permit Cat 1 This is a permit to carry out tasks that in-volve limited fire or explosion hazards such as tasks that may cause sparks. This may happen when electrical tools are used or if there is a risk of static electricity.
Hot Work Permit Cat 2 This is a permit to carry out tasks that pose a real risk of fire or explosions. These tasks may involve blowtorches, welding and other sources of heat. A Hot Work Permit Cat 2 is issued only if the manager of an installation and the management of the installation on-shore have approved it. The reason for this is that it may be necessary to shut down an installation for a brief period of time in order to perform specific tasks.
Scaffolding Permit This is a permit that allows the erection or taking down of scaffolding. A special permit is required for this because the work often involves a risk of objects falling down.
Safety Critical System Permit This permit allows personnel to perform work relating to an installation’s safety systems such as inspection or repair of gas detectors, fire pumps or rescue vessels.
Gas test Certificate This is a certificate that is issued prior to tasks that involve a risk relating to explosive gases or gases that are harmful to health. The Gas Test certificate documents that measurements of the gas level have been made before work is commenced and that measurements are made regularly in rela-tion to prolonged tasks.
Mechanical Isolation Procedure This certificate relates to equipment and plant that are taken out of operation. The certificate must include a drawing of the machine that is taken out of operation plus
10 O F F S H O R E B O O K 2 0 1 4
a description of all valves with an indication of their start position and their position when they are operating.
An Extended Isolation Procedure certificate may supplement this type of certificate if equipment is to be taken out of operation for a prolonged period of time. Among other things, it must include information on why the equipment is going to be taken out of operation and on the consequences this will have for the overall operation of an installa-tion.
Electrical Isolation Procedure Similar to the Mechanical Isolation Proce-dure, all electrical equipment that is taken out of operation must have a certificate that describes the electrical system, and a draw-ing of the system must also be included.
An Extended Isolation Procedure certificate may supplement this type of certificate if equipment is to be taken out of operation for a prolonged period of time. Among other things, it must include information on why the equipment is going to be taken out of op-eration and the consequences this will have for the overall operation of an installation.
In addition to the comprehensive require-ments of certificates and safety procedures, checks are often made of the installations. Apart from personnel’s own checks of instal-lations, external audits are also conducted where external consultants come on board and go through safety systems in detail in order to make sure all systems are complied with and work.
1-5-3 Platform AuthoritiesA range of people have specific areas of re-sponsibility on an offshore installation. They have specialist knowledge of, for instance, specific types of work or specific areas on an installation. These people may be divided into the following groups:
Area Authority: Responsible for specifically defined areas on an installation. The Area Authority is the person who is overall responsible for all activities.
Discipline Authority Responsible for specific fields of work on an
installation such as mechanical or electrical work.
Performing Authority Responsible for the practical execution of work. This may be the person who has been appointed to perform a task or who is responsible for the group that will carry out a task.
1-6 Safety Training Even though very precise procedures are in place relating to all work processes on an in-stallation, unwanted incidents might occur. In order to be prepared for any possible in-cident, all personnel on an installation must have gone through compulsory training programmes – safety and survival training.
Basic training courses include first aid, firefighting, sea rescue and HUET – Heli-copter Underwater Escape Training. These compulsory courses must meet require-ments defined by, for instance, the STCW convention – International Convention on Standards of Training, Certification, and Watchkeeping for Saefarers – and OPITO, the Offshore Petroleum Industry Training Organization.
Besides theory and an abundance of practi-cal exercises, training centres and operators have in recent years begun to make use of 3D simulation systems that create a realistic environment based on computer programmes where it is possible – free of risk – to train any conceivable situation and ask those taking part in the course: “What if…”.
1-7 Safety systemsHuman errors cause most incidents and unwanted events on an offshore oil and gas installation and, in order to prevent incidents from developing in catastrophes, a range of safety systems are in place on an installation.
1-7-1 Fire and gas alert systemsFire and explosion hazards constitute some of the greatest dangers on an installation, which is why the most dangerous processes are placed as far away from the residential
areas and the control room as possible. A range of fire and gas alert systems are also installed, consisting of:
• Flame detectors• Heat detectors• Smoke detectors• Gas detectors• Compressed air ring with plug fuses• Manual stop functions
If the worst possible situation occurs and a fire or explosions make it necessary, then an emergency shutdown system can shut down an entire installation.
The emergency shutdown system represents the last phase in a procedure where the first phase is a warning about, for instance, rising pressures or temperatures. If it is not possi-ble to solve the problem, then the process in question is shut down. If this does not solve the problem either, one moves on to the next phase and shuts down larger parts of the process. If the situation develops into visible flames or smoke and flame and heat detectors are activated, then the power supply is shut down and the fire pumps are activated. The final phase is the highest state of alert: Prepare to Abandon Platform Alarm – PAPA. In this phase, all necessary systems are shut down and only emergency lighting and, for instance, radio communications remain active. Then the installation is evacuated according to meticulously planned and rehearsed procedures. Fortunately, emergency situations as serious as this are very rare and it has never been necessary to evacuate personnel from instal-lations in the Danish North Sea sector as a consequence of fire or explosions. However, a number of serious incidents have occurred. In May 2001, an accident happened on the Gorm C installation when a compressor module exploded. 2 People who were in the vicinity of the place where the accident oc-curred suffered burns. The accident caused grave material damage to the system and had severe consequences for production in that a range of oil fields were out of normal operation for a prolonged period of time.
11O F F S H O R E B O O K 2 0 1 4
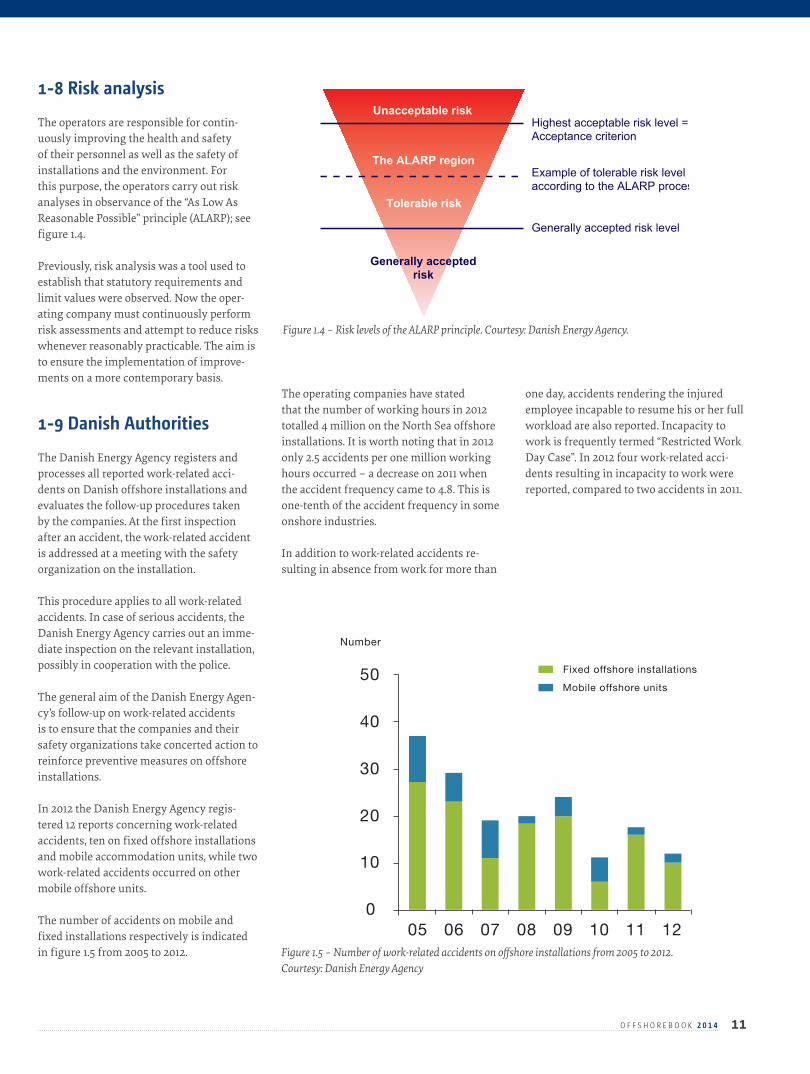
1-8 Risk analysis The operators are responsible for contin-uously improving the health and safety of their personnel as well as the safety of installations and the environment. For this purpose, the operators carry out risk analyses in observance of the “As Low As Reasonable Possible” principle (ALARP); see figure 1.4.
Previously, risk analysis was a tool used to establish that statutory requirements and limit values were observed. Now the oper-ating company must continuously perform risk assessments and attempt to reduce risks whenever reasonably practicable. The aim is to ensure the implementation of improve-ments on a more contemporary basis.
1-9 Danish Authorities The Danish Energy Agency registers and processes all reported work-related acci-dents on Danish offshore installations and evaluates the follow-up procedures taken by the companies. At the first inspection after an accident, the work-related accident is addressed at a meeting with the safety organization on the installation.
This procedure applies to all work-related accidents. In case of serious accidents, the Danish Energy Agency carries out an imme-diate inspection on the relevant installation, possibly in cooperation with the police.
The general aim of the Danish Energy Agen-cy’s follow-up on work-related accidents is to ensure that the companies and their safety organizations take concerted action to reinforce preventive measures on offshore installations.
In 2012 the Danish Energy Agency regis-tered 12 reports concerning work-related accidents, ten on fixed offshore installations and mobile accommodation units, while two work-related accidents occurred on other mobile offshore units.
The number of accidents on mobile and fixed installations respectively is indicated in figure 1.5 from 2005 to 2012.
The operating companies have stated that the number of working hours in 2012 totalled 4 million on the North Sea offshore installations. It is worth noting that in 2012 only 2.5 accidents per one million working hours occurred – a decrease on 2011 when the accident frequency came to 4.8. This is one-tenth of the accident frequency in some onshore industries.
In addition to work-related accidents re-sulting in absence from work for more than
one day, accidents rendering the injured employee incapable to resume his or her full workload are also reported. Incapacity to work is frequently termed “Restricted Work Day Case”. In 2012 four work-related acci-dents resulting in incapacity to work were reported, compared to two accidents in 2011.
Figure 1.4 – Risk levels of the ALARP principle. Courtesy: Danish Energy Agency.
05 06 07 08 09 10 11 12
Fixed offshore installations
Mobile offshore units
50
40
30
20
10
0
Number 05 06 07 08 09 10 11 12
Fixed offshore installations
Mobile offshore units
50
40
30
20
10
0
Number
Unacceptable risk
The ALARP region
Tolerable risk
Generally acceptedrisk
Generally accepted risk level
Example of tolerable risk levelaccording to the ALARP process
Highest acceptable risk level =Acceptance criterion
Figure 1.5 – Number of work-related accidents on offshore installations from 2005 to 2012. Courtesy: Danish Energy Agency

12O F F S H O R E B O O K 2 0 1 4
BC H A P T E R
2C H A P T E R
13O F F S H O R E B O O K 2 0 1 4
2-1 Overview 2-1-1 What is Crude Oil?The oil found in the subsurface is called crude oil and is a mixture of hydrocarbons, which in form range from almost solid to gaseous.
Crude oil is a naturally occurring mixture of hundreds of different hydrocarbon com-pounds trapped in subsurface rock. These hydrocarbons were created millions of years ago when plant and algae material died and settled on the bottom of streams, lakes, seas and oceans, forming a thick layer of organic material. Subsequent sedimentation covered this layer, applying heat and pressure that “cooked” the organic material and changed it into the petroleum we extract from the subsurface today.
Crude oils are generally differentiated by the size of the hydrogen rich hydrocarbon molecules they contain. For example, light oil containing lighter hydrocarbons flows easily through wells and pipelines and when refined, produces a large quantity of transportation fuels such as petrol, diesel and jet fuel. Heavy oil containing heavier hydrocarbons, in contrast, requires addi-tional pumping or diluting to be able to flow through wells and pipelines; when refined, it produces proportionally more heating oil and a smaller amount of transportationfuels.
Crude oil is a complex mixture of hydro-carbons with minor proportions of other chemicals such as compounds of sulphur, nitrogen and oxygen. The different parts of the mixture must be separated, before they can be used, and this process is called re-fining. Crude oil from different parts of the world, or even from different depths in the same oilfield, contains different mixtures of hydrocarbons and other compounds. This is why it varies from a light-coloured volatile liquid to thick, dark, black oil – so viscous
that it is difficult to pump from the subsur-face.
It is not only the appearance of crude oil that varies. Crudes from different sources have different compositions. Some may have more of the valuable lighter hydrocarbons, and some may have more of the heavier hydrocarbons. The compositions of differ-ent crudes are measured and published in assays. This information is used by the refinery in deciding which crudes to buy to make the products that its customers need at any given time.
When crude oil comes out of a well it is often mixed with gases, water and sand. It forms an emulsion with water that looks a bit like caramel. The sand suspended in
the emulsion produces this caramel effect. Eventually the sand settles and the water is then removed using de-emulsifying agents. Both sand and water have to be separated from the crude oil, before it can be pro-cessed ready for transportation by tanker or pipeline.
The dissolved gases are removed at the well. Once the drilling shaft makes contact with the oil, it releases the pressure in the under-ground reservoir and the dissolved gases fizz out of solution pushing crude oil to the surface. This is necessary as they might come out of solution and cause a build-up of pressure in a pipe or a tanker. Crude oil also contains sulphur, which has to be removed from any fractions that are going to be burnt as it forms sulphur dioxide, which contrib-utes to acid rain. Therefore, any fractions that are converted into fuels must pass through so-called hydrofiners, removing the sulphur content.
Crude oil can be measured in a number of different ways. Production and distribution companies commonly measure crude oil in barrels (bbl). In SI units 1 bbl is 0.158983 m³. While measuring by volume is useful, oil can also be measured as a source of energy. The energy unit used is Barrels of Oil Equiv-alent (BOE), which denotes the amount of energy contained in one barrel of crude oil. An energy unit by weight is also used – this is called Ton of Oil Equivalent (TOE).
BASIC INFORMATION ABOUT OIL AND GAS
Table 2.1 – Typical approximate characteristics and properties and gasoline potential of various crudes (representative average numbers).
Crude Source Paraffins(% vol)
Aromatics(% vol)
Naphthenes(% wt)
Sulfur(approx.)
API gravity(% vol)
OctaneNo
Naphtha Yield(typical)
Nigerian-LightSaudi-LightSaudi-HeavyVenezuela-LightVenezuela-LightUSA-Midcont. SweetUSA-W. Texas SourNorth Sea-Brent
3763603552-4650
919151214-2216
5418255334-3234
0.222.12.31.50.41.90.4
3634283024403237
282223218-3331
6040356050-5550
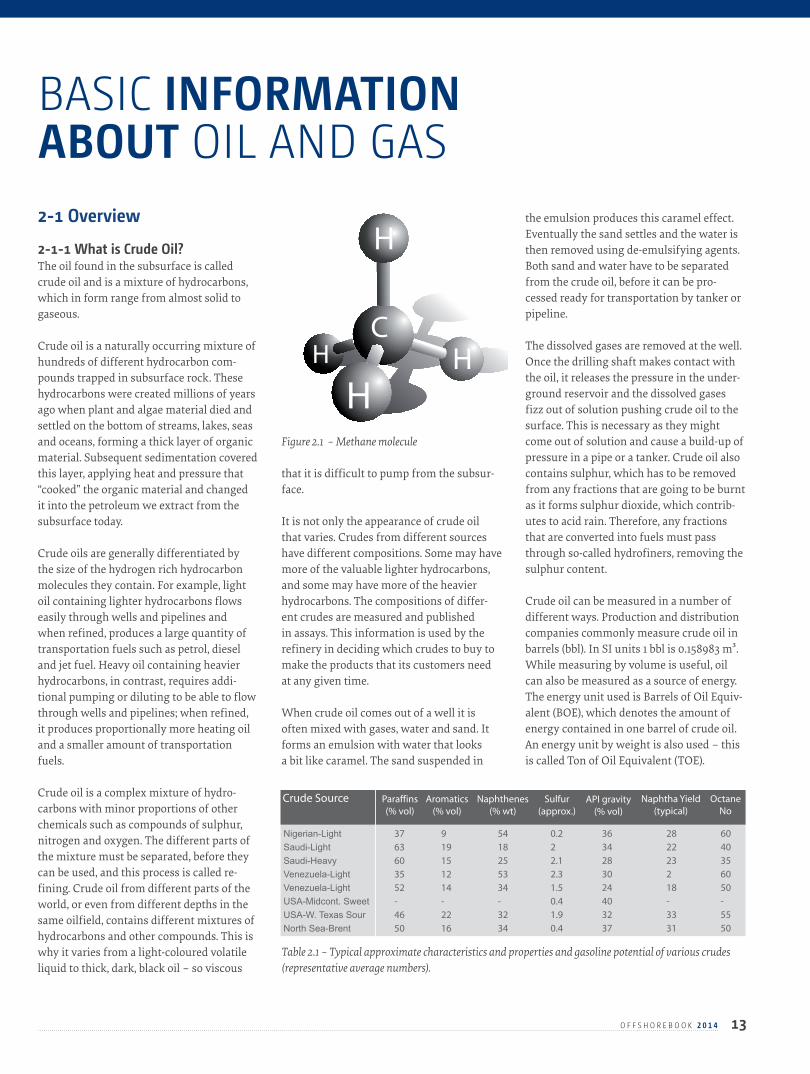
Figure 2.1 – Methane molecule

14 O F F S H O R E B O O K 2 0 1 4
2-1-2 What is Natural Gas?Natural gas is a combustible mixture of small-molecule hydrocarbons. These are made of atoms of carbon and hydrogen. For example, natural gas used in the home is mainly methane, which is a molecule made up of one carbon atom and four hydrogen atoms, and is referred to as CH4.
While natural gas is formed primarily of methane, it can also include ethane, propane and butane. The composition of natural gas can vary widely. Table 2.2 outlines the typical makeup of natural gas before it is refined.
No mixture can be referred to as natural gas as each gas stream has its own composition. Even two gas wells from the same reservoir may have different constituents. Natural gas in its purest form, such as the natural gas that is delivered to your home, is almost pure methane. It is considered “dry” when it is almost pure methane, having had most of the other commonly associated hydrocar-bons removed. When other hydrocarbons are present, natural gas is “wet”.
Natural gas is a vital component of the world’s supply of energy. It is one of the cleanest, safest, and most useful of all energy sources. While commonly grouped with other fossil fuels and sources of energy, many characteristics of natural gas make it unique.
In itself, it might be considered uninter-esting – it is colourless, shapeless, and odourless in its pure form. Uninteresting – except that natural gas is combustible, and when it is burned it gives off a great deal of energy and, unlike other fossil fuels, is clean emitting lower levels of potentially harmful by-products into the air. We require energy constantly, to heat our homes, cook our food,
and generate our electricity. This need for energy has given natural gas its importance in our society and in our lives.
Natural gas has many uses, residentially, commercially, and industrially. Found in reservoirs underneath the earth, natural gas is commonly associated with oil deposits. Production companies search for evidence of these reservoirs using sophisticated tech-nology that helps to locate natural gas and drill wells in the earth at possible sites.
Natural gas can be measured in a number of different ways. Measured at normal temperatures and pressures the volume is expressed in normal cubic metres (Nm³). “Normal” denotes a temperature of 0°C and a pressure of 1 atm. Production and distribu-tion companies commonly measure natural gas in thousands cubic metres (McM), mil-lions of cubic metres (MMcM), or trillions of cubic metres (TcM).
While measuring by volume is useful, natu-ral gas can also be measured by its calorific content. The energy oil units BOE and TOE can also be used for gas and denotes the amount of gas corresponding to one BOE or one TOE. One bbl of crude oil corresponds to approx. six Mcf of natural gas.
2-2 Formation of Oil and Gas
2-2-1 How is oil and gas formed?Crude oil was generated over millions of years from the remains of tiny plants and animals that became incorporated into muddy sediments. Subsequent deposition of sediment caused the organic-rich “source rock” layer to be buried ever deeper and exposed to increasing temperatures. With increasing temperature first heavy then light oil was formed from the organic mate-rial, and finally gas.
Organic material deposited in sediments during the Jurassic and Cretaceous geologi-cal ages 180 to 65 million years ago (the time of the dinosaurs) generated most of the oil we find in the North Sea today.
There are three essential elements in the creation of a crude oil and gas field:
1) The existence of a “source rock” – The geologic history of such a rock enabled the formation of crude oil. This usually is of engrained shale, rich in organic matter.
2) The generated oil or gas move (“migrate”) into a permeable layer called a reservoir. Reservoirs typically consist of sandstones and limestone. Once inside the reser-voir buoyancy will move the oil and gas upwards. The oldest oil-bearing rocks date back more than 600 million years; the youngest, about 1 million, most oil fields have been found in rocks between 10 million and 270 million years old (In Denmark typically it is 65+ million years old).
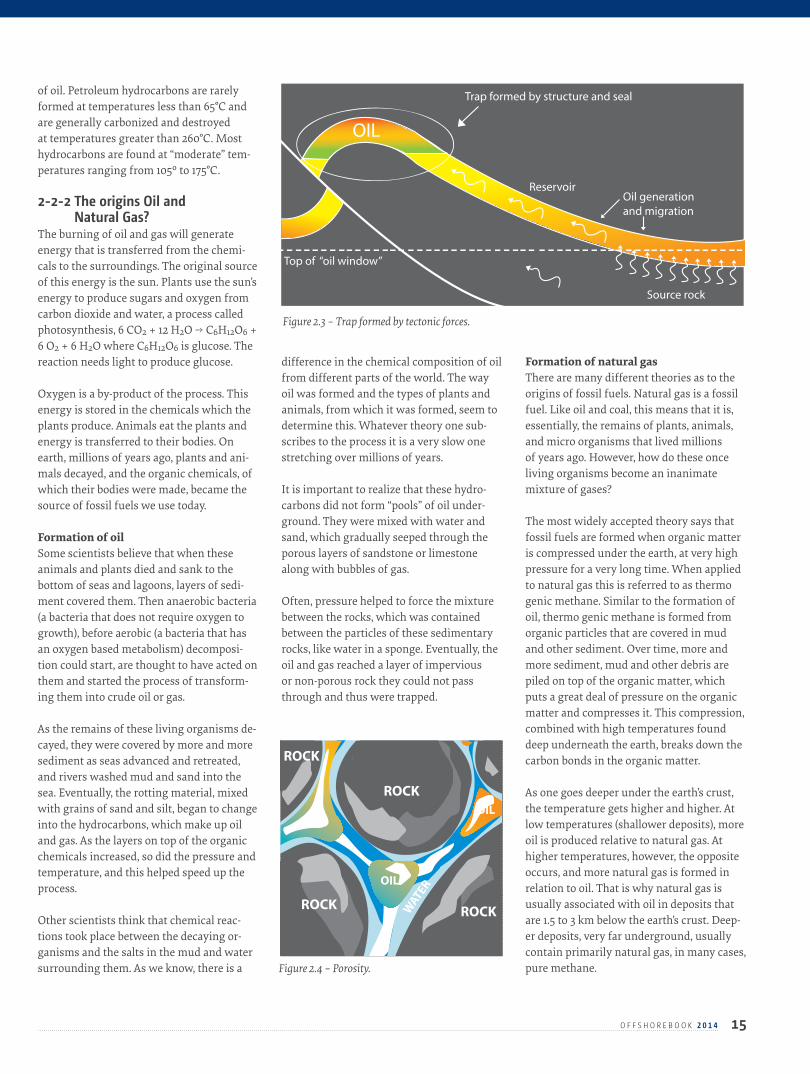
3) A “trap” is required to capture the oil or gas. The trap prevents the oil from escap-ing the reservoir by way of its shape and organization of rock types. Usually it in-volves a non-permeable layer on top that acts as a seal. Traps are generally formed by tectonic forces, that either break the continuity of the reservoir (“fault”) or buckle it (“fold”). Never the less, there are many different types of traps. See figure 2.3
The oldest oil-bearing rocks date back more than 600 million years – the most recent, about 1 million years. Most oil fields have been found in rocks that are between 10 and 270 million years old. Most Danish oil fields are about 60 million years old.
Subsurface temperature, which increases with depth, is a critical factor in the creation Table 2.2 – Typical contents of natural gas.
Typical Composition of Natural Gas
Methane CH4 70-90% Ethane C2H6 Propane C3H8 Butane C4H10
0-20%
Carbon Dioxide CO2 0-8% Oxygen O2 0-0.2% Nitrogen N2 0-5% Hydrogen sulphide H2S 0-5% Rare gases A, He, Ne, Xe trace
Figure 2.2 – Diatoms - examples of plankton types.
of oil. Petroleum hydrocarbons are rarely formed at temperatures less than 65°C and are generally carbonized and destroyed at temperatures greater than 260°C. Most hydrocarbons are found at “moderate” tem-peratures ranging from 105º to 175°C.
2-2-2 The origins Oil and Natural Gas?
The burning of oil and gas will generate energy that is transferred from the chemi-cals to the surroundings. The original source of this energy is the sun. Plants use the sun’s energy to produce sugars and oxygen from carbon dioxide and water, a process called photosynthesis, 6 CO2 + 12 H2O _> C6H12O6 + 6 O2 + 6 H2O where C6H12O6 is glucose. The reaction needs light to produce glucose.
Oxygen is a by-product of the process. This energy is stored in the chemicals which the plants produce. Animals eat the plants and energy is transferred to their bodies. On earth, millions of years ago, plants and ani-mals decayed, and the organic chemicals, of which their bodies were made, became the source of fossil fuels we use today.
Formation of oilSome scientists believe that when these animals and plants died and sank to the bottom of seas and lagoons, layers of sedi-ment covered them. Then anaerobic bacteria (a bacteria that does not require oxygen to growth), before aerobic (a bacteria that has an oxygen based metabolism) decomposi-tion could start, are thought to have acted on them and started the process of transform-ing them into crude oil or gas.
As the remains of these living organisms de-cayed, they were covered by more and more sediment as seas advanced and retreated, and rivers washed mud and sand into the sea. Eventually, the rotting material, mixed with grains of sand and silt, began to change into the hydrocarbons, which make up oil and gas. As the layers on top of the organic chemicals increased, so did the pressure and temperature, and this helped speed up the process.
Other scientists think that chemical reac-tions took place between the decaying or-ganisms and the salts in the mud and water surrounding them. As we know, there is a
difference in the chemical composition of oil from different parts of the world. The way oil was formed and the types of plants and animals, from which it was formed, seem to determine this. Whatever theory one sub-scribes to the process it is a very slow one stretching over millions of years.
It is important to realize that these hydro-carbons did not form “pools” of oil under-ground. They were mixed with water and sand, which gradually seeped through the porous layers of sandstone or limestone along with bubbles of gas.
Often, pressure helped to force the mixture between the rocks, which was contained between the particles of these sedimentary rocks, like water in a sponge. Eventually, the oil and gas reached a layer of impervious or non-porous rock they could not pass through and thus were trapped.
Formation of natural gasThere are many different theories as to the origins of fossil fuels. Natural gas is a fossil fuel. Like oil and coal, this means that it is, essentially, the remains of plants, animals, and micro organisms that lived millions of years ago. However, how do these once living organisms become an inanimate mixture of gases?
The most widely accepted theory says that fossil fuels are formed when organic matter is compressed under the earth, at very high pressure for a very long time. When applied to natural gas this is referred to as thermo genic methane. Similar to the formation of oil, thermo genic methane is formed from organic particles that are covered in mud and other sediment. Over time, more and more sediment, mud and other debris are piled on top of the organic matter, which puts a great deal of pressure on the organic matter and compresses it. This compression, combined with high temperatures found deep underneath the earth, breaks down the carbon bonds in the organic matter.
As one goes deeper under the earth’s crust, the temperature gets higher and higher. At low temperatures (shallower deposits), more oil is produced relative to natural gas. At higher temperatures, however, the opposite occurs, and more natural gas is formed in relation to oil. That is why natural gas is usually associated with oil in deposits that are 1.5 to 3 km below the earth’s crust. Deep-er deposits, very far underground, usually contain primarily natural gas, in many cases, pure methane.
15O F F S H O R E B O O K 2 0 1 4
OIL
Trap formed by structure and seal
Source rock
Oil generation and migration
Reservoir
Top of “oil window”
Figure 2.3 – Trap formed by tectonic forces.
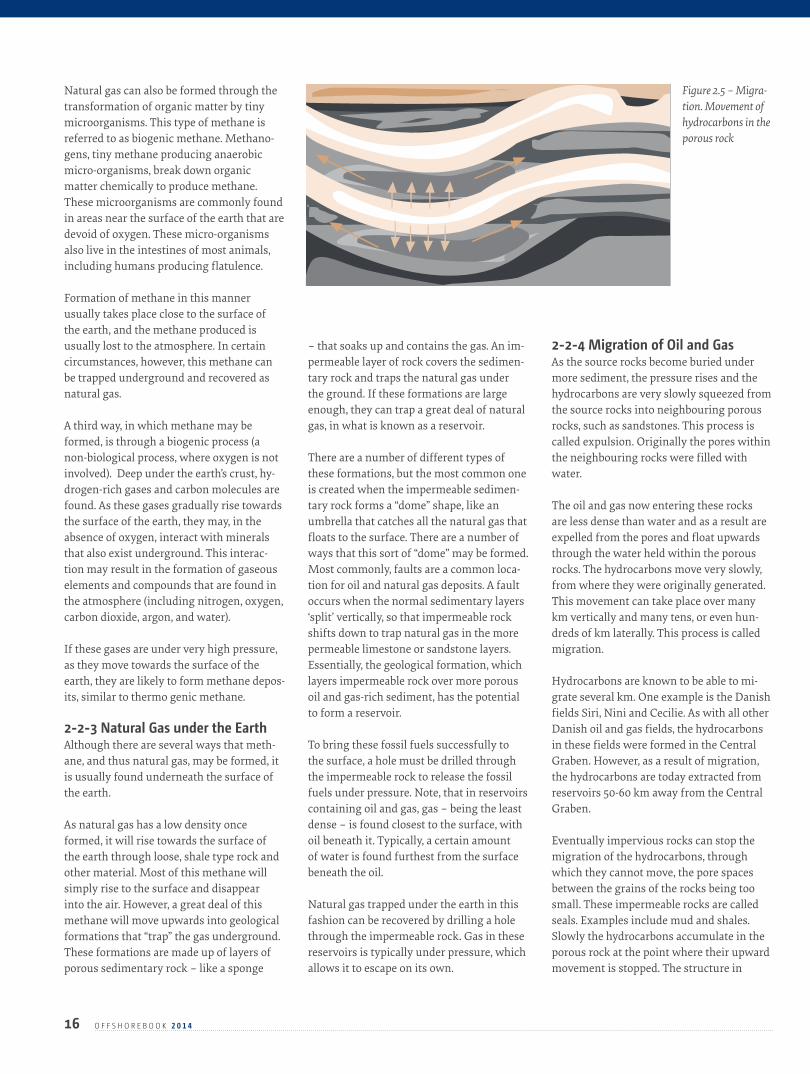
Figure 2.4 – Porosity.
ROCK
ROCK
ROCK
ROCK
OIL
OIL
OIL
WATER
16 O F F S H O R E B O O K 2 0 1 4
Natural gas can also be formed through the transformation of organic matter by tiny microorganisms. This type of methane is referred to as biogenic methane. Methano-gens, tiny methane producing anaerobic micro-organisms, break down organic matter chemically to produce methane. These microorganisms are commonly found in areas near the surface of the earth that are devoid of oxygen. These micro-organisms also live in the intestines of most animals, including humans producing flatulence.
Formation of methane in this manner usually takes place close to the surface of the earth, and the methane produced is usually lost to the atmosphere. In certain circumstances, however, this methane can be trapped underground and recovered as natural gas.
A third way, in which methane may be formed, is through a biogenic process (a non-biological process, where oxygen is not involved). Deep under the earth’s crust, hy-drogen-rich gases and carbon molecules are found. As these gases gradually rise towards the surface of the earth, they may, in the absence of oxygen, interact with minerals that also exist underground. This interac-tion may result in the formation of gaseous elements and compounds that are found in the atmosphere (including nitrogen, oxygen, carbon dioxide, argon, and water).
If these gases are under very high pressure, as they move towards the surface of the earth, they are likely to form methane depos-its, similar to thermo genic methane.
2-2-3 Natural Gas under the EarthAlthough there are several ways that meth-ane, and thus natural gas, may be formed, it is usually found underneath the surface of the earth.
As natural gas has a low density once formed, it will rise towards the surface of the earth through loose, shale type rock and other material. Most of this methane will simply rise to the surface and disappear into the air. However, a great deal of this methane will move upwards into geological formations that “trap” the gas underground. These formations are made up of layers of porous sedimentary rock – like a sponge
– that soaks up and contains the gas. An im-permeable layer of rock covers the sedimen-tary rock and traps the natural gas under the ground. If these formations are large enough, they can trap a great deal of natural gas, in what is known as a reservoir.
There are a number of different types of these formations, but the most common one is created when the impermeable sedimen-tary rock forms a “dome” shape, like an umbrella that catches all the natural gas that floats to the surface. There are a number of ways that this sort of “dome” may be formed. Most commonly, faults are a common loca-tion for oil and natural gas deposits. A fault occurs when the normal sedimentary layers ‘split’ vertically, so that impermeable rock shifts down to trap natural gas in the more permeable limestone or sandstone layers. Essentially, the geological formation, which layers impermeable rock over more porous oil and gas-rich sediment, has the potential to form a reservoir.
To bring these fossil fuels successfully to the surface, a hole must be drilled through the impermeable rock to release the fossil fuels under pressure. Note, that in reservoirs containing oil and gas, gas – being the least dense – is found closest to the surface, with oil beneath it. Typically, a certain amount of water is found furthest from the surface beneath the oil.
Natural gas trapped under the earth in this fashion can be recovered by drilling a hole through the impermeable rock. Gas in these reservoirs is typically under pressure, which allows it to escape on its own.
2-2-4 Migration of Oil and GasAs the source rocks become buried under more sediment, the pressure rises and the hydrocarbons are very slowly squeezed from the source rocks into neighbouring porous rocks, such as sandstones. This process is called expulsion. Originally the pores within the neighbouring rocks were filled with water.
The oil and gas now entering these rocks are less dense than water and as a result are expelled from the pores and float upwards through the water held within the porous rocks. The hydrocarbons move very slowly, from where they were originally generated. This movement can take place over many km vertically and many tens, or even hun-dreds of km laterally. This process is called migration.
Hydrocarbons are known to be able to mi-grate several km. One example is the Danish fields Siri, Nini and Cecilie. As with all other Danish oil and gas fields, the hydrocarbons in these fields were formed in the Central Graben. However, as a result of migration, the hydrocarbons are today extracted from reservoirs 50-60 km away from the Central Graben.
Eventually impervious rocks can stop the migration of the hydrocarbons, through which they cannot move, the pore spaces between the grains of the rocks being too small. These impermeable rocks are called seals. Examples include mud and shales. Slowly the hydrocarbons accumulate in the porous rock at the point where their upward movement is stopped. The structure in
Figure 2.5 – Migra-tion. Movement of hydrocarbons in the porous rock
17O F F S H O R E B O O K 2 0 1 4
which the hydrocarbons accumulate is called a trap, and the porous rock in which the hy-drocarbons are trapped is called a reservoir. It must be stressed that these reservoirs are not huge subterranean lakes of oil, but areas of porous rocks holding the oil or gas within their pores as in a sponge.Reservoirs can contain any combination of oil and gas: oil with no gas, gas with no oil or both gas and oil together. Because gas is less dense than oil, it rises to the top of the res-ervoir, while oil, being the heavier, remains at the base. When discovered, and once an estimate has been made of the size and value of the trapped hydrocarbons, the accumula-tion is usually called a field.
The crude oils and natural gases within each field are unique. Some crude oils are black, heavy and thick like tar, while others are pale and flow very much like water. Natural gases also vary a lot. Some are almost iden-tical to those we burn in our central heating boilers or cookers. Others are higher energy gases, which we use as building blocks for petrochemical products.
Of the hydrocarbons that are formed in the source rock, only a small percentage is trapped. Most seep away and may some-times form oil seepages with thick black pools or tarry deposits on the surface of the land or on the seabed. These seepages are important indicators of the presence of subsurface hydrocarbons and can help geologists in their search for previously undiscovered oil and gas fields.Natural gas is normally found in the same reservoirs as crude oil and today, because the
world’s demand for natural gas is growing faster than that for oil, energy companies are extremely eager to find and develop gas fields wherever they can be profitably exploited and marketed.
2-3 Oil and Gas Characteristics
2-3-1 Chemical Composition of OilCrude oils and refined petroleum products consist largely of hydrocarbons, which are chemicals composed solely of hydrogen and carbon in various molecular arrangements. Crude oils contain hundreds of different hydrocarbons as well as inorganic substanc-
es including sulphur, nitrogen, and oxygen, as well as metals such as iron, vanadium, nickel, and chromium. Collectively, these other atoms are called heteroatoms.
Certain heavy crude oils from more recent geologic formations contain less than 50% hydrocarbons and a higher proportion of organic and inorganic substances containing heteroatoms. The refining process removes many of the chemicals containing these. All crudes contain lighter fractions similar to petrol as well as heavier tar or wax constit-uents, and may vary in consistency from a light volatile fluid to a semi-solid.
Petroleum products used for engine fuels are essentially a complex mixture of hydro-carbons. Petrol is a mixture of hydrocarbons that contain 4 to 12 carbon atoms and have boiling points between 30°C and 210°C. Kero-senes used for jet fuel contain hydrocarbons with 10 to 16 carbon atoms and have boiling points between 150°C and 240°C. Diesel fuels and the low-grade heavy bunkering fuels contain hydrocarbons with higher numbers of carbon atoms and higher boiling points. In addition, diesel fuels and bunkering fuels have greater proportions of compounds containing heteroatoms.
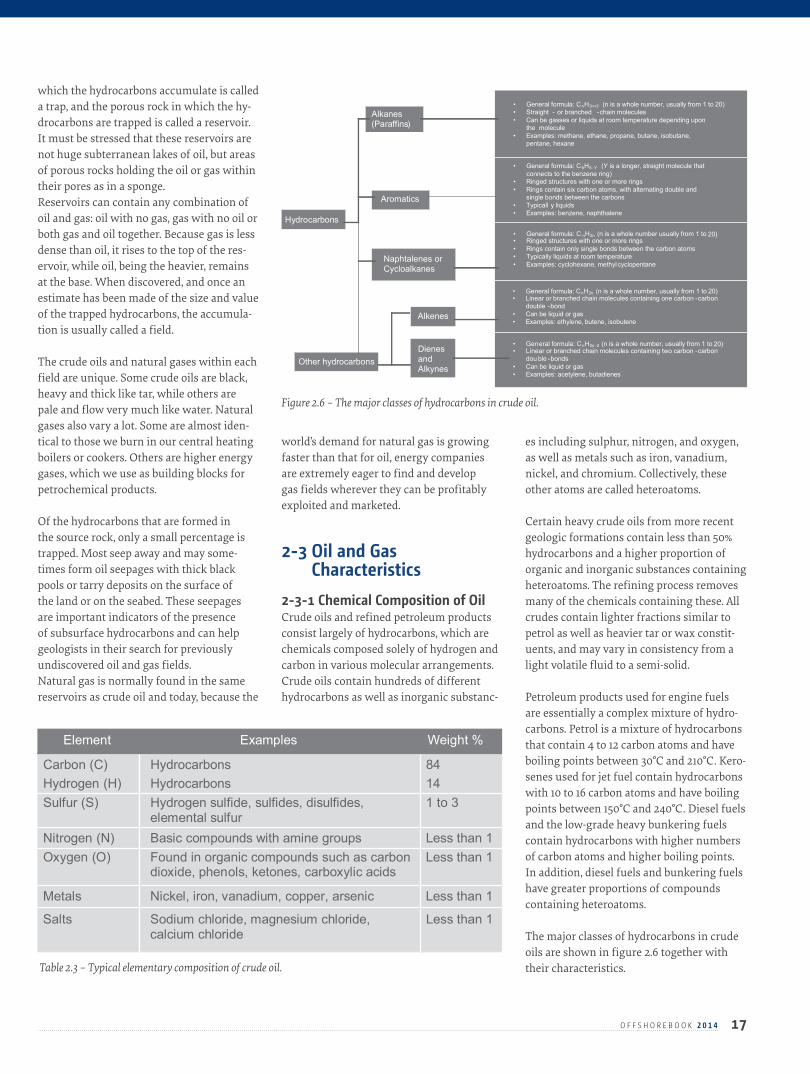
The major classes of hydrocarbons in crude oils are shown in figure 2.6 together with their characteristics.
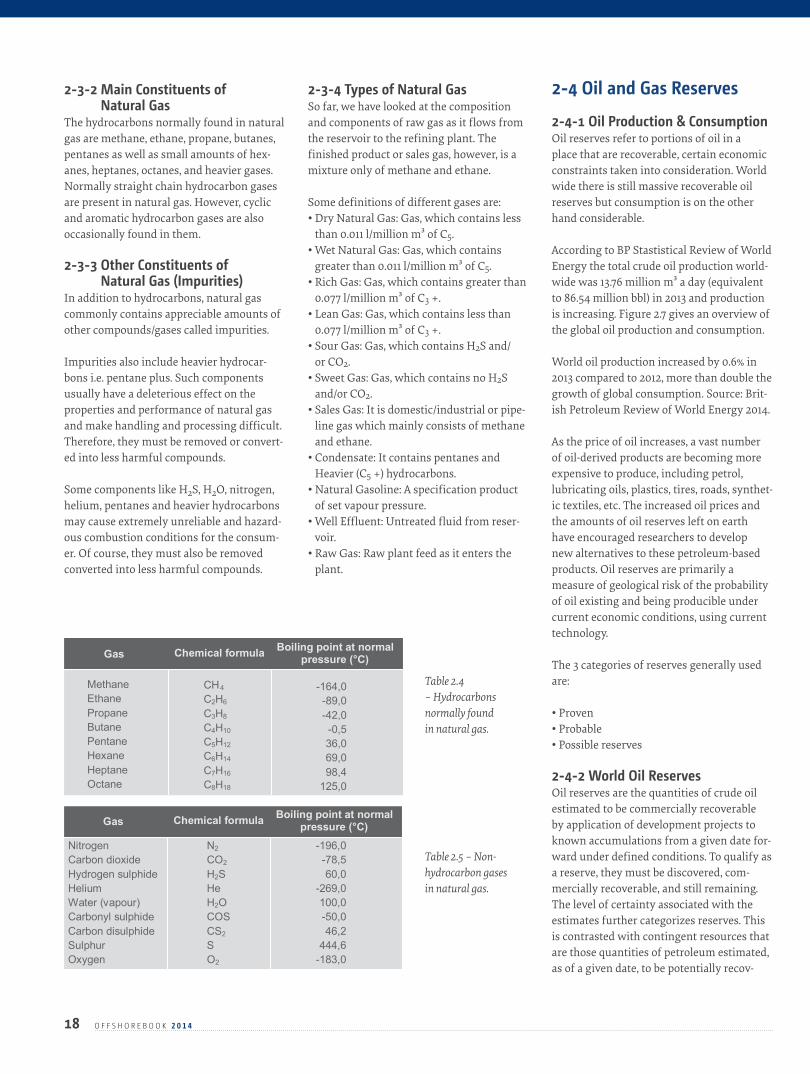
Element Examples Weight %
Carbon (C) Hydrocarbons 84 Hydrogen (H) Hydrocarbons 14 Sulfur (S) Hydrogen sulfide, sulfides, disulfides,
elemental sulfur 1 to 3
Nitrogen (N) Basic compounds with amine groups Less than 1 Oxygen (O) Found in organic compounds such as carbon
dioxide, phenols, ketones, carboxylic acids Less than 1
Metals
Nickel, iron, vanadium, copper, arsenic
Less than 1
Salts
Sodium chloride, magnesium chloride, calcium chloride
Less than 1
Figure 2.6 – The major classes of hydrocarbons in crude oil.
Hydrocarbons
Alkanes (Paraffins)
• General formula: CnH2n+2 (n is a whole number, usually from 1 to 20) • Straight - or branched -chain molecules
• Can be gasses or liquids at room temperature depending upon the molecule
• Examples: methane, ethane, propane, butane, isobutane, pentane, hexane
Naphtalenes or Cycloalkanes
Aromatics
• General formula: C6H5 - Y (Y is a longer, straight molecule that connects to the benzene ring)
• Ringed structures with one or more rings • Rings contain six carbon atoms, with alternating double and
single bonds between the carbons • Typicall y liquids • Examples: benzene, naphthalene
• General formula: C nH2n (n is a whole number usually from 1 to 20)
• Ringed structures with one or more rings • Rings contain only single bonds between the carbon atoms • Typically liquids at room temperature • Examples: cyclohexane, methyl cyclopentane
• General formula: CnH2n (n is a whole number, usually from 1 to 20) • Linear or branched chain molecules containing one carbon -carbon
double -bond • Can be liquid or gas • Examples: ethylene, butene, isobutene
Other hydrocarbons
Alkenes
Dienes and Alkynes
• General formula: CnH2n -2 (n is a whole number, usually from 1 to 20) • Linear or branched chain molecules containing two carbon -carbon
dou ble -bonds • Can be liquid or gas • Examples: acetylene, butadienes
Table 2.3 – Typical elementary composition of crude oil.
18 O F F S H O R E B O O K 2 0 1 4
2-3-2 Main Constituents of Natural Gas
The hydrocarbons normally found in natural gas are methane, ethane, propane, butanes, pentanes as well as small amounts of hex-anes, heptanes, octanes, and heavier gases. Normally straight chain hydrocarbon gases are present in natural gas. However, cyclic and aromatic hydrocarbon gases are also occasionally found in them.
2-3-3 Other Constituents of Natural Gas (Impurities)
In addition to hydrocarbons, natural gas commonly contains appreciable amounts of other compounds/gases called impurities.
Impurities also include heavier hydrocar-bons i.e. pentane plus. Such components usually have a deleterious effect on the properties and performance of natural gas and make handling and processing difficult. Therefore, they must be removed or convert-ed into less harmful compounds.
Some components like H2S, H2O, nitrogen, helium, pentanes and heavier hydrocarbons may cause extremely unreliable and hazard-ous combustion conditions for the consum-er. Of course, they must also be removed converted into less harmful compounds.
2-3-4 Types of Natural GasSo far, we have looked at the composition and components of raw gas as it flows from the reservoir to the refining plant. The finished product or sales gas, however, is a mixture only of methane and ethane.
Some definitions of different gases are:• Dry Natural Gas: Gas, which contains less
than 0.011 l/million m³ of C5.• Wet Natural Gas: Gas, which contains
greater than 0.011 l/million m³ of C5.• Rich Gas: Gas, which contains greater than
0.077 l/million m³ of C3 +.• Lean Gas: Gas, which contains less than
0.077 l/million m³ of C3 +.• Sour Gas: Gas, which contains H2S and/
or CO2.• Sweet Gas: Gas, which contains no H2S
and/or CO2.• Sales Gas: It is domestic/industrial or pipe-
line gas which mainly consists of methane and ethane.
• Condensate: It contains pentanes and Heavier (C5 +) hydrocarbons.
• Natural Gasoline: A specification product of set vapour pressure.
• Well Effluent: Untreated fluid from reser-voir.
• Raw Gas: Raw plant feed as it enters the plant.
2-4 Oil and Gas Reserves 2-4-1 Oil Production & ConsumptionOil reserves refer to portions of oil in a place that are recoverable, certain economic constraints taken into consideration. World wide there is still massive recoverable oil reserves but consumption is on the other hand considerable.
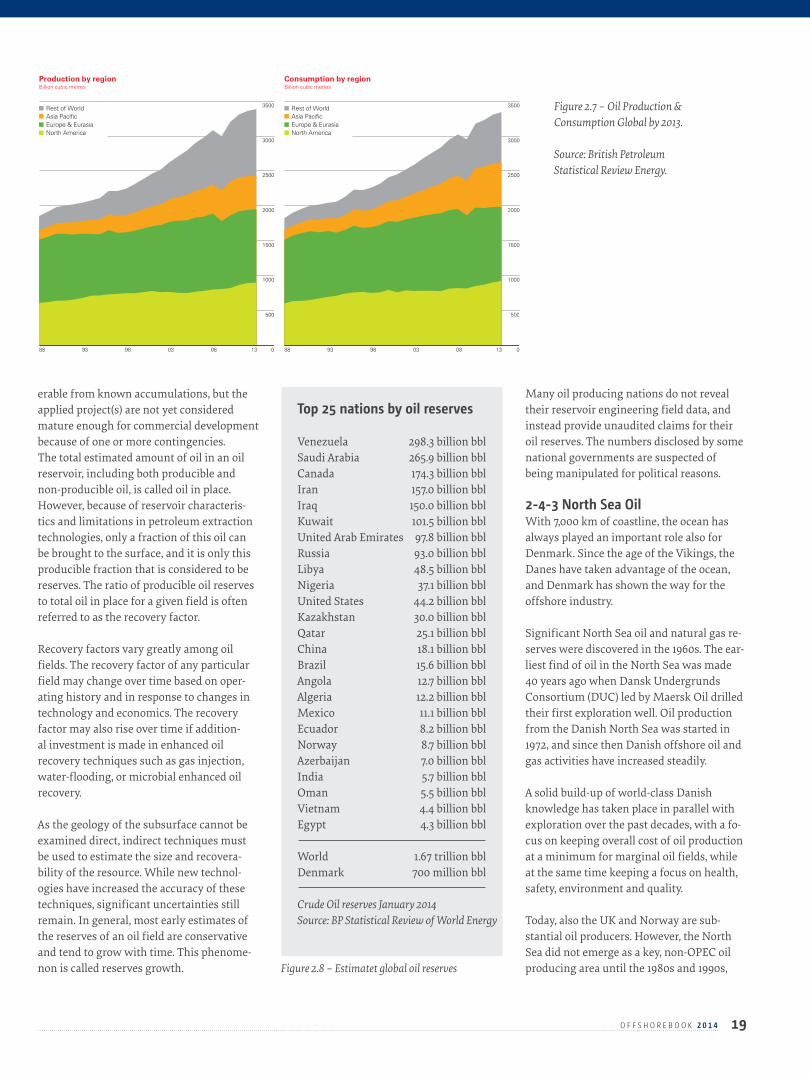
According to BP Stastistical Review of World Energy the total crude oil production world-wide was 13.76 million m³ a day (equivalent to 86.54 million bbl) in 2013 and production is increasing. Figure 2.7 gives an overview of the global oil production and consumption.
World oil production increased by 0.6% in 2013 compared to 2012, more than double the growth of global consumption. Source: Brit-ish Petroleum Review of World Energy 2014.
As the price of oil increases, a vast number of oil-derived products are becoming more expensive to produce, including petrol, lubricating oils, plastics, tires, roads, synthet-ic textiles, etc. The increased oil prices and the amounts of oil reserves left on earth have encouraged researchers to develop new alternatives to these petroleum-based products. Oil reserves are primarily a measure of geological risk of the probability of oil existing and being producible under current economic conditions, using current technology.
The 3 categories of reserves generally used are:
• Proven• Probable• Possible reserves
2-4-2 World Oil ReservesOil reserves are the quantities of crude oil estimated to be commercially recoverable by application of development projects to known accumulations from a given date for-ward under defined conditions. To qualify as a reserve, they must be discovered, com-mercially recoverable, and still remaining. The level of certainty associated with the estimates further categorizes reserves. This is contrasted with contingent resources that are those quantities of petroleum estimated, as of a given date, to be potentially recov-
Gas Chemical formula Boiling point at normal
pressure (°C)
MethaneEthane PropaneButane PentaneHexaneHeptaneOctane
CH4 C2H6 C3H8 C4H10 C5H12 C6H14 C7H16 C8H18
-164,0-89,0-42,0-0,536,069,098,4
125,0
Gas Chemical formula Boiling point at normal
pressure (°C)
Nitrogen Carbon dioxide Hydrogen sulphideHelium Water (vapour) Carbonyl sulphide Carbon disulphide Sulphur Oxygen
N2 CO2 H2S He H2O COS CS2 S O2
-196,0-78,560,0
-269,0100,0-50,046,2
444,6-183,0
Table 2.4 – Hydrocarbons normally found in natural gas.
Table 2.5 – Non- hydrocarbon gases in natural gas.
19O F F S H O R E B O O K 2 0 1 4
erable from known accumulations, but the applied project(s) are not yet considered mature enough for commercial development because of one or more contingencies.The total estimated amount of oil in an oil reservoir, including both producible and non-producible oil, is called oil in place. However, because of reservoir characteris-tics and limitations in petroleum extraction technologies, only a fraction of this oil can be brought to the surface, and it is only this producible fraction that is considered to be reserves. The ratio of producible oil reserves to total oil in place for a given field is often referred to as the recovery factor.
Recovery factors vary greatly among oil fields. The recovery factor of any particular field may change over time based on oper-ating history and in response to changes in technology and economics. The recovery factor may also rise over time if addition-al investment is made in enhanced oil recovery techniques such as gas injection, water-flooding, or microbial enhanced oil recovery.
As the geology of the subsurface cannot be examined direct, indirect techniques must be used to estimate the size and recovera-bility of the resource. While new technol-ogies have increased the accuracy of these techniques, significant uncertainties still remain. In general, most early estimates of the reserves of an oil field are conservative and tend to grow with time. This phenome-non is called reserves growth.
Many oil producing nations do not reveal their reservoir engineering field data, and instead provide unaudited claims for their oil reserves. The numbers disclosed by some national governments are suspected of being manipulated for political reasons.
2-4-3 North Sea OilWith 7,000 km of coastline, the ocean has always played an important role also for Denmark. Since the age of the Vikings, the Danes have taken advantage of the ocean, and Denmark has shown the way for the offshore industry.
Significant North Sea oil and natural gas re-serves were discovered in the 1960s. The ear-liest find of oil in the North Sea was made 40 years ago when Dansk Undergrunds Consortium (DUC) led by Maersk Oil drilled their first exploration well. Oil production from the Danish North Sea was started in 1972, and since then Danish offshore oil and gas activities have increased steadily.
A solid build-up of world-class Danish knowledge has taken place in parallel with exploration over the past decades, with a fo-cus on keeping overall cost of oil production at a minimum for marginal oil fields, while at the same time keeping a focus on health, safety, environment and quality.
Today, also the UK and Norway are sub-stantial oil producers. However, the North Sea did not emerge as a key, non-OPEC oil producing area until the 1980s and 1990s,
Figure 2.7 – Oil Production & Consumption Global by 2013.
Source: British Petroleum Statistical Review Energy.
26
0
3500
2500
3000
500
1500
1000
2000
Rest of World Asia Pacific Europe & Eurasia North America
88 9893 0803 13
Production by regionBillion cubic metres
World natural gas production increased by 1.1% in 2013, slightly below the growth rate of global consumption (+1.4%). Production growth was below average in all regions except Europe & Eurasia. Russia (+2.4%) and China (+9.5%) recorded the largest growth increments. Consumption growth was below average in all regions except North America. China (+10.8%) and the US (+2.4%) recorded the largest growth increments.
0
3500
2500
3000
500
1500
1000
2000
Rest of World Asia Pacific Europe & Eurasia North America
88 9893 0803 13
Consumption by regionBillion cubic metres
Consumption per capita 2013Tonnes oil equivalent
0-0.50.5-1.0 1.0-1.51.5-2.0> 2.0
Source: Includes data from Cedigaz.
Figure 2.8 – Estimatet global oil reserves
Top 25 nations by oil reserves
Venezuela 298.3 billion bblSaudi Arabia 265.9 billion bblCanada 174.3 billion bblIran 157.0 billion bbl Iraq 150.0 billion bbl Kuwait 101.5 billion bbl United Arab Emirates 97.8 billion bbl Russia 93.0 billion bbl Libya 48.5 billion bbl Nigeria 37.1 billion bbl United States 44.2 billion bbl Kazakhstan 30.0 billion bbl Qatar 25.1 billion bbl China 18.1 billion bbl Brazil 15.6 billion bblAngola 12.7 billion bblAlgeria 12.2 billion bbl Mexico 11.1 billion bblEcuador 8.2 billion bbl Norway 8.7 billion bbl Azerbaijan 7.0 billion bbl India 5.7 billion bbl Oman 5.5 billion bbl Vietnam 4.4 billion bbl Egypt 4.3 billion bbl
World 1.67 trillion bbl Denmark 700 million bbl
Crude Oil reserves January 2014Source: BP Statistical Review of World Energy
20 O F F S H O R E B O O K 2 0 1 4
when major projects came into operation. Oil and natural gas extraction in the North Sea’s inhospitable climate and great depths requires sophisticated offshore technolo-gy. Consequently, the region is a relatively high-cost producer, but its political stability and proximity to major European consumer markets have allowed it to play a major role on world oil and natural gas markets.The North Sea will continue to be a sizable crude oil producer for many years to come, although output from its largest produc-ers – the UK and Norway – has essentially reached a plateau and is projected to begin a long-term decline. In the near future, im-proved oil recovery technologies, continued high oil prices and new projects coming online is expected to delay substantial de-clines in output. Discoveries of new sizable volumes of oil will be welcome in the future, to delay or even revert a downward trend in oil production.
With regards to natural gas, the North Sea is seen as a mature region. However, Norway and Holland have seen an increase in natural gas production in recent years, while the UK is likely to become a net gas importer in the near future. The importance of the North Sea as a key supplier of natural gas will con-tinue as consumption in Europe is predicted to increase significantly in the future.
2-4-3-1 North Sea Oil Licensing5 countries operate with North Sea produc-tion. The 5 countries operate a tax and royal-ty licensing regime. Median lines agreed in the late 1960s divide the respective sectors:
• Denmark: – The Danish sector is adminis-tered by the Danish Energy Authority. Sec-tors are divided into 1-degree-by-1-degree quadrants, blocks 10 minutes latitude by 15 minutes longitude. Part blocks exist where partial relinquishments have taken place
• United Kingdom: – Licenses are admin-istered by the DTI (Department of Trade and Industry). The UKCS (United King-dom Continence Society) is divided into quadrants of 1-degree latitude by 1-degree longitude. Each quad consists of 30 blocks measuring 10 minutes of latitude by 12 minutes of longitude each. Some blocks are divided further into part blocks where relinquishments by previous licensees have taken place. For example, block 13/24a is the 24th block in quad 13, and is a part block. The UK government has traditional-ly issued licenses via periodic (now annual) licensing rounds. The participants are awarded blocks based on their work-pro-gram bid. The UK DTI has been very active in attracting new entrants to the UKCS via Promote licensing rounds and the fallow
acreage initiative where non-active licenses have had to be relinquished.
• Norway – licenses are administered by the NPD (Norwegian Petroleum Directorate). The NCS (Norwegian Continental Shelf) is also divided into quads of 1-degree by 1-degree. Norwegian license blocks are larger than British blocks, being 15 minutes latitude by 20 minutes longitude (12 blocks per quad). Like Britain there are numerous part blocks formed by relicensing relin-quished acreage.
• Germany – Germany and the Netherlands share a quadrant and block grid – quad-rants are given letters rather than num-bers. The blocks are 10 minutes latitude by 20 minutes longitude. Germany has the smallest sector in the North Sea.
• Netherlands – The Dutch sector is located in the Southern Gas Basin and shares a grid pattern with Germany.
2-4-3-2 Reserves and Production in the North Sea
The North Sea contains the majority of Europe’s oil reserves and is one of the largest non-OPEC producing regions in the world. While most reserves belong to the United Kingdom, Norway and Denmark, some fields belong to the Netherlands and Germany.
Most oil companies in Europe have invest-ments in the North Sea. At its peak in 1999, production of North Sea oil was nearly 950,000 m³ per day, while natural gas pro-duction was nearly 280 million Nm³ in 2001.
Brent crude (one of the earliest crude oils produced in the North Sea) is still used today as a standard reference for pricing oil.
2-4-3-3 Future ProductionSince the 1970s North Sea oil has not only been a major source of wealth for the econ-omies of the major producers in the North Sea (Norway, UK and Denmark), but has also been a way for Europe to cut its dependence on Middle East oil. With severe wind gusts and waves 30 m high, the North Sea has been one of the most challenging areas for oil exploration and recovery. Hence a huge pool of experience has been accumulated
Offshore Oil Fields in the North Sea
Offshore Gas Fields in the North Sea
Figure 2.9 – Offshore Oil and gas fields in the North Sea.
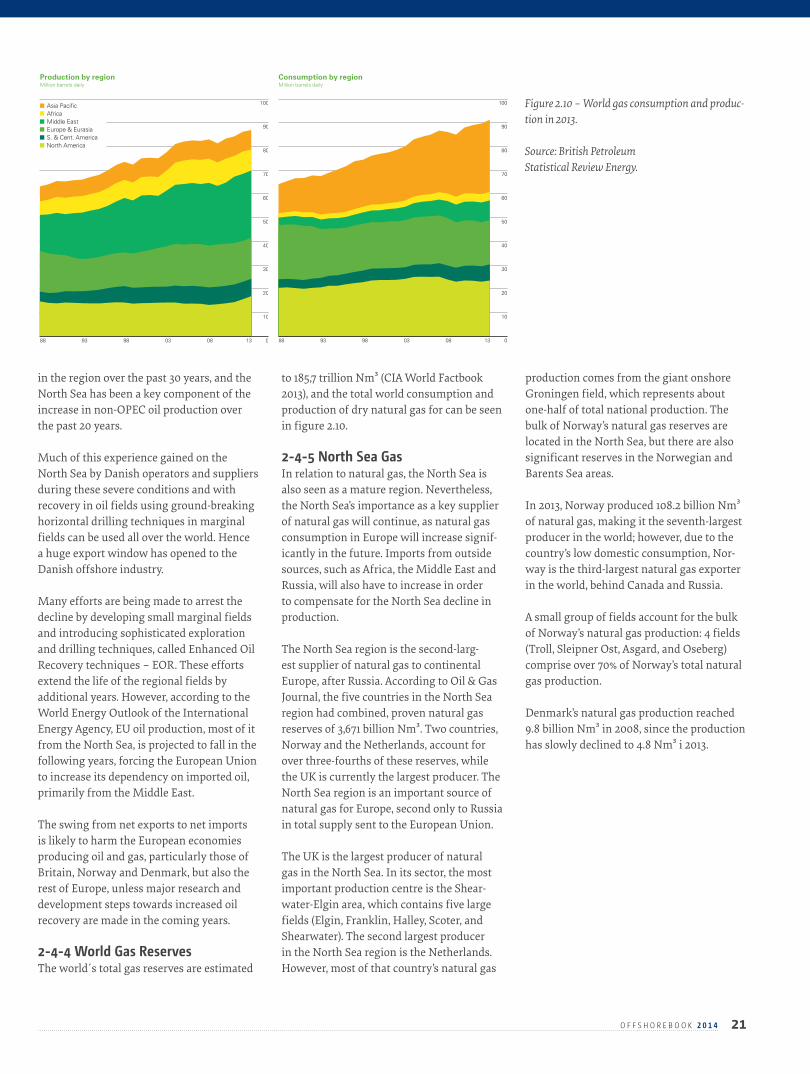
21O F F S H O R E B O O K 2 0 1 4
in the region over the past 30 years, and the North Sea has been a key component of the increase in non-OPEC oil production over the past 20 years.
Much of this experience gained on the North Sea by Danish operators and suppliers during these severe conditions and with recovery in oil fields using ground-breaking horizontal drilling techniques in marginal fields can be used all over the world. Hence a huge export window has opened to the Danish offshore industry.
Many efforts are being made to arrest the decline by developing small marginal fields and introducing sophisticated exploration and drilling techniques, called Enhanced Oil Recovery techniques – EOR. These efforts extend the life of the regional fields by additional years. However, according to the World Energy Outlook of the International Energy Agency, EU oil production, most of it from the North Sea, is projected to fall in the following years, forcing the European Union to increase its dependency on imported oil, primarily from the Middle East.
The swing from net exports to net imports is likely to harm the European economies producing oil and gas, particularly those of Britain, Norway and Denmark, but also the rest of Europe, unless major research and development steps towards increased oil recovery are made in the coming years.
2-4-4 World Gas ReservesThe world´s total gas reserves are estimated
to 185,7 trillion Nm³ (CIA World Factbook 2013), and the total world consumption and production of dry natural gas for can be seen in figure 2.10.
2-4-5 North Sea GasIn relation to natural gas, the North Sea is also seen as a mature region. Nevertheless, the North Sea’s importance as a key supplier of natural gas will continue, as natural gas consumption in Europe will increase signif-icantly in the future. Imports from outside sources, such as Africa, the Middle East and Russia, will also have to increase in order to compensate for the North Sea decline in production.
The North Sea region is the second-larg-est supplier of natural gas to continental Europe, after Russia. According to Oil & Gas Journal, the five countries in the North Sea region had combined, proven natural gas reserves of 3,671 billion Nm³. Two countries, Norway and the Netherlands, account for over three-fourths of these reserves, while the UK is currently the largest producer. The North Sea region is an important source of natural gas for Europe, second only to Russia in total supply sent to the European Union.
The UK is the largest producer of natural gas in the North Sea. In its sector, the most important production centre is the Shear-water-Elgin area, which contains five large fields (Elgin, Franklin, Halley, Scoter, and Shearwater). The second largest producer in the North Sea region is the Netherlands. However, most of that country’s natural gas
production comes from the giant onshore Groningen field, which represents about one-half of total national production. The bulk of Norway’s natural gas reserves are located in the North Sea, but there are also significant reserves in the Norwegian and Barents Sea areas.
In 2013, Norway produced 108.2 billion Nm³ of natural gas, making it the seventh-largest producer in the world; however, due to the country’s low domestic consumption, Nor-way is the third-largest natural gas exporter in the world, behind Canada and Russia.
A small group of fields account for the bulk of Norway’s natural gas production: 4 fields (Troll, Sleipner Ost, Asgard, and Oseberg) comprise over 70% of Norway’s total natural gas production.
Denmark’s natural gas production reached 9.8 billion Nm³ in 2008, since the production has slowly declined to 4.8 Nm³ i 2013.
12
0
100
90
70
80
20
50
40
30
60
10
Asia Pacific Africa Middle East Europe & Eurasia S. & Cent. America North America
88 9893 0803 13 0
100
90
70
80
20
50
40
30
60
10
88 9893 0803 13
Consumption by regionMillion barrels daily
Production by regionMillion barrels daily
World oil production increased by just 550,000 b/d in 2013, less than half the growth of global consumption. Global consumption grew by an above-average 1.4 million b/d, with emerging economies accounting for all of the net increase. Even so, the US had the biggest increase in the world for consumption, as well as production, which grew by 400,000 b/d and 1.1 million b/d respectively. OPEC output fell by 600,000 b/d, driven by a decline of 520,000 b/d in Libya.
Consumption per capita 2013Tonnes
0-0.750.75-1.5 1.5-2.252.25-3.0> 3.0
Figure 2.10 – World gas consumption and produc-tion in 2013.
Source: British Petroleum Statistical Review Energy.

3C H A P T E R
23O F F S H O R E B O O K 2 0 1 4
3-1 What is an Oil and Natural Gas Reservoir?
An oil reservoir or petroleum reservoir is often thought of as being an underground “lake” of oil, but is actually composed of hydrocarbons contained in porous rock formations.
Millions of years ago oil and natural gas were formed from the fossil organic material that settled on the seabed along with sand, silt and rocks. As they settled, layer upon layer accumulated in rivers, along coastlines, and on the bottom of the sea.
Geological shifts resulted in some of these layers being buried deep in the earth. Over time, layers of organic material were compressed by the weight of the sediments above them, and the increasing pressure and temperature transformed the mud, sand, and silt into rock, the organic matter into pe-troleum. The rock containing organic matter is referred to as the source rock.
Over millions of years the oil and gas, which were formed, migrated upwards through tiny, connected pore spaces in the rocks. A certain quantity seeped out onto the surface of the earth. But non-porous rocks or other barriers that would not allow it to migrate further trapped most of the petroleum. These underground oil and gas traps are called reservoirs and are not underground “lakes” of oil, but porous and permeable rocks that can hold significant amounts of oil and gas within their pore spaces. This allows oil and natural gas within them to flow through to a producing well.
Some reservoirs may be only hundreds of meters below the surface of the earth; others are thousands, sometimes tens of thousands of meters underground. Reservoirs in the North Sea are typically found 2-3 km under the seabed, but in 2013 the Dutch operator
Wintershall Noordzee succeeded in finding oil approximately 4431 m below sea level – named Hibonite-1 exploration well.
Most reservoirs contain oil, gas, and water. Gravity acts on these fluids and separates them according to their density, with gas on top, then oil, and finally water. However, oth-er parameters, such as fluid/rock properties and solubility can restrict complete gravi-tational separation. When a well produces fluids from a subsurface reservoir, typically oil and water, and often some gas will be recovered.
The larger subsurface traps are the easiest oil and gas deposits to locate. In mature production areas of the world, most of these large deposits have already been found, with many producing since the 1960s and 1970s.
The oil and gas industry has developed new technologies to identify and gain access to smaller, thinner bands of reservoir rock that may contain oil and gas. Improved seismic techniques have improved the odds of accurately identifying the location of reservoirs that are smaller and more difficult to find. There is still a lot of oil and gas to be discovered and produced, but these future discoveries will be in deeper basins, and in more remote areas of the world. There will also be many small reservoirs found in existing oil and gas-producing areas using advanced technologies.
Technological innovation not only makes it easier to find new deposits of oil and gas, but also enables industry to extract more from each individual reservoir that is discovered. In general this effort to improve existing oil reserves is called Enhaned Oil Recovery – EOR. For example, new drilling techniques have made it feasible to intersect a long, thin reservoir horizontally instead of vertically, enabling oil or gas from the reservoir to be recovered with fewer wells. Also it is possible
to go deeper down into the underground, the so-called High Pressure High Temperature wells.
3-2 Earth Movements The earth was also undergoing change dur-ing forming the oil. Cooling in the centre of the earth resulted in massive movements of the crust, which buckled and folded, layers of rock slid past each other (faulting) or rock salt was forced by the weight of rocks above through the sedimentary rocks with the oil in them. These movements formed the different types of oil traps.
Tectonic movements of the Earth plates have profound effect on hydrocarbon formation, migration, and trapping. They are subdivided on convergent (collision of the plates) and divergent (separation of the plates) processes. The collisions between continental plates lead to the formation of the oil and gas fields in the Persian Gulf, South Caspian and Ural-Timan- Pechora Province.
When oceanic plate submerges under continental, it is called subduction. During long geologic time organic remains were accumulated on the bottom of the ocean. Submerging, the oceanic plate carries huge volumes of organic deposits under conti-nental plate, where at the conditions of high temperature and high pressure, biomass converts to hydrocarbons.
Moving apart, the plates create firstly the zones of spreading, where the thinning of crust occurs in the margin between plates. Further separation (rifting) often is accom-panied by volcanism. In the result of that the increase of temperature also facilitates the conversion of organic remains to the hydro-carbons. The gas and oil fields of the North Sea, West and East Siberia were formed in rifting zones.
RESERVOIR – GEOLOGY AND EXPLORATION
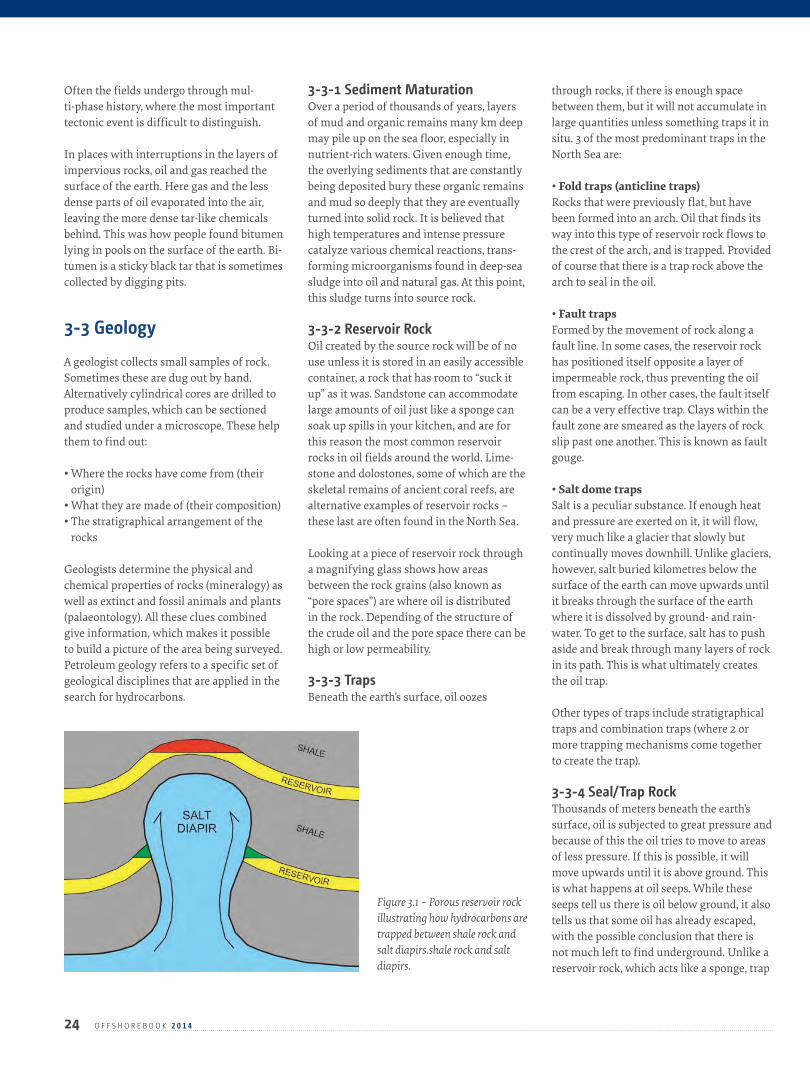
24 O F F S H O R E B O O K 2 0 1 4
Often the fields undergo through mul-ti-phase history, where the most important tectonic event is difficult to distinguish.
In places with interruptions in the layers of impervious rocks, oil and gas reached the surface of the earth. Here gas and the less dense parts of oil evaporated into the air, leaving the more dense tar-like chemicals behind. This was how people found bitumen lying in pools on the surface of the earth. Bi-tumen is a sticky black tar that is sometimes collected by digging pits.
3-3 Geology
A geologist collects small samples of rock. Sometimes these are dug out by hand. Alternatively cylindrical cores are drilled to produce samples, which can be sectioned and studied under a microscope. These help them to find out:
• Where the rocks have come from (their origin)
• What they are made of (their composition)• The stratigraphical arrangement of the
rocks
Geologists determine the physical and chemical properties of rocks (mineralogy) as well as extinct and fossil animals and plants (palaeontology). All these clues combined give information, which makes it possible to build a picture of the area being surveyed. Petroleum geology refers to a specific set of geological disciplines that are applied in the search for hydrocarbons.
3-3-1 Sediment MaturationOver a period of thousands of years, layers of mud and organic remains many km deep may pile up on the sea floor, especially in nutrient-rich waters. Given enough time, the overlying sediments that are constantly being deposited bury these organic remains and mud so deeply that they are eventually turned into solid rock. It is believed that high temperatures and intense pressure catalyze various chemical reactions, trans-forming microorganisms found in deep-sea sludge into oil and natural gas. At this point, this sludge turns into source rock.
3-3-2 Reservoir RockOil created by the source rock will be of no use unless it is stored in an easily accessible container, a rock that has room to “suck it up” as it was. Sandstone can accommodate large amounts of oil just like a sponge can soak up spills in your kitchen, and are for this reason the most common reservoir rocks in oil fields around the world. Lime-stone and dolostones, some of which are the skeletal remains of ancient coral reefs, are alternative examples of reservoir rocks – these last are often found in the North Sea.
Looking at a piece of reservoir rock through a magnifying glass shows how areas between the rock grains (also known as “pore spaces”) are where oil is distributed in the rock. Depending of the structure of the crude oil and the pore space there can be high or low permeability.
3-3-3 TrapsBeneath the earth’s surface, oil oozes
through rocks, if there is enough space between them, but it will not accumulate in large quantities unless something traps it in situ. 3 of the most predominant traps in the North Sea are:
• Fold traps (anticline traps)Rocks that were previously flat, but have been formed into an arch. Oil that finds its way into this type of reservoir rock flows to the crest of the arch, and is trapped. Provided of course that there is a trap rock above the arch to seal in the oil.
• Fault trapsFormed by the movement of rock along a fault line. In some cases, the reservoir rock has positioned itself opposite a layer of impermeable rock, thus preventing the oil from escaping. In other cases, the fault itself can be a very effective trap. Clays within the fault zone are smeared as the layers of rock slip past one another. This is known as fault gouge.
• Salt dome trapsSalt is a peculiar substance. If enough heat and pressure are exerted on it, it will flow, very much like a glacier that slowly but continually moves downhill. Unlike glaciers, however, salt buried kilometres below the surface of the earth can move upwards until it breaks through the surface of the earth where it is dissolved by ground- and rain-water. To get to the surface, salt has to push aside and break through many layers of rock in its path. This is what ultimately creates the oil trap.
Other types of traps include stratigraphical traps and combination traps (where 2 or more trapping mechanisms come together to create the trap).
3-3-4 Seal/Trap RockThousands of meters beneath the earth’s surface, oil is subjected to great pressure and because of this the oil tries to move to areas of less pressure. If this is possible, it will move upwards until it is above ground. This is what happens at oil seeps. While these seeps tell us there is oil below ground, it also tells us that some oil has already escaped, with the possible conclusion that there is not much left to find underground. Unlike a reservoir rock, which acts like a sponge, trap
Figure 3.1 – Porous reservoir rock illustrating how hydrocarbons are trapped between shale rock and salt diapirs.shale rock and salt diapirs.
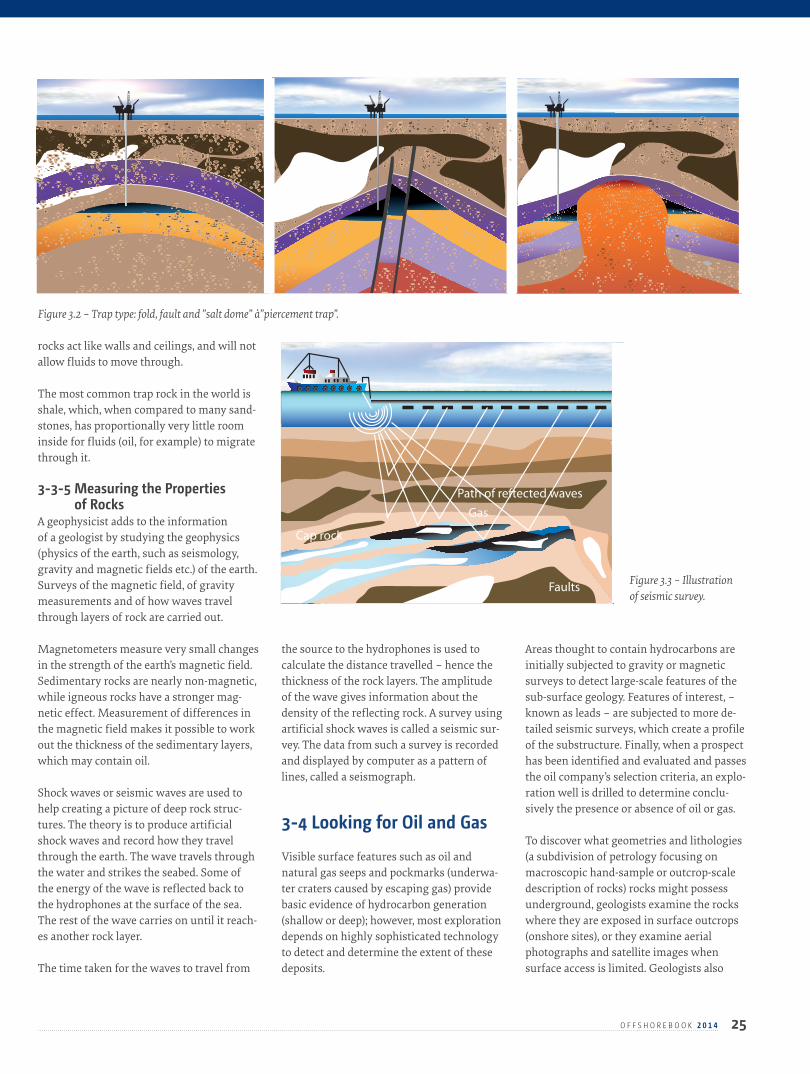
25O F F S H O R E B O O K 2 0 1 4
rocks act like walls and ceilings, and will not allow fluids to move through.
The most common trap rock in the world is shale, which, when compared to many sand-stones, has proportionally very little room inside for fluids (oil, for example) to migrate through it.
3-3-5 Measuring the Properties of Rocks
A geophysicist adds to the information of a geologist by studying the geophysics (physics of the earth, such as seismology, gravity and magnetic fields etc.) of the earth. Surveys of the magnetic field, of gravity measurements and of how waves travel through layers of rock are carried out.
Magnetometers measure very small changes in the strength of the earth’s magnetic field. Sedimentary rocks are nearly non-magnetic, while igneous rocks have a stronger mag-netic effect. Measurement of differences in the magnetic field makes it possible to work out the thickness of the sedimentary layers, which may contain oil.
Shock waves or seismic waves are used to help creating a picture of deep rock struc-tures. The theory is to produce artificial shock waves and record how they travel through the earth. The wave travels through the water and strikes the seabed. Some of the energy of the wave is reflected back to the hydrophones at the surface of the sea. The rest of the wave carries on until it reach-es another rock layer.
The time taken for the waves to travel from
the source to the hydrophones is used to calculate the distance travelled – hence the thickness of the rock layers. The amplitude of the wave gives information about the density of the reflecting rock. A survey using artificial shock waves is called a seismic sur-vey. The data from such a survey is recorded and displayed by computer as a pattern of lines, called a seismograph.
3-4 Looking for Oil and Gas
Visible surface features such as oil and natural gas seeps and pockmarks (underwa-ter craters caused by escaping gas) provide basic evidence of hydrocarbon generation (shallow or deep); however, most exploration depends on highly sophisticated technology to detect and determine the extent of these deposits.
Areas thought to contain hydrocarbons are initially subjected to gravity or magnetic surveys to detect large-scale features of the sub-surface geology. Features of interest, – known as leads – are subjected to more de-tailed seismic surveys, which create a profile of the substructure. Finally, when a prospect has been identified and evaluated and passes the oil company’s selection criteria, an explo-ration well is drilled to determine conclu-sively the presence or absence of oil or gas.
To discover what geometries and lithologies (a subdivision of petrology focusing on macroscopic hand-sample or outcrop-scale description of rocks) rocks might possess underground, geologists examine the rocks where they are exposed in surface outcrops (onshore sites), or they examine aerial photographs and satellite images when surface access is limited. Geologists also
Figure 3.2 – Trap type: fold, fault and ”salt dome” à”piercement trap”.
Faults
Path of reftected waves
Gas
Cap rock
Figure 3.3 – Illustration of seismic survey.
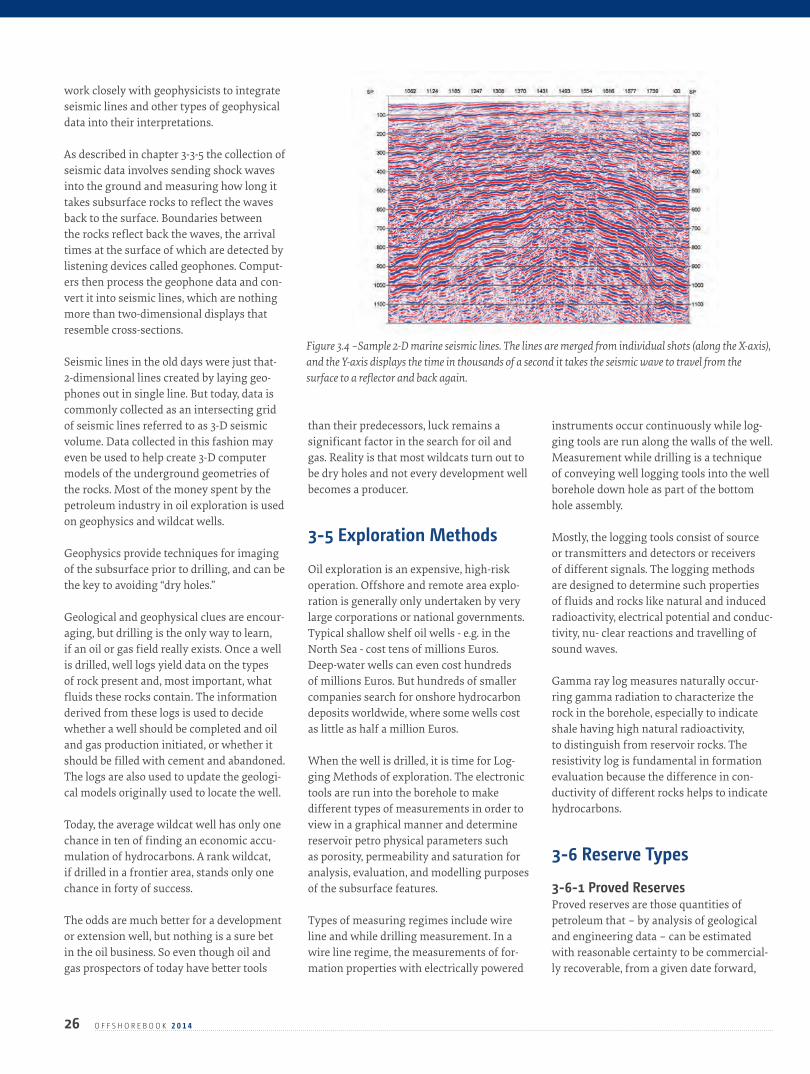
26 O F F S H O R E B O O K 2 0 1 4
work closely with geophysicists to integrate seismic lines and other types of geophysical data into their interpretations.
As described in chapter 3-3-5 the collection of seismic data involves sending shock waves into the ground and measuring how long it takes subsurface rocks to reflect the waves back to the surface. Boundaries between the rocks reflect back the waves, the arrival times at the surface of which are detected by listening devices called geophones. Comput-ers then process the geophone data and con-vert it into seismic lines, which are nothing more than two-dimensional displays that resemble cross-sections.
Seismic lines in the old days were just that- 2-dimensional lines created by laying geo-phones out in single line. But today, data is commonly collected as an intersecting grid of seismic lines referred to as 3-D seismic volume. Data collected in this fashion may even be used to help create 3-D computer models of the underground geometries of the rocks. Most of the money spent by the petroleum industry in oil exploration is used on geophysics and wildcat wells.
Geophysics provide techniques for imaging of the subsurface prior to drilling, and can be the key to avoiding “dry holes.”
Geological and geophysical clues are encour-aging, but drilling is the only way to learn, if an oil or gas field really exists. Once a well is drilled, well logs yield data on the types of rock present and, most important, what fluids these rocks contain. The information derived from these logs is used to decide whether a well should be completed and oil and gas production initiated, or whether it should be filled with cement and abandoned. The logs are also used to update the geologi-cal models originally used to locate the well.
Today, the average wildcat well has only one chance in ten of finding an economic accu-mulation of hydrocarbons. A rank wildcat, if drilled in a frontier area, stands only one chance in forty of success.
The odds are much better for a development or extension well, but nothing is a sure bet in the oil business. So even though oil and gas prospectors of today have better tools
than their predecessors, luck remains a significant factor in the search for oil and gas. Reality is that most wildcats turn out to be dry holes and not every development well becomes a producer.
3-5 Exploration Methods Oil exploration is an expensive, high-risk operation. Offshore and remote area explo-ration is generally only undertaken by very large corporations or national governments. Typical shallow shelf oil wells - e.g. in the North Sea - cost tens of millions Euros. Deep-water wells can even cost hundreds of millions Euros. But hundreds of smaller companies search for onshore hydrocarbon deposits worldwide, where some wells cost as little as half a million Euros.
When the well is drilled, it is time for Log-ging Methods of exploration. The electronic tools are run into the borehole to make different types of measurements in order to view in a graphical manner and determine reservoir petro physical parameters such as porosity, permeability and saturation for analysis, evaluation, and modelling purposes of the subsurface features.
Types of measuring regimes include wire line and while drilling measurement. In a wire line regime, the measurements of for-mation properties with electrically powered
instruments occur continuously while log-ging tools are run along the walls of the well. Measurement while drilling is a technique of conveying well logging tools into the well borehole down hole as part of the bottom hole assembly.
Mostly, the logging tools consist of source or transmitters and detectors or receivers of different signals. The logging methods are designed to determine such properties of fluids and rocks like natural and induced radioactivity, electrical potential and conduc-tivity, nu- clear reactions and travelling of sound waves.
Gamma ray log measures naturally occur-ring gamma radiation to characterize the rock in the borehole, especially to indicate shale having high natural radioactivity, to distinguish from reservoir rocks. The resistivity log is fundamental in formation evaluation because the difference in con-ductivity of different rocks helps to indicate hydrocarbons.
3-6 Reserve Types 3-6-1 Proved ReservesProved reserves are those quantities of petroleum that – by analysis of geological and engineering data – can be estimated with reasonable certainty to be commercial-ly recoverable, from a given date forward,
Figure 3.4 –Sample 2-D marine seismic lines. The lines are merged from individual shots (along the X-axis), and the Y-axis displays the time in thousands of a second it takes the seismic wave to travel from the surface to a reflector and back again.
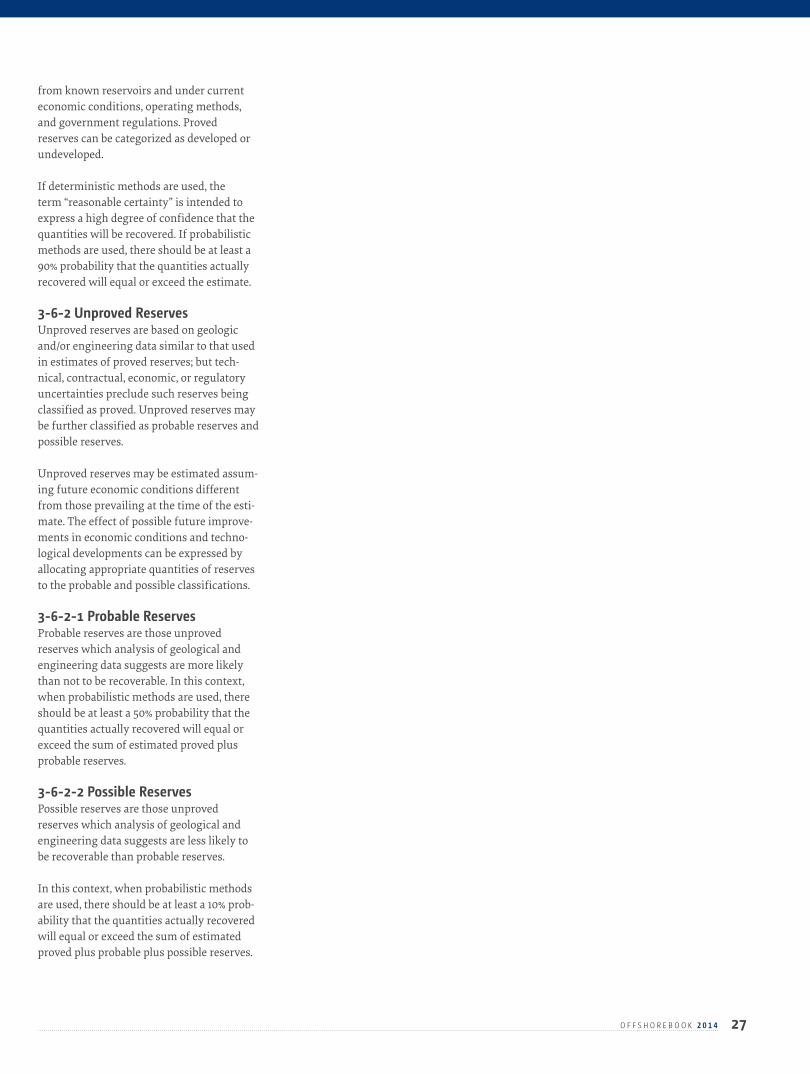
27O F F S H O R E B O O K 2 0 1 4
from known reservoirs and under current economic conditions, operating methods, and government regulations. Proved reserves can be categorized as developed or undeveloped.
If deterministic methods are used, the term “reasonable certainty” is intended to express a high degree of confidence that the quantities will be recovered. If probabilistic methods are used, there should be at least a 90% probability that the quantities actually recovered will equal or exceed the estimate.
3-6-2 Unproved ReservesUnproved reserves are based on geologic and/or engineering data similar to that used in estimates of proved reserves; but tech-nical, contractual, economic, or regulatory uncertainties preclude such reserves being classified as proved. Unproved reserves may be further classified as probable reserves and possible reserves.
Unproved reserves may be estimated assum-ing future economic conditions different from those prevailing at the time of the esti-mate. The effect of possible future improve-ments in economic conditions and techno-logical developments can be expressed by allocating appropriate quantities of reserves to the probable and possible classifications.
3-6-2-1 Probable ReservesProbable reserves are those unproved reserves which analysis of geological and engineering data suggests are more likely than not to be recoverable. In this context, when probabilistic methods are used, there should be at least a 50% probability that the quantities actually recovered will equal or exceed the sum of estimated proved plus probable reserves.
3-6-2-2 Possible ReservesPossible reserves are those unproved reserves which analysis of geological and engineering data suggests are less likely to be recoverable than probable reserves.
In this context, when probabilistic methods are used, there should be at least a 10% prob-ability that the quantities actually recovered will equal or exceed the sum of estimated proved plus probable plus possible reserves.
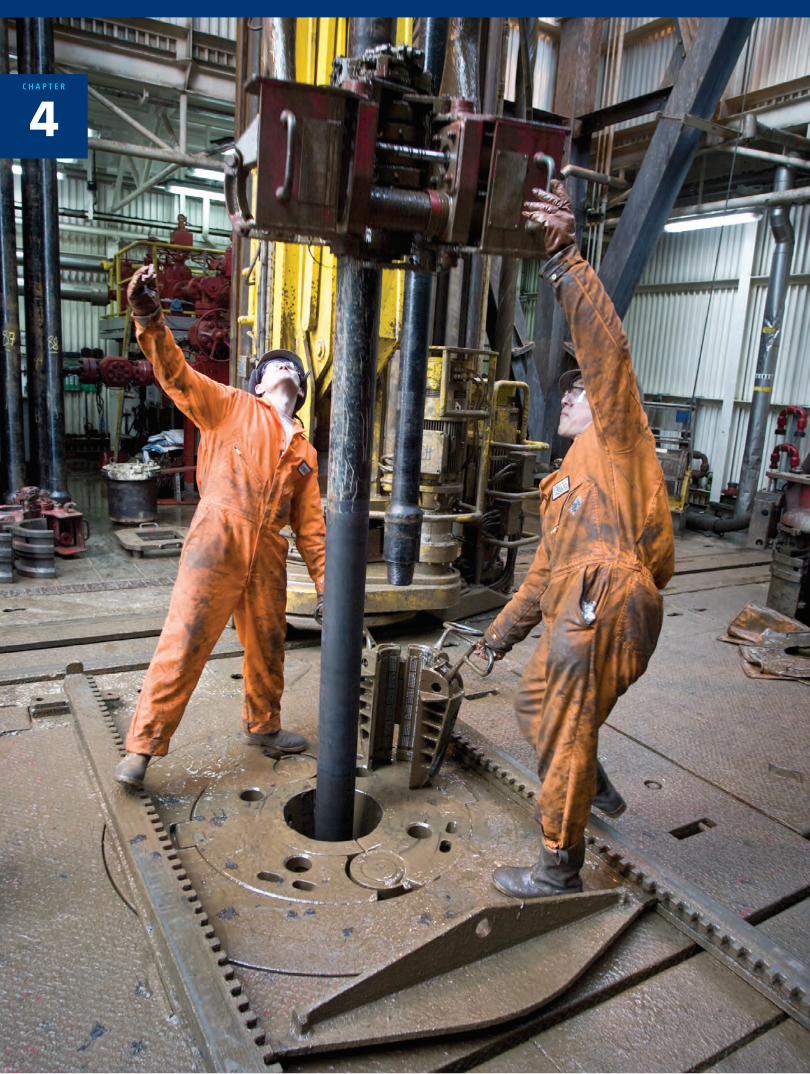
4C H A P T E R
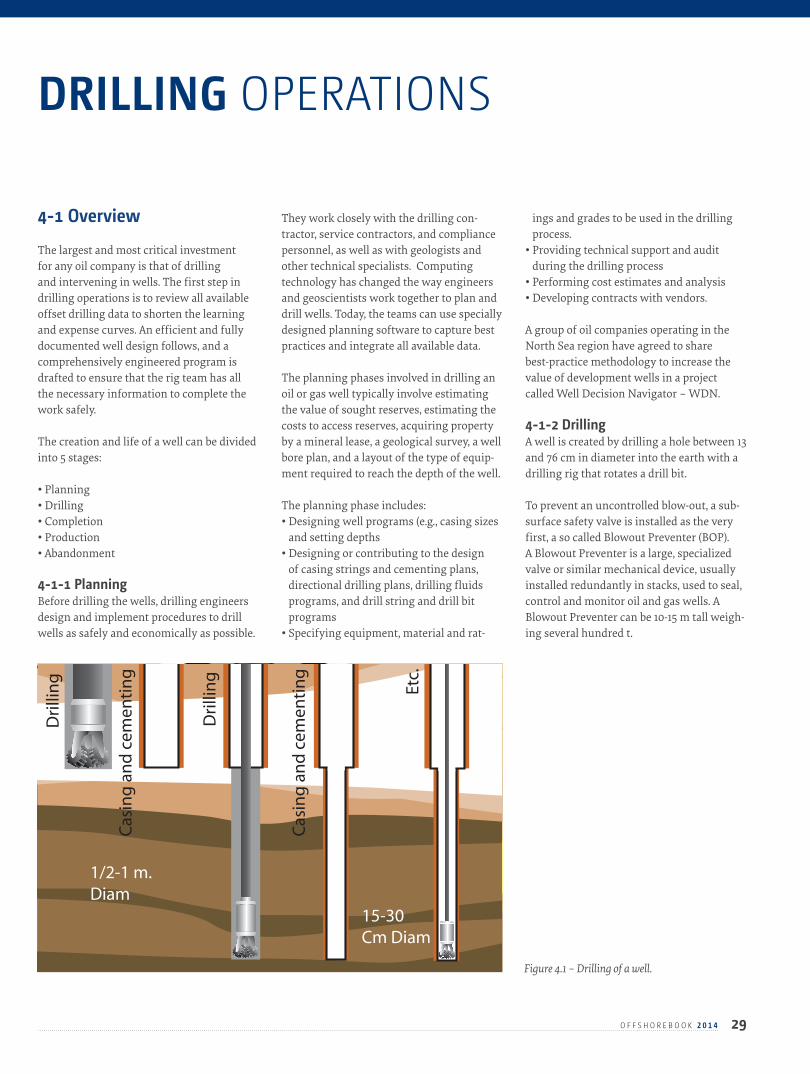
29O F F S H O R E B O O K 2 0 1 4
4-1 Overview The largest and most critical investment for any oil company is that of drilling and intervening in wells. The first step in drilling operations is to review all available offset drilling data to shorten the learning and expense curves. An efficient and fully documented well design follows, and a comprehensively engineered program is drafted to ensure that the rig team has all the necessary information to complete the work safely.
The creation and life of a well can be divided into 5 stages:
• Planning• Drilling• Completion• Production• Abandonment
4-1-1 PlanningBefore drilling the wells, drilling engineers design and implement procedures to drill wells as safely and economically as possible.
They work closely with the drilling con-tractor, service contractors, and compliance personnel, as well as with geologists and other technical specialists. Computing technology has changed the way engineers and geoscientists work together to plan and drill wells. Today, the teams can use specially designed planning software to capture best practices and integrate all available data.
The planning phases involved in drilling an oil or gas well typically involve estimating the value of sought reserves, estimating the costs to access reserves, acquiring property by a mineral lease, a geological survey, a well bore plan, and a layout of the type of equip-ment required to reach the depth of the well.
The planning phase includes:• Designing well programs (e.g., casing sizes
and setting depths• Designing or contributing to the design
of casing strings and cementing plans, directional drilling plans, drilling fluids programs, and drill string and drill bit programs
• Specifying equipment, material and rat-
ings and grades to be used in the drilling process.
• Providing technical support and audit during the drilling process
• Performing cost estimates and analysis• Developing contracts with vendors.
A group of oil companies operating in the North Sea region have agreed to share best-practice methodology to increase the value of development wells in a project called Well Decision Navigator – WDN.
4-1-2 DrillingA well is created by drilling a hole between 13 and 76 cm in diameter into the earth with a drilling rig that rotates a drill bit.
To prevent an uncontrolled blow-out, a sub-surface safety valve is installed as the very first, a so called Blowout Preventer (BOP). A Blowout Preventer is a large, specialized valve or similar mechanical device, usually installed redundantly in stacks, used to seal, control and monitor oil and gas wells. A Blowout Preventer can be 10-15 m tall weigh-ing several hundred t.
DRILLING OPERATIONS
15-30Cm Diam
1/2-1 m.Diam
Dri
llin
g
Cas
ing
an
d c
emen
tin
g
Cas
ing
an
d c
emen
tin
g
Dri
llin
g
Etc.
Figure 4.1 – Drilling of a well.
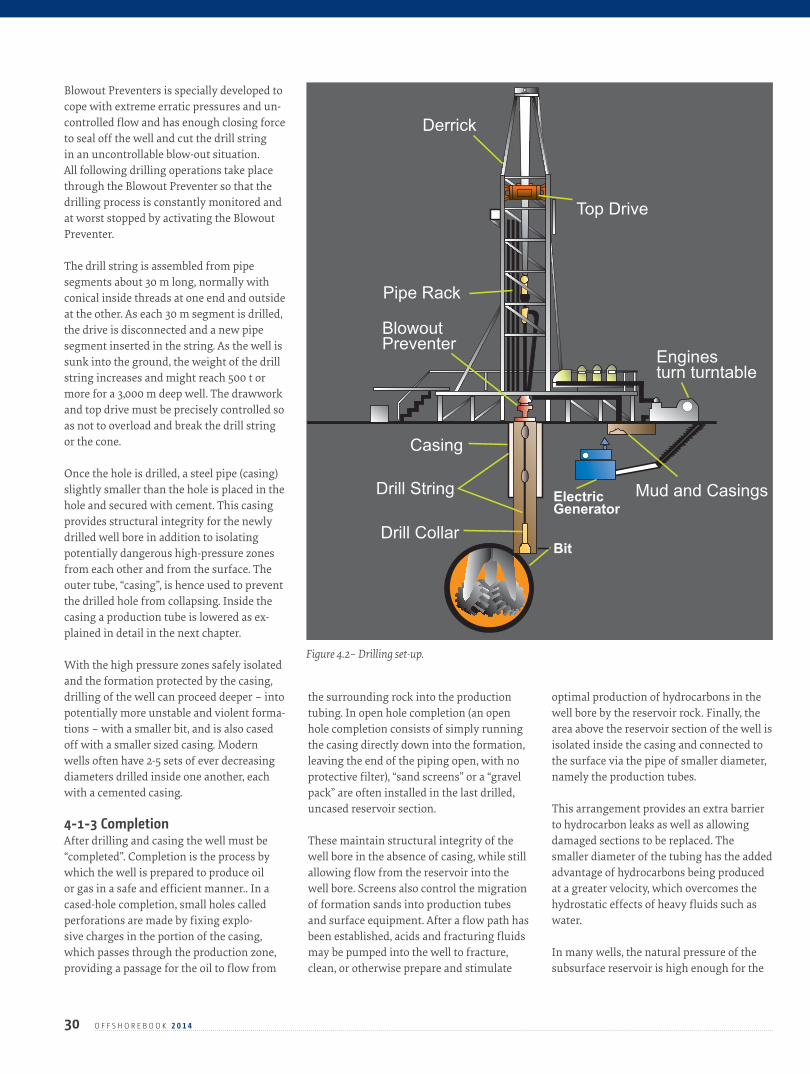
Blowout Preventers is specially developed to cope with extreme erratic pressures and un-controlled flow and has enough closing force to seal off the well and cut the drill string in an uncontrollable blow-out situation. All following drilling operations take place through the Blowout Preventer so that the drilling process is constantly monitored and at worst stopped by activating the Blowout Preventer.
The drill string is assembled from pipe segments about 30 m long, normally with conical inside threads at one end and outside at the other. As each 30 m segment is drilled, the drive is disconnected and a new pipe segment inserted in the string. As the well is sunk into the ground, the weight of the drill string increases and might reach 500 t or more for a 3,000 m deep well. The drawwork and top drive must be precisely controlled so as not to overload and break the drill string or the cone.
Once the hole is drilled, a steel pipe (casing) slightly smaller than the hole is placed in the hole and secured with cement. This casing provides structural integrity for the newly drilled well bore in addition to isolating potentially dangerous high-pressure zones from each other and from the surface. The outer tube, “casing”, is hence used to prevent the drilled hole from collapsing. Inside the casing a production tube is lowered as ex-plained in detail in the next chapter.
With the high pressure zones safely isolated and the formation protected by the casing, drilling of the well can proceed deeper – into potentially more unstable and violent forma-tions – with a smaller bit, and is also cased off with a smaller sized casing. Modern wells often have 2-5 sets of ever decreasing diameters drilled inside one another, each with a cemented casing.
4-1-3 CompletionAfter drilling and casing the well must be “completed”. Completion is the process by which the well is prepared to produce oil or gas in a safe and efficient manner.. In a cased-hole completion, small holes called perforations are made by fixing explo-sive charges in the portion of the casing, which passes through the production zone, providing a passage for the oil to flow from
the surrounding rock into the production tubing. In open hole completion (an open hole completion consists of simply running the casing directly down into the formation, leaving the end of the piping open, with no protective filter), “sand screens” or a “gravel pack” are often installed in the last drilled, uncased reservoir section.
These maintain structural integrity of the well bore in the absence of casing, while still allowing flow from the reservoir into the well bore. Screens also control the migration of formation sands into production tubes and surface equipment. After a flow path has been established, acids and fracturing fluids may be pumped into the well to fracture, clean, or otherwise prepare and stimulate
optimal production of hydrocarbons in the well bore by the reservoir rock. Finally, the area above the reservoir section of the well is isolated inside the casing and connected to the surface via the pipe of smaller diameter, namely the production tubes.
This arrangement provides an extra barrier to hydrocarbon leaks as well as allowing damaged sections to be replaced. The smaller diameter of the tubing has the added advantage of hydrocarbons being produced at a greater velocity, which overcomes the hydrostatic effects of heavy fluids such as water.
In many wells, the natural pressure of the subsurface reservoir is high enough for the
30 O F F S H O R E B O O K 2 0 1 4
Enginesturn turntable
ElectricGenerator
Mud and Casings
Bit
Drill String
Drill Collar
Derrick
BlowoutPreventer
Pipe Rack
Top Drive
Casing
Figure 4.2– Drilling set-up.
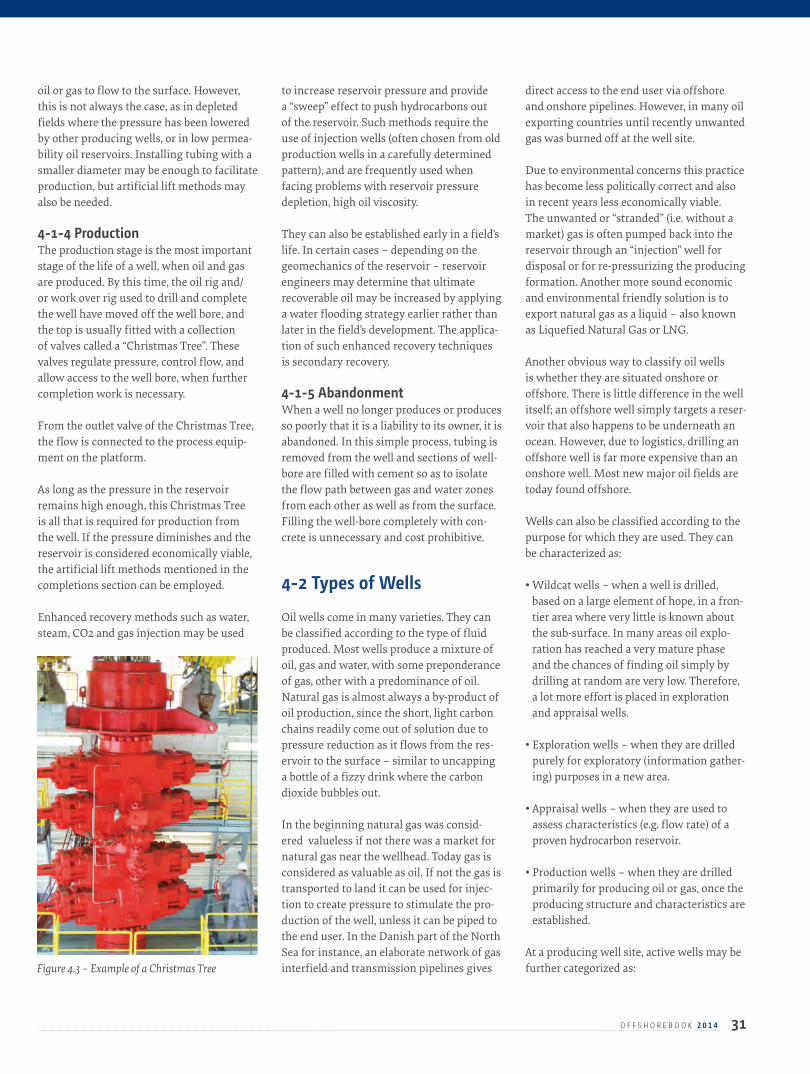
oil or gas to flow to the surface. However, this is not always the case, as in depleted fields where the pressure has been lowered by other producing wells, or in low permea-bility oil reservoirs. Installing tubing with a smaller diameter may be enough to facilitate production, but artificial lift methods may also be needed.
4-1-4 ProductionThe production stage is the most important stage of the life of a well, when oil and gas are produced. By this time, the oil rig and/or work over rig used to drill and complete the well have moved off the well bore, and the top is usually fitted with a collection of valves called a “Christmas Tree”. These valves regulate pressure, control flow, and allow access to the well bore, when further completion work is necessary.
From the outlet valve of the Christmas Tree, the flow is connected to the process equip-ment on the platform.
As long as the pressure in the reservoir remains high enough, this Christmas Tree is all that is required for production from the well. If the pressure diminishes and the reservoir is considered economically viable, the artificial lift methods mentioned in the completions section can be employed.
Enhanced recovery methods such as water, steam, CO2 and gas injection may be used
to increase reservoir pressure and provide a “sweep” effect to push hydrocarbons out of the reservoir. Such methods require the use of injection wells (often chosen from old production wells in a carefully determined pattern), and are frequently used when facing problems with reservoir pressure depletion, high oil viscosity.
They can also be established early in a field’s life. In certain cases – depending on the geomechanics of the reservoir – reservoir engineers may determine that ultimate recoverable oil may be increased by applying a water flooding strategy earlier rather than later in the field’s development. The applica-tion of such enhanced recovery techniques is secondary recovery.
4-1-5 AbandonmentWhen a well no longer produces or produces so poorly that it is a liability to its owner, it is abandoned. In this simple process, tubing is removed from the well and sections of well-bore are filled with cement so as to isolate the flow path between gas and water zones from each other as well as from the surface. Filling the well-bore completely with con-crete is unnecessary and cost prohibitive.
4-2 Types of Wells Oil wells come in many varieties. They can be classified according to the type of fluid produced. Most wells produce a mixture of oil, gas and water, with some preponderance of gas, other with a predominance of oil. Natural gas is almost always a by-product of oil production, since the short, light carbon chains readily come out of solution due to pressure reduction as it flows from the res-ervoir to the surface – similar to uncapping a bottle of a fizzy drink where the carbon dioxide bubbles out.
In the beginning natural gas was consid-ered valueless if not there was a market for natural gas near the wellhead. Today gas is considered as valuable as oil. If not the gas is transported to land it can be used for injec-tion to create pressure to stimulate the pro-duction of the well, unless it can be piped to the end user. In the Danish part of the North Sea for instance, an elaborate network of gas interfield and transmission pipelines gives
direct access to the end user via offshore and onshore pipelines. However, in many oil exporting countries until recently unwanted gas was burned off at the well site.
Due to environmental concerns this practice has become less politically correct and also in recent years less economically viable. The unwanted or “stranded” (i.e. without a market) gas is often pumped back into the reservoir through an “injection” well for disposal or for re-pressurizing the producing formation. Another more sound economic and environmental friendly solution is to export natural gas as a liquid – also known as Liquefied Natural Gas or LNG.
Another obvious way to classify oil wells is whether they are situated onshore or offshore. There is little difference in the well itself; an offshore well simply targets a reser-voir that also happens to be underneath an ocean. However, due to logistics, drilling an offshore well is far more expensive than an onshore well. Most new major oil fields are today found offshore.
Wells can also be classified according to the purpose for which they are used. They can be characterized as:
• Wildcat wells – when a well is drilled, based on a large element of hope, in a fron-tier area where very little is known about the sub-surface. In many areas oil explo-ration has reached a very mature phase and the chances of finding oil simply by drilling at random are very low. Therefore, a lot more effort is placed in exploration and appraisal wells.
• Exploration wells – when they are drilled purely for exploratory (information gather-ing) purposes in a new area.
• Appraisal wells – when they are used to assess characteristics (e.g. flow rate) of a proven hydrocarbon reservoir.
• Production wells – when they are drilled primarily for producing oil or gas, once the producing structure and characteristics are established.
At a producing well site, active wells may be further categorized as:
31O F F S H O R E B O O K 2 0 1 4
Figure 4.3 – Example of a Christmas Tree
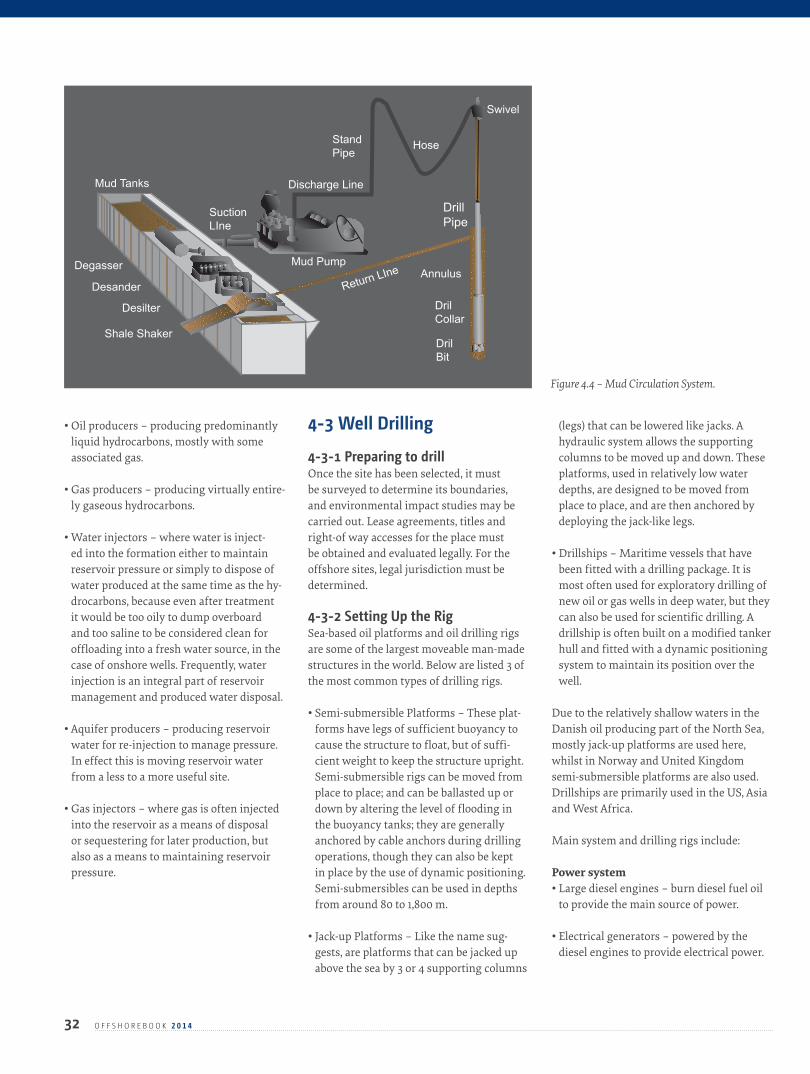
32 O F F S H O R E B O O K 2 0 1 4
• Oil producers – producing predominantly liquid hydrocarbons, mostly with some associated gas.
• Gas producers – producing virtually entire-ly gaseous hydrocarbons.
• Water injectors – where water is inject-ed into the formation either to maintain reservoir pressure or simply to dispose of water produced at the same time as the hy-drocarbons, because even after treatment it would be too oily to dump overboard and too saline to be considered clean for offloading into a fresh water source, in the case of onshore wells. Frequently, water injection is an integral part of reservoir management and produced water disposal.
• Aquifer producers – producing reservoir water for re-injection to manage pressure. In effect this is moving reservoir water from a less to a more useful site.
• Gas injectors – where gas is often injected into the reservoir as a means of disposal or sequestering for later production, but also as a means to maintaining reservoir pressure.
4-3 Well Drilling 4-3-1 Preparing to drillOnce the site has been selected, it must be surveyed to determine its boundaries, and environmental impact studies may be carried out. Lease agreements, titles and right-of way accesses for the place must be obtained and evaluated legally. For the offshore sites, legal jurisdiction must be determined.
4-3-2 Setting Up the RigSea-based oil platforms and oil drilling rigs are some of the largest moveable man-made structures in the world. Below are listed 3 of the most common types of drilling rigs.
• Semi-submersible Platforms – These plat-forms have legs of sufficient buoyancy to cause the structure to float, but of suffi-cient weight to keep the structure upright. Semi-submersible rigs can be moved from place to place; and can be ballasted up or down by altering the level of flooding in the buoyancy tanks; they are generally anchored by cable anchors during drilling operations, though they can also be kept in place by the use of dynamic positioning. Semi-submersibles can be used in depths from around 80 to 1,800 m.
• Jack-up Platforms – Like the name sug-gests, are platforms that can be jacked up above the sea by 3 or 4 supporting columns
(legs) that can be lowered like jacks. A hydraulic system allows the supporting columns to be moved up and down. These platforms, used in relatively low water depths, are designed to be moved from place to place, and are then anchored by deploying the jack-like legs.
• Drillships – Maritime vessels that have been fitted with a drilling package. It is most often used for exploratory drilling of new oil or gas wells in deep water, but they can also be used for scientific drilling. A drillship is often built on a modified tanker hull and fitted with a dynamic positioning system to maintain its position over the well.
Due to the relatively shallow waters in the Danish oil producing part of the North Sea, mostly jack-up platforms are used here, whilst in Norway and United Kingdom semi-submersible platforms are also used. Drillships are primarily used in the US, Asia and West Africa.
Main system and drilling rigs include:
Power system• Large diesel engines – burn diesel fuel oil
to provide the main source of power.
• Electrical generators – powered by the diesel engines to provide electrical power.
Mud Tanks
Degasser
Desander
Desilter
Discharge Line
Hose
DrillPipe
Return LIne
DrilBit
DrilCollar
Annulus
Stand Pipe
Mud Pump
SuctionLIne
Shale Shaker
Swivel
Figure 4.4 – Mud Circulation System.

33O F F S H O R E B O O K 2 0 1 4
• Mechanical system – driven by electric motors.
• Hoisting system – used for lifting heavy loads; consists of a mechanical winch (draw works) with a large steel cable spool, a block-and-tackle pulley and a receiving storage reel for the cable.
• Tot drive – part of the drilling apparatus rotating equipment – used for rotary drilling.
• Swivel – large handle that holds the weight of the drill string; allows the string to rotate and makes a pressure tight seal on the hole.
• Kelly – 4 or 6 sided pipe that transfers rota-ry motion to the turntable and drill string.
• Rotary table – provides the rotating motion using power from electric motors.
• Top Drive – Rotates the drill string either by means of an electrical or hydraulic mo-tor. Replaces the rotary table and the 4 or 6 sided kelly bushing. This is the modern and most common drilling system used today.
• Drill string – consists of a drill pipe made up of connected sections about 10 m each and drill collars (a heavier pipe with a larg-er diameter that fits around the drill pipe and places weight on the drill bit).
• Drill bit(s) – at the end of the drill that actu-ally chisels the rock; come in many shapes and materials (tungsten carbide steel, diamond) and are specialized for various drilling tasks and adapted to specific rock properties.
Circulation system pumps drilling mud (e.g. a mixture of water, clay, weighting material and chemicals, used to lift drill cuttings from the drill bit to the surface) under pres-sure through the drill pipes and drill collars
• Pump – sucks mud from the mud pits and pumps it into the drilling apparatus.
• Pipes and hoses – connect pump to drilling apparatus.
• Mud-return line – returns mud from hole.
• Shale shaker – shaker/sieve that separates rock cuttings from the mud.
• Shale slide – conveys cuttings to transport skips or overboard for disposal.
• Reserve pit – collects drill cuttings separat-ed from the mud.
• Mud pits – where drilling mud is mixed and recycled.
• Mud-mixing hopper – where new mud is mixed and sent to the mud pits.
• Derrick – support structure that holds the drilling apparatus.
• Blowout preventer – a system of high-pres-sure valves. Located under the rotary table/diverter or on the sea floor, it seals the high-pressure drill lines and relieves pressure when necessary to prevent a blowout (uncontrolled gush of gas or oil to the surface).
Central personnel required for operating and overseeing drilling and completion operations as well as a short description of
duties are listed below:• Company Representative: a Company Man
is a representative for the oil company. Other terms that may be used are: Drilling Foreman, Drilling Engineer, Company Con-sultant, or Rig Site Leader. The company man is in direct charge of most operations pertaining to the actual drilling and in-tegrity of the well bore. In the offshore oil and gas business he usually reports to the drilling Superintendent onshore.
• OIM (Oilrig Installation Manager): the OIM is the most senior member of man-agement offshore for the drilling contrac-tor. His main responsibility is the safe operation of the offshore installation.
• Tool pusher: the tool pusher is the person responsible for drilling operations on the drilling rig. Tool pushers are in charge of keeping the rig supplied with all the necessary tools and equipment, supplies, etc. They work closely with the OIM and Company Representative with regards to the actual drilling of the well.
• Tour pusher: Sometimes referred to as the Night pusher and has the same responsibil-ities as the Tool pusher. Reports to the Tool pusher and OIM.
• Driller: The driller is a team leader in charge of drilling the well bore and oper-ating the hoisting equipment. The Driller is in charge of his drill crew, and runs the rig itself. He is responsible for interpret-ing the signals the well sends regarding pressure of gas and fluids. In an emergency situation he is also responsible for taking the correct counter measures to stop an uncontrolled well control situation from emerging. The driller will watch for gas levels, the flow of drilling mud and other information. While tripping out, the driller will run the floor and work the rig.
• Assistant Driller: His general responsibility is to assist the driller by keeping records and paperwork up to date. Training and instructing the floor hands and newly hired personnel. Over time this may allow the assistant driller to qualify for a position as driller.
• Roustabout: A new entrant starts as a
Drill bit
Drill stem
Casing
Cement
Figure 4.5 – Drilling of a well.
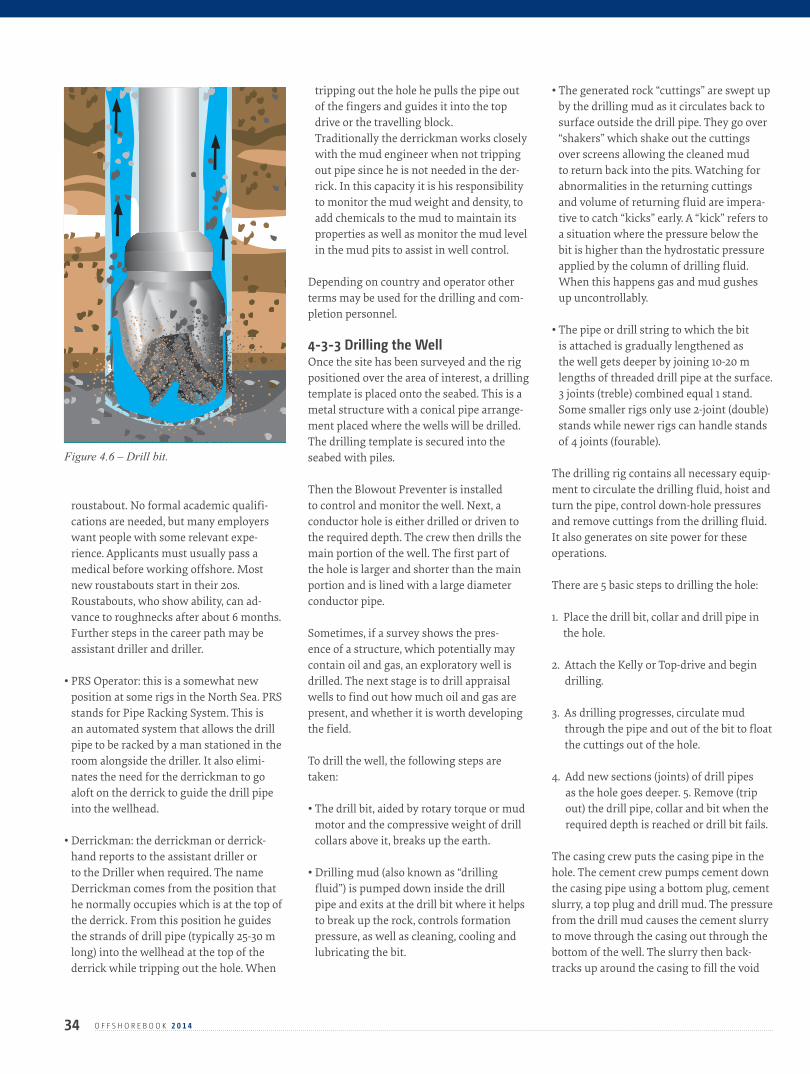
34 O F F S H O R E B O O K 2 0 1 4
roustabout. No formal academic qualifi-cations are needed, but many employers want people with some relevant expe-rience. Applicants must usually pass a medical before working offshore. Most new roustabouts start in their 20s. Roustabouts, who show ability, can ad-vance to roughnecks after about 6 months. Further steps in the career path may be assistant driller and driller.
• PRS Operator: this is a somewhat new position at some rigs in the North Sea. PRS stands for Pipe Racking System. This is an automated system that allows the drill pipe to be racked by a man stationed in the room alongside the driller. It also elimi-nates the need for the derrickman to go aloft on the derrick to guide the drill pipe into the wellhead.
• Derrickman: the derrickman or derrick-hand reports to the assistant driller or to the Driller when required. The name Derrickman comes from the position that he normally occupies which is at the top of the derrick. From this position he guides the strands of drill pipe (typically 25-30 m long) into the wellhead at the top of the derrick while tripping out the hole. When
tripping out the hole he pulls the pipe out of the fingers and guides it into the top drive or the travelling block. Traditionally the derrickman works closely with the mud engineer when not tripping out pipe since he is not needed in the der-rick. In this capacity it is his responsibility to monitor the mud weight and density, to add chemicals to the mud to maintain its properties as well as monitor the mud level in the mud pits to assist in well control.
Depending on country and operator other terms may be used for the drilling and com-pletion personnel.
4-3-3 Drilling the WellOnce the site has been surveyed and the rig positioned over the area of interest, a drilling template is placed onto the seabed. This is a metal structure with a conical pipe arrange-ment placed where the wells will be drilled. The drilling template is secured into the seabed with piles.
Then the Blowout Preventer is installed to control and monitor the well. Next, a conductor hole is either drilled or driven to the required depth. The crew then drills the main portion of the well. The first part of the hole is larger and shorter than the main portion and is lined with a large diameter conductor pipe.
Sometimes, if a survey shows the pres-ence of a structure, which potentially may contain oil and gas, an exploratory well is drilled. The next stage is to drill appraisal wells to find out how much oil and gas are present, and whether it is worth developing the field.
To drill the well, the following steps are taken:
• The drill bit, aided by rotary torque or mud motor and the compressive weight of drill collars above it, breaks up the earth.
• Drilling mud (also known as “drilling fluid”) is pumped down inside the drill pipe and exits at the drill bit where it helps to break up the rock, controls formation pressure, as well as cleaning, cooling and lubricating the bit.
• The generated rock “cuttings” are swept up by the drilling mud as it circulates back to surface outside the drill pipe. They go over “shakers” which shake out the cuttings over screens allowing the cleaned mud to return back into the pits. Watching for abnormalities in the returning cuttings and volume of returning fluid are impera-tive to catch “kicks” early. A “kick” refers to a situation where the pressure below the bit is higher than the hydrostatic pressure applied by the column of drilling fluid. When this happens gas and mud gushes up uncontrollably.
• The pipe or drill string to which the bit is attached is gradually lengthened as the well gets deeper by joining 10-20 m lengths of threaded drill pipe at the surface. 3 joints (treble) combined equal 1 stand. Some smaller rigs only use 2-joint (double) stands while newer rigs can handle stands of 4 joints (fourable).
The drilling rig contains all necessary equip-ment to circulate the drilling fluid, hoist and turn the pipe, control down-hole pressures and remove cuttings from the drilling fluid. It also generates on site power for these operations.
There are 5 basic steps to drilling the hole:
1. Place the drill bit, collar and drill pipe in the hole.
2. Attach the Kelly or Top-drive and begin drilling.
3. As drilling progresses, circulate mud through the pipe and out of the bit to float the cuttings out of the hole.
4. Add new sections (joints) of drill pipes as the hole goes deeper. 5. Remove (trip out) the drill pipe, collar and bit when the required depth is reached or drill bit fails.
The casing crew puts the casing pipe in the hole. The cement crew pumps cement down the casing pipe using a bottom plug, cement slurry, a top plug and drill mud. The pressure from the drill mud causes the cement slurry to move through the casing out through the bottom of the well. The slurry then back-tracks up around the casing to fill the void
Figure 4.6 – Drill bit.
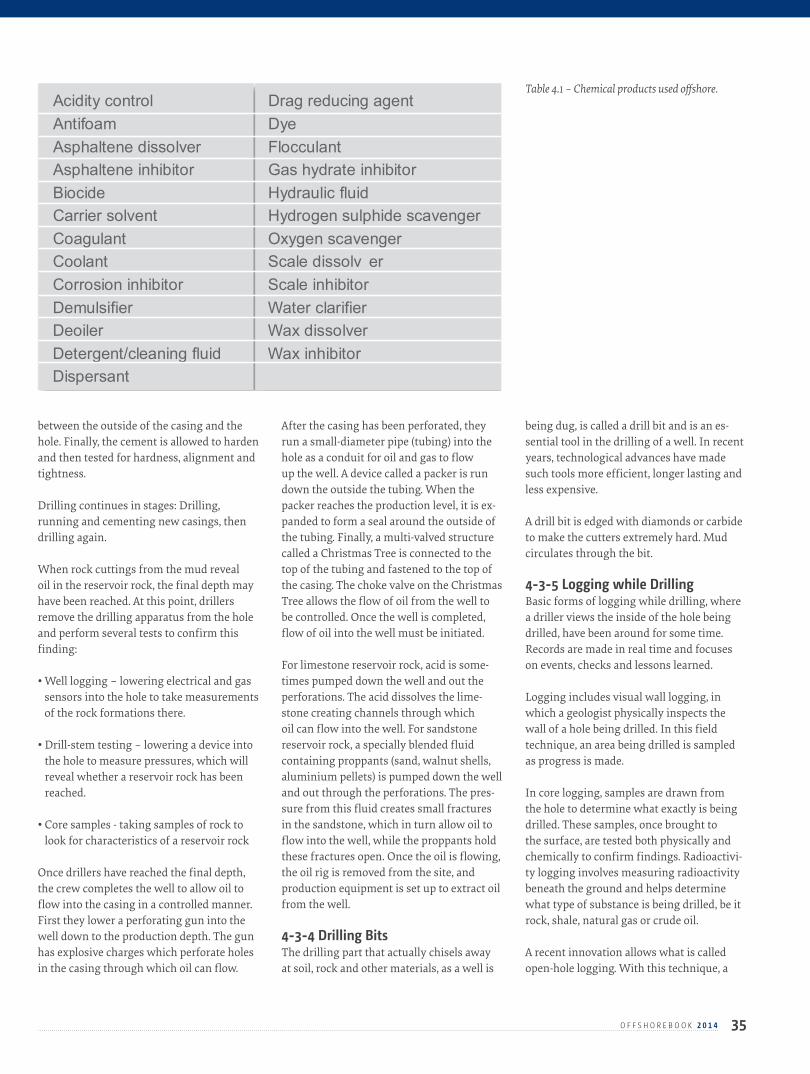
35O F F S H O R E B O O K 2 0 1 4
between the outside of the casing and the hole. Finally, the cement is allowed to harden and then tested for hardness, alignment and tightness.
Drilling continues in stages: Drilling, running and cementing new casings, then drilling again.
When rock cuttings from the mud reveal oil in the reservoir rock, the final depth may have been reached. At this point, drillers remove the drilling apparatus from the hole and perform several tests to confirm this finding:
• Well logging – lowering electrical and gas sensors into the hole to take measurements of the rock formations there.
• Drill-stem testing – lowering a device into the hole to measure pressures, which will reveal whether a reservoir rock has been reached.
• Core samples - taking samples of rock to look for characteristics of a reservoir rock
Once drillers have reached the final depth, the crew completes the well to allow oil to flow into the casing in a controlled manner. First they lower a perforating gun into the well down to the production depth. The gun has explosive charges which perforate holes in the casing through which oil can flow.
After the casing has been perforated, they run a small-diameter pipe (tubing) into the hole as a conduit for oil and gas to flow up the well. A device called a packer is run down the outside the tubing. When the packer reaches the production level, it is ex-panded to form a seal around the outside of the tubing. Finally, a multi-valved structure called a Christmas Tree is connected to the top of the tubing and fastened to the top of the casing. The choke valve on the Christmas Tree allows the flow of oil from the well to be controlled. Once the well is completed, flow of oil into the well must be initiated.
For limestone reservoir rock, acid is some-times pumped down the well and out the perforations. The acid dissolves the lime-stone creating channels through which oil can flow into the well. For sandstone reservoir rock, a specially blended fluid containing proppants (sand, walnut shells, aluminium pellets) is pumped down the well and out through the perforations. The pres-sure from this fluid creates small fractures in the sandstone, which in turn allow oil to flow into the well, while the proppants hold these fractures open. Once the oil is flowing, the oil rig is removed from the site, and production equipment is set up to extract oil from the well.
4-3-4 Drilling BitsThe drilling part that actually chisels away at soil, rock and other materials, as a well is
being dug, is called a drill bit and is an es-sential tool in the drilling of a well. In recent years, technological advances have made such tools more efficient, longer lasting and less expensive.
A drill bit is edged with diamonds or carbide to make the cutters extremely hard. Mud circulates through the bit.
4-3-5 Logging while DrillingBasic forms of logging while drilling, where a driller views the inside of the hole being drilled, have been around for some time. Records are made in real time and focuses on events, checks and lessons learned.
Logging includes visual wall logging, in which a geologist physically inspects the wall of a hole being drilled. In this field technique, an area being drilled is sampled as progress is made.
In core logging, samples are drawn from the hole to determine what exactly is being drilled. These samples, once brought to the surface, are tested both physically and chemically to confirm findings. Radioactivi-ty logging involves measuring radioactivity beneath the ground and helps determine what type of substance is being drilled, be it rock, shale, natural gas or crude oil.
A recent innovation allows what is called open-hole logging. With this technique, a
Acidity control Drag reducing agent Antifoam Dye Asphaltene dissolver Flocculant Asphaltene inhibitor Gas hydrate inhibitor Biocide Hydraulic fluid Carrier solvent Hydrogen sulphide scavenger Coagulant Oxygen scavenger Coolant Scale dissolv er Corrosion inhibitor Scale inhibitor Demulsifier Water clarifier Deoiler Wax dissolver Detergent/cleaning fluid Wax inhibitor Dispersant
Table 4.1 – Chemical products used offshore.

36 O F F S H O R E B O O K 2 0 1 4
magnetic resolution induction log, working on the same premise as a medical MRI, uses 2 magnets to determine substances being drilled. One continually fixed magnet reflects intermittent pulses from an elec-tromagnet. The pulsing rates change with varying substances, giving off one rate for shale and another for oil and yet another for natural gas.
Such techniques make drilling more effi-cient and more cost effective which eventu-ally could lead to lower consumer prices.
4-3-6 Drilling MudDrilling fluids, including the various mix-tures known as drilling mud, do the follow-ing essential jobs in oil and gas wells:
• Lubricate the drill bit, bearings, mud pump and drill pipe, particularly as it wears against the sides of the well when drilling deviated wells.
• Drives the mud motor at the end of the drill string unless the rig is top or table driven.
Drilling Operations• Clean and cools the drill bit as it cuts into
the rock.
• Lift cuttings to the surface and allow cuttings to drop out into the mud pit or shakers to prevent them recirculating.
• Regulate the chemical and physical charac-
teristics of the mixture arriving back at the drilling rig.
• Carry cement and other materials to where they are needed in the well.
• Provide information to the drillers about what is happening downhole by monitor-ing the behaviour, flow-rate, pressure and composition of the drilling fluid.
• Maintain well pressure and lubricate the borehole wall to control cave-ins and wash-outs.
• Prevent well blow-outs by including very heavy minerals such as bentonite to coun-teract the pressure in the hole.
The main classification scheme used broadly separates the mud into 3 categories based on the main component that makes up the mud:
• Water Based Mud (WBM). This can be sub divided into Dispersed and Non-Dispersed.
• Non Aqueous or more commonly “Oil Based Mud” (OBM) this also includes syn-thetic oils (SBM).
• Gaseous or Pneumatic mud.
Drilling muds are made of bentonite and other clays, and/or polymers, mixed with wa-ter to the desired viscosity. Muds transport the other components in drilling fluids
down the drill pipe and bring cuttings back up the well.
By far the largest ingredient of drilling flu-ids, by weight, is barite (BaSO4), a very heavy mineral with a density of 4.3 to 4.6 kg/l.
Over the years individual drilling companies and their expert drillers have devised propri-etary and secret formulations to deal with specific types of drilling jobs.
Details of UseOn a drilling rig, mud is pumped from the mud pits through the drill string, where it sprays out nozzles on the drill bit, clean-ing and cooling the drill bit in the process. The mud then carries the cuttings up the annulus between the drill string and the walls of the hole being drilled, up through the surface casing, and back at the surface. Cuttings are then filtered out at the shale shakers, and the mud returns to the mud pits. The returning mud can contain natural gases or other flammable materials. These can collect in and around the shale shakers area or in other work areas.
There is a potential risk of a fire, an explo-sion or a detonation occurring if they ignite. In order to prevent this, safety measures have to be taken. Safety procedures, special monitoring sensors and explosion-proof certified equipment have to be installed, e.g. explosion-proof certified electrical wiring or control panels. The mud is then pumped back down and is continuously recalculated. After testing the mud is treated periodically in the mud pits to give it properties that optimize and improve drilling efficiency.
4-3-7 Offshore ChemicalsA variety of chemicals are used at oil plat-forms. 25 product categories are listed, the name of each category tells what purpose the chemical is used for:
The Danish Environmental Protection Agen-cy (Miljøstyrelsen) manages and authorises the utilisation and discharge of chemicals into the sea environment. Emissions are reg-ulated by two Danish laws (“Havmiljøloven” and “Offshore-bekendtgørelsen”) and the basis for these Danish laws is the regula-tions of the OSPAR Marine Environment Convention.
Figure 4.7 – Example of horizontal drilling.
37O F F S H O R E B O O K 2 0 1 4
According to Danish laws, the operator must perform a pre-screen test of the chemical compounds contained in offshore chemicals in order to classify them as “black”, “red”, “yellow” or “green” where “black” is the one that does the most damage to the sea and “green” does little or no damage. Up to 300 different chemicals have been identified, but no complete overview exists.
In 2001 Danish oil rigs utilised 129,000 t of these 4 different types of chemicals and emissions into the North Sea constituted 55,000 t. By 2004 discharges from the Dan-ish operators in the North Sea had fallen to 35,500 t.
90% of the chemicals discharged into the sea in 2004 were of the “green” type of harmless additives. However, in order to avoid dis-charge of slowly erodible or environmentally harmful chemicals, the Danish authorities decided in 2005 to eliminate the “black” chemicals altogether and substitute the “red” chemicals.
The Danish Environmental Protection Agency’s status report, which is based on data from the end of 2009, indicate that emissions of “black” chemicals have ended, while emissions of “red” chemicals have been reduced by 99.7% compared to 2005. Figures from Danish Maersk Oil’s environ-mental status report from 2013 show, among other things, that the company utilised 185 grams of “red” chemicals in 2013 as against 12 tonnes in 2010, and the 185 grams was agreed with the Danish Environmental Protection Agency.
The most common chemicals and their uses are:
Scale inhibitor – prevents contaminants as salts, chalk and traces radioactive materials from separating out in pipes and valves. Scale or sediment inhibitor is applied to wellheads and production equipment.
Emulsion breaker – is added to prevent the formation and promote degradation of a emulsion layer which otherwise attaches to the sand particles preventing optimum separation of sand, oil and water.
Antifoam – prevents the formation of foam
inside a separator. The foam prevents gas from escaping and also reduces the space inside the separator.
Polyelectrolyte – is added before the hydrocy-clones and causes oil droplets to merge.
Methanol or monoethylene glycol (MEG) – is injected in flowlines to prevent hydrate formation and prevent corrosion.
Triethyleneglycol (TEG) – is used to dry gas and remove water vapour.
Hypochlorite – is added to seawater to prevent growth of algae and bacteria, e.g., in seawa-ter heat exchangers.
Biocides - are added to prevent microbiologi-cal activity in oil production systems, such as bacteria, fungus or algae growth.
Corrosion inhibitor – is injected in export pipelines and storage tanks preventing the highly corrosive export oil to damage the inside of the pipeline or tank.
Drag reducers – improve the flow in pipelines.
4-3-8 Horizontal DrillingNot all oil deposits are readily accessible to a traditional vertical well. In this situation surface drilling equipment is offset from the oil deposit. At the outset of the drilling pro-cess, the well is drilled vertically, and then a few degrees at a time it turns in whichever direction is needed to hit the reservoir.
Horizontal drilling itself has been around for some time, but 15-20 years ago it regained popularity in its use to increase production from narrow, fractured formations. When a vertical well is drilled through a narrow pay zone, its exposure to the pay zone is limited, but if the well is horizontal and runs in the pay zone it allows for a much better perfor-mance of the well.
Use of horizontal wells was introduced in USA in the 1960s, but in Scandinavia Maersk Oil was the first operator to benefit from this technique. Maersk Oil, together with the service industry, developed technologies to selectively perforate, stimulate and isolate individual zones in horizontal wells as well as other well technologies.
In 1991, a world record was set, when 5.6 million t of sand were pumped into a 1,500 m long horizontal well. Maersk Oil has furthermore performed more than 160 acid fractures in horizontal wells, and Maersk Oil’s technologies continue to be progressed.
Later innovations include water jetting for stimulation and controlled acid jetting, developed to stimulate very long horizontal well sections outside coiled tubing reach.
The controlled acid jet technique employs an uncemented liner with controlled reservoir access, ensuring efficient acid stimulation of the complete horizontal well section.
A drilling record was set by Maersk Oil Qatar in 2004, when a horizontal well drilled in the Al Shaheen Field reached a total depth of 9.4 km with a horizontal section of 8.1 km.
Maersk Oil has pursued a stepwise devel-opment of the fields so that new data and technology may rapidly be implemented in further development steps. This has been facilitated by seeking maximum integration and flexibility between different field devel-opments. Hereby, maximum use of existing processing facilities and infrastructure has been possible in each development step.
This approach has been the key to obtaining the technically efficient and economic devel-opment of the marginal fields and field flank areas discovered in Denmark.
This has produced results in the form of far greater production of oil and gas as well as lower costs, and it has turned the company into a front-runner in various aspects of oil and gas production internationally thanks to the acquired expertise and an innovative approach.
4-4 Well Completion Once the design well depth is reached, the formation must be tested and evaluated to determine whether the well should be completed for production, or plugged and abandoned.
To complete the well production, casing is installed and cemented, and the drilling rig
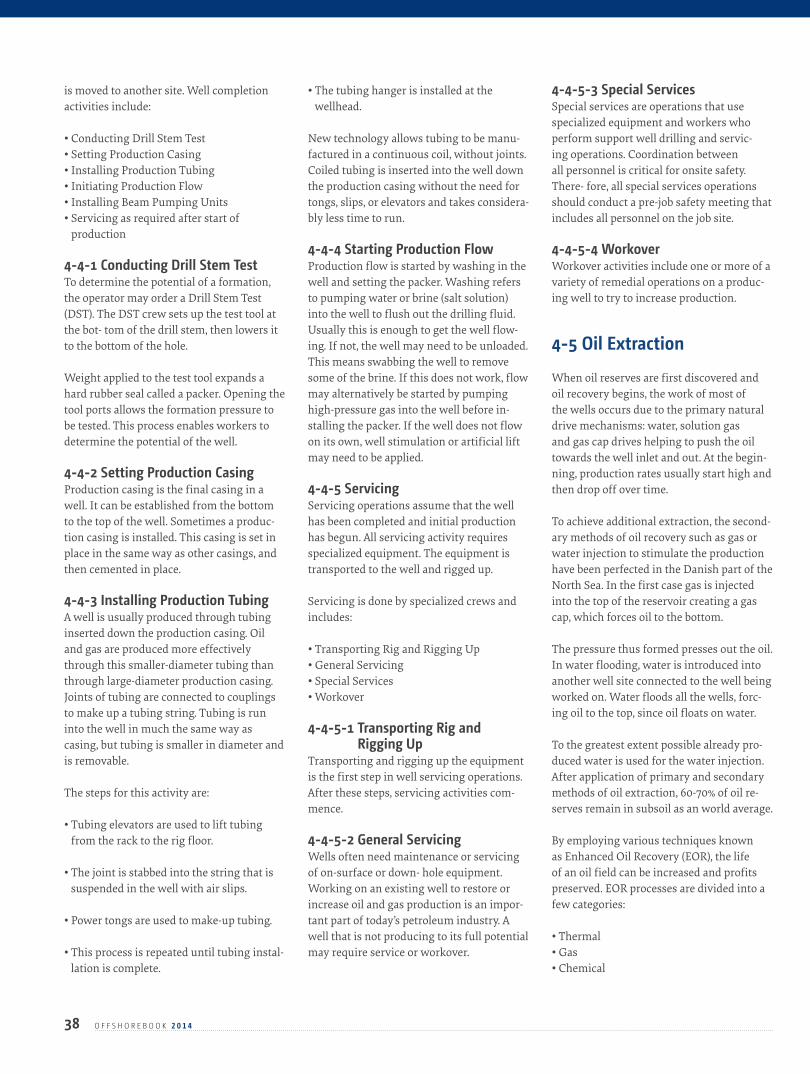
38 O F F S H O R E B O O K 2 0 1 4
is moved to another site. Well completion activities include:
• Conducting Drill Stem Test • Setting Production Casing• Installing Production Tubing • Initiating Production Flow• Installing Beam Pumping Units• Servicing as required after start of
production
4-4-1 Conducting Drill Stem TestTo determine the potential of a formation, the operator may order a Drill Stem Test (DST). The DST crew sets up the test tool at the bot- tom of the drill stem, then lowers it to the bottom of the hole.
Weight applied to the test tool expands a hard rubber seal called a packer. Opening the tool ports allows the formation pressure to be tested. This process enables workers to determine the potential of the well.
4-4-2 Setting Production CasingProduction casing is the final casing in a well. It can be established from the bottom to the top of the well. Sometimes a produc-tion casing is installed. This casing is set in place in the same way as other casings, and then cemented in place.
4-4-3 Installing Production TubingA well is usually produced through tubing inserted down the production casing. Oil and gas are produced more effectively through this smaller-diameter tubing than through large-diameter production casing. Joints of tubing are connected to couplings to make up a tubing string. Tubing is run into the well in much the same way as casing, but tubing is smaller in diameter and is removable.
The steps for this activity are:
• Tubing elevators are used to lift tubing from the rack to the rig floor.
• The joint is stabbed into the string that is suspended in the well with air slips.
• Power tongs are used to make-up tubing.
• This process is repeated until tubing instal-lation is complete.
• The tubing hanger is installed at the wellhead.
New technology allows tubing to be manu-factured in a continuous coil, without joints. Coiled tubing is inserted into the well down the production casing without the need for tongs, slips, or elevators and takes considera-bly less time to run.
4-4-4 Starting Production FlowProduction flow is started by washing in the well and setting the packer. Washing refers to pumping water or brine (salt solution) into the well to flush out the drilling fluid. Usually this is enough to get the well flow-ing. If not, the well may need to be unloaded. This means swabbing the well to remove some of the brine. If this does not work, flow may alternatively be started by pumping high-pressure gas into the well before in-stalling the packer. If the well does not flow on its own, well stimulation or artificial lift may need to be applied.
4-4-5 ServicingServicing operations assume that the well has been completed and initial production has begun. All servicing activity requires specialized equipment. The equipment is transported to the well and rigged up.
Servicing is done by specialized crews and includes:
• Transporting Rig and Rigging Up • General Servicing• Special Services• Workover
4-4-5-1 Transporting Rig and Rigging Up
Transporting and rigging up the equipment is the first step in well servicing operations. After these steps, servicing activities com-mence.
4-4-5-2 General ServicingWells often need maintenance or servicing of on-surface or down- hole equipment. Working on an existing well to restore or increase oil and gas production is an impor-tant part of today’s petroleum industry. A well that is not producing to its full potential may require service or workover.
4-4-5-3 Special ServicesSpecial services are operations that use specialized equipment and workers who perform support well drilling and servic-ing operations. Coordination between all personnel is critical for onsite safety. There- fore, all special services operations should conduct a pre-job safety meeting that includes all personnel on the job site.
4-4-5-4 WorkoverWorkover activities include one or more of a variety of remedial operations on a produc-ing well to try to increase production.
4-5 Oil Extraction When oil reserves are first discovered and oil recovery begins, the work of most of the wells occurs due to the primary natural drive mechanisms: water, solution gas and gas cap drives helping to push the oil towards the well inlet and out. At the begin-ning, production rates usually start high and then drop off over time.
To achieve additional extraction, the second-ary methods of oil recovery such as gas or water injection to stimulate the production have been perfected in the Danish part of the North Sea. In the first case gas is injected into the top of the reservoir creating a gas cap, which forces oil to the bottom.
The pressure thus formed presses out the oil. In water flooding, water is introduced into another well site connected to the well being worked on. Water floods all the wells, forc-ing oil to the top, since oil floats on water.
To the greatest extent possible already pro-duced water is used for the water injection.After application of primary and secondary methods of oil extraction, 60-70% of oil re-serves remain in subsoil as an world average.
By employing various techniques known as Enhanced Oil Recovery (EOR), the life of an oil field can be increased and profits preserved. EOR processes are divided into a few categories:
• Thermal• Gas• Chemical
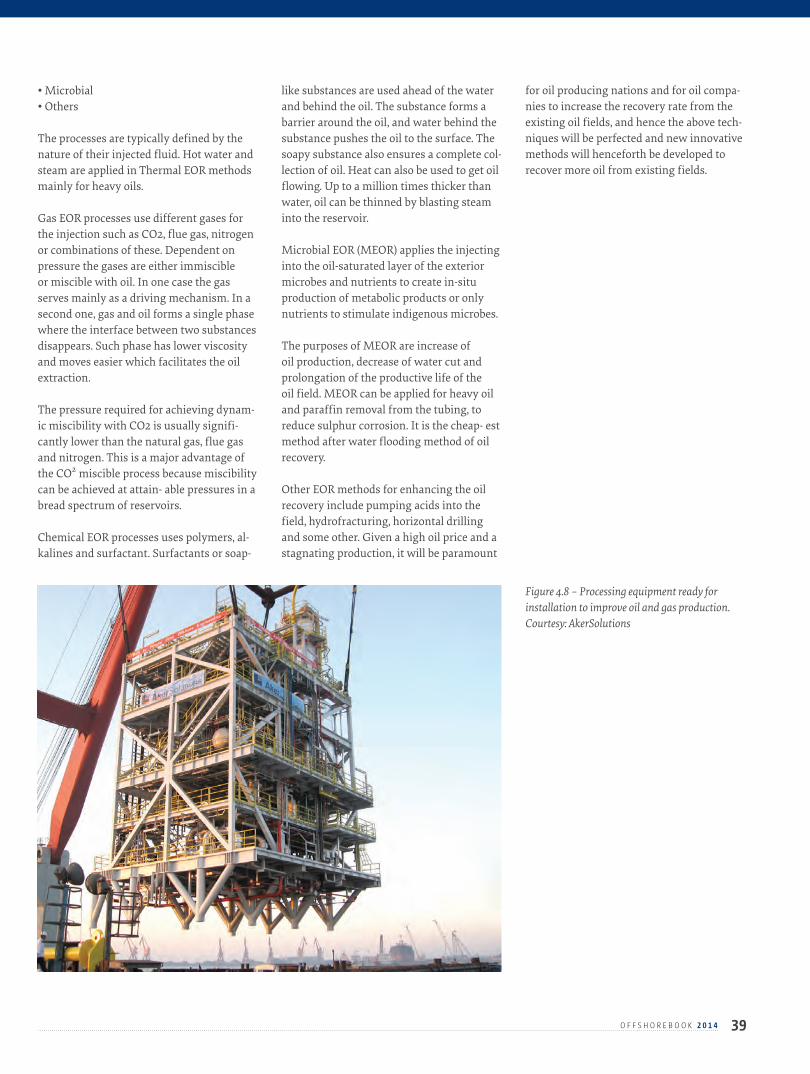
39O F F S H O R E B O O K 2 0 1 4
• Microbial• Others
The processes are typically defined by the nature of their injected fluid. Hot water and steam are applied in Thermal EOR methods mainly for heavy oils.
Gas EOR processes use different gases for the injection such as CO2, flue gas, nitrogen or combinations of these. Dependent on pressure the gases are either immiscible or miscible with oil. In one case the gas serves mainly as a driving mechanism. In a second one, gas and oil forms a single phase where the interface between two substances disappears. Such phase has lower viscosity and moves easier which facilitates the oil extraction.
The pressure required for achieving dynam-ic miscibility with CO2 is usually signifi-cantly lower than the natural gas, flue gas and nitrogen. This is a major advantage of the CO² miscible process because miscibility can be achieved at attain- able pressures in a bread spectrum of reservoirs.
Chemical EOR processes uses polymers, al-kalines and surfactant. Surfactants or soap-
like substances are used ahead of the water and behind the oil. The substance forms a barrier around the oil, and water behind the substance pushes the oil to the surface. The soapy substance also ensures a complete col-lection of oil. Heat can also be used to get oil flowing. Up to a million times thicker than water, oil can be thinned by blasting steam into the reservoir.
Microbial EOR (MEOR) applies the injecting into the oil-saturated layer of the exterior microbes and nutrients to create in-situ production of metabolic products or only nutrients to stimulate indigenous microbes.
The purposes of MEOR are increase of oil production, decrease of water cut and prolongation of the productive life of the oil field. MEOR can be applied for heavy oil and paraffin removal from the tubing, to reduce sulphur corrosion. It is the cheap- est method after water flooding method of oil recovery.
Other EOR methods for enhancing the oil recovery include pumping acids into the field, hydrofracturing, horizontal drilling and some other. Given a high oil price and a stagnating production, it will be paramount
for oil producing nations and for oil compa-nies to increase the recovery rate from the existing oil fields, and hence the above tech-niques will be perfected and new innovative methods will henceforth be developed to recover more oil from existing fields.
Figure 4.8 – Processing equipment ready for installation to improve oil and gas production. Courtesy: AkerSolutions
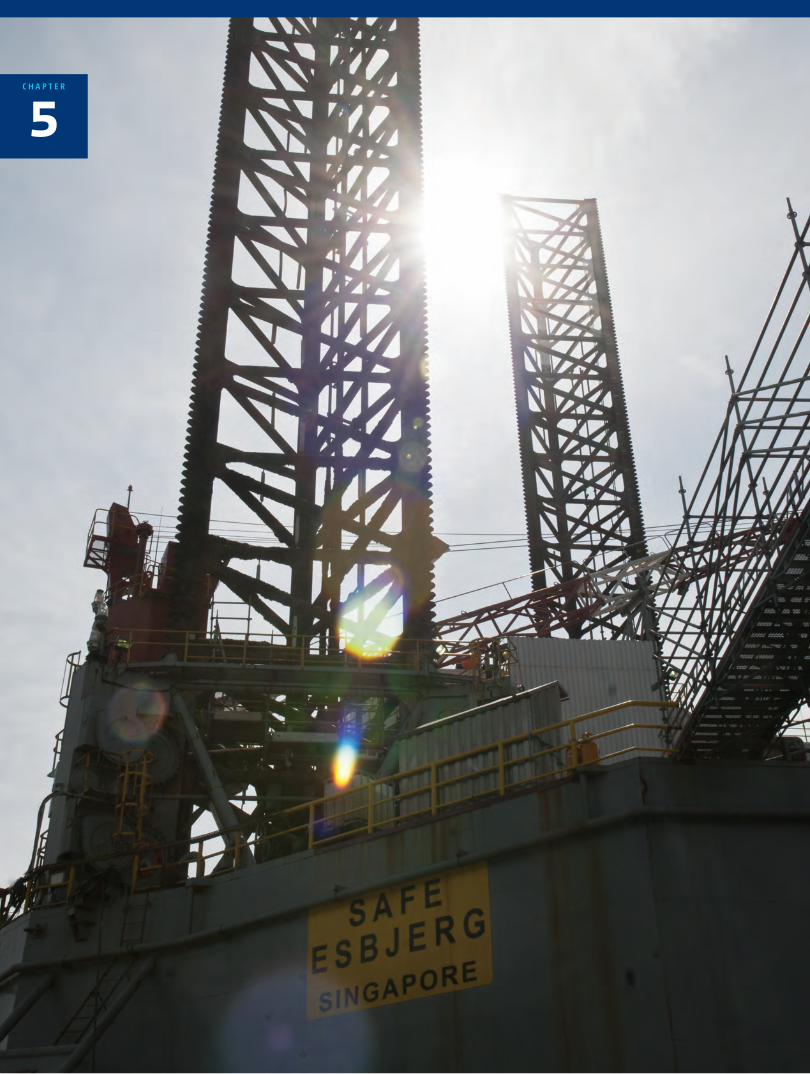
5C H A P T E R
41O F F S H O R E B O O K 2 0 1 4
5-1 Overview Offshore structures are large platforms providing the necessary facilities and equipment for exploration and production of oil and natural gas in a marine environ-ment. During the initial prospecting phase, jack-up or alternatively floating rigs are used to drill exploration wells, and if the drilling operation proves successful, a permanent production facility may be placed at the site.
Initially the exploration well is drilled to determine, whether any oil or gas is present within a given area. In Denmark the drilling rig is typically of the jack-up type standing on the seabed, due to the relatively shallow Danish water depths of 35 to 70 m.
Once the decision to initiate an oil produc-tion has been taken, a production facility will be placed at the site. The facility may consist of one or several platforms, or one integrated production platform. Depend-ing on the site, location and water depth, the production facilities are either floating platforms or platforms placed direct on the seabed. Generally, oil platforms are located in shallow waters on the continental shelf.
However, as the demand for oil and gas increases and reserves are found in increas-ingly deeper waters, facilities and equip-ment must be located either directly on the bottom of the sea or on floating vessels. A typical wellhead platform in the Danish North Sea is equipped with 12-24 wellheads, and in a few cases up to 30-40 wellheads.
Directional drilling allows the reservoirs to be accessed at different depths and at remote positions of up to 5 to 8 km from the platform. Many Danish platforms have satellite platforms tied-in by pipeline and umbillicals (containing power, signal and hydralick connections.
In Denmark the offshore production
platforms mainly consist of medium-sized 4-legged steel production platforms, which often later during the lifetime of the field are extended by small cost-effective monocol-umn platforms. Often these installations are the Danish developed STAR platform. Through simple and flexible design these platforms can easily be adapted for differ-ent application such as wellhead, flare and accommodation platform.
Today, som operators have installed several unmanned mono-tower structures, espe-cially on smaller satellite fields. Unmanned platforms are cheaper and reduce operating costs and risk. Another advantage of the mono-tower is that it may be re-usable and therefore suitable to be installed on small marginal fields with rapid production decline. The combination of horizontal wells and mono-tower platforms has reduced development costs considerably.
In general offshore structures may be used for a variety of reasons:
• Oil and gas exploration • Production processing • Accommodation • Bridges and causeways • Loading and off loading facilities
In the steel platform category, there are various types of structures, depending on the use, and depending on the water depth in which the platforms operate.
The development of offshore oil and gas fields has played an essential role in the total oil production worldwide, as oil prices in the 1970’s and again from 2005 encouraged increased development in order to attain self-sufficiency.
The design of offshore structures used for oil and gas exploitation has evolved since then, with national and international standards and regulations assuring that all
platforms are designed to withstand a cer-tain wave and wind load and to a high safety level. In most cases platforms are designed to last 25-30 years with respect to material fatigue as well as to withstand impact with boats and dropped objects. Nevertheless, great efforts are made to optimize and life-extend the structures to maintain the oil and gas production.
Finally to ensure the safety and integrity of existing structures, advanced inspection, monitoring systems and advanced analysis have been activated.
As oil and gas reserves are being discov-ered in increasingly deeper waters, the technology needed to design and build deep ocean-compliant structures, contin-ues to evolve. Offshore structures are used worldwide for a variety of functions and in varying water depths and environments.
In the design and analysis of offshore plat-forms many factors, including the following critical loads, are taken into account:
• Environmental loads (wave and wind loads)
• Transportation and lifting loads
In relation to dynamics and fatigue, offshore structures are designed with maximum load occurrence frequencies taking into account both 50- and 100-year wave and weather sce-narios, so that a maximum level of safety is reached. Placing heavy structures on the sea-bed also requires a thorough investigation of the soil-characteristics, as well as whether it should be piled or gravity based.
5-2 Platform Types Larger offshore oil and gas platforms are some of the largest moveable man-made structures in the world. There are many different types of platforms:
OFFSHORE STRUCTURES
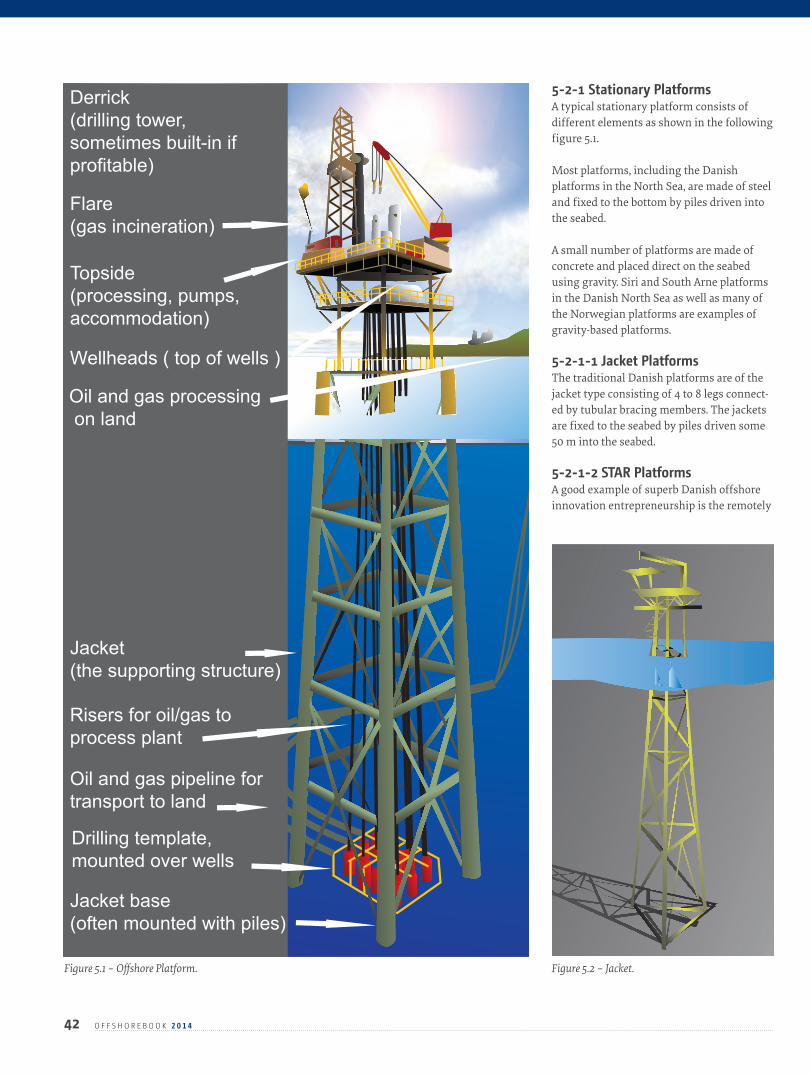
5-2-1 Stationary PlatformsA typical stationary platform consists of different elements as shown in the following figure 5.1.
Most platforms, including the Danish platforms in the North Sea, are made of steel and fixed to the bottom by piles driven into the seabed.
A small number of platforms are made of concrete and placed direct on the seabed using gravity. Siri and South Arne platforms in the Danish North Sea as well as many of the Norwegian platforms are examples of gravity-based platforms.
5-2-1-1 Jacket Platforms The traditional Danish platforms are of the jacket type consisting of 4 to 8 legs connect-ed by tubular bracing members. The jackets are fixed to the seabed by piles driven some 50 m into the seabed.
5-2-1-2 STAR Platforms A good example of superb Danish offshore innovation entrepreneurship is the remotely
42 O F F S H O R E B O O K 2 0 1 4
Oil and gas pipeline for transport to land
Oil and gas processing on land
Derrick (drilling tower, sometimes built-in if profitable)
Flare(gas incineration)
Topside(processing, pumps, accommodation)
Wellheads ( top of wells )
Risers for oil/gas toprocess plant
Jacket(the supporting structure)
Drilling template, mounted over wells
Jacket base (often mounted with piles)
Figure 5.1 – Offshore Platform. Figure 5.2 – Jacket.
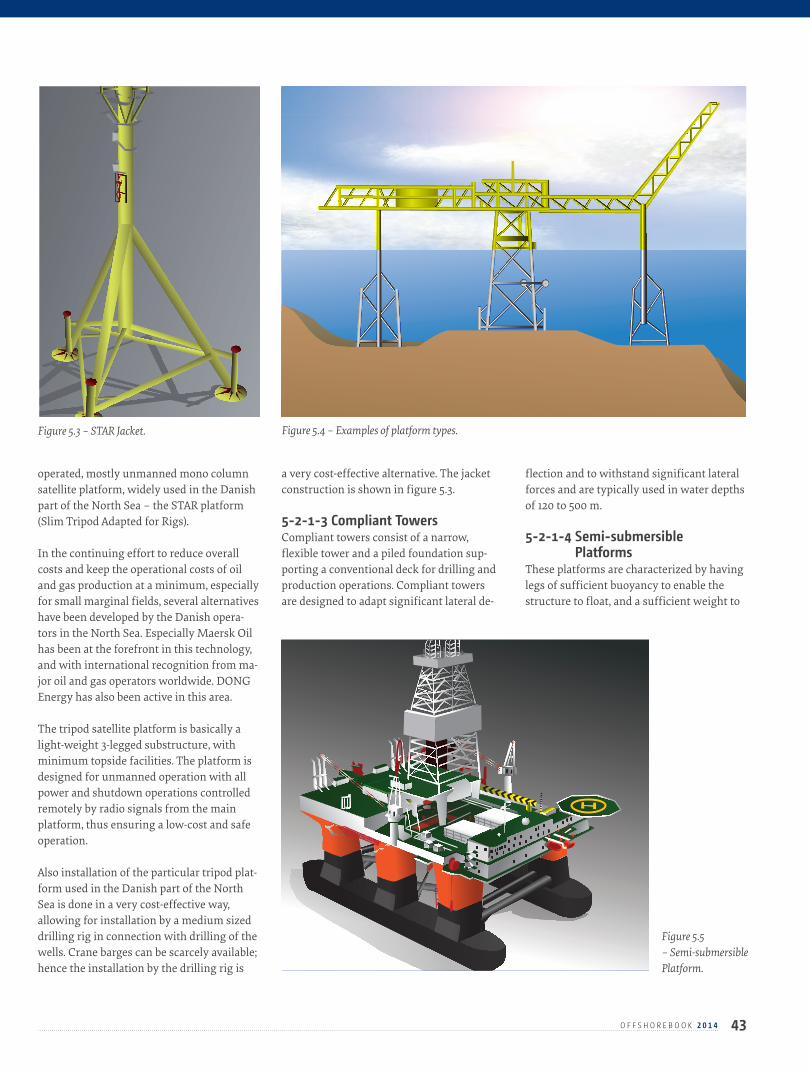
operated, mostly unmanned mono column satellite platform, widely used in the Danish part of the North Sea – the STAR platform (Slim Tripod Adapted for Rigs).
In the continuing effort to reduce overall costs and keep the operational costs of oil and gas production at a minimum, especially for small marginal fields, several alternatives have been developed by the Danish opera-tors in the North Sea. Especially Maersk Oil has been at the forefront in this technology, and with international recognition from ma-jor oil and gas operators worldwide. DONG Energy has also been active in this area.
The tripod satellite platform is basically a light-weight 3-legged substructure, with minimum topside facilities. The platform is designed for unmanned operation with all power and shutdown operations controlled remotely by radio signals from the main platform, thus ensuring a low-cost and safe operation.
Also installation of the particular tripod plat-form used in the Danish part of the North Sea is done in a very cost-effective way, allowing for installation by a medium sized drilling rig in connection with drilling of the wells. Crane barges can be scarcely available; hence the installation by the drilling rig is
a very cost-effective alternative. The jacket construction is shown in figure 5.3.
5-2-1-3 Compliant TowersCompliant towers consist of a narrow, flexible tower and a piled foundation sup-porting a conventional deck for drilling and production operations. Compliant towers are designed to adapt significant lateral de-
flection and to withstand significant lateral forces and are typically used in water depths of 120 to 500 m.
5-2-1-4 Semi-submersible Platforms
These platforms are characterized by having legs of sufficient buoyancy to enable the structure to float, and a sufficient weight to
43O F F S H O R E B O O K 2 0 1 4
Figure 5.3 – STAR Jacket. Figure 5.4 – Examples of platform types.
Marginal field development
Source: Rambøll
Figure 5.5 – Semi-submersible Platform.
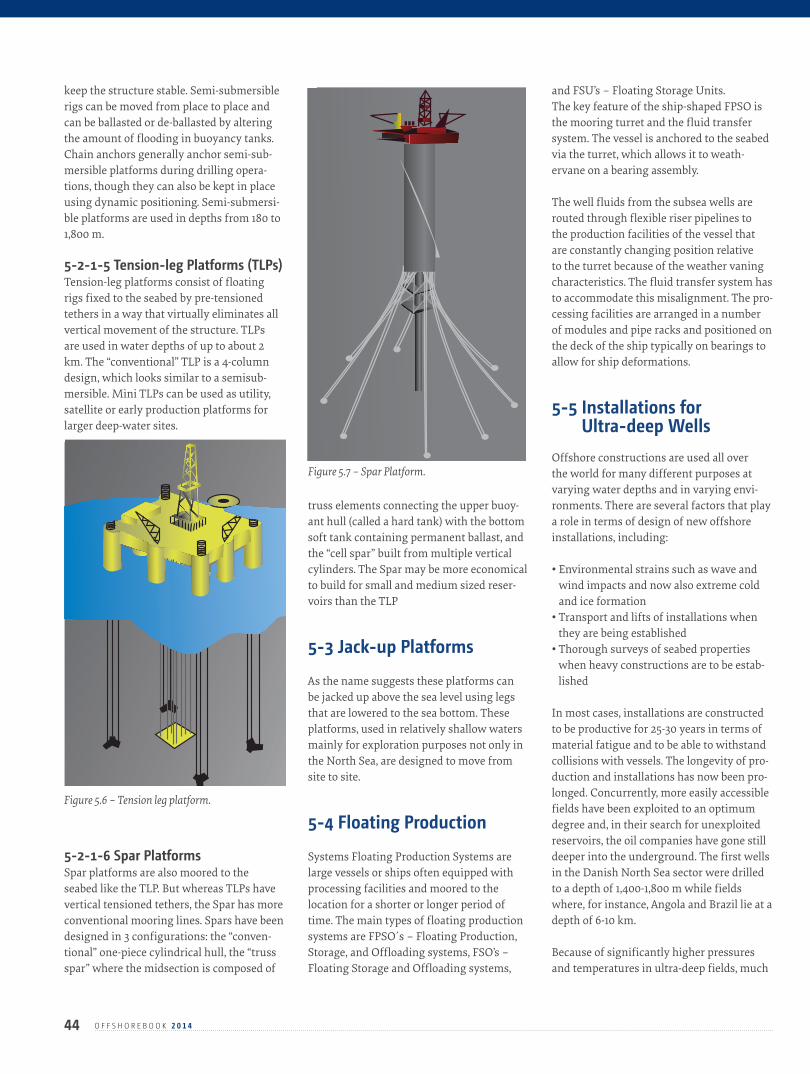
44 O F F S H O R E B O O K 2 0 1 4
keep the structure stable. Semi-submersible rigs can be moved from place to place and can be ballasted or de-ballasted by altering the amount of flooding in buoyancy tanks. Chain anchors generally anchor semi-sub-mersible platforms during drilling opera-tions, though they can also be kept in place using dynamic positioning. Semi-submersi-ble platforms are used in depths from 180 to 1,800 m.
5-2-1-5 Tension-leg Platforms (TLPs)Tension-leg platforms consist of floating rigs fixed to the seabed by pre-tensioned tethers in a way that virtually eliminates all vertical movement of the structure. TLPs are used in water depths of up to about 2 km. The “conventional” TLP is a 4-column design, which looks similar to a semisub-mersible. Mini TLPs can be used as utility, satellite or early production platforms for larger deep-water sites.
5-2-1-6 Spar PlatformsSpar platforms are also moored to the seabed like the TLP. But whereas TLPs have vertical tensioned tethers, the Spar has more conventional mooring lines. Spars have been designed in 3 configurations: the “conven-tional” one-piece cylindrical hull, the “truss spar” where the midsection is composed of
truss elements connecting the upper buoy-ant hull (called a hard tank) with the bottom soft tank containing permanent ballast, and the “cell spar” built from multiple vertical cylinders. The Spar may be more economical to build for small and medium sized reser-voirs than the TLP
5-3 Jack-up Platforms As the name suggests these platforms can be jacked up above the sea level using legs that are lowered to the sea bottom. These platforms, used in relatively shallow waters mainly for exploration purposes not only in the North Sea, are designed to move from site to site.
5-4 Floating Production Systems Floating Production Systems are large vessels or ships often equipped with processing facilities and moored to the location for a shorter or longer period of time. The main types of floating production systems are FPSO´s – Floating Production, Storage, and Offloading systems, FSO’s – Floating Storage and Offloading systems,
and FSU’s – Floating Storage Units.The key feature of the ship-shaped FPSO is the mooring turret and the fluid transfer system. The vessel is anchored to the seabed via the turret, which allows it to weath-ervane on a bearing assembly.
The well fluids from the subsea wells are routed through flexible riser pipelines to the production facilities of the vessel that are constantly changing position relative to the turret because of the weather vaning characteristics. The fluid transfer system has to accommodate this misalignment. The pro-cessing facilities are arranged in a number of modules and pipe racks and positioned on the deck of the ship typically on bearings to allow for ship deformations.
5-5 Installations for Ultra-deep Wells
Offshore constructions are used all over the world for many different purposes at varying water depths and in varying envi-ronments. There are several factors that play a role in terms of design of new offshore installations, including:
• Environmental strains such as wave and wind impacts and now also extreme cold and ice formation
• Transport and lifts of installations when they are being established
• Thorough surveys of seabed properties when heavy constructions are to be estab-lished
In most cases, installations are constructed to be productive for 25-30 years in terms of material fatigue and to be able to withstand collisions with vessels. The longevity of pro-duction and installations has now been pro-longed. Concurrently, more easily accessible fields have been exploited to an optimum degree and, in their search for unexploited reservoirs, the oil companies have gone still deeper into the underground. The first wells in the Danish North Sea sector were drilled to a depth of 1,400-1,800 m while fields where, for instance, Angola and Brazil lie at a depth of 6-10 km.
Because of significantly higher pressures and temperatures in ultra-deep fields, much
Figure 5.6 – Tension leg platform.
Figure 5.7 – Spar Platform.

45O F F S H O R E B O O K 2 0 1 4
more is required of the durability of mate-rials, and this makes extraction even more costly than it would otherwise have been. However, still more advanced technology is developed that makes possible exploitation of these hard-to-reach fields.
5-6 Subsea Production Systems
Still more tank systems, pipelines and other offshore installations are established on the seabed – the so-called subsea installations. This means that large constructions that would otherwise hold installations above the water are avoided. By establishing the con-
structions on the seabed, space and money are saved on the platform above the water. Over the past decade, subsea technology has developed markedly. From being an untested theory in the 1970s and 1980s, subsea tech-nology has contributed to exciting advances in the offshore sector. Worldwide more than 1,000 submarine wells have been completed, of which two-thirds are still operating.
These completions come under a variety of configurations, including single-satel-lite wells, which employ subsea trees on an individual guide base, subsea trees on steel-template structures with production manifolds and clustered well systems, e.g. single-satellite wells connected to a nearby subsea production manifold. All of these configurations are usually connected to platforms, floating production and storage vessels, or even to the shore.
Apart from wellheads, subsea installations also include other technologies. Service pro-viders are seeing still more orders for their technologies as operators are faced with placing a greater number of their wellhead and production systems on the sea floor.
As prices are going down and the location of fields at deeper and deeper water depth this trend has started to evolve. As a consequence of this development even marginal fields at relative shallow waters are considered as potentiel sub sea developments.
5-6-1 Examples of Subsea Technology
Development of subsea solutions continues to break new technological ground. 3 subsea
production installations are operating in the Danish North Sea sector. The first one was the Maersk Oil-operated Regnar field, which was put on stream in 1993.
Regnar is a so-called marginal oil field with an expected production of 525,000 m³of oil in total. This makes it unfeasible to install a traditional production platform, so alter-natively it was decided to produce from a subsea wellhead. The wellhead is located at a depth of 45 m and is connected to the Dan FA platform via a 13 km long pipeline. In ad-dition to Regnar, DONG Energy is operating 2 subsea wellheads in the Stine Segment 1 field.
The South Arne field operated by Hess Denmark has an integrated oil platform, which processes the oil and gas produced. A subsea oil tank stores the oil until a shuttle oil tanker pumps the oil to its tanks via an offshore loading system.
Also being a part owner of the enormous Norwegian gas field Ormen Lange, a massive built-up of subsea knowledge has occurred within DONG Energy during the past years.
Most Danish subsea technology however lies within Maersk Oil. Some main examples are:
• The Tyra West gas export pipeline pump-ing gas over a 100 km subsea pipeline to the NAM operated F3-FB platform in the Netherlands.
• Over 200 km subsea pipeline pumping pro-duced oil from the Gorm platform to the onland Filsø pumping station and onwards to Shell’s Fredericia refinery.
• The Tyra West gas subsea pipeline to DONG’s Nybro gas treatment plant. The pipeline is 230 km long.
• The Trym field, a 4 slot template for pro-duction from Trym and Lulita Nord.
In addition Hess Denmark operates the field South Arne connecting a 300 km subsea gas pipeline to the gas treatment plant in Nybro at the west coast of the Jutland peninsula.
Figure 5.9– FPSO for Nexus project (Courtesy Ramboll Oil & Gas).
Figure 5.8 – Jack-up Platform standing next to a stationary platform.
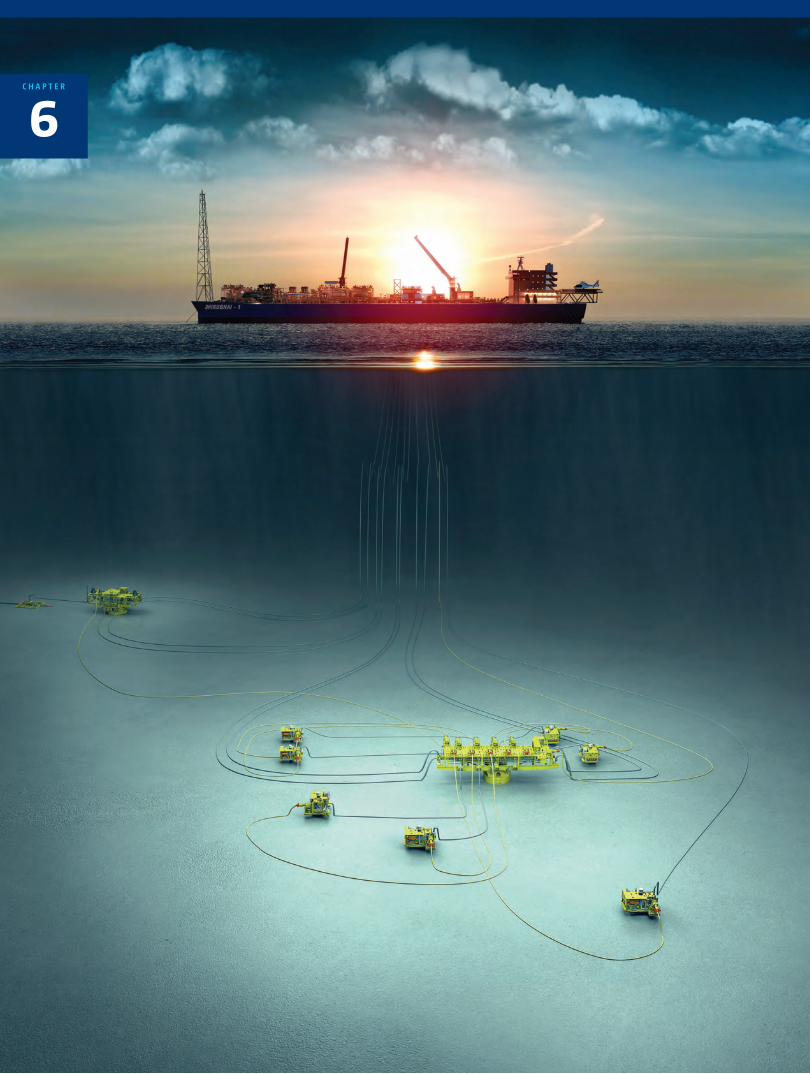
6C H A P T E R
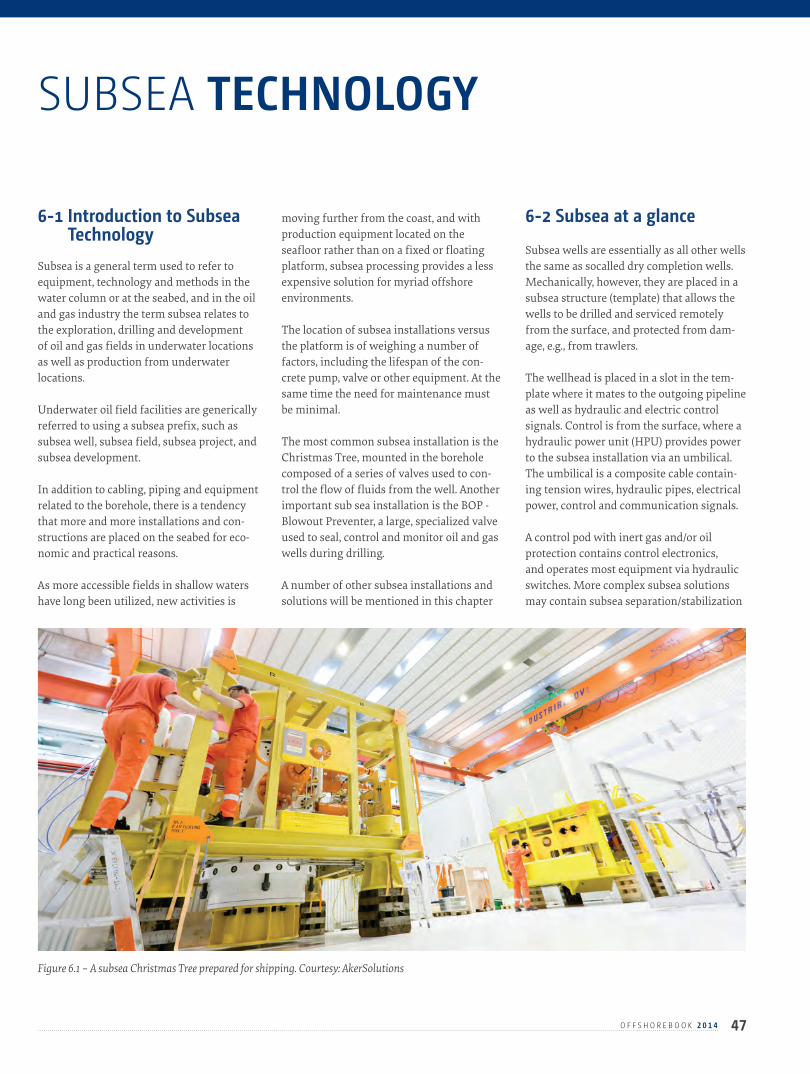
47O F F S H O R E B O O K 2 0 1 4
6-1 Introduction to Subsea Technology
Subsea is a general term used to refer to equipment, technology and methods in the water column or at the seabed, and in the oil and gas industry the term subsea relates to the exploration, drilling and development of oil and gas fields in underwater locations as well as production from underwater locations.
Underwater oil field facilities are generically referred to using a subsea prefix, such as subsea well, subsea field, subsea project, and subsea development.
In addition to cabling, piping and equipment related to the borehole, there is a tendency that more and more installations and con- structions are placed on the seabed for eco-nomic and practical reasons.
As more accessible fields in shallow waters have long been utilized, new activities is
moving further from the coast, and with production equipment located on the seafloor rather than on a fixed or floating platform, subsea processing provides a less expensive solution for myriad offshore environments.
The location of subsea installations versus the platform is of weighing a number of factors, including the lifespan of the con-crete pump, valve or other equipment. At the same time the need for maintenance must be minimal.
The most common subsea installation is the Christmas Tree, mounted in the borehole composed of a series of valves used to con-trol the flow of fluids from the well. Another important sub sea installation is the BOP - Blowout Preventer, a large, specialized valve used to seal, control and monitor oil and gas wells during drilling.
A number of other subsea installations and solutions will be mentioned in this chapter
6-2 Subsea at a glance
Subsea wells are essentially as all other wells the same as socalled dry completion wells. Mechanically, however, they are placed in a subsea structure (template) that allows the wells to be drilled and serviced remotely from the surface, and protected from dam-age, e.g., from trawlers.
The wellhead is placed in a slot in the tem-plate where it mates to the outgoing pipeline as well as hydraulic and electric control signals. Control is from the surface, where a hydraulic power unit (HPU) provides power to the subsea installation via an umbilical. The umbilical is a composite cable contain-ing tension wires, hydraulic pipes, electrical power, control and communication signals.
A control pod with inert gas and/or oil protection contains control electronics, and operates most equipment via hydraulic switches. More complex subsea solutions may contain subsea separation/stabilization
SUBSEA TECHNOLOGY
Figure 6.1 – A subsea Christmas Tree prepared for shipping. Courtesy: AkerSolutions
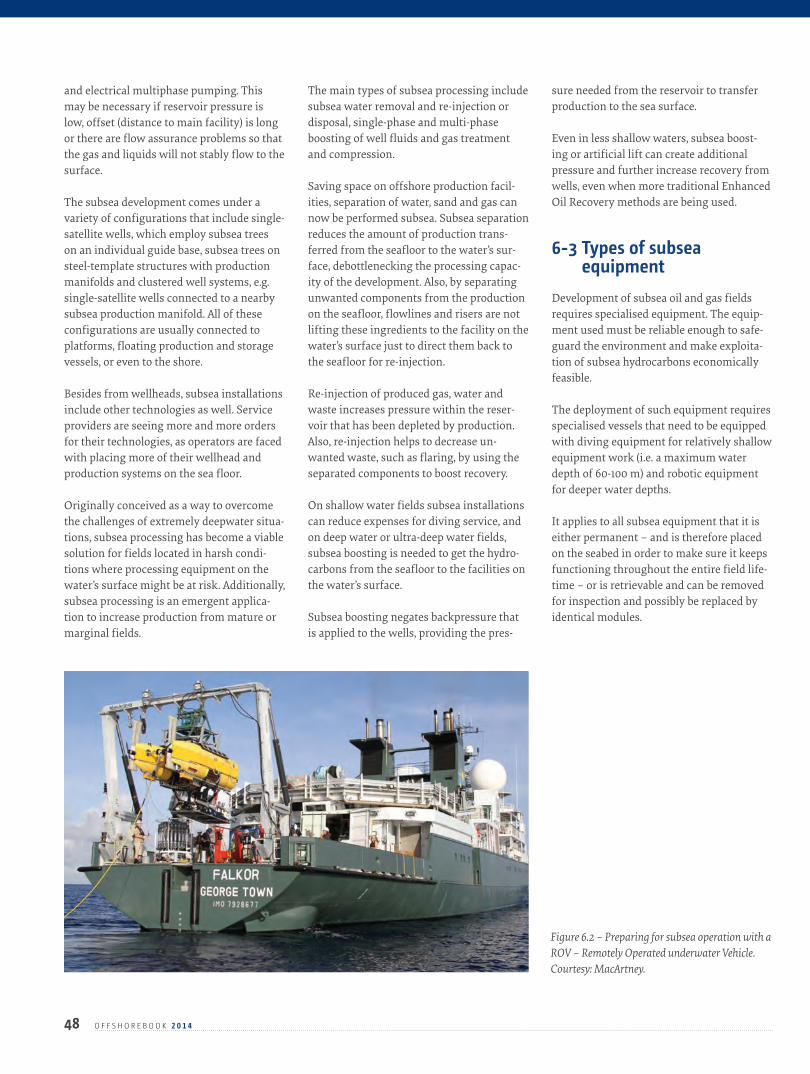
and electrical multiphase pumping. This may be necessary if reservoir pressure is low, offset (distance to main facility) is long or there are flow assurance problems so that the gas and liquids will not stably flow to the surface.
The subsea development comes under a variety of configurations that include single- satellite wells, which employ subsea trees on an individual guide base, subsea trees on steel-template structures with production manifolds and clustered well systems, e.g. single-satellite wells connected to a nearby subsea production manifold. All of these configurations are usually connected to platforms, floating production and storage vessels, or even to the shore.
Besides from wellheads, subsea installations include other technologies as well. Service providers are seeing more and more orders for their technologies, as operators are faced with placing more of their wellhead and production systems on the sea floor.
Originally conceived as a way to overcome the challenges of extremely deepwater situa-tions, subsea processing has become a viable solution for fields located in harsh condi-tions where processing equipment on the water’s surface might be at risk. Additionally, subsea processing is an emergent applica-tion to increase production from mature or marginal fields.
The main types of subsea processing include subsea water removal and re-injection or disposal, single-phase and multi-phase boosting of well fluids and gas treatment and compression.
Saving space on offshore production facil-ities, separation of water, sand and gas can now be performed subsea. Subsea separation reduces the amount of production trans-ferred from the seafloor to the water’s sur-face, debottlenecking the processing capac-ity of the development. Also, by separating unwanted components from the production on the seafloor, flowlines and risers are not lifting these ingredients to the facility on the water’s surface just to direct them back to the seafloor for re-injection.
Re-injection of produced gas, water and waste increases pressure within the reser-voir that has been depleted by production. Also, re-injection helps to decrease un-wanted waste, such as flaring, by using the separated components to boost recovery.
On shallow water fields subsea installations can reduce expenses for diving service, and on deep water or ultra-deep water fields, subsea boosting is needed to get the hydro-carbons from the seafloor to the facilities on the water’s surface.
Subsea boosting negates backpressure that is applied to the wells, providing the pres-
sure needed from the reservoir to transfer production to the sea surface.
Even in less shallow waters, subsea boost-ing or artificial lift can create additional pressure and further increase recovery from wells, even when more traditional Enhanced Oil Recovery methods are being used.
6-3 Types of subsea equipment
Development of subsea oil and gas fields requires specialised equipment. The equip-ment used must be reliable enough to safe-guard the environment and make exploita-tion of subsea hydrocarbons economically feasible.
The deployment of such equipment requires specialised vessels that need to be equipped with diving equipment for relatively shallow equipment work (i.e. a maximum water depth of 60-100 m) and robotic equipment for deeper water depths.
It applies to all subsea equipment that it is either permanent – and is therefore placed on the seabed in order to make sure it keeps functioning throughout the entire field life-time – or is retrievable and can be removed for inspection and possibly be replaced by identical modules.
48 O F F S H O R E B O O K 2 0 1 4
Figure 6.2 – Preparing for subsea operation with a ROV – Remotely Operated underwater Vehicle. Courtesy: MacArtney.
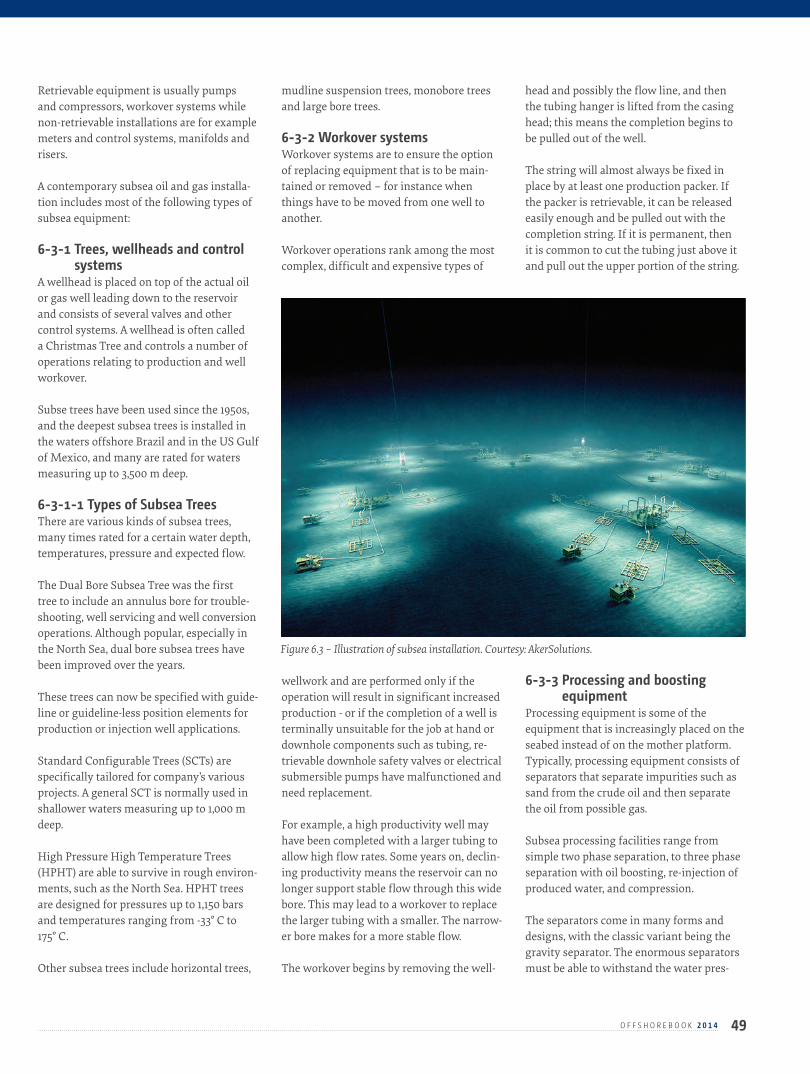
Retrievable equipment is usually pumps and compressors, workover systems while non-retrievable installations are for example meters and control systems, manifolds and risers.
A contemporary subsea oil and gas installa-tion includes most of the following types of subsea equipment:
6-3-1 Trees, wellheads and control systems
A wellhead is placed on top of the actual oil or gas well leading down to the reservoir and consists of several valves and other control systems. A wellhead is often called a Christmas Tree and controls a number of operations relating to production and well workover.
Subse trees have been used since the 1950s, and the deepest subsea trees is installed in the waters offshore Brazil and in the US Gulf of Mexico, and many are rated for waters measuring up to 3,500 m deep.
6-3-1-1 Types of Subsea TreesThere are various kinds of subsea trees, many times rated for a certain water depth, temperatures, pressure and expected flow.
The Dual Bore Subsea Tree was the first tree to include an annulus bore for trouble-shooting, well servicing and well conversion operations. Although popular, especially in the North Sea, dual bore subsea trees have been improved over the years.
These trees can now be specified with guide-line or guideline-less position elements for production or injection well applications.
Standard Configurable Trees (SCTs) are specifically tailored for company’s various projects. A general SCT is normally used in shallower waters measuring up to 1,000 m deep.
High Pressure High Temperature Trees (HPHT) are able to survive in rough environ-ments, such as the North Sea. HPHT trees are designed for pressures up to 1,150 bars and temperatures ranging from -33° C to 175° C.
Other subsea trees include horizontal trees,
mudline suspension trees, monobore trees and large bore trees.
6-3-2 Workover systemsWorkover systems are to ensure the option of replacing equipment that is to be main-tained or removed – for instance when things have to be moved from one well to another.
Workover operations rank among the most complex, difficult and expensive types of
wellwork and are performed only if the operation will result in significant increased production - or if the completion of a well is terminally unsuitable for the job at hand or downhole components such as tubing, re-trievable downhole safety valves or electrical submersible pumps have malfunctioned and need replacement.
For example, a high productivity well may have been completed with a larger tubing to allow high flow rates. Some years on, declin-ing productivity means the reservoir can no longer support stable flow through this wide bore. This may lead to a workover to replace the larger tubing with a smaller. The narrow-er bore makes for a more stable flow.
The workover begins by removing the well-
head and possibly the flow line, and then the tubing hanger is lifted from the casing head; this means the completion begins to be pulled out of the well.
The string will almost always be fixed in place by at least one production packer. If the packer is retrievable, it can be released easily enough and be pulled out with the completion string. If it is permanent, then it is common to cut the tubing just above it and pull out the upper portion of the string.
6-3-3 Processing and boosting equipment
Processing equipment is some of the equipment that is increasingly placed on the seabed instead of on the mother platform. Typically, processing equipment consists of separators that separate impurities such as sand from the crude oil and then separate the oil from possible gas.
Subsea processing facilities range from simple two phase separation, to three phase separation with oil boosting, re-injection of produced water, and compression.
The separators come in many forms and designs, with the classic variant being the gravity separator. The enormous separators must be able to withstand the water pres-
49O F F S H O R E B O O K 2 0 1 4
Figure 6.3 – Illustration of subsea installation. Courtesy: AkerSolutions.
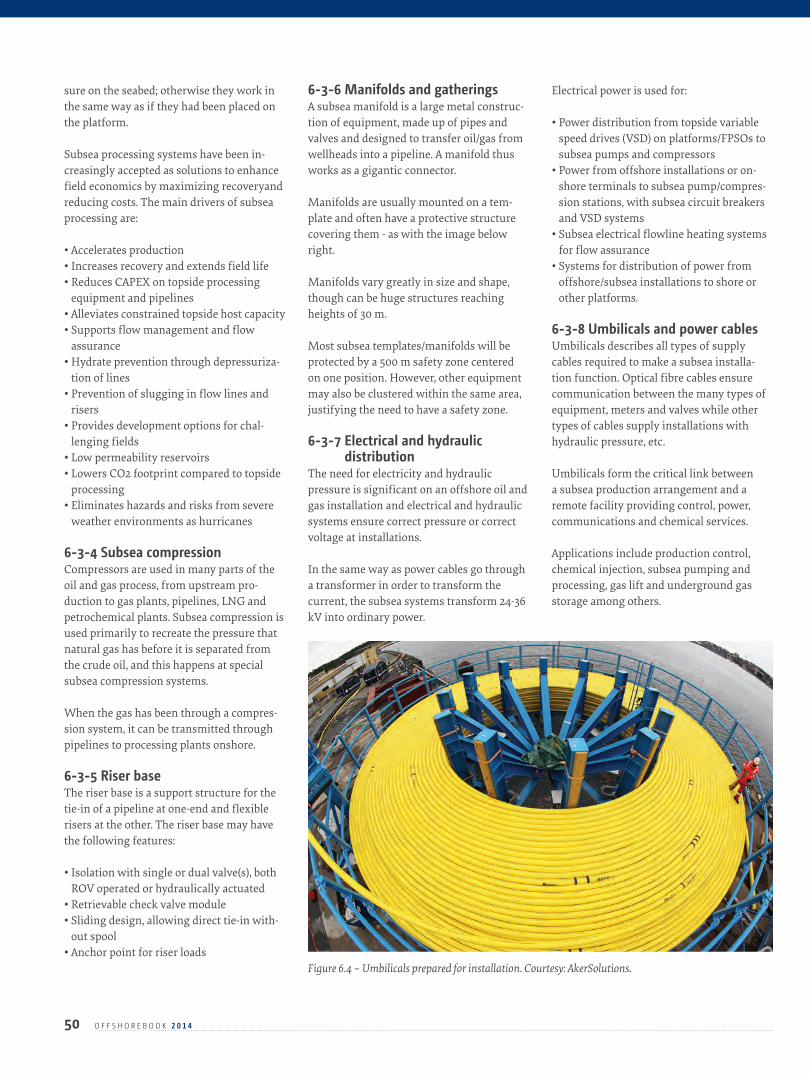
50 O F F S H O R E B O O K 2 0 1 4
sure on the seabed; otherwise they work in the same way as if they had been placed on the platform.
Subsea processing systems have been in-creasingly accepted as solutions to enhance field economics by maximizing recoveryand reducing costs. The main drivers of subsea processing are:
• Accelerates production• Increases recovery and extends field life• Reduces CAPEX on topside processing
equipment and pipelines• Alleviates constrained topside host capacity• Supports flow management and flow
assurance• Hydrate prevention through depressuriza-
tion of lines• Prevention of slugging in flow lines and
risers• Provides development options for chal-
lenging fields• Low permeability reservoirs• Lowers CO2 footprint compared to topside
processing• Eliminates hazards and risks from severe
weather environments as hurricanes
6-3-4 Subsea compressionCompressors are used in many parts of the oil and gas process, from upstream pro-duction to gas plants, pipelines, LNG and petrochemical plants. Subsea compression is used primarily to recreate the pressure that natural gas has before it is separated from the crude oil, and this happens at special subsea compression systems.
When the gas has been through a compres-sion system, it can be transmitted through pipelines to processing plants onshore.
6-3-5 Riser baseThe riser base is a support structure for the tie-in of a pipeline at one-end and flexible risers at the other. The riser base may have the following features:
• Isolation with single or dual valve(s), both ROV operated or hydraulically actuated
• Retrievable check valve module• Sliding design, allowing direct tie-in with-
out spool • Anchor point for riser loads
6-3-6 Manifolds and gatheringsA subsea manifold is a large metal construc-tion of equipment, made up of pipes and valves and designed to transfer oil/gas from wellheads into a pipeline. A manifold thus works as a gigantic connector.
Manifolds are usually mounted on a tem-plate and often have a protective structure covering them - as with the image below right.
Manifolds vary greatly in size and shape, though can be huge structures reaching heights of 30 m.
Most subsea templates/manifolds will be protected by a 500 m safety zone centered on one position. However, other equipment may also be clustered within the same area, justifying the need to have a safety zone.
6-3-7 Electrical and hydraulic distribution
The need for electricity and hydraulic pressure is significant on an offshore oil and gas installation and electrical and hydraulic systems ensure correct pressure or correct voltage at installations.
In the same way as power cables go through a transformer in order to transform the current, the subsea systems transform 24-36 kV into ordinary power.
Electrical power is used for:
• Power distribution from topside variable speed drives (VSD) on platforms/FPSOs to subsea pumps and compressors
• Power from offshore installations or on-shore terminals to subsea pump/compres-sion stations, with subsea circuit breakers and VSD systems
• Subsea electrical flowline heating systems for flow assurance
• Systems for distribution of power from offshore/subsea installations to shore or other platforms.
6-3-8 Umbilicals and power cablesUmbilicals describes all types of supply cables required to make a subsea installa-tion function. Optical fibre cables ensure communication between the many types of equipment, meters and valves while other types of cables supply installations with hydraulic pressure, etc.
Umbilicals form the critical link between a subsea production arrangement and a remote facility providing control, power, communications and chemical services.
Applications include production control, chemical injection, subsea pumping and processing, gas lift and underground gas storage among others.
Figure 6.4 – Umbilicals prepared for installation. Courtesy: AkerSolutions.
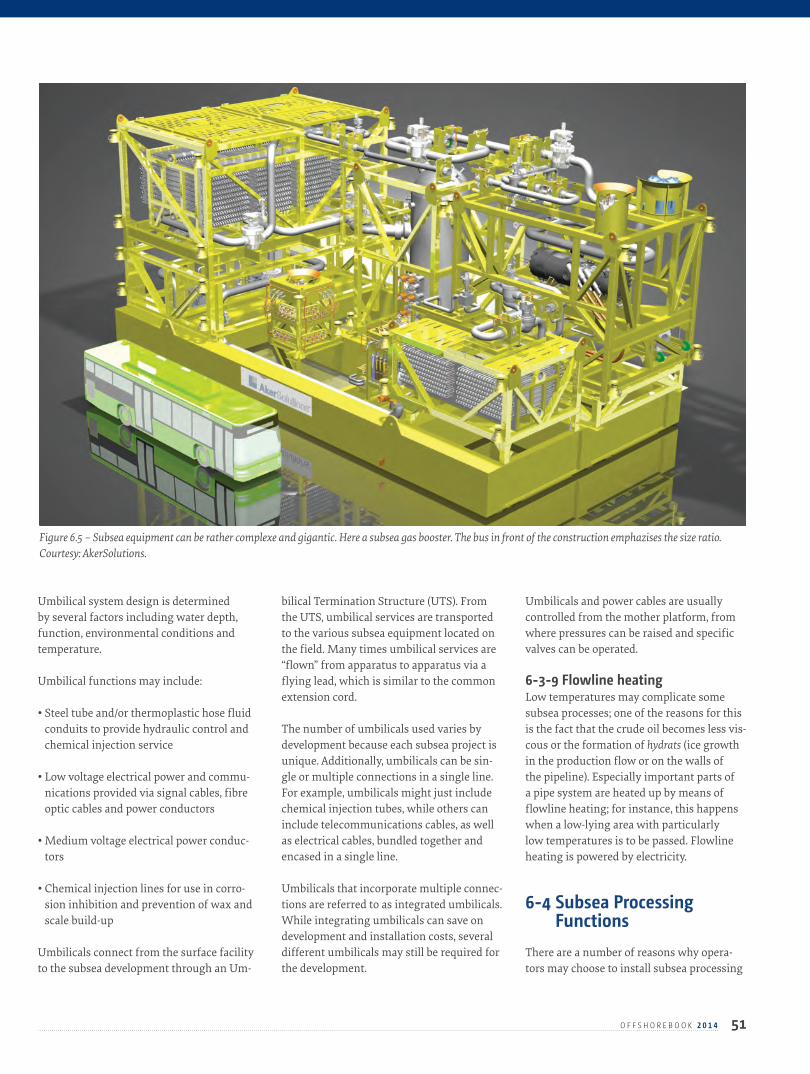
51O F F S H O R E B O O K 2 0 1 4
Umbilical system design is determined by several factors including water depth, function, environmental conditions and temperature.
Umbilical functions may include:
• Steel tube and/or thermoplastic hose fluid conduits to provide hydraulic control and chemical injection service
• Low voltage electrical power and commu-nications provided via signal cables, fibre optic cables and power conductors
• Medium voltage electrical power conduc-tors
• Chemical injection lines for use in corro-sion inhibition and prevention of wax and scale build-up
Umbilicals connect from the surface facility to the subsea development through an Um-
bilical Termination Structure (UTS). From the UTS, umbilical services are transported to the various subsea equipment located on the field. Many times umbilical services are “flown” from apparatus to apparatus via a flying lead, which is similar to the common extension cord.
The number of umbilicals used varies by development because each subsea project is unique. Additionally, umbilicals can be sin-gle or multiple connections in a single line. For example, umbilicals might just include chemical injection tubes, while others can include telecommunications cables, as well as electrical cables, bundled together and encased in a single line.
Umbilicals that incorporate multiple connec-tions are referred to as integrated umbilicals. While integrating umbilicals can save on development and installation costs, several different umbilicals may still be required for the development.
Umbilicals and power cables are usually controlled from the mother platform, from where pressures can be raised and specific valves can be operated.
6-3-9 Flowline heatingLow temperatures may complicate some subsea processes; one of the reasons for this is the fact that the crude oil becomes less vis-cous or the formation of hydrats (ice growth in the production flow or on the walls of the pipeline). Especially important parts of a pipe system are heated up by means of flowline heating; for instance, this happens when a low-lying area with particularly low temperatures is to be passed. Flowline heating is powered by electricity.
6-4 Subsea Processing Functions
There are a number of reasons why opera-tors may choose to install subsea processing
Figure 6.5 – Subsea equipment can be rather complexe and gigantic. Here a subsea gas booster. The bus in front of the construction emphazises the size ratio. Courtesy: AkerSolutions.

52 O F F S H O R E B O O K 2 0 1 4
equipment. First of all, most subsea pro-cessing will increase the recovery from the field, thus increasing profits. Additionally, by enhancing the efficiency of flowlines and risers, subsea processing contributes to flow management and assurance.
Also, subsea processing enables develop-ment of challenging subsea fields, while re-ducing topside expenditures for equipment. Furthermore, subsea processing converts marginal fields into economically viable developments.
Offshore fields worldwide have encom-passed subsea processing into their devel-opments. Whether the fields are mature and the subsea processing equipment has been installed to increase diminishing production, or the fields incorporated subsea processing from the initial development to overcome deep-water or environmental challenges, the innovative subsea processing systems have enabled the fields to achieve higher rates of production.
Deepwater is a term often used to refer to offshore projects located in water depths greater than around 200 m, where floating drilling vessels and floating oil production units are used, and remotely operated underwater vehicles are required as manned diving is not practical.
While subsea processing has long been a dream of upstream engineers, the technol-ogy has just recently been put into practice. With the successful start-up of the world’s first full-field subsea separation, boosting and injection system on the StatoilHydro-op-erated Tordis field in the North Sea in 2007, the dream became a reality.
Through subsea processing, the mature Tordis oil field increased recovery by an extra 5.6 million m³ oil (35 million bbl) and extended the life of the field by 15 to 17 year.
Shell’s BC-10 project offshore Brazil was the world’s first subsea system with gas/liquid separation and boosting. Developed via 13 subsea wells, six subsea separators and boosters, and an FPSO, the BC-10 project began producing heavy oil from ultra-deep waters in July 2009.
Subsea Production Systems are typical wells located on the sea floor, shallow or deep water. The oil well is drilled by a movable rig, and the extracted oil or natural gas is trans-ported by pipeline under the sea and then to rise to a processing facility. It is classified into the following:
• Subsea production control system• Subsea structures and manifold system• Subsea intervention system• Subsea umbilical system• Subsea processing system
The term shallow water or shelf is used for very shallow water depths where bot-tom-founded facilities like jackup drilling rigs and fixed offshore structures can be used, and where saturation diving is feasi-ble.
6-5 Subsea Production Systems
Subsea production systems can range in complexity from a single satellite well with a flowline linked to a fixed platform, FPSO or an onshore installation, to several wells on a template or clustered around a manifold, and transferring to a fixed or floating facili-ty, or directly to an onshore installation.
Subsea production systems can be used to develop reservoirs, or parts of reservoirs, which require drilling of the wells from more than one location. Deep water condi-tions, or even ultra-deep water conditions, can also inherently dictate development of a field by means of a subsea production sys-tem, since traditional surface facilities such as on a steel-piled jacket, might be either technically unfeasible or uneconomical due to the water depth.
A full-scale test (System Integration Test – SIT) does not provide satisfactory verifica-tion of deep-water systems because the test, for practical reasons, cannot be performed under conditions identical to those under which the system will later operate. The oil industry has therefore adopted modern data technology as a tool for virtual testing of deep-water systems that enables detection of costly faults at an early phase of the project.
By using modern simulation tools, mod-els of deep-water systems can be set up and used to verify the system’s functions, and dynamic properties, against various requirements specifications. This includes the model-based development of innovative high-tech plants and system solutions for the exploitation and production of energy resources in an environmentally friendly
Figure 6.6 – The Siri field is one of a number of Danish oil and gas fields using subsea solutions.

53O F F S H O R E B O O K 2 0 1 4
way as well as the analysis and evaluation of the dynamic behaviour of components and systems used for the production and distribution of oil and gas.
6-6 Examples of subsea technology in Denmark
Subsea constructions have been established several places in the North Sea during the past 20 years to improve production efficien-cy or exploit the low depths to save precious structures above sea level.
First subsea installation in Danish part of the North Sea was the Regnar Field, a single vertical well developed as a satellite to the Dan Field. The Regnar Field was set in production in 1993, but due to technical problems the field is not longer active.
Another subsea installation is the Stine segment 1 and 2 which has been developed as a subsea satellite to the Siri field in the north-western part of the Danish sector of the North Sea operated by DONG Energy.
Production from Stine segment 1 and 2 is transported to the Siri installation for pro-cessing. The produced oil is transported to the storage tank on the seabed, and from the tank, the oil is transported to a tank vessel.
The Siri field includes an oil storage tank on the seabed and the loading buoy installation for oil, the satellites Nini, Nini East and Ce-cilie plus the underwater installations Stine segment 1 and 2.
The tank dimensions are 50 x 66 m and 17.5 m in height. It has an effective storage volume of 50,000 m³.
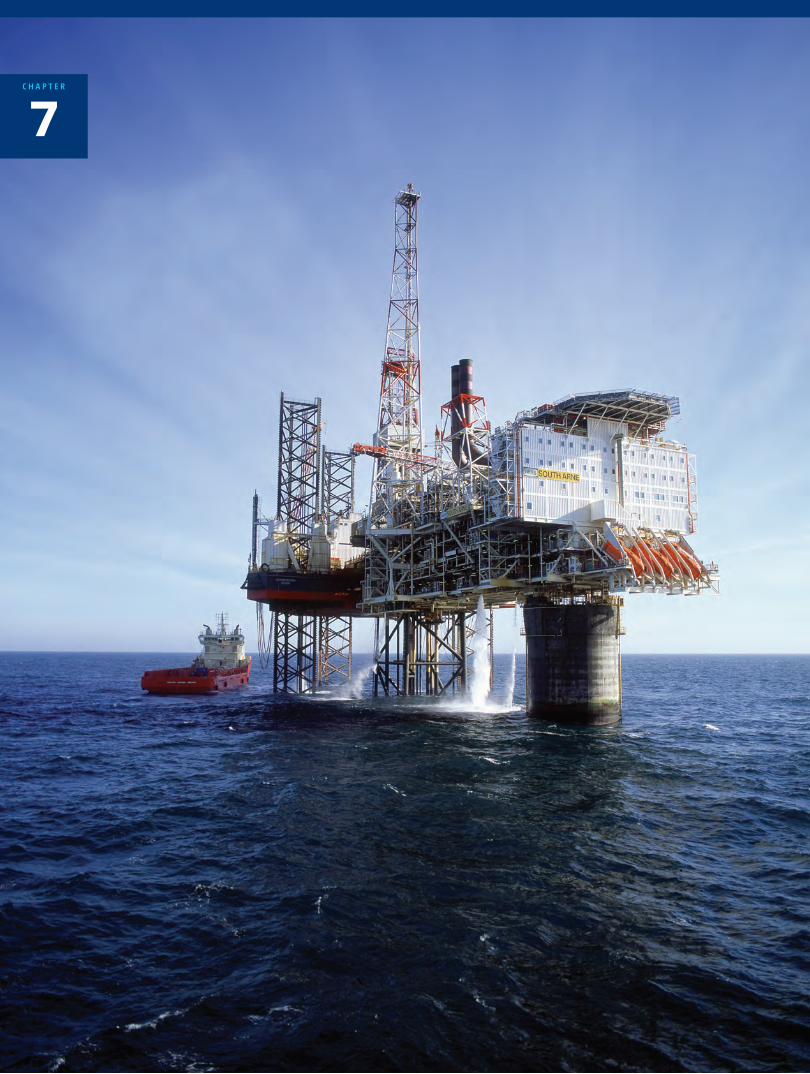
7C H A P T E R
55O F F S H O R E B O O K 2 0 1 4
7-1 How are Oil and Natural Gas produced?
Before a well can produce oil or gas, the borehole must be stabilized with casing, which is a length of pipe cemented in place. A small diameter tubing string is centred in the well bore and held in place with packers. It enables the hydrocarbons to be brought from the reservoir to the surface.
Due to underground forces reservoirs typ-ically have an elevated pressure. To control the pressure and avoid blowouts of oil and gas, a series of valves and equipment are in-stalled at the top of the well. This installation is called a “Christmas Tree” and regulates the flow of hydrocarbons out of the well.
Early in its production life, overpressure in the reservoir typically pushes the hydro-carbons all the way up the well bore to the surface like a carbonated soft drink that has been shaken. Depending on reservoir condi-tions, this “natural flow” may continue for many years. When the pressure differential is insufficient for the oil to flow naturally, artificial lift may be used to bring the oil up to the surface. The most common process is the artificial lift by means of gas lift.
As a field ages, the company may choose several production recovery technics where an external fluid such as water or gas is injected into the reservoir through injection wells. Usually the injection wells are wells in the field that are converted from production wells to injection wells.
In the so-called “water flooding” technique, some of these wells are used to inject water (often produced water from the field) into the reservoir. This water tends to push the oil out of the pores in the rock toward the producing well. Water flooding will often increase production from a field.
Another production recovery technique, gas
or water may be re-injected into the reser-voir through the injection wells to sustain a high reservoir pressure. In more advanced cases, the company may use more sophisti-cated techniques, collectively referred to as Enhanced Oil Recovery (EOR).
Depending on reservoir conditions, various substances may be injected into the reser-voir to extract more oil from the pore spaces and increase production. These substances can be steam, nitrogen, carbon dioxide or surfactants (soap).
Throughout their productive life, most oil wells produce oil, gas, and water. This mix-ture is separated at the surface. Initially, the mixture coming from the reservoir may be mostly oil with a small amount of water.
Over time, the proportion of water increases and it may be re-injected into the reservoir either as part of a water-flooding project or for disposal. In the latter case the water is returned to the subsurface. Natural gas wells do not usually produce oil, but occasionally produce Natural Gas Liquid (NGL) which can be a significant part of the total produc-tion value for a field.
These natural gas liquids are removed in the field or at a gas processing plant that removes other impurities as well. Natural gas liquids often have significant value as raw material for the petrochemical industry. These wells often produce water as well, but volumes are much lower when compared to oil wells.
Once produced, oil may be stored in tanks and later transported by ship to a site where it will be sold or enter the transportation sys-tem. Or it goes from the separation facilities at the wellhead direct into a small pipeline and from there into a larger one.
Pipelines are frequently used to bring production from offshore wells to shore.
They may also transfer oil from a producing field to a tanker loading area for shipping or from a port area to a refinery to be processed into petrol, diesel or fuel, and many other products.
Natural gas is almost always transported through pipelines. Because of difficulties in transferring it from where it is found to where potential consumers are, any known gas deposits are not currently being pro-duced. Years ago, the gas would have been wasted (flared) as an unwanted by-product of oil production.
However, now industry recognizes the value of clean-burning natural gas and is working on improved technologies to get it from the reservoir to the consumer.
Once the individual well streams are brought into the main production facilities over a network of gathering pipelines and manifold systems, another phase of the production process will start. Some of the main offshore installations and processes are summarised in figure 7.1.
7-2-1 Separation ProcessCrude oil usually consists of different components in 2 or 3 different phases, namely liquid, gas and solid. The industry uses several separation mechanisms, such as separation utilizing by gravity or centrifugal forces as well as electric and/or magnetic fields, to separate these from one another. Separation by gravity is mostly used in the petroleum industry to separate crude oil into oil, water and gas.
Separators with different configurations such as vertical, horizontal and/or spheri-cal are used in this type of separation. The purpose is to separate gas from liquid with a minimum of liquid transfer in the gas stream or liquid from gas with a minimum of gas bubbles entrapped in the liquid. The oil and gas treatment industry requires a
PRODUCTION OF OIL AND GAS
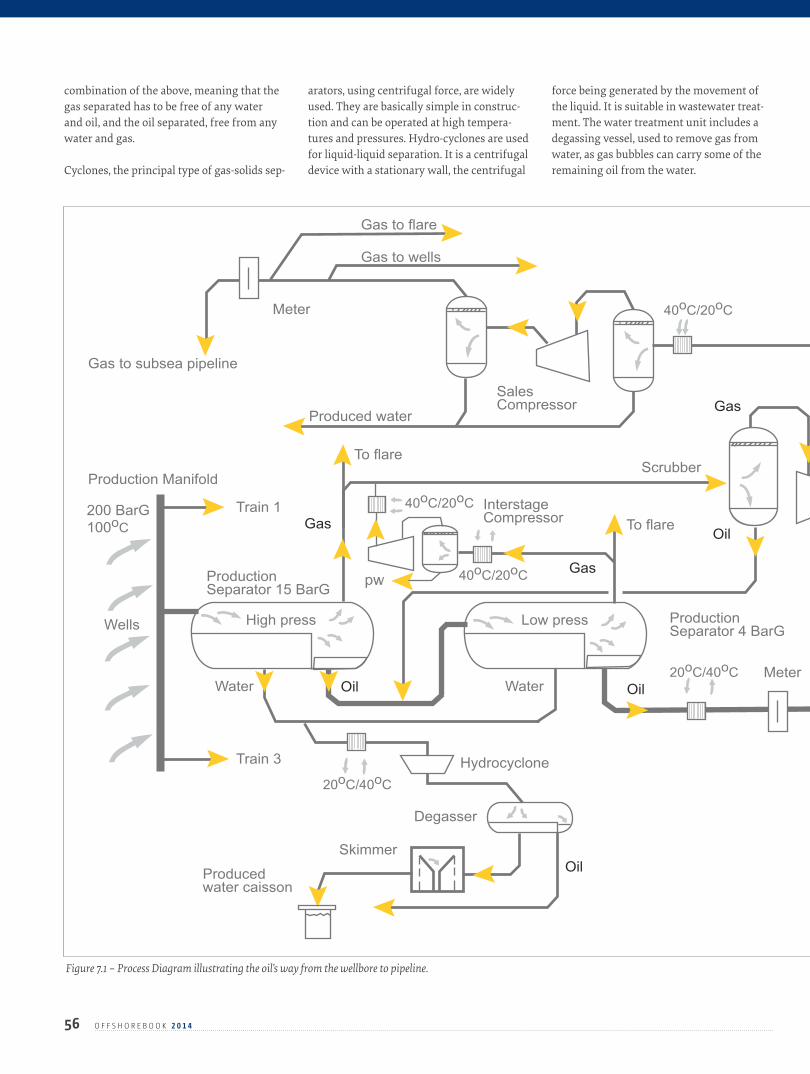
combination of the above, meaning that the gas separated has to be free of any water and oil, and the oil separated, free from any water and gas.
Cyclones, the principal type of gas-solids sep-
arators, using centrifugal force, are widely used. They are basically simple in construc-tion and can be operated at high tempera-tures and pressures. Hydro-cyclones are used for liquid-liquid separation. It is a centrifugal device with a stationary wall, the centrifugal
force being generated by the movement of the liquid. It is suitable in wastewater treat-ment. The water treatment unit includes a degassing vessel, used to remove gas from water, as gas bubbles can carry some of the remaining oil from the water.
56 O F F S H O R E B O O K 2 0 1 4
Wells
Skimmer
Producedwater caisson
Crude oil DischargePumps
Hydrocyclone
Degasser
Scrubber
20oC/40oC
20oC/40oC
40oC/20oC
40oC/20oC
40oC/20oC
Production Manifold
Gas to subsea pipeline
200 BarG100oC
Production Separator 15 BarG
Train 1
Train 3
InterstageCompressor
Compressor
Oil to subsea pipeline
Production Separator 4 BarG
: Heat exchanger
BarG : Relative pressure
Meter
SalesCompressor
Gas to flare
Gas to wells
To flare
Low pressHigh press
To flare
Oil
Oil
Oil
Oil
Gas
Gas
GasProduced water
Meter
Water Water
Figure 7.1 – Process Diagram illustrating the oil’s way from the wellbore to pipeline.
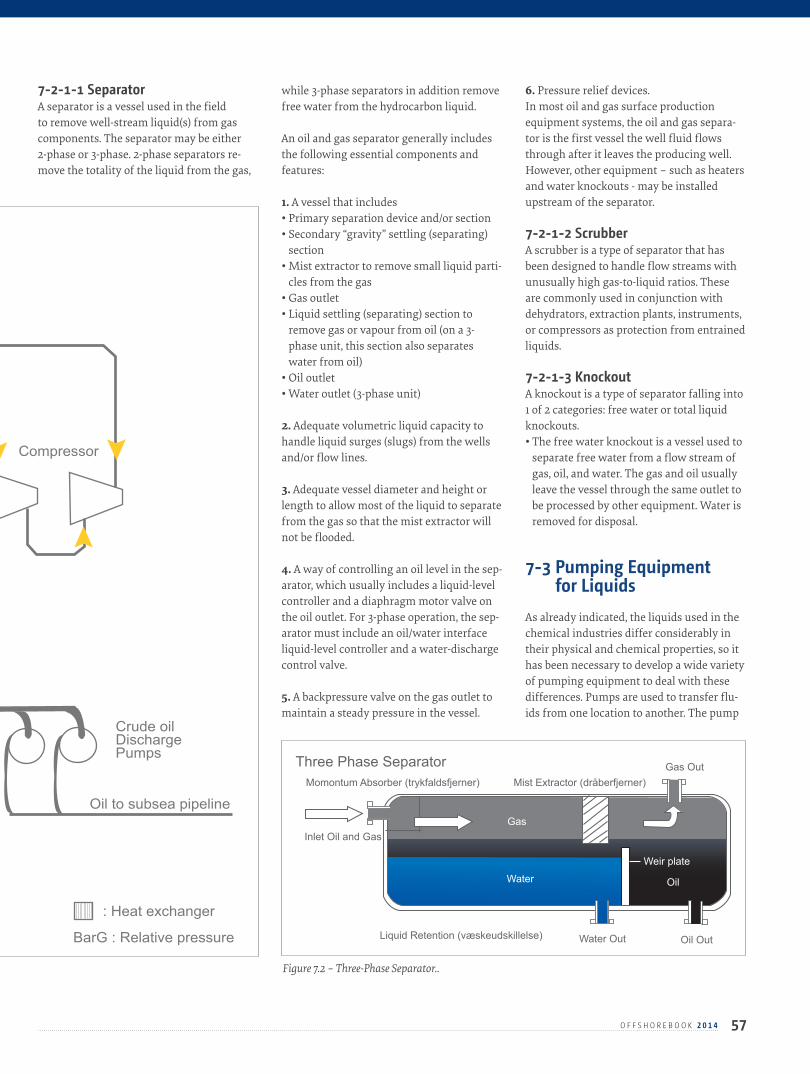
7-2-1-1 SeparatorA separator is a vessel used in the field to remove well-stream liquid(s) from gas components. The separator may be either 2-phase or 3-phase. 2-phase separators re-move the totality of the liquid from the gas,
while 3-phase separators in addition remove free water from the hydrocarbon liquid.
An oil and gas separator generally includes the following essential components and features:
1. A vessel that includes• Primary separation device and/or section• Secondary “gravity” settling (separating)
section• Mist extractor to remove small liquid parti-
cles from the gas• Gas outlet• Liquid settling (separating) section to
remove gas or vapour from oil (on a 3- phase unit, this section also separates water from oil)
• Oil outlet• Water outlet (3-phase unit)
2. Adequate volumetric liquid capacity to handle liquid surges (slugs) from the wells and/or flow lines.
3. Adequate vessel diameter and height or length to allow most of the liquid to separate from the gas so that the mist extractor will not be flooded.
4. A way of controlling an oil level in the sep-arator, which usually includes a liquid-level controller and a diaphragm motor valve on the oil outlet. For 3-phase operation, the sep-arator must include an oil/water interface liquid-level controller and a water-discharge control valve.
5. A backpressure valve on the gas outlet to maintain a steady pressure in the vessel.
6. Pressure relief devices.In most oil and gas surface production equipment systems, the oil and gas separa-tor is the first vessel the well fluid flows through after it leaves the producing well. However, other equipment – such as heaters and water knockouts - may be installed upstream of the separator.
7-2-1-2 ScrubberA scrubber is a type of separator that has been designed to handle flow streams with unusually high gas-to-liquid ratios. These are commonly used in conjunction with dehydrators, extraction plants, instruments, or compressors as protection from entrained liquids.
7-2-1-3 KnockoutA knockout is a type of separator falling into 1 of 2 categories: free water or total liquid knockouts.• The free water knockout is a vessel used to
separate free water from a flow stream of gas, oil, and water. The gas and oil usually leave the vessel through the same outlet to be processed by other equipment. Water is removed for disposal.
7-3 Pumping Equipment for Liquids
As already indicated, the liquids used in the chemical industries differ considerably in their physical and chemical properties, so it has been necessary to develop a wide variety of pumping equipment to deal with these differences. Pumps are used to transfer flu-ids from one location to another. The pump
57O F F S H O R E B O O K 2 0 1 4
Wells
Skimmer
Producedwater caisson
Crude oil DischargePumps
Hydrocyclone
Degasser
Scrubber
20oC/40oC
20oC/40oC
40oC/20oC
40oC/20oC
40oC/20oC
Production Manifold
Gas to subsea pipeline
200 BarG100oC
Production Separator 15 BarG
Train 1
Train 3
InterstageCompressor
Compressor
Oil to subsea pipeline
Production Separator 4 BarG
: Heat exchanger
BarG : Relative pressure
Meter
SalesCompressor
Gas to flare
Gas to wells
To flare
Low pressHigh press
To flare
Oil
Oil
Oil
Oil
Gas
Gas
GasProduced water
Meter
Water Water
Figure 7.2 – Three-Phase Separator..
Momontum Absorber (trykfaldsfjerner) Mist Extractor (dråberfjerner)Gas Out
Water Out Oil OutLiquid Retention (væskeudskillelse)
Inlet Oil and GasGas
Water Oil
Weir plate
Three Phase Separator

58 O F F S H O R E B O O K 2 0 1 4
accomplishes this transfer by increasing the pressure of the fluid and thereby supplying the driving force necessary for flow.Power must be delivered to the pump from an external source. Thus, electrical or steam energy can be transformed into mechani-cal energy which is then used to drive the pump. Most of the mechanical energy is added to the fluid as work energy, and the rest is lost as friction due to inefficiency of the pump and the drive.
Pump selection is made on the flow rate and head required, together with other process considerations, such as corrosion or the presence of solid in the fluid. The selection of the pump cannot be separated from the design of the complete piping system; for example, the total head required will be the sum of the dynamic head due to friction losses in the piping, fittings, valves and process equipment, and any static head due to differences in elevation.
Cost and mechanical efficiency of the pump must be considered in relation to one another, so it may be advantageous to select a cheap pump and pay higher replacement or maintenance costs rather than to install a very expensive pump of high efficiency.
7-3-1 Types of PumpsSelection of a pump for a specific service re-quires knowledge of the liquid to be handled, the total dynamic head required, the suction
and discharge heads, and in most cases, the temperature, viscosity, vapor pressure and density of the fluid. Special attention will need to be given to those cases where the liquid contains solids. Pumps fall into 3 categories: positive displacement, kinetic (centrifugal), and jet (eductor), their names describing the method by which liquid is displaced.
A positive displacement pump causes a fluid to move by trapping a fixed volume of the fluid and then forcing (displacing) that trapped volume into the receiving pipe. Positive displacement pumps can be further classified as either rotary (for example the rotary vane pump) or reciprocating (for example the diaphragm pump).
A centrifugal pump causes a fluid to move by transferring the kinetic (rotational) energy from a motor (through an impeller) into water pressure (potential energy). An eductor-jet pump is a special type of pump without moving parts that uses the kinetic energy of a fluid to increase the pressure of a second fluid.
7-3-2 CavitationCavitation is a common occurrence but is the least understood of all pumping problems. A pump is cavitating if knocking noises and vibrations can be heard when it is operating. The noise and vibration are caused by vapor “bubbles” collapsing when the liquid “boils”. Other signs of cavitation are erratic power consumption and fluctua-tion or reduction in output.
If the pump continues to operate while it is cavitating, it will be damaged. Impeller surfaces and pump bowls will pit and wear, eventually leading to mechanical destruc-tion. On entering a pump, a liquid increases its velocity causing a reduction in pressure within the pumping unit. If this pressure gets too low, the liquid will vaporize, form-ing bubbles entrained in the liquid. These bubbles collapse violently as they move to areas of higher pressure. This is cavitation.
The pressure required to operate a pump satisfactorily and avoid cavitation is called net positive suction head (NPSH). The head available at the pump inlet should therefore exceed the required NPSH.
This is specified by the pump manufacturer and is a function of the pump design. As this problem relates only to the suction side of the pump, all prevention measures should be directed towards this area, and suction lifts that are too high should be avoided. As a general rule centrifugal pumps located less than 4 m above the liquid level do not experience cavitation. The following guide-lines should be applied so as to overcome the problem:
• Avoid unnecessary valves and bends in the suction pipe.
• Avoid long suction lines.• Keep the suction pipe at least as large in
diameter as the pump inlet connection.• Use long radius bends.• Increase the size of valves and pipe work to
avoid air intake into the suction line.• Ensure adequate submergence over the
foot valve. The submergence should be at least 5.3 times the suction line diameter.
A possible solution would be to reduce the required net positive suction head. This can be done by lowering the pump speed. However, this will also result in reduced output from the pump which may not suit the system.
7-4 Compressor A compressor is a device that transfers energy to a gaseous fluid, the purpose being to raise the pressure of the fluid e.g. where it is the prime mover of the fluid through the process.
Compressors are driven by gas turbines or electrical motors. Often several stages in the same train are driven by the same motor or turbine.
The main purposes of gas compression offshore are for:
• Gas export• Gas injection to well• Gas lift• Fuel gas
The compression process includes a large section of associated equipments such as scrubbers (removing liquid droplets), heat exchangers and lube oil treatment etc.
Figure 7.3 – Scrubber.
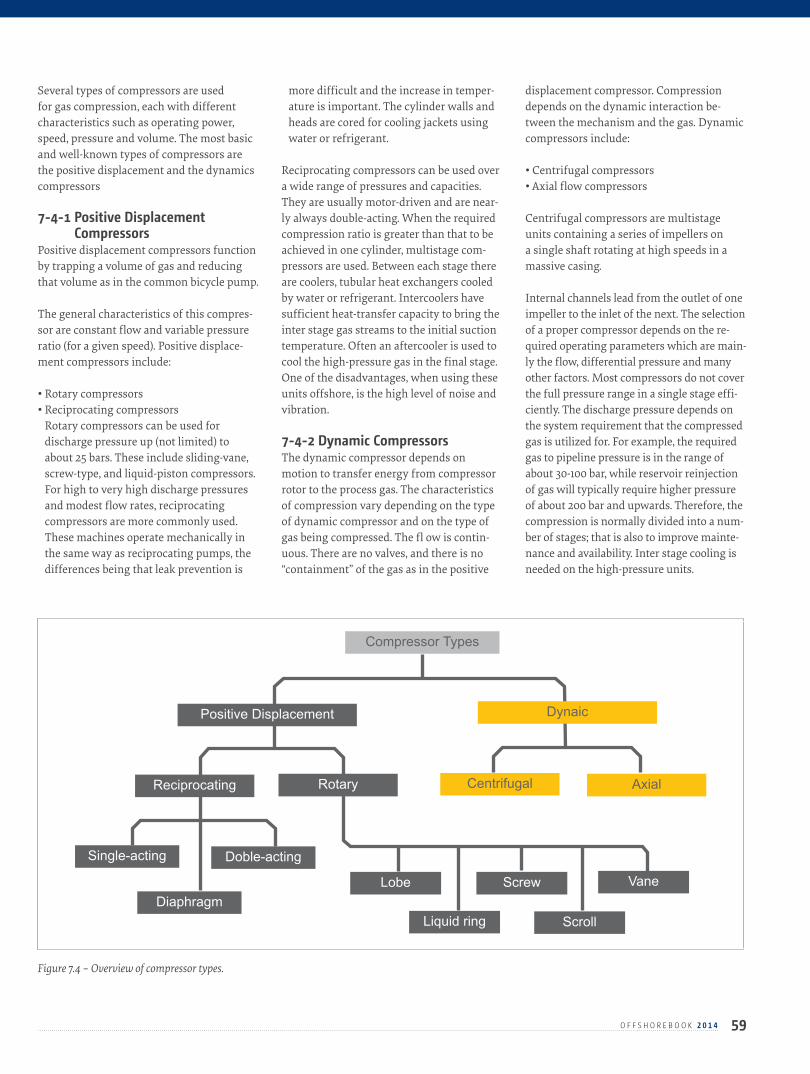
59O F F S H O R E B O O K 2 0 1 4
Several types of compressors are used for gas compression, each with different characteristics such as operating power, speed, pressure and volume. The most basic and well-known types of compressors are the positive displacement and the dynamics compressors
7-4-1 Positive Displacement Compressors
Positive displacement compressors function by trapping a volume of gas and reducing that volume as in the common bicycle pump.
The general characteristics of this compres-sor are constant flow and variable pressure ratio (for a given speed). Positive displace-ment compressors include:
• Rotary compressors• Reciprocating compressors
Rotary compressors can be used for discharge pressure up (not limited) to about 25 bars. These include sliding-vane, screw-type, and liquid-piston compressors. For high to very high discharge pressures and modest flow rates, reciprocating compressors are more commonly used. These machines operate mechanically in the same way as reciprocating pumps, the differences being that leak prevention is
more difficult and the increase in temper-ature is important. The cylinder walls and heads are cored for cooling jackets using water or refrigerant.
Reciprocating compressors can be used over a wide range of pressures and capacities. They are usually motor-driven and are near-ly always double-acting. When the required compression ratio is greater than that to be achieved in one cylinder, multistage com-pressors are used. Between each stage there are coolers, tubular heat exchangers cooled by water or refrigerant. Intercoolers have sufficient heat-transfer capacity to bring the inter stage gas streams to the initial suction temperature. Often an aftercooler is used to cool the high-pressure gas in the final stage. One of the disadvantages, when using these units offshore, is the high level of noise and vibration.
7-4-2 Dynamic CompressorsThe dynamic compressor depends on motion to transfer energy from compressor rotor to the process gas. The characteristics of compression vary depending on the type of dynamic compressor and on the type of gas being compressed. The fl ow is contin-uous. There are no valves, and there is no “containment” of the gas as in the positive
displacement compressor. Compression depends on the dynamic interaction be-tween the mechanism and the gas. Dynamic compressors include:
• Centrifugal compressors• Axial flow compressors
Centrifugal compressors are multistage units containing a series of impellers on a single shaft rotating at high speeds in a massive casing.
Internal channels lead from the outlet of one impeller to the inlet of the next. The selection of a proper compressor depends on the re-quired operating parameters which are main-ly the flow, differential pressure and many other factors. Most compressors do not cover the full pressure range in a single stage effi-ciently. The discharge pressure depends on the system requirement that the compressed gas is utilized for. For example, the required gas to pipeline pressure is in the range of about 30-100 bar, while reservoir reinjection of gas will typically require higher pressure of about 200 bar and upwards. Therefore, the compression is normally divided into a num-ber of stages; that is also to improve mainte-nance and availability. Inter stage cooling is needed on the high-pressure units.
Compressor Types
Positive Displacement Dynaic
Reciprocating
Single-acting Doble-acting
DiaphragmLobe
Liquid ring
Screw Vane
Scroll
Rotary Centrifugal Axial
Figure 7.4 – Overview of compressor types.
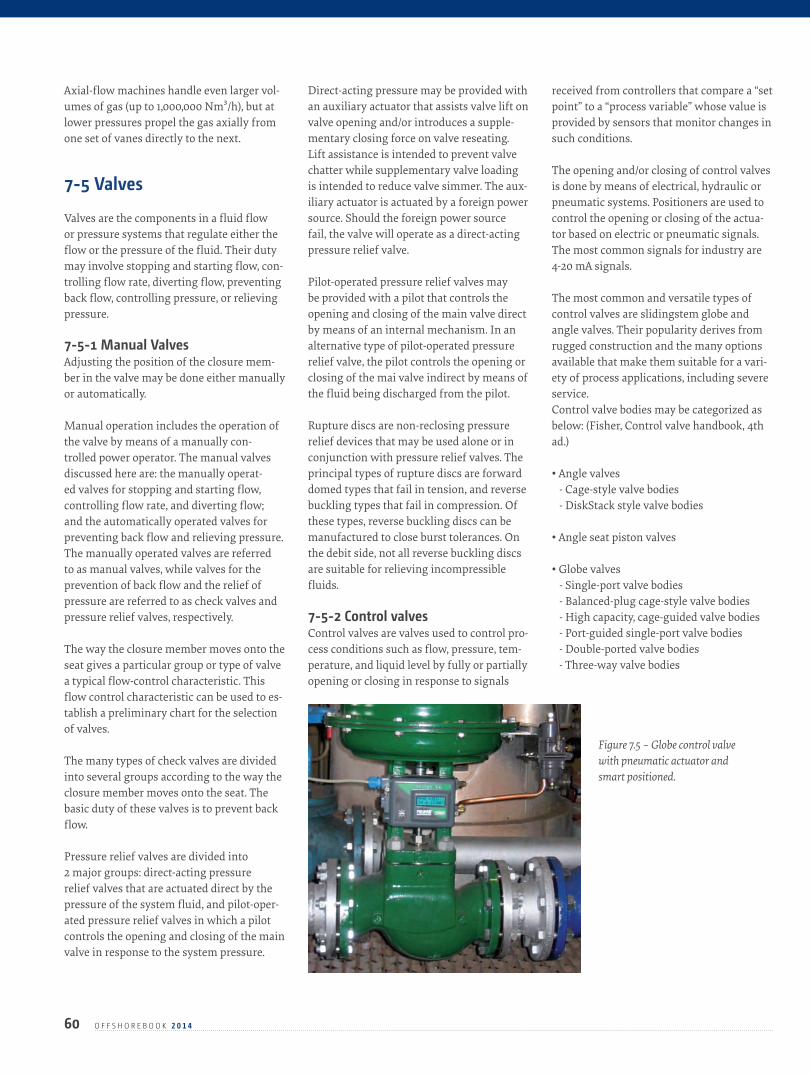
60 O F F S H O R E B O O K 2 0 1 4
Axial-flow machines handle even larger vol-umes of gas (up to 1,000,000 Nm³/h), but at lower pressures propel the gas axially from one set of vanes directly to the next.
7-5 Valves Valves are the components in a fluid flow or pressure systems that regulate either the flow or the pressure of the fluid. Their duty may involve stopping and starting flow, con-trolling flow rate, diverting flow, preventing back flow, controlling pressure, or relieving pressure.
7-5-1 Manual ValvesAdjusting the position of the closure mem-ber in the valve may be done either manually or automatically.
Manual operation includes the operation of the valve by means of a manually con-trolled power operator. The manual valves discussed here are: the manually operat-ed valves for stopping and starting flow, controlling flow rate, and diverting flow; and the automatically operated valves for preventing back flow and relieving pressure. The manually operated valves are referred to as manual valves, while valves for the prevention of back flow and the relief of pressure are referred to as check valves and pressure relief valves, respectively.
The way the closure member moves onto the seat gives a particular group or type of valve a typical flow-control characteristic. This flow control characteristic can be used to es-tablish a preliminary chart for the selection of valves.
The many types of check valves are divided into several groups according to the way the closure member moves onto the seat. The basic duty of these valves is to prevent back flow.
Pressure relief valves are divided into 2 major groups: direct-acting pressure relief valves that are actuated direct by the pressure of the system fluid, and pilot-oper-ated pressure relief valves in which a pilot controls the opening and closing of the main valve in response to the system pressure.
Direct-acting pressure may be provided with an auxiliary actuator that assists valve lift on valve opening and/or introduces a supple-mentary closing force on valve reseating. Lift assistance is intended to prevent valve chatter while supplementary valve loading is intended to reduce valve simmer. The aux-iliary actuator is actuated by a foreign power source. Should the foreign power source fail, the valve will operate as a direct-acting pressure relief valve.
Pilot-operated pressure relief valves may be provided with a pilot that controls the opening and closing of the main valve direct by means of an internal mechanism. In an alternative type of pilot-operated pressure relief valve, the pilot controls the opening or closing of the mai valve indirect by means of the fluid being discharged from the pilot.
Rupture discs are non-reclosing pressure relief devices that may be used alone or in conjunction with pressure relief valves. The principal types of rupture discs are forward domed types that fail in tension, and reverse buckling types that fail in compression. Of these types, reverse buckling discs can be manufactured to close burst tolerances. On the debit side, not all reverse buckling discs are suitable for relieving incompressible fluids.
7-5-2 Control valvesControl valves are valves used to control pro-cess conditions such as flow, pressure, tem-perature, and liquid level by fully or partially opening or closing in response to signals
received from controllers that compare a “set point” to a “process variable” whose value is provided by sensors that monitor changes in such conditions.
The opening and/or closing of control valves is done by means of electrical, hydraulic or pneumatic systems. Positioners are used to control the opening or closing of the actua-tor based on electric or pneumatic signals. The most common signals for industry are 4-20 mA signals.
The most common and versatile types of control valves are slidingstem globe and angle valves. Their popularity derives from rugged construction and the many options available that make them suitable for a vari-ety of process applications, including severe service.Control valve bodies may be categorized as below: (Fisher, Control valve handbook, 4th ad.)
• Angle valves - Cage-style valve bodies - DiskStack style valve bodies
• Angle seat piston valves
• Globe valves - Single-port valve bodies - Balanced-plug cage-style valve bodies - High capacity, cage-guided valve bodies - Port-guided single-port valve bodies - Double-ported valve bodies - Three-way valve bodies
Figure 7.5 – Globe control valve with pneumatic actuator and smart positioned.
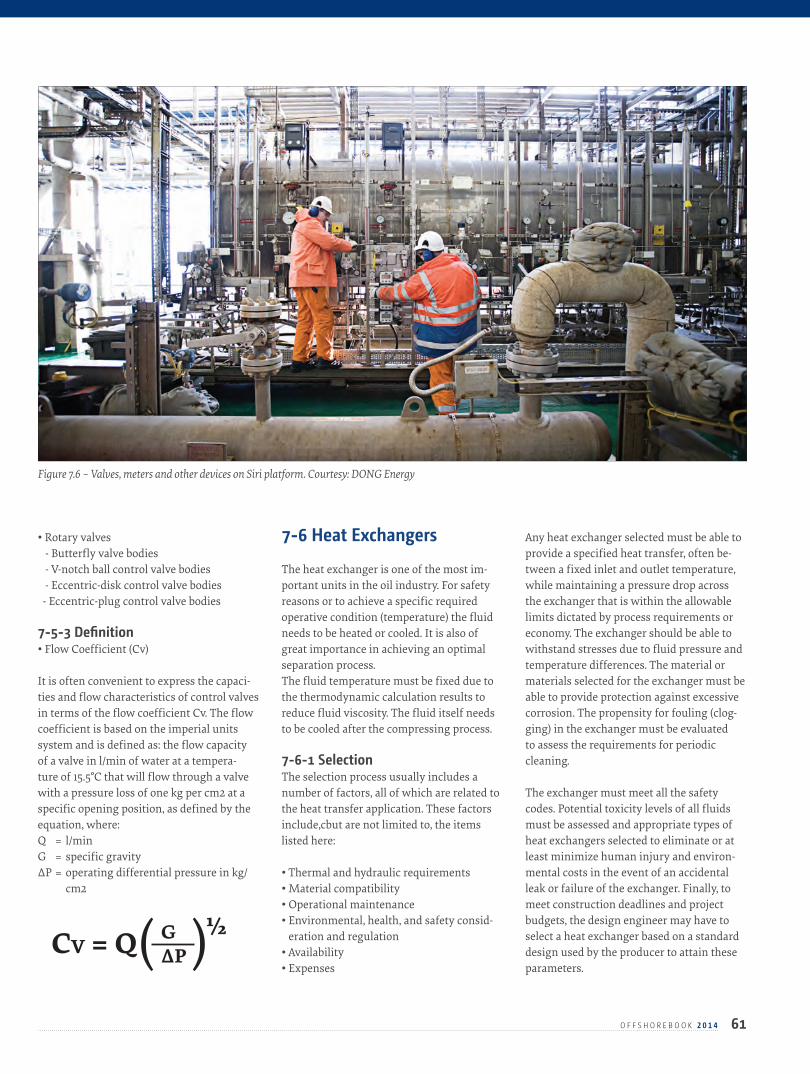
61O F F S H O R E B O O K 2 0 1 4
• Rotary valves - Butterfly valve bodies - V-notch ball control valve bodies - Eccentric-disk control valve bodies - Eccentric-plug control valve bodies
7-5-3 Definition• Flow Coefficient (Cv)
It is often convenient to express the capaci-ties and flow characteristics of control valves in terms of the flow coefficient Cv. The flow coefficient is based on the imperial units system and is defined as: the flow capacity of a valve in l/min of water at a tempera-ture of 15.5°C that will flow through a valve with a pressure loss of one kg per cm2 at a specific opening position, as defined by the equation, where:Q = l/minG = specific gravityΔP = operating differential pressure in kg/
cm2
7-6 Heat Exchangers The heat exchanger is one of the most im-portant units in the oil industry. For safety reasons or to achieve a specific required operative condition (temperature) the fluid needs to be heated or cooled. It is also of great importance in achieving an optimal separation process.The fluid temperature must be fixed due to the thermodynamic calculation results to reduce fluid viscosity. The fluid itself needs to be cooled after the compressing process.
7-6-1 SelectionThe selection process usually includes a number of factors, all of which are related to the heat transfer application. These factors include,cbut are not limited to, the items listed here:
• Thermal and hydraulic requirements• Material compatibility• Operational maintenance• Environmental, health, and safety consid-
eration and regulation• Availability• Expenses
Any heat exchanger selected must be able to provide a specified heat transfer, often be-tween a fixed inlet and outlet temperature, while maintaining a pressure drop across the exchanger that is within the allowable limits dictated by process requirements or economy. The exchanger should be able to withstand stresses due to fluid pressure and temperature differences. The material or materials selected for the exchanger must be able to provide protection against excessive corrosion. The propensity for fouling (clog-ging) in the exchanger must be evaluated to assess the requirements for periodic cleaning.
The exchanger must meet all the safety codes. Potential toxicity levels of all fluids must be assessed and appropriate types of heat exchangers selected to eliminate or at least minimize human injury and environ-mental costs in the event of an accidental leak or failure of the exchanger. Finally, to meet construction deadlines and project budgets, the design engineer may have to select a heat exchanger based on a standard design used by the producer to attain these parameters.
Figure 7.6 – Valves, meters and other devices on Siri platform. Courtesy: DONG Energy
CV = Q ( )G∆P
½
62 O F F S H O R E B O O K 2 0 1 4
7-6-2 TypesA typical heat exchanger, usually for high-pressure applications, is the shell-and-tube heat exchanger, consisting of a series of finned tubes, through which one of the fluids runs. The second fluid runs over the finned tubes to be heated or cooled.
Another type of heat exchanger is the plate heat exchanger. One section is composed of multiple, thin, slightly separated plates that have a very large surface area and the other of fluid flow passages which allows heat transfer. This stacked-plate arrangement can be more effective, in a given space, than the shell-and-tube heat exchanger.
Advances in gasket and brazing technology have made the plate type heat exchanger increasingly practical. In HVAC (Heating, Ventilating, and Air Conditioning) applica-tions, large heat exchangers of this type are called plate-and-frame; when used in open loops, these heat exchangers are normally of the gasketed type to allow periodic disas-sembly, cleaning, and inspection. There are many types of permanently-bonded plate heat exchangers such as dip-brazed and vacuum-brazed plate varieties, and they are often specified for closed-loop applications such as refrigeration. Plate heat exchangers also differ according to the types of plates used, and the configuration of these plates.
A third type of heat exchanger is the re-generative heat exchanger. In this type of exchanger, the heat from a process is used to warm the fluids to be used in the process, and the same type of fluid is used on both sides of the heat exchanger.
A fourth type of heat exchanger uses an intermediate fluid or solid store to hold heat which again is moved to the other side of the heat exchanger to be released. 2 examples of this are adiabatic wheels that consist of a large wheel with fine threads rotating through the hot and cold fluids, and heat exchangers with a gas passing upwards through a shower of fluid (often water) and the water then taken elsewhere before being cooled. This is commonly used for cooling gases whilst also removing certain impuri-ties, solving 2 problems at the same time.
Another type of heat exchanger is called
dynamic heat exchanger or scraped surface heat exchanger. This is mainly used for heat-ing or cooling high viscosity products, in crystallization processes and in evaporation and high fouling applications. Long running times are achieved due to the continuous scraping of the surface, thus avoiding foul-ing and achieving a sustainable heat transfer rate during the process.
7-7 Control Systems and Safety
A control system is an interconnection of components forming a system configuration that will provide a desired system response. We need to control many parameters to get the required results. For this purpose we need to control pressure, temperature, flow and the level of the liquid inside the separa-tors. The process at the platform deals with high pressures, explosive gasses, flammable liquids or oil that requires specific safety considerations.
Due to these factors a good safety system needs to be installed to reduce hazards. The computerized emergency shutdown system (ESD) is the most important element in the safety system. Control, in one form or another, is an essential part of any industrial operation.
In all processes it is necessary to keep flows, pressures, temperatures, compositions, etc. within certain limits for safety reasons or as a required specification. This is most often done by measuring the process/ controlled variable, comparing it to the desired value (set point) for the controlled variable and adjusting another variable (manipulated variable) which has a direct effect on the con-trolled variable. This process is repeated until the desired value/set point has been obtained.
In order to design a system so that it operates not only automatically but also effi-ciently, it is necessary to obtain both steady and dynamic (unsteady) state relationships between the particular variables integrated. Automatic operation is highly desirable, as manual control would necessitate continu-ous monitoring of the controlled variable by a human operator.
7-7-1 Computer Control SystemSupervisory Control and Data Acquisition, or SCADA control system is a computerized control system. It can control and monitor all the processes in a greater process such as an offshore platform. The SCADA control system is divided into two subsystems:
1. Process Control System, (PCS): This repre-sents the main controlling computer that gets information from all the processes in operation on the platform. At the same time it will take appropriate action and intervene when necessary.
Units called Remote Terminal Units or (RTU’s) are responsible for transferring the information (signals) between the PCS and the controlling and measuring equipment on the plant. The RTU’s software contains a database, control functions, logic functions and alarm/event treatment.
2. Data Acquisition System, (DAS): It receives data comin from the process control system (PCS) and interprets it, so any developments (variations/discrepan-cies) in the system will be shown in the control room.
In both systems there is a master PCS/DAS and a slave PCS/DAS for back-up, so no data will be lost if the master fails. There is also a report printer and an event printer in addition to a hard copy printer which is linked to all computers through a switch-board for printing visual displays, providing supervisors and operators with an overview of operations.
7-7-2 SafetyHealth and safety are key elements of both the industry and working standards. Oil, gas and petroleum industries operate in danger-ous environments and deal with hazardous products. It is therefore essential to ensure that workers within this industry are highly trained in dealing with health and safety issues, not only for their own protection, but also for protection of the general public and environment. Health and safety legislation also impose very strict standards of safety training.
For any operation in Denmark, offshore in-stallations must be in possession of approv-

63O F F S H O R E B O O K 2 0 1 4
als and permits issued by the Danish Energy Agency. These include Operation Permit, Manning and Organisation Plan Approval and approval for the Contingency Plan.
To obtain an Operation Permit the safety and health conditions for the installation and the operational conditions (Safety and Health Review / Safety Case) and other relevant information regarding safety and health conditions (e.g. certifi cates) should be evaluated. Offshore installations operating in Denmark must have a Safety Organisa-tion in accordance with the relevant Danish regulations.
Usually regulations will require that safety representatives are elected for each work area on the installation. Safety representa-tives must - amongst others in safety groups and in the safety committee - co-operate with management representatives in order to ensure and improve safety and health conditions at the installation. Participants in the Safety Organisation must be trained in accordance with specifications of the DEA.
All offshore installations operating in Den-mark must also have a Work Place Assess-ment System (WPA). When developing and using the WPA system, management and safety representatives, amongst others in the Safety Committee, must cooperate. The WPA system must ensure that all workplaces and all work functions are mapped and evaluat-ed with regard to potential improvements of the safety and health conditions and that relevant improvements are prioritised and implemented as planned.
8C H A P T E R
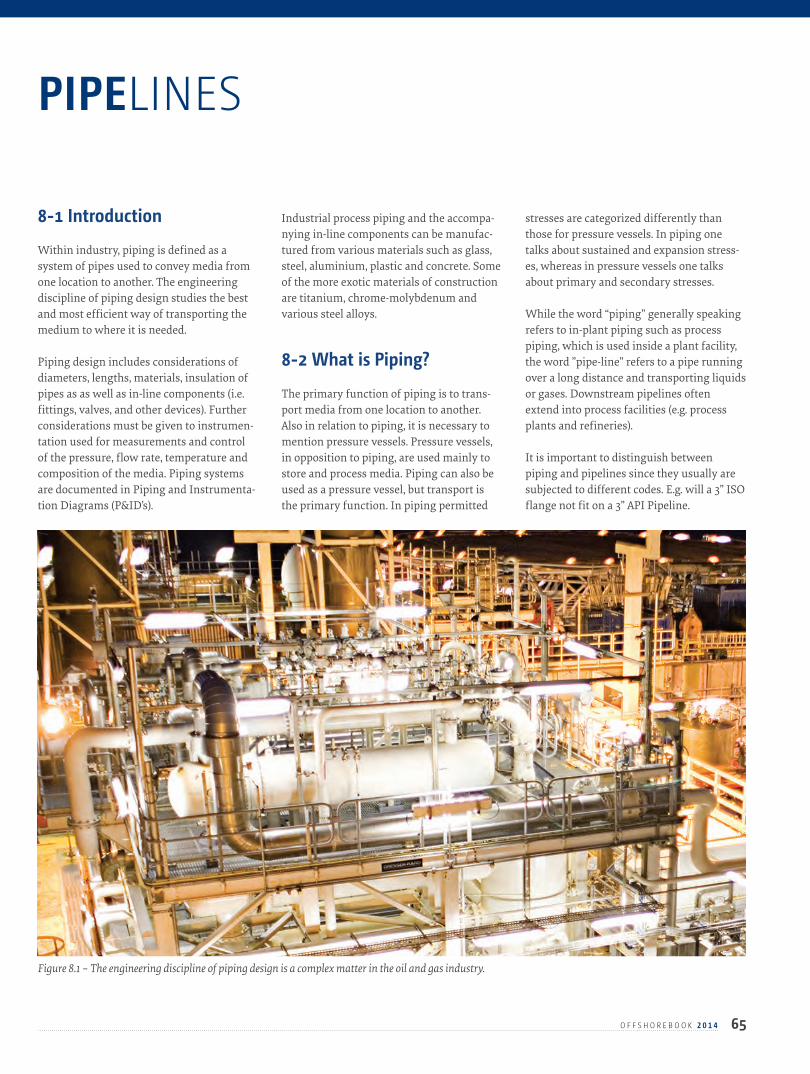
65O F F S H O R E B O O K 2 0 1 4
8-1 Introduction Within industry, piping is defined as a system of pipes used to convey media from one location to another. The engineering discipline of piping design studies the best and most efficient way of transporting the medium to where it is needed.
Piping design includes considerations of diameters, lengths, materials, insulation of pipes as as well as in-line components (i.e. fittings, valves, and other devices). Further considerations must be given to instrumen-tation used for measurements and control of the pressure, flow rate, temperature and composition of the media. Piping systems are documented in Piping and Instrumenta-tion Diagrams (P&ID’s).
Industrial process piping and the accompa-nying in-line components can be manufac-tured from various materials such as glass, steel, aluminium, plastic and concrete. Some of the more exotic materials of construction are titanium, chrome-molybdenum and various steel alloys.
8-2 What is Piping? The primary function of piping is to trans-port media from one location to another. Also in relation to piping, it is necessary to mention pressure vessels. Pressure vessels, in opposition to piping, are used mainly to store and process media. Piping can also be used as a pressure vessel, but transport is the primary function. In piping permitted
stresses are categorized differently than those for pressure vessels. In piping one talks about sustained and expansion stress-es, whereas in pressure vessels one talks about primary and secondary stresses.
While the word “piping” generally speaking refers to in-plant piping such as process piping, which is used inside a plant facility, the word ”pipe-line” refers to a pipe running over a long distance and transporting liquids or gases. Downstream pipelines often extend into process facilities (e.g. process plants and refineries).
It is important to distinguish between piping and pipelines since they usually are subjected to different codes. E.g. will a 3” ISO flange not fit on a 3” API Pipeline.
PIPELINES
Figure 8.1 – The engineering discipline of piping design is a complex matter in the oil and gas industry.
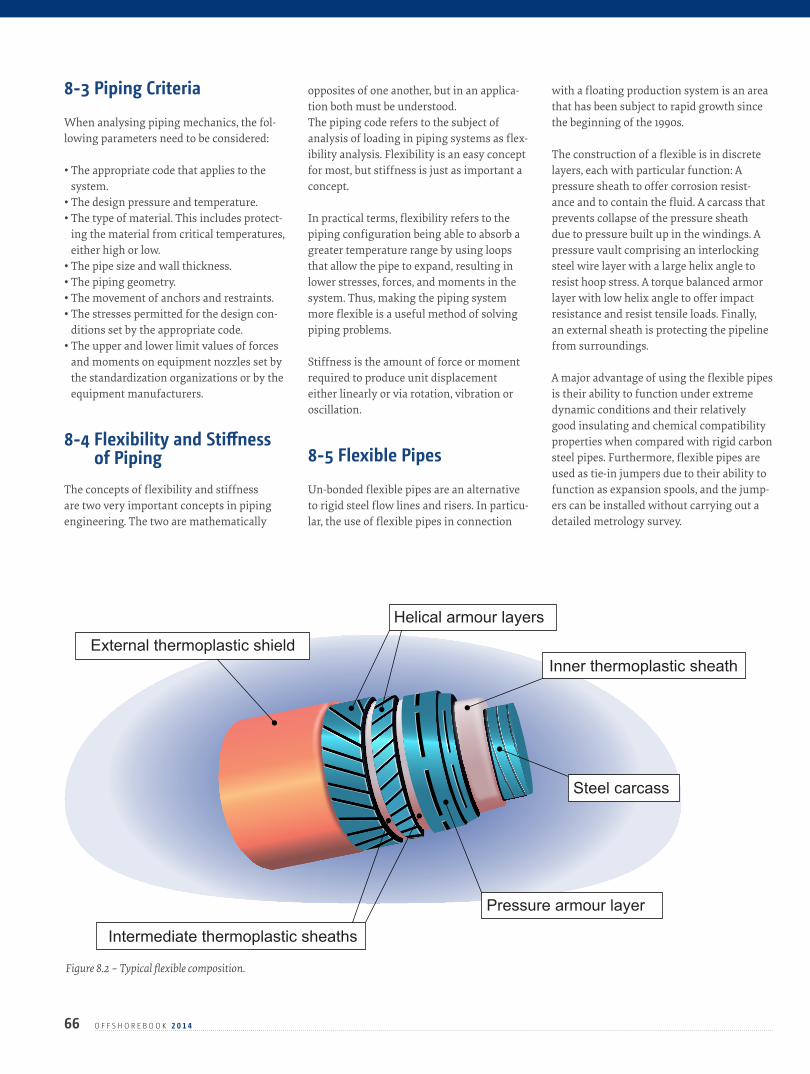
8-3 Piping Criteria When analysing piping mechanics, the fol-lowing parameters need to be considered:
• The appropriate code that applies to the system.
• The design pressure and temperature.• The type of material. This includes protect-
ing the material from critical temperatures, either high or low.
• The pipe size and wall thickness.• The piping geometry.• The movement of anchors and restraints.• The stresses permitted for the design con-
ditions set by the appropriate code.• The upper and lower limit values of forces
and moments on equipment nozzles set by the standardization organizations or by the equipment manufacturers.
8-4 Flexibility and Stiffness of Piping
The concepts of flexibility and stiffness are two very important concepts in piping engineering. The two are mathematically
opposites of one another, but in an applica-tion both must be understood.The piping code refers to the subject of analysis of loading in piping systems as flex-ibility analysis. Flexibility is an easy concept for most, but stiffness is just as important a concept.
In practical terms, flexibility refers to the piping configuration being able to absorb a greater temperature range by using loops that allow the pipe to expand, resulting in lower stresses, forces, and moments in the system. Thus, making the piping system more flexible is a useful method of solving piping problems.
Stiffness is the amount of force or moment required to produce unit displacement either linearly or via rotation, vibration or oscillation.
8-5 Flexible Pipes Un-bonded flexible pipes are an alternative to rigid steel flow lines and risers. In particu-lar, the use of flexible pipes in connection
with a floating production system is an area that has been subject to rapid growth since the beginning of the 1990s.
The construction of a flexible is in discrete layers, each with particular function: A pressure sheath to offer corrosion resist-ance and to contain the fluid. A carcass that prevents collapse of the pressure sheath due to pressure built up in the windings. A pressure vault comprising an interlocking steel wire layer with a large helix angle to resist hoop stress. A torque balanced armor layer with low helix angle to offer impact resistance and resist tensile loads. Finally, an external sheath is protecting the pipeline from surroundings.
A major advantage of using the flexible pipes is their ability to function under extreme dynamic conditions and their relatively good insulating and chemical compatibility properties when compared with rigid carbon steel pipes. Furthermore, flexible pipes are used as tie-in jumpers due to their ability to function as expansion spools, and the jump-ers can be installed without carrying out a detailed metrology survey.
66 O F F S H O R E B O O K 2 0 1 4
Helical armor layers
Steel carcass
External thermoplastic sheaths
Inner thermoplastic sheath
Intermediate thermoplastic sheath
Pressure armor layers
Helical armor layers
Steel carcass
External thermoplastic sheathsInner thermoplastic sheath
Pressure armor layers
Intermediate thermoplastic sheaths
Helical armour layers
Steel carcass
External thermoplastic shieldInner thermoplastic sheath
Pressure armour layer
Figure 8.2 – Typical flexible composition.
Flexible pipes are used for a multitude of ap-plications, including production and export of hydrocarbon fluids, injection of water, gas and chemicals into an oil/gas reservoir, and service lines for wellheads. Flexible pipes can be manufactured in long continuous lengths. Consequently, long flow lines can be installed without introducing intermediate joints, thus minimizing the risk of leak-ing flange connections. Flow lines with a continuous length of up to 8.5 km have been installed in the North Sea area.
All layers in the flexible pipes are terminated in an end fitting, which forms the transition between the pipe and the connector, e.g. a flange, clamp hub or weld joint. The end fitting is designed to secure each layer of the pipe fully so that the load transfer between the pipe and the connector is obtained.
8-6 Pipe Design Requirements
The primary function of a pipeline is to transport media safely and reliably for the duration of its life. The service conditions for pipelines are related to substances with elevated pressure, flowing at temperatures that will vary along the route from a typical-ly high inlet temperature to temperatures that may be critically low. In gas pipelines low temperatures may cause the formation of hydrates, while in oil pipelines waxing and viscosity problems may arise.
The functional or operational requirements basically concern the operation of the pipe-line. The requirements cover definitions of the system’s ability to transport a specified media quantity within a specific tempera-ture range. The requirements also relate to the service and maintenance of the pipeline system. Other requirements may arise from safety assessment or operator practice, and may imply the introduction of subsea isolation valves, monitoring systems, diver less access et al. Functional requirements also include the requirements facilitating inspection access, normally pig launchers and receivers.For pipelines ending on manned platforms or terminals, integration with fire fighting and other safety systems falls under the heading of functional requirements.
8-6-1 Authorities RequirementsWhen drafting project parameters, includ-ing the basis for design, it is important to evaluate the time and effort required in deal-ing with the authorities. Obtaining approval from the relevant authorities could unless thoroughly planned prove critical to the overall contract schedule. Coupled with the sheer complexity of the approval procedures this can lead to less than optimum construc-tions costs. The recommendation is to allow sufficient time and resources for authority engineering from the outset of the pre-engi-neering phase.
The authorities involved usually include energy agencies, naval authorities, envi-ronmental and natural resource agencies, health and safety bodies, work authorization authorities, and various regional and nation- al nature protection agencies, particularly where landfall construction is included. For cross border projects, typically large gas transmission lines, the authorities’ approval becomes increasingly complex.
Particular complications may arise during the approval process when other users of the sea claim that they will incur either temporary or, in some instances, permanent loss of income following the construction of pipeline. Authorities listen to the parties and usually secure due process. The interests of fishing organisations will often prove to be sensitive areas to take into account.
There are regional differences, and therefore conditions at the location of the pipeline must be examined. Denmark, for example, has a well structured agency-based system representing alternative interests.
8-6-2 Environmental ImpactMarine pipeline projects increasingly seem to be governed by nation- al authority regulations requiring Environmental Impact Assessment (EIA). Though an EIA is not tra-ditionally mandatory for offshore interfield pipelines, it is very often the case for pipe-lines near shore. In some northern European countries it takes approximately 2 years to carry out a full EIA, for which reason time scheduling is important.
When evaluating whether an EIA is re-quired, a frequent criterion used by author-
ities will be whether the pipeline route lies within the country’s national territorial wa-ters – i.e. 12 nautical miles. Another criterion will be, if the project includes landfalls, in which case an EIA will normally be required. However, no general guidelines exist, and the evaluation therefore varies from country to country.
8-6-3 Operational ParametersAs a basis for the design it is necessary to know the operational parameters for the pipeline system. Such parameters are: the volume to be transported, its composition, its temperature, its pressure, etc. The opera-tional parameters will normally be selected as the design basis for a given product.
The composition of the transported media will determine the selection of the pipe material. Hydrocarbons containing high quantities of CO2 or H2S may require the use of high alloy steels (e.g. stainless steel) or clad pipe, particularly in the presence of water or elevated temperatures.
8-7 Pipeline Size Determination
The pipeline diameter is determined on the basis of the main operational parameters for the pipeline system, such as:
• Flowrate• Expected system availability e.g. tolerated
uptime and downtime • Requirements for delivery pressure
• Properties of the transported medium
The optimum pipeline dimension is based on the “lifetime” evaluation of the system, taking into account the capital cost for the establishment of compressor/pumps, the pipeline itself, receiving facilities, as well as the operational and maintenance cost of the system. An economic model for the pipeline system is often used to calculate different economic key parameters such as: net pres-ent value, unit transportation cost, etc.
An important part of the optimization process including the requirements for com-pression or pumping is flow calculations. In the initial phase the flow calculations may be performed on an overall level without
67O F F S H O R E B O O K 2 0 1 4

68 O F F S H O R E B O O K 2 0 1 4
detailed modelling of the thermodynamic conditions along the pipeline. However, such modelling may eventually be required, because parameters other than the pres-sure drop may be important factors for the dimension of the pipeline.
8-8 Pressure Control System The pressure control system would usually comprise a pressure regulating system and a pressure safety system, as well as alarm systems and instrumentation to monitor the operation.
The pressure regulating system ensures that the pressure in the pipeline is kept at a specified level.
The pressure safety system denotes equip-ment that independently of the pressure regulating system ensures that the acciden-tal pressure in the pipeline is kept below set values, for example it ensures that full well shut-in pressure cannot enter the pipeline.
The above pressure definitions are not universally recognized, which explains why pipeline design codes may identify the design pressure with maximum operational pressure, and the notion of “incidental” pres-sure e.g. worst-case pressures, which may be included in various safety factors.
8-9 Performance Require-ments and Design Criteria
Pipeline performance requirements and design criteria are defined in terms of the client’s requirements. These criteria will include water temperature, composition, flow, reliability, lifetime, location and budget restrictions. In most cases, all of these pa-rameters are not fully defined at the start of the design process; pipeline flow, operat-ing budgets, and even location commonly depend on onshore facilities that are still in the planning, design and permit-obtaining phases.
8-9-1 Initial Site SurveyImportant site characteristics include ba-thymetry, bottom roughness, soil conditions,
slope, current profiles, obstacle location, wave conditions, environmental restrictions and shoreline geometry; these and other site conditions greatly influence the pipeline design and cost.
A review of all existing offshore data plus a site visit and a diving expedition in the shallow water will frequently suffice for an initial survey. If bathymetry and bottom data are not available, it may be necessary to conduct a survey to get this information. In addition, depending upon how much is known of the oceanographic characteristics of the area, it may be necessary to measure the current at a few key locations. 8-9-2 Preliminary DesignA preliminary design concentrates on the critical aspects of the project that most direct affect the performance and cost of the pipe- line. The final output of the design includes preliminary drawings, pipeline routing, an initial estimate of probable con-struction costs and a conceptual method for deployment of the pipeline.
An economically viable pipeline is one that is rapidly and easily deployed, and therefore it cannot be overemphasized how important deployment is to offshore pipeline cost and design. This is the most expensive phase in the establishment of a pipeline and is asso-ciated with a high concentration of activity
and increased risk. All this occurs within a few days at sea. Weights, loads, buoyancies and material strains are therefore care-fully balanced during this phase, so that the pipeline can survive deployment and function properly once in place. Pipe joints are placed at critical points to ease pipeline handling and excluded at points exposed to high loading.
8-9-3 Detailed Route SurveyThe preliminary design identifies critical oceanographic and site information that is needed for the final design and installa-tion. This information includes the precise location of key obstacles on the ocean floor, measurement of shoreline geometry, collection of current data, and assessment of bottom slopes, soil conditions or roughness.Surveying equipment may include SCUBA, manned submersibles or remote operated vehicles, ROV deployed bottom samplers, acoustic bathymetry, sub-bottom profilers, side scan systems, and precision bottom roughness samplers.
8-9-4 Final DesignIn the final design phase the design plans (drawings), specifications, and estimate of probable construction costs are prepared. Careful attention is paid to every detail, so that the hardware designed can be success-fully deployed and operated over the desired lifespan of the pipeline. Details include wave
Figure 8.3 - Selection of intelligent pigs (scrapers).
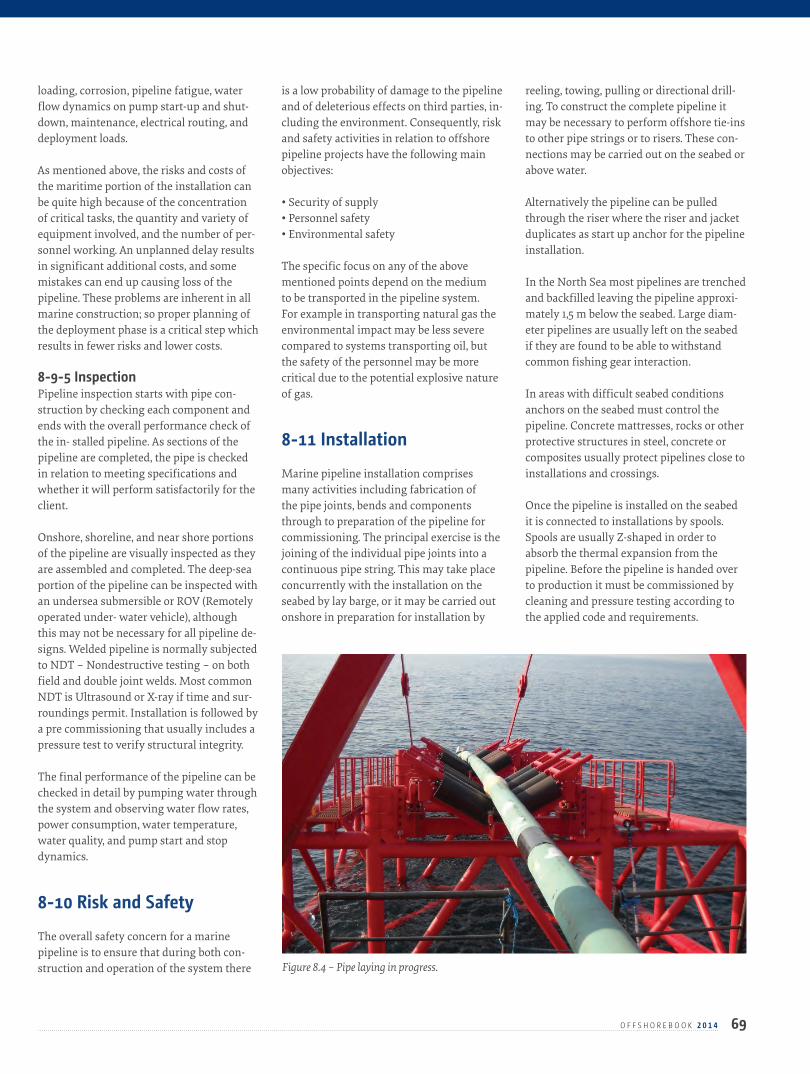
69O F F S H O R E B O O K 2 0 1 4
loading, corrosion, pipeline fatigue, water flow dynamics on pump start-up and shut-down, maintenance, electrical routing, and deployment loads.
As mentioned above, the risks and costs of the maritime portion of the installation can be quite high because of the concentration of critical tasks, the quantity and variety of equipment involved, and the number of per-sonnel working. An unplanned delay results in significant additional costs, and some mistakes can end up causing loss of the pipeline. These problems are inherent in all marine construction; so proper planning of the deployment phase is a critical step which results in fewer risks and lower costs.
8-9-5 InspectionPipeline inspection starts with pipe con-struction by checking each component and ends with the overall performance check of the in- stalled pipeline. As sections of the pipeline are completed, the pipe is checked in relation to meeting specifications and whether it will perform satisfactorily for the client.
Onshore, shoreline, and near shore portions of the pipeline are visually inspected as they are assembled and completed. The deep-sea portion of the pipeline can be inspected with an undersea submersible or ROV (Remotely operated under- water vehicle), although this may not be necessary for all pipeline de-signs. Welded pipeline is normally subjected to NDT – Nondestructive testing – on both field and double joint welds. Most common NDT is Ultrasound or X-ray if time and sur-roundings permit. Installation is followed by a pre commissioning that usually includes a pressure test to verify structural integrity.
The final performance of the pipeline can be checked in detail by pumping water through the system and observing water flow rates, power consumption, water temperature, water quality, and pump start and stop dynamics.
8-10 Risk and Safety The overall safety concern for a marine pipeline is to ensure that during both con-struction and operation of the system there
is a low probability of damage to the pipeline and of deleterious effects on third parties, in-cluding the environment. Consequently, risk and safety activities in relation to offshore pipeline projects have the following main objectives:
• Security of supply• Personnel safety• Environmental safety
The specific focus on any of the above mentioned points depend on the medium to be transported in the pipeline system. For example in transporting natural gas the environmental impact may be less severe compared to systems transporting oil, but the safety of the personnel may be more critical due to the potential explosive nature of gas.
8-11 Installation Marine pipeline installation comprises many activities including fabrication of the pipe joints, bends and components through to preparation of the pipeline for commissioning. The principal exercise is the joining of the individual pipe joints into a continuous pipe string. This may take place concurrently with the installation on the seabed by lay barge, or it may be carried out onshore in preparation for installation by
reeling, towing, pulling or directional drill-ing. To construct the complete pipeline it may be necessary to perform offshore tie-ins to other pipe strings or to risers. These con-nections may be carried out on the seabed or above water.
Alternatively the pipeline can be pulled through the riser where the riser and jacket duplicates as start up anchor for the pipeline installation.
In the North Sea most pipelines are trenched and backfilled leaving the pipeline approxi-mately 1,5 m below the seabed. Large diam-eter pipelines are usually left on the seabed if they are found to be able to withstand common fishing gear interaction.
In areas with difficult seabed conditions anchors on the seabed must control the pipeline. Concrete mattresses, rocks or other protective structures in steel, concrete or composites usually protect pipelines close to installations and crossings.
Once the pipeline is installed on the seabed it is connected to installations by spools. Spools are usually Z-shaped in order to absorb the thermal expansion from the pipeline. Before the pipeline is handed over to production it must be commissioned by cleaning and pressure testing according to the applied code and requirements.
Figure 8.4 – Pipe laying in progress.
9C H A P T E R
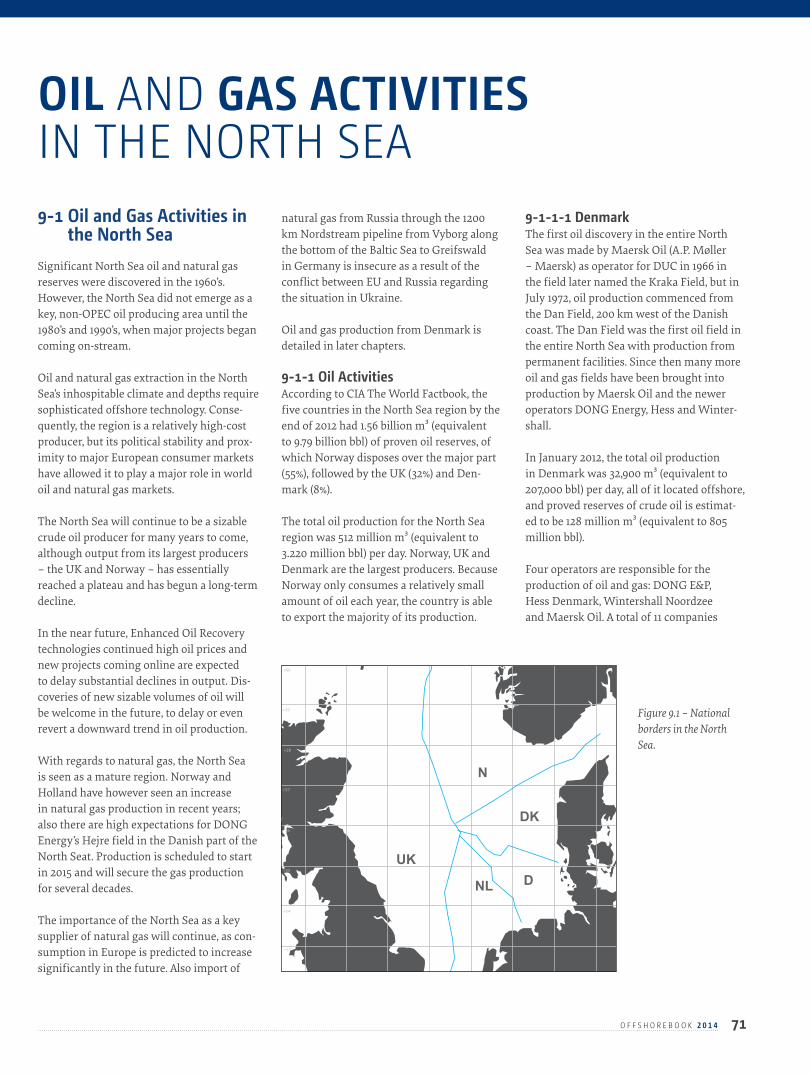
71O F F S H O R E B O O K 2 0 1 4
9-1 Oil and Gas Activities in the North Sea
Significant North Sea oil and natural gas reserves were discovered in the 1960’s. However, the North Sea did not emerge as a key, non-OPEC oil producing area until the 1980’s and 1990’s, when major projects began coming on-stream.
Oil and natural gas extraction in the North Sea’s inhospitable climate and depths require sophisticated offshore technology. Conse-quently, the region is a relatively high-cost producer, but its political stability and prox-imity to major European consumer markets have allowed it to play a major role in world oil and natural gas markets.
The North Sea will continue to be a sizable crude oil producer for many years to come, although output from its largest producers – the UK and Norway – has essentially reached a plateau and has begun a long-term decline.
In the near future, Enhanced Oil Recovery technologies continued high oil prices and new projects coming online are expected to delay substantial declines in output. Dis-coveries of new sizable volumes of oil will be welcome in the future, to delay or even revert a downward trend in oil production.
With regards to natural gas, the North Sea is seen as a mature region. Norway and Holland have however seen an increase in natural gas production in recent years; also there are high expectations for DONG Energy’s Hejre field in the Danish part of the North Seat. Production is scheduled to start in 2015 and will secure the gas production for several decades.
The importance of the North Sea as a key supplier of natural gas will continue, as con-sumption in Europe is predicted to increase significantly in the future. Also import of
natural gas from Russia through the 1200 km Nordstream pipeline from Vyborg along the bottom of the Baltic Sea to Greifswald in Germany is insecure as a result of the conflict between EU and Russia regarding the situation in Ukraine.
Oil and gas production from Denmark is detailed in later chapters.
9-1-1 Oil ActivitiesAccording to CIA The World Factbook, the five countries in the North Sea region by the end of 2012 had 1.56 billion m³ (equivalent to 9.79 billion bbl) of proven oil reserves, of which Norway disposes over the major part (55%), followed by the UK (32%) and Den-mark (8%).
The total oil production for the North Sea region was 512 million m³ (equivalent to 3.220 million bbl) per day. Norway, UK and Denmark are the largest producers. Because Norway only consumes a relatively small amount of oil each year, the country is able to export the majority of its production.
9-1-1-1 DenmarkThe first oil discovery in the entire North Sea was made by Maersk Oil (A.P. Møller – Maersk) as operator for DUC in 1966 in the field later named the Kraka Field, but in July 1972, oil production commenced from the Dan Field, 200 km west of the Danish coast. The Dan Field was the first oil field in the entire North Sea with production from permanent facilities. Since then many more oil and gas fields have been brought into production by Maersk Oil and the newer operators DONG Energy, Hess and Winter-shall.
In January 2012, the total oil production in Denmark was 32,900 m³ (equivalent to 207,000 bbl) per day, all of it located offshore, and proved reserves of crude oil is estimat-ed to be 128 million m³ (equivalent to 805 million bbl).
Four operators are responsible for the production of oil and gas: DONG E&P, Hess Denmark, Wintershall Noordzee and Maersk Oil. A total of 11 companies
OIL AND GAS ACTIVITIES IN THE NORTH SEA
UK
DK
DNL
N
+60
+59
+58
+57
+56
+55
+54
+53
Figure 9.1 – National borders in the North Sea.
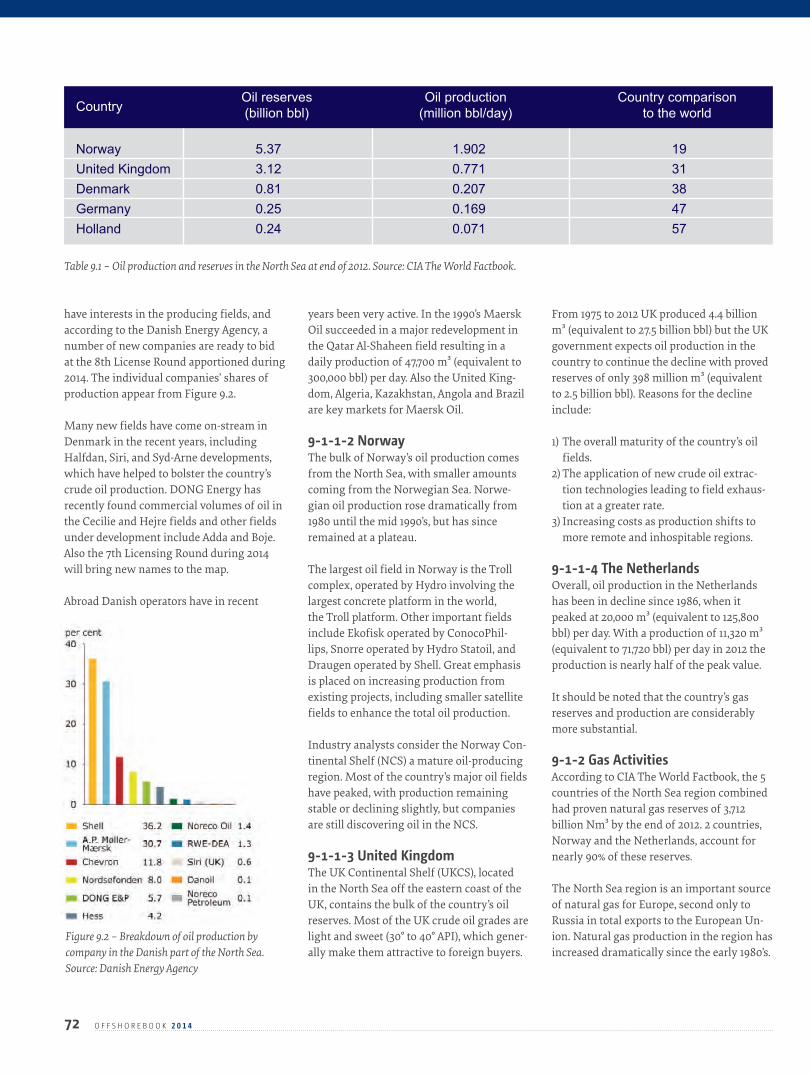
have interests in the producing fields, and according to the Danish Energy Agency, a number of new companies are ready to bid at the 8th License Round apportioned during 2014. The individual companies’ shares of production appear from Figure 9.2.
Many new fields have come on-stream in Denmark in the recent years, including Halfdan, Siri, and Syd-Arne developments, which have helped to bolster the country’s crude oil production. DONG Energy has recently found commercial volumes of oil in the Cecilie and Hejre fields and other fields under development include Adda and Boje. Also the 7th Licensing Round during 2014 will bring new names to the map.
Abroad Danish operators have in recent
years been very active. In the 1990’s Maersk Oil succeeded in a major redevelopment in the Qatar Al-Shaheen field resulting in a daily production of 47,700 m³ (equivalent to 300,000 bbl) per day. Also the United King-dom, Algeria, Kazakhstan, Angola and Brazil are key markets for Maersk Oil.
9-1-1-2 NorwayThe bulk of Norway’s oil production comes from the North Sea, with smaller amounts coming from the Norwegian Sea. Norwe-gian oil production rose dramatically from 1980 until the mid 1990’s, but has since remained at a plateau.
The largest oil field in Norway is the Troll complex, operated by Hydro involving the largest concrete platform in the world, the Troll platform. Other important fields include Ekofisk operated by ConocoPhil-lips, Snorre operated by Hydro Statoil, and Draugen operated by Shell. Great emphasis is placed on increasing production from existing projects, including smaller satellite fields to enhance the total oil production.
Industry analysts consider the Norway Con-tinental Shelf (NCS) a mature oil-producing region. Most of the country’s major oil fields have peaked, with production remaining stable or declining slightly, but companies are still discovering oil in the NCS.
9-1-1-3 United KingdomThe UK Continental Shelf (UKCS), located in the North Sea off the eastern coast of the UK, contains the bulk of the country’s oil reserves. Most of the UK crude oil grades are light and sweet (30° to 40° API), which gener-ally make them attractive to foreign buyers.
From 1975 to 2012 UK produced 4.4 billion m³ (equivalent to 27.5 billion bbl) but the UK government expects oil production in the country to continue the decline with proved reserves of only 398 million m³ (equivalent to 2.5 billion bbl). Reasons for the decline include:
1) The overall maturity of the country’s oil fields.
2) The application of new crude oil extrac-tion technologies leading to field exhaus-tion at a greater rate.
3) Increasing costs as production shifts to more remote and inhospitable regions.
9-1-1-4 The NetherlandsOverall, oil production in the Netherlands has been in decline since 1986, when it peaked at 20,000 m³ (equivalent to 125,800 bbl) per day. With a production of 11,320 m³ (equivalent to 71,720 bbl) per day in 2012 the production is nearly half of the peak value.
It should be noted that the country’s gas reserves and production are considerably more substantial.
9-1-2 Gas ActivitiesAccording to CIA The World Factbook, the 5 countries of the North Sea region combined had proven natural gas reserves of 3,712 billion Nm³ by the end of 2012. 2 countries, Norway and the Netherlands, account for nearly 90% of these reserves.
The North Sea region is an important source of natural gas for Europe, second only to Russia in total exports to the European Un-ion. Natural gas production in the region has increased dramatically since the early 1980’s.
72 O F F S H O R E B O O K 2 0 1 4
Table 9.1 – Oil production and reserves in the North Sea at end of 2012. Source: CIA The World Factbook.
Country Oil reserves Oil production Country comparison
(billion bbl) (million bbl/day) to the world
Norway 5.37 1.902 19United Kingdom 3.12 0.771 31Denmark 0.81 0.207 38Germany 0.25 0.169 47Holland 0.24 0.071 57
Figure 9.2 – Breakdown of oil production by company in the Danish part of the North Sea. Source: Danish Energy Agency
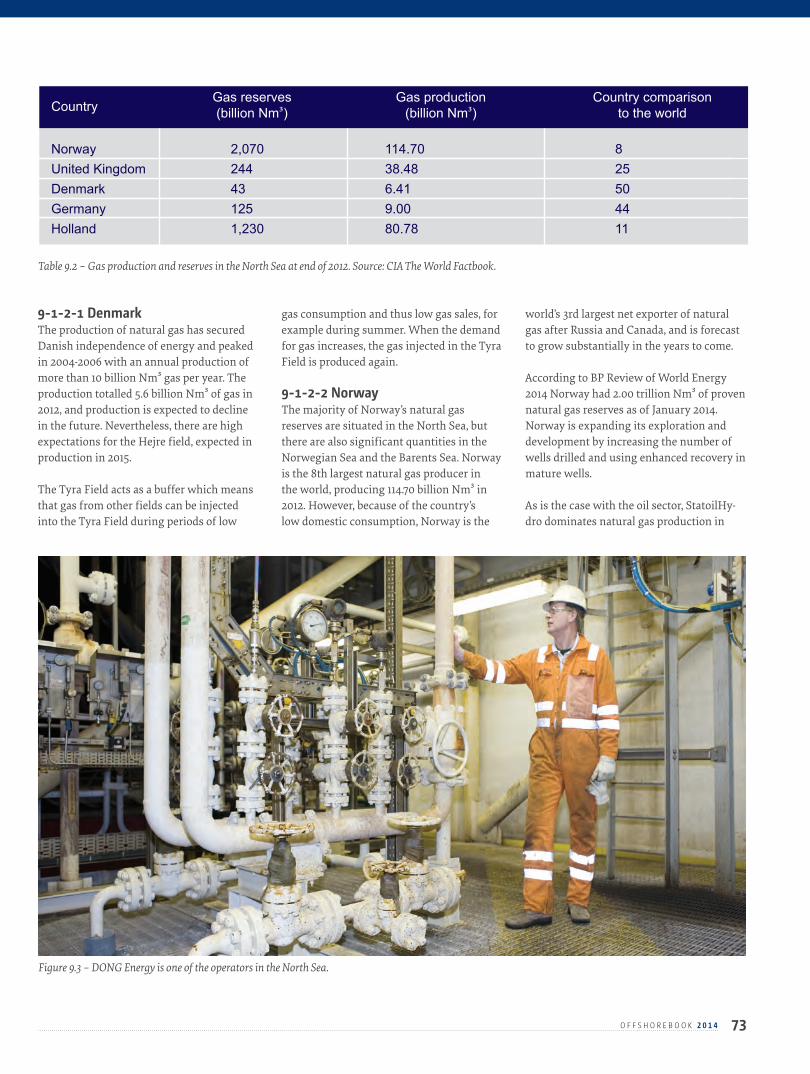
9-1-2-1 DenmarkThe production of natural gas has secured Danish independence of energy and peaked in 2004-2006 with an annual production of more than 10 billion Nm³ gas per year. The production totalled 5.6 billion Nm³ of gas in 2012, and production is expected to decline in the future. Nevertheless, there are high expectations for the Hejre field, expected in production in 2015.
The Tyra Field acts as a buffer which means that gas from other fields can be injected into the Tyra Field during periods of low
gas consumption and thus low gas sales, for example during summer. When the demand for gas increases, the gas injected in the Tyra Field is produced again.
9-1-2-2 NorwayThe majority of Norway’s natural gas reserves are situated in the North Sea, but there are also significant quantities in the Norwegian Sea and the Barents Sea. Norway is the 8th largest natural gas producer in the world, producing 114.70 billion Nm³ in 2012. However, because of the country’s low domestic consumption, Norway is the
world’s 3rd largest net exporter of natural gas after Russia and Canada, and is forecast to grow substantially in the years to come.
According to BP Review of World Energy 2014 Norway had 2.00 trillion Nm³ of proven natural gas reserves as of January 2014. Norway is expanding its exploration and development by increasing the number of wells drilled and using enhanced recovery in mature wells.
As is the case with the oil sector, StatoilHy-dro dominates natural gas production in
73O F F S H O R E B O O K 2 0 1 4
Table 9.2 – Gas production and reserves in the North Sea at end of 2012. Source: CIA The World Factbook.
Country Gas reserves Gas production Country comparison
(billion Nm³) (billion Nm³) to the world
Norway 2,070 114.70 8United Kingdom 244 38.48 25Denmark 43 6.41 50Germany 125 9.00 44Holland 1,230 80.78 11
Figure 9.3 – DONG Energy is one of the operators in the North Sea.
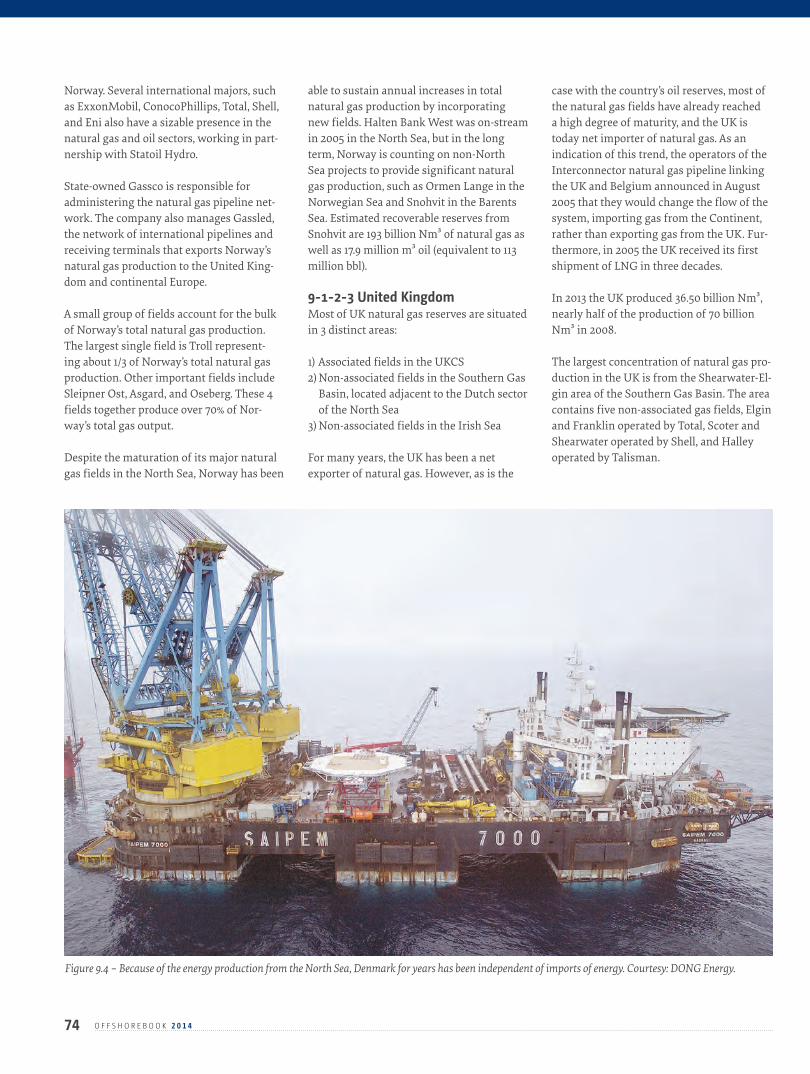
74 O F F S H O R E B O O K 2 0 1 4
Norway. Several international majors, such as ExxonMobil, ConocoPhillips, Total, Shell, and Eni also have a sizable presence in the natural gas and oil sectors, working in part-nership with Statoil Hydro.
State-owned Gassco is responsible for administering the natural gas pipeline net-work. The company also manages Gassled, the network of international pipelines and receiving terminals that exports Norway’s natural gas production to the United King-dom and continental Europe.
A small group of fields account for the bulk of Norway’s total natural gas production. The largest single field is Troll represent-ing about 1/3 of Norway’s total natural gas production. Other important fields include Sleipner Ost, Asgard, and Oseberg. These 4 fields together produce over 70% of Nor-way’s total gas output.
Despite the maturation of its major natural gas fields in the North Sea, Norway has been
able to sustain annual increases in total natural gas production by incorporating new fields. Halten Bank West was on-stream in 2005 in the North Sea, but in the long term, Norway is counting on non-North Sea projects to provide significant natural gas production, such as Ormen Lange in the Norwegian Sea and Snohvit in the Barents Sea. Estimated recoverable reserves from Snohvit are 193 billion Nm³ of natural gas as well as 17.9 million m³ oil (equivalent to 113 million bbl).
9-1-2-3 United KingdomMost of UK natural gas reserves are situated in 3 distinct areas:
1) Associated fields in the UKCS2) Non-associated fields in the Southern Gas
Basin, located adjacent to the Dutch sector of the North Sea
3) Non-associated fields in the Irish Sea
For many years, the UK has been a net exporter of natural gas. However, as is the
case with the country’s oil reserves, most of the natural gas fields have already reached a high degree of maturity, and the UK is today net importer of natural gas. As an indication of this trend, the operators of the Interconnector natural gas pipeline linking the UK and Belgium announced in August 2005 that they would change the flow of the system, importing gas from the Continent, rather than exporting gas from the UK. Fur-thermore, in 2005 the UK received its first shipment of LNG in three decades.
In 2013 the UK produced 36.50 billion Nm³, nearly half of the production of 70 billion Nm³ in 2008.
The largest concentration of natural gas pro-duction in the UK is from the Shearwater-El-gin area of the Southern Gas Basin. The area contains five non-associated gas fields, Elgin and Franklin operated by Total, Scoter and Shearwater operated by Shell, and Halley operated by Talisman.
Figure 9.4 – Because of the energy production from the North Sea, Denmark for years has been independent of imports of energy. Courtesy: DONG Energy.

75O F F S H O R E B O O K 2 0 1 4
The UK also produces significant amounts of associated natural gas from its oil fields in the UKCS. Like the oil industry, smaller inde-pendent operators have been able to acquire some maturing assets from larger operators who find it difficult to operate these older, declining fields profitably.
9-1-2-4 The NetherlandsHolland has succeeded in maintaining a large production of gas, and in 2013 natural gas production was 68.78 billion Nm³ – a small decline compared with the 2008 result of 84.7 billion Nm³.
The production the last 10 years could have been larger, but the Dutch parliament has passed the Natural Gas Law, which limited natural gas production to 75.9 billion Nm³ per year between 2003 and 2007, with this limit dropping to 70 billion Nm³ between 2008 and 2013. The government made this policy decision to cut back production in order to maintain reserves for future use.
The onshore Groningen field, located in the north-east of the country, accounts for about one-half of total Dutch natural gas production, with remaining production spread across small fields both onshore and in the North Sea. The largest offshore field is K15. Nederlandse Aarodolie Maatschappij (NAM), a consortium of ExxonMobil and Royal Dutch Shell, operates both K15 and the Groningen field.

10C H A P T E R
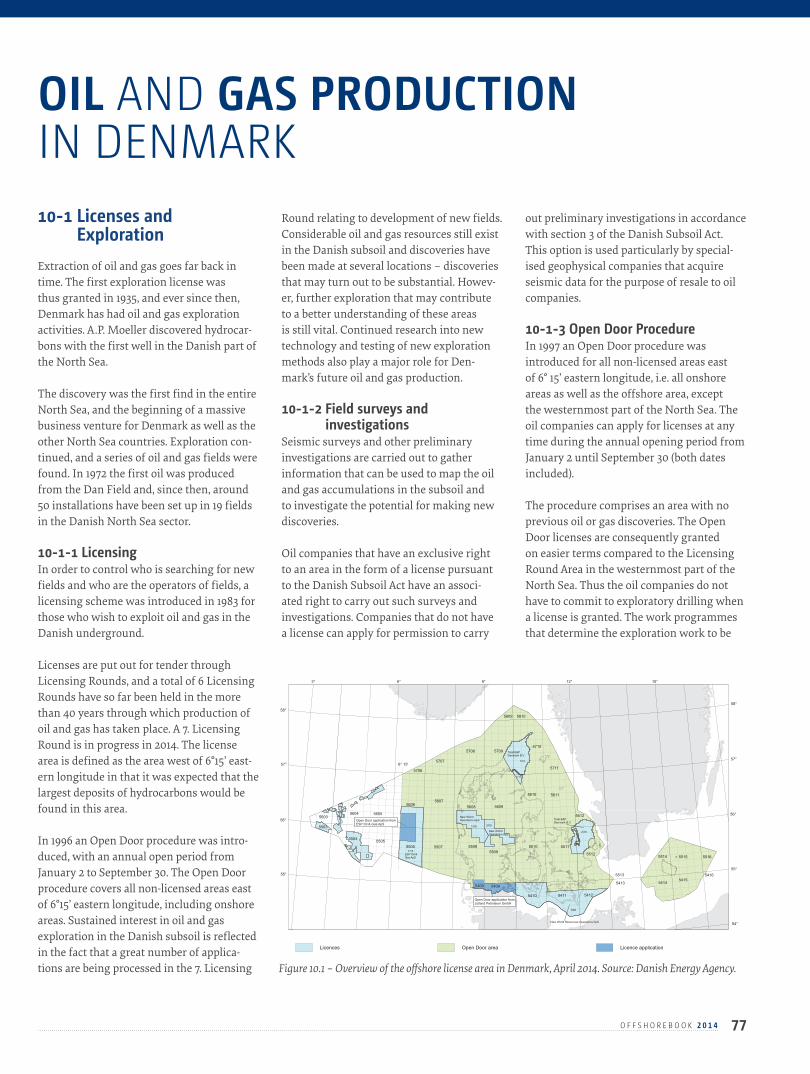
77O F F S H O R E B O O K 2 0 1 4
10-1 Licenses and Exploration
Extraction of oil and gas goes far back in time. The first exploration license was thus granted in 1935, and ever since then, Denmark has had oil and gas exploration activities. A.P. Moeller discovered hydrocar-bons with the first well in the Danish part of the North Sea.
The discovery was the first find in the entire North Sea, and the beginning of a massive business venture for Denmark as well as the other North Sea countries. Exploration con-tinued, and a series of oil and gas fields were found. In 1972 the first oil was produced from the Dan Field and, since then, around 50 installations have been set up in 19 fields in the Danish North Sea sector.
10-1-1 LicensingIn order to control who is searching for new fields and who are the operators of fields, a licensing scheme was introduced in 1983 for those who wish to exploit oil and gas in the Danish underground.
Licenses are put out for tender through Licensing Rounds, and a total of 6 Licensing Rounds have so far been held in the more than 40 years through which production of oil and gas has taken place. A 7. Licensing Round is in progress in 2014. The license area is defined as the area west of 6°15’ east-ern longitude in that it was expected that the largest deposits of hydrocarbons would be found in this area.
In 1996 an Open Door procedure was intro-duced, with an annual open period from January 2 to September 30. The Open Door procedure covers all non-licensed areas east of 6°15’ eastern longitude, including onshore areas. Sustained interest in oil and gas exploration in the Danish subsoil is reflected in the fact that a great number of applica-tions are being processed in the 7. Licensing
Round relating to development of new fields. Considerable oil and gas resources still exist in the Danish subsoil and discoveries have been made at several locations – discoveries that may turn out to be substantial. Howev-er, further exploration that may contribute to a better understanding of these areas is still vital. Continued research into new technology and testing of new exploration methods also play a major role for Den-mark’s future oil and gas production.
10-1-2 Field surveys and investigations
Seismic surveys and other preliminary investigations are carried out to gather information that can be used to map the oil and gas accumulations in the subsoil and to investigate the potential for making new discoveries.
Oil companies that have an exclusive right to an area in the form of a license pursuant to the Danish Subsoil Act have an associ-ated right to carry out such surveys and investigations. Companies that do not have a license can apply for permission to carry
out preliminary investigations in accordance with section 3 of the Danish Subsoil Act. This option is used particularly by special-ised geophysical companies that acquire seismic data for the purpose of resale to oil companies.
10-1-3 Open Door ProcedureIn 1997 an Open Door procedure was introduced for all non-licensed areas east of 6° 15’ eastern longitude, i.e. all onshore areas as well as the offshore area, except the westernmost part of the North Sea. The oil companies can apply for licenses at any time during the annual opening period from January 2 until September 30 (both dates included).
The procedure comprises an area with no previous oil or gas discoveries. The Open Door licenses are consequently granted on easier terms compared to the Licensing Round Area in the westernmost part of the North Sea. Thus the oil companies do not have to commit to exploratory drilling when a license is granted. The work programmes that determine the exploration work to be
OIL AND GAS PRODUCTION IN DENMARK
5516
5416
5515
5415
5514
5414
5513
5413
5512
5412
5612
5511
5411
5711
5611
5810
5710
5610
5510
5410
5809
5609
5409
5709
5509
5408
5708
5608
5508
5707
5607
5507
5706
5606
5506
5605
5505
5604
5504
5603
5503
Danish licence area - April 2014
55°
56°
58°
57°
55°
56°
57°
58°
54°
3° 6° 9° 12° 15°
6° 15'
1/08
New WorldOperations ApS
1/09 2/09
New WorldOperations ApS
2/10
Total E&PDenmark B.V.
Total E&P Denmark B.V.
1/10
1/10
Open Door area Licence application
New World Resources Operations ApS
Licences
1/13ESP Oil & Gas ApS
Open Door application fromJutland Petroleum GmbH
Open Door application fromESP Oil & Gas ApS
Figure 10.1 – Overview of the offshore license area in Denmark, April 2014. Source: Danish Energy Agency.
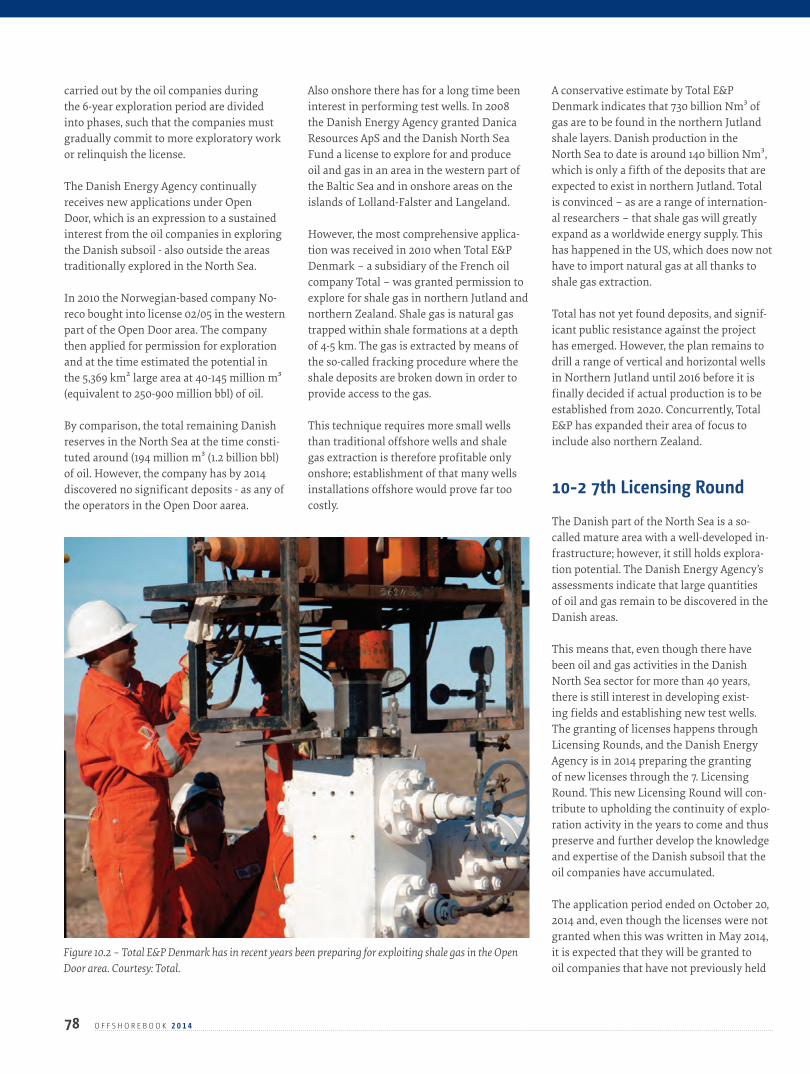
carried out by the oil companies during the 6-year exploration period are divided into phases, such that the companies must gradually commit to more exploratory work or relinquish the license.
The Danish Energy Agency continually receives new applications under Open Door, which is an expression to a sustained interest from the oil companies in exploring the Danish subsoil - also outside the areas traditionally explored in the North Sea.
In 2010 the Norwegian-based company No-reco bought into license 02/05 in the western part of the Open Door area. The company then applied for permission for exploration and at the time estimated the potential in the 5,369 km² large area at 40-145 million m³ (equivalent to 250-900 million bbl) of oil.
By comparison, the total remaining Danish reserves in the North Sea at the time consti-tuted around (194 million m³ (1.2 billion bbl) of oil. However, the company has by 2014 discovered no significant deposits - as any of the operators in the Open Door aarea.
Also onshore there has for a long time been interest in performing test wells. In 2008 the Danish Energy Agency granted Danica Resources ApS and the Danish North Sea Fund a license to explore for and produce oil and gas in an area in the western part of the Baltic Sea and in onshore areas on the islands of Lolland-Falster and Langeland.
However, the most comprehensive applica-tion was received in 2010 when Total E&P Denmark – a subsidiary of the French oil company Total – was granted permission to explore for shale gas in northern Jutland and northern Zealand. Shale gas is natural gas trapped within shale formations at a depth of 4-5 km. The gas is extracted by means of the so-called fracking procedure where the shale deposits are broken down in order to provide access to the gas.
This technique requires more small wells than traditional offshore wells and shale gas extraction is therefore profitable only onshore; establishment of that many wells installations offshore would prove far too costly.
A conservative estimate by Total E&P Denmark indicates that 730 billion Nm³ of gas are to be found in the northern Jutland shale layers. Danish production in the North Sea to date is around 140 billion Nm³, which is only a fifth of the deposits that are expected to exist in northern Jutland. Total is convinced – as are a range of internation-al researchers – that shale gas will greatly expand as a worldwide energy supply. This has happened in the US, which does now not have to import natural gas at all thanks to shale gas extraction.
Total has not yet found deposits, and signif-icant public resistance against the project has emerged. However, the plan remains to drill a range of vertical and horizontal wells in Northern Jutland until 2016 before it is finally decided if actual production is to be established from 2020. Concurrently, Total E&P has expanded their area of focus to include also northern Zealand.
10-2 7th Licensing Round The Danish part of the North Sea is a so-called mature area with a well-developed in-frastructure; however, it still holds explora-tion potential. The Danish Energy Agency’s assessments indicate that large quantities of oil and gas remain to be discovered in the Danish areas.
This means that, even though there have been oil and gas activities in the Danish North Sea sector for more than 40 years, there is still interest in developing exist-ing fields and establishing new test wells. The granting of licenses happens through Licensing Rounds, and the Danish Energy Agency is in 2014 preparing the granting of new licenses through the 7. Licensing Round. This new Licensing Round will con-tribute to upholding the continuity of explo-ration activity in the years to come and thus preserve and further develop the knowledge and expertise of the Danish subsoil that the oil companies have accumulated.
The application period ended on October 20, 2014 and, even though the licenses were not granted when this was written in May 2014, it is expected that they will be granted to oil companies that have not previously held
78 O F F S H O R E B O O K 2 0 1 4
Figure 10.2 – Total E&P Denmark has in recent years been preparing for exploiting shale gas in the Open Door area. Courtesy: Total.
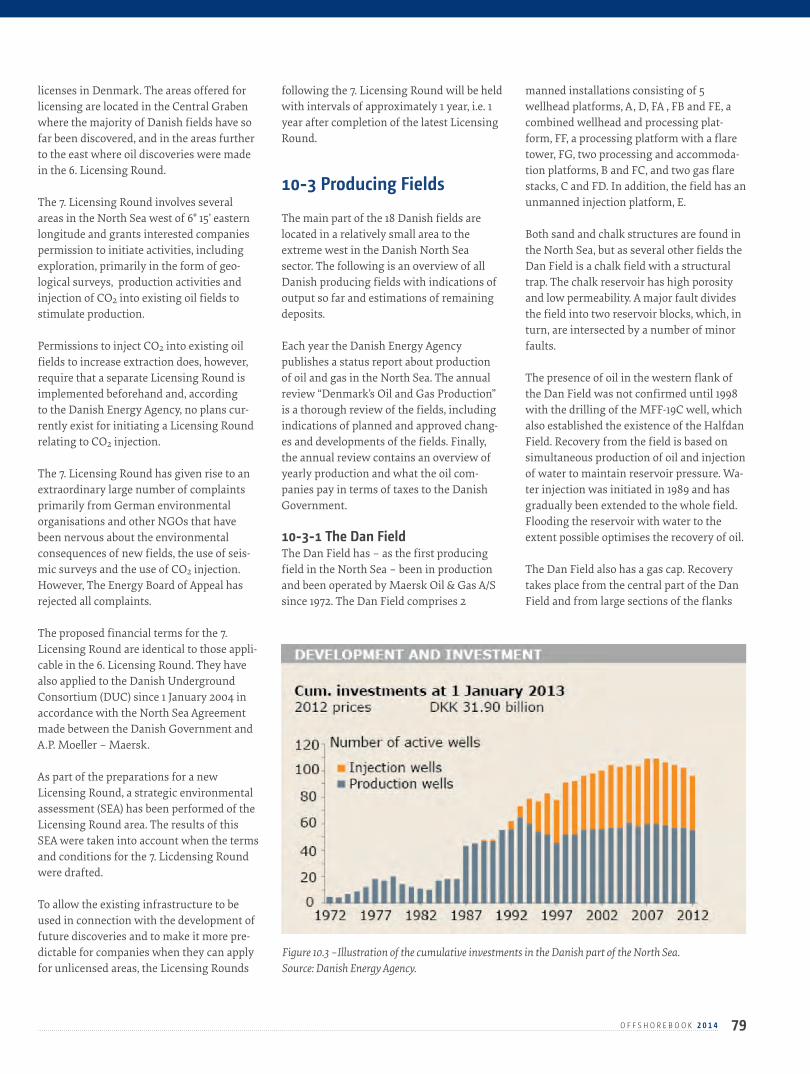
licenses in Denmark. The areas offered for licensing are located in the Central Graben where the majority of Danish fields have so far been discovered, and in the areas further to the east where oil discoveries were made in the 6. Licensing Round.
The 7. Licensing Round involves several areas in the North Sea west of 6° 15’ eastern longitude and grants interested companies permission to initiate activities, including exploration, primarily in the form of geo-logical surveys, production activities and injection of CO2 into existing oil fields to stimulate production.
Permissions to inject CO2 into existing oil fields to increase extraction does, however, require that a separate Licensing Round is implemented beforehand and, according to the Danish Energy Agency, no plans cur-rently exist for initiating a Licensing Round relating to CO2 injection.
The 7. Licensing Round has given rise to an extraordinary large number of complaints primarily from German environmental organisations and other NGOs that have been nervous about the environmental consequences of new fields, the use of seis-mic surveys and the use of CO2 injection. However, The Energy Board of Appeal has rejected all complaints.
The proposed financial terms for the 7. Licensing Round are identical to those appli-cable in the 6. Licensing Round. They have also applied to the Danish Underground Consortium (DUC) since 1 January 2004 in accordance with the North Sea Agreement made between the Danish Government and A.P. Moeller – Maersk.
As part of the preparations for a new Licensing Round, a strategic environmental assessment (SEA) has been performed of the Licensing Round area. The results of this SEA were taken into account when the terms and conditions for the 7. Licdensing Round were drafted.
To allow the existing infrastructure to be used in connection with the development of future discoveries and to make it more pre-dictable for companies when they can apply for unlicensed areas, the Licensing Rounds
following the 7. Licensing Round will be held with intervals of approximately 1 year, i.e. 1 year after completion of the latest Licensing Round.
10-3 Producing Fields The main part of the 18 Danish fields are located in a relatively small area to the extreme west in the Danish North Sea sector. The following is an overview of all Danish producing fields with indications of output so far and estimations of remaining deposits.
Each year the Danish Energy Agency publishes a status report about production of oil and gas in the North Sea. The annual review “Denmark’s Oil and Gas Production” is a thorough review of the fields, including indications of planned and approved chang-es and developments of the fields. Finally, the annual review contains an overview of yearly production and what the oil com-panies pay in terms of taxes to the Danish Government.
10-3-1 The Dan FieldThe Dan Field has – as the first producing field in the North Sea – been in production and been operated by Maersk Oil & Gas A/S since 1972. The Dan Field comprises 2
manned installations consisting of 5 wellhead platforms, A, D, FA , FB and FE, a combined wellhead and processing plat-form, FF, a processing platform with a flare tower, FG, two processing and accommoda-tion platforms, B and FC, and two gas flare stacks, C and FD. In addition, the field has an unmanned injection platform, E.
Both sand and chalk structures are found in the North Sea, but as several other fields the Dan Field is a chalk field with a structural trap. The chalk reservoir has high porosity and low permeability. A major fault divides the field into two reservoir blocks, which, in turn, are intersected by a number of minor faults.
The presence of oil in the western flank of the Dan Field was not confirmed until 1998 with the drilling of the MFF-19C well, which also established the existence of the Halfdan Field. Recovery from the field is based on simultaneous production of oil and injection of water to maintain reservoir pressure. Wa-ter injection was initiated in 1989 and has gradually been extended to the whole field. Flooding the reservoir with water to the extent possible optimises the recovery of oil.
The Dan Field also has a gas cap. Recovery takes place from the central part of the Dan Field and from large sections of the flanks
79O F F S H O R E B O O K 2 0 1 4
Figure 10.3 –Illustration of the cumulative investments in the Danish part of the North Sea. Source: Danish Energy Agency.

80 O F F S H O R E B O O K 2 0 1 4
of the field. Particularly the western flank of the Dan Field, close to the Halfdan Field, has demonstrated good production properties.On the Dan F installation, there are facil-ities for receiving production from the unmanned Kraka and Regnar satellite fields, as well as for receiving some of the gas produced at the Halfdan Field.
The individual wells at Kraka are produced at the lowest possible bottom-hole pressure. Oil production from the field is maximised by prioritising gas lift in wells with low wa-ter content and a low gas-oil ratio. The Dan F and Dan E installations supply the Halfdan Field with injection water.
After final processing, the oil is transported to shore via the Gorm installation. The gas is pre-processed and transported to the Tyra East installation for final processing. Produc-tion water from the Dan Field and its satel-lite fields is treated at the Dan F installation before being discharged into the sea.
In the Dan Field, there are accommodation facilities for 95 persons on the FC platform and 5 persons on the B platform. The accom-modation facilities are supplemented by flo-tels during the execution of major construc-tion works and maintenance programmes.
10-3-2 The Gorm FieldThe Gorm Field – named after the first Danish king and operated by Maersk Oil Oil & Gas A/S - has been in production since 1981 and consists of 2 wellhead platforms, Gorm A and B, 1 processing and accommodation platform, Gorm C, 1 gas flare stack, Gorm D, 1 riser and export platform, Gorm E (owned by DONG Oil Pipe A/S) and 1 combined well-head, processing and riser platform, Gorm F.
Gorm receives production from the unmanned satellite fields Skjold, Rolf and Dagmar. The Gorm Field installations supply the Skjold Field with injection water and lift gas and the Rolf Field with lift gas. The stabilised oil from all DUC’s facilities is transported ashore via the riser platform Gorm E. The gas produced is sent to Tyra East. The oil produced at the Halfdan Field is transported to Gorm C for final processing. There are accommodation facilities on the Gorm C platform for 98 persons.
10-3-3 The Halfdan FieldHalfdan, operated by Maersk Oil, is located in the Danish sector of the North Sea, in blocks DK 5505/13 and 5504/16. The field dis-covery was made in 1999, and the field was brought on stream in the same year, in an extremely rapid development. Halfdan has proven itself a very valuable field in what was hereto thought as a mature Danish basin. The water depth is 40-50 m. Halfdan quickly grew in the early 2000´s to become the largest Danish oil field by 2006.
The Halfdan Field comprises two installa-tions, Halfdan A and Halfdan B, as well as an unmanned wellhead platform, Halfdan CA. The distance between Halfdan A and Halfdan B is about 2 km. Halfdan CA is located about 7 km northeast of the Halfdan B complex.
The Halfdan A complex has accommoda-tion facilities for 32 persons while there are accommodation facilities for 80 persons at the Halfdan B complex.
From the Halfdan A installation (HDA), HP gas can be imported and exported through a 12” pipeline to the Dan installation, and LP gas can be exported through another 12” pipeline. Lift gas is exported/imported between Halfdan A and Halfdan B through a 6” pipeline.
The Dan installation supplies both Halfdan A and Halfdan B with injection water through a 16” pipeline. Injection water is transported to Halfdan B via Halfdan A.
Halfdan A and Halfdan B have their own power supply, but a 3 kW cable has been laid between Halfdan A and Halfdan B that can be used in case of power failure, etc. Halfdan CA is provided with power from Halfdan B.
Halfdan A consists of a combined processing and wellhead platform, HDA, an accommo-dation platform, HDB, and a gas flare stack, HDC. The platforms are interconnected by combined foot and pipe bridges. The gas produced at Halfdan A is transported to Tyra West through a 24” pipeline. The oil produced is conveyed to Gorm through a 14” pipeline.
After being separated into liquids and gas,
the production from the Halfdan CA plat-form is transported through 2 pipelines to the Halfdan B complex. The gas is conveyed via the Halfdan B riser to Tyra West while condensate is transported to Halfdan B for processing. From Halfdan B, the oil is then transported to the Gorm installation via the riser on the Halfdan A complex.
10-3-4 The Harald FieldThe Harald Field consists of two accumu-lations, Harald East (Lulu) and Harald West (West Lulu), which mainly contain gas. The Harald East structure is an anticline induced through salt tectonics. The gas zone is up to 75 m thick. The Harald West structure is a tilted Jurassic fault block. The sandstone reservoir is of Middle Jurassic age and is 100 m thick.
Recovery from both the Harald East and the Harald West reservoir takes place by means of gas expansion, with a moderate, natural influx of water into the reservoir.
Production from the Harald Field is based on the aim of optimising production of liquid hydrocarbons in the Tyra Field. By maxim-ising the drainage from the other gas fields, gas drainage from Tyra is minimised.
The Harald Field comprises a combined wellhead and processing platform, Harald A, and an accommodation platform, Harald B. The Harald Field also include the Lulita Field a structural fault trap with a Middle Jurassic sandstone reservoir. Production from the Lulita Field takes place from the fixed in-stallations in the Harald Field. The unpro-cessed condensate and the processed gas are transported to Tyra East. Treated production water is discharged into the sea.
The Harald Field is hooked up to the gas pipeline that transports gas from the South Arne Field to Nybro onshore. Normally, no gas is exported from Harald through the South Arne pipeline.
Also, Harald receive and process gas from the Norwegian Trym Field operated by DONG Energy Norge. The Norwegian Trym gas field is connected by an 8” multiphase pipeline to the Harald Field, from where the production is transported to Tyra East. The Harald A platform has special equipment
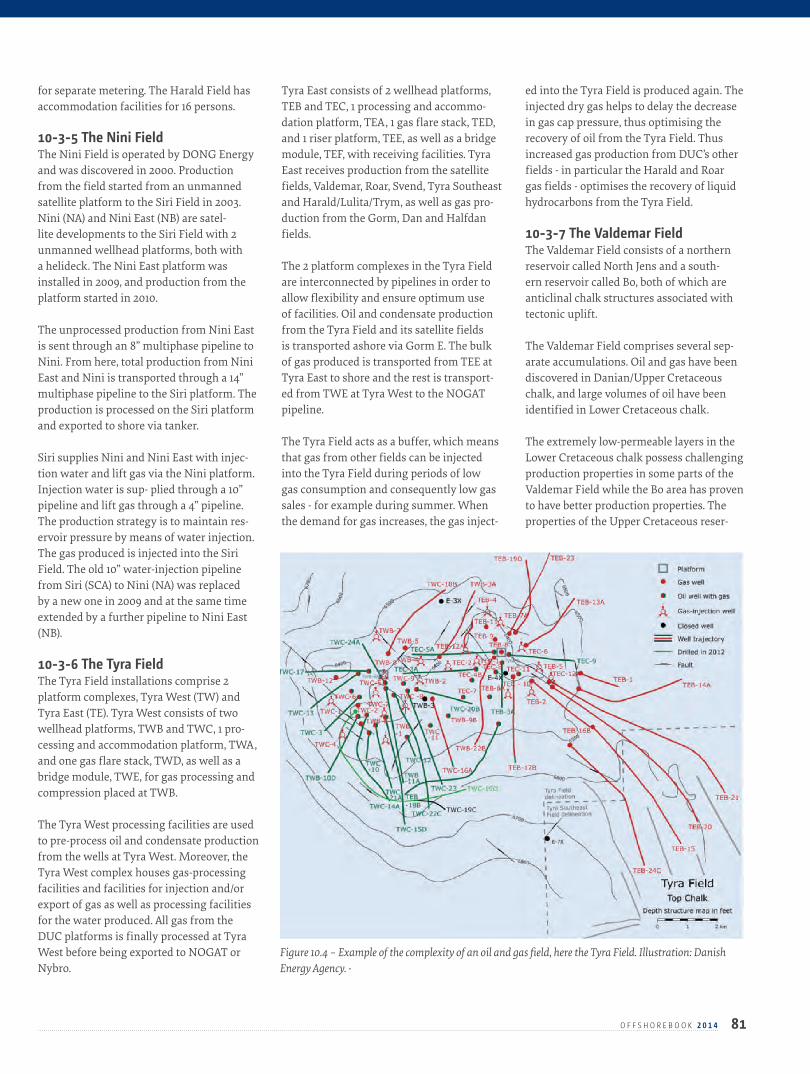
81O F F S H O R E B O O K 2 0 1 4
for separate metering. The Harald Field has accommodation facilities for 16 persons.
10-3-5 The Nini FieldThe Nini Field is operated by DONG Energy and was discovered in 2000. Production from the field started from an unmanned satellite platform to the Siri Field in 2003. Nini (NA) and Nini East (NB) are satel-lite developments to the Siri Field with 2 unmanned wellhead platforms, both with a helideck. The Nini East platform was installed in 2009, and production from the platform started in 2010.
The unprocessed production from Nini East is sent through an 8” multiphase pipeline to Nini. From here, total production from Nini East and Nini is transported through a 14” multiphase pipeline to the Siri platform. The production is processed on the Siri platform and exported to shore via tanker.
Siri supplies Nini and Nini East with injec-tion water and lift gas via the Nini platform. Injection water is sup- plied through a 10” pipeline and lift gas through a 4” pipeline.The production strategy is to maintain res-ervoir pressure by means of water injection. The gas produced is injected into the Siri Field. The old 10” water-injection pipeline from Siri (SCA) to Nini (NA) was replaced by a new one in 2009 and at the same time extended by a further pipeline to Nini East (NB).
10-3-6 The Tyra FieldThe Tyra Field installations comprise 2 platform complexes, Tyra West (TW) and Tyra East (TE). Tyra West consists of two wellhead platforms, TWB and TWC, 1 pro-cessing and accommodation platform, TWA, and one gas flare stack, TWD, as well as a bridge module, TWE, for gas processing and compression placed at TWB.
The Tyra West processing facilities are used to pre-process oil and condensate production from the wells at Tyra West. Moreover, the Tyra West complex houses gas-processing facilities and facilities for injection and/or export of gas as well as processing facilities for the water produced. All gas from the DUC platforms is finally processed at Tyra West before being exported to NOGAT or Nybro.
Tyra East consists of 2 wellhead platforms, TEB and TEC, 1 processing and accommo-dation platform, TEA, 1 gas flare stack, TED, and 1 riser platform, TEE, as well as a bridge module, TEF, with receiving facilities. Tyra East receives production from the satellite fields, Valdemar, Roar, Svend, Tyra Southeast and Harald/Lulita/Trym, as well as gas pro-duction from the Gorm, Dan and Halfdan fields.
The 2 platform complexes in the Tyra Field are interconnected by pipelines in order to allow flexibility and ensure optimum use of facilities. Oil and condensate production from the Tyra Field and its satellite fields is transported ashore via Gorm E. The bulk of gas produced is transported from TEE at Tyra East to shore and the rest is transport-ed from TWE at Tyra West to the NOGAT pipeline.
The Tyra Field acts as a buffer, which means that gas from other fields can be injected into the Tyra Field during periods of low gas consumption and consequently low gas sales - for example during summer. When the demand for gas increases, the gas inject-
ed into the Tyra Field is produced again. The injected dry gas helps to delay the decrease in gas cap pressure, thus optimising the recovery of oil from the Tyra Field. Thus increased gas production from DUC’s other fields - in particular the Harald and Roar gas fields - optimises the recovery of liquid hydrocarbons from the Tyra Field.
10-3-7 The Valdemar FieldThe Valdemar Field consists of a northern reservoir called North Jens and a south-ern reservoir called Bo, both of which are anticlinal chalk structures associated with tectonic uplift.
The Valdemar Field comprises several sep-arate accumulations. Oil and gas have been discovered in Danian/Upper Cretaceous chalk, and large volumes of oil have been identified in Lower Cretaceous chalk.
The extremely low-permeable layers in the Lower Cretaceous chalk possess challenging production properties in some parts of the Valdemar Field while the Bo area has proven to have better production properties. The properties of the Upper Cretaceous reser-
Figure 10.4 – Example of the complexity of an oil and gas field, here the Tyra Field. Illustration: Danish Energy Agency. -
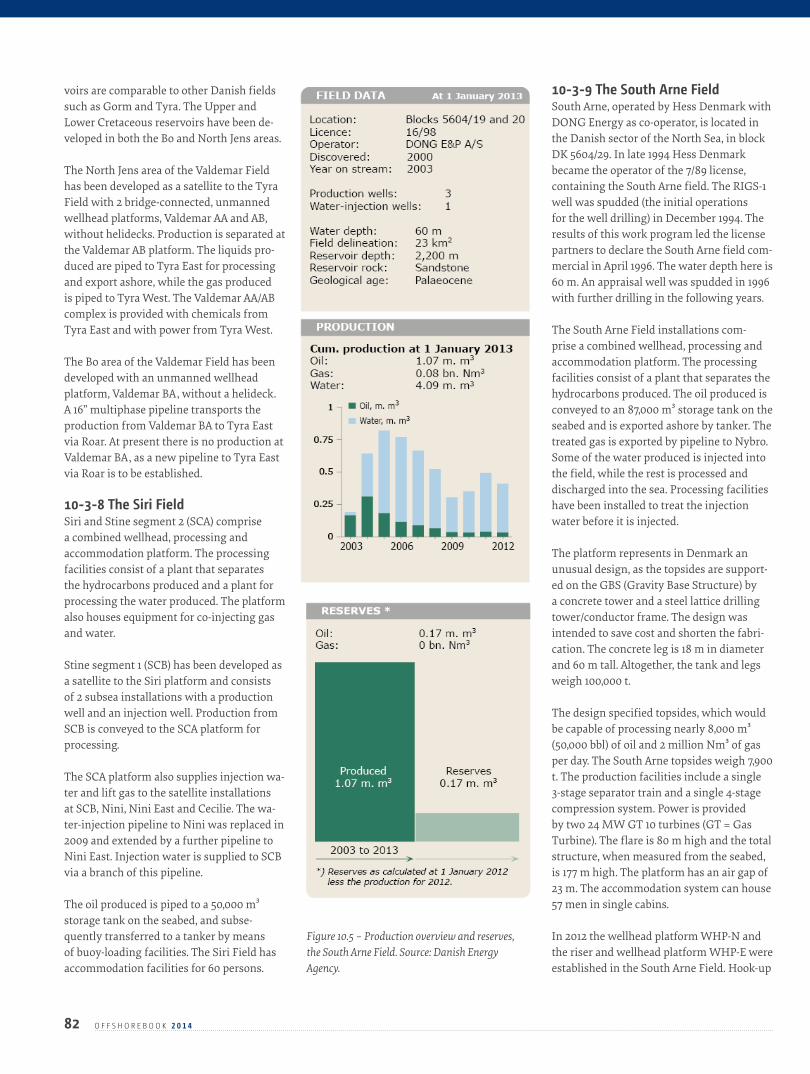
82 O F F S H O R E B O O K 2 0 1 4
voirs are comparable to other Danish fields such as Gorm and Tyra. The Upper and Lower Cretaceous reservoirs have been de-veloped in both the Bo and North Jens areas.
The North Jens area of the Valdemar Field has been developed as a satellite to the Tyra Field with 2 bridge-connected, unmanned wellhead platforms, Valdemar AA and AB, without helidecks. Production is separated at the Valdemar AB platform. The liquids pro-duced are piped to Tyra East for processing and export ashore, while the gas produced is piped to Tyra West. The Valdemar AA/AB complex is provided with chemicals from Tyra East and with power from Tyra West.
The Bo area of the Valdemar Field has been developed with an unmanned wellhead platform, Valdemar BA, without a helideck. A 16” multiphase pipeline transports the production from Valdemar BA to Tyra East via Roar. At present there is no production at Valdemar BA, as a new pipeline to Tyra East via Roar is to be established.
10-3-8 The Siri FieldSiri and Stine segment 2 (SCA) comprise a combined wellhead, processing and accommodation platform. The processing facilities consist of a plant that separates the hydrocarbons produced and a plant for processing the water produced. The platform also houses equipment for co-injecting gas and water.
Stine segment 1 (SCB) has been developed as a satellite to the Siri platform and consists of 2 subsea installations with a production well and an injection well. Production from SCB is conveyed to the SCA platform for processing.
The SCA platform also supplies injection wa-ter and lift gas to the satellite installations at SCB, Nini, Nini East and Cecilie. The wa-ter-injection pipeline to Nini was replaced in 2009 and extended by a further pipeline to Nini East. Injection water is supplied to SCB via a branch of this pipeline.
The oil produced is piped to a 50,000 m³ storage tank on the seabed, and subse-quently transferred to a tanker by means of buoy-loading facilities. The Siri Field has accommodation facilities for 60 persons.
10-3-9 The South Arne FieldSouth Arne, operated by Hess Denmark with DONG Energy as co-operator, is located in the Danish sector of the North Sea, in block DK 5604/29. In late 1994 Hess Denmark became the operator of the 7/89 license, containing the South Arne field. The RIGS-1 well was spudded (the initial operations for the well drilling) in December 1994. The results of this work program led the license partners to declare the South Arne field com-mercial in April 1996. The water depth here is 60 m. An appraisal well was spudded in 1996 with further drilling in the following years.
The South Arne Field installations com-prise a combined wellhead, processing and accommodation platform. The processing facilities consist of a plant that separates the hydrocarbons produced. The oil produced is conveyed to an 87,000 m³ storage tank on the seabed and is exported ashore by tanker. The treated gas is exported by pipeline to Nybro. Some of the water produced is injected into the field, while the rest is processed and discharged into the sea. Processing facilities have been installed to treat the injection water before it is injected.
The platform represents in Denmark an unusual design, as the topsides are support-ed on the GBS (Gravity Base Structure) by a concrete tower and a steel lattice drilling tower/conductor frame. The design was intended to save cost and shorten the fabri-cation. The concrete leg is 18 m in diameter and 60 m tall. Altogether, the tank and legs weigh 100,000 t.
The design specified topsides, which would be capable of processing nearly 8,000 m³ (50,000 bbl) of oil and 2 million Nm³ of gas per day. The South Arne topsides weigh 7,900 t. The production facilities include a single 3-stage separator train and a single 4-stage compression system. Power is provided by two 24 MW GT 10 turbines (GT = Gas Turbine). The flare is 80 m high and the total structure, when measured from the seabed, is 177 m high. The platform has an air gap of 23 m. The accommodation system can house 57 men in single cabins.
In 2012 the wellhead platform WHP-N and the riser and wellhead platform WHP-E were established in the South Arne Field. Hook-up
Figure 10.5 – Production overview and reserves, the South Arne Field. Source: Danish Energy Agency.
Appendix B 51
REVIEW OF GEOLOGY, THE CECILIE FIELD The Cecilie accumulation is a combined structural and stratigraphic trap. It is an an-ticlinal structure induced through salt tectonics, delimited by faults and redeposit-ed sands. The Cecilie Field also comprises the Connie accumulation.
PRODUCTION STRATEGY Recovery is based on water injection to maintain reservoir pressure. To assess its effect, water injection has been suspended for periods of time. The production wells have been drilled in the crest of the structure, while water is injected in the flank of the field.
PRODUCTION FACILITIES The Cecilie Field is a satellite development to the Siri Field with one unmanned wellhead platform with a helideck. The unprocessed production is transported to the Siri platform through a 12” multiphase pipeline. The oil is processed at the Siri platform and exported to shore via tanker. The gas produced is injected into the Siri Field. Injection water is transported to the Cecilie Field through a 10” pipeline.

83O F F S H O R E B O O K 2 0 1 4
and commissioning of the new platforms was completed in 2013. The 2 new platforms are hooked up to the existing facilities and infrastructure.
WHP-N is an unmanned platform with a helideck and is placed about 2.5 km north of the existing South Arne platform. WHP-E is placed about 80 m east of the existing South Arne platform and connected to it by a combined foot and pipe bridge.
A bundle pipeline has been established between WHP-N and WHP-E. The bundle incorporates a production pipeline, lift gas and water-injection pipelines and power supply cables, etc.
South Arne has accommodation facilities for 57 persons. In 2013 the accommodation facilities are to be supplemented by 18 new single cabins.
10-3-10 The Hejre FieldOne of the largest investments in the Danish North Sea sector is currently taking place. As yet the Hejre Field is in the process of being established, but is expected to be ready for production in 2015. DONG Energy is invest-ing € 1.6 billion in development of the Hejre
Field in partnership with Bayerngas, and the field is expected to contribute 170 million bbl (27 million m³) over a 30-year period.
The Hejre Field is not only the largest development in the Danish North Sea sector that has happened in recent years; it is also an attempt to exploit the so-called HPHT fields (High Pressure-High Temperature). The field has a pressure of 1,011 bars and a temperature of 160°C. The high pressure can ruin traditional drilling equipment and the high temperatures involve, among other things, challenges in relation to drilling and completion of production wells, collection of reservoir data, choice of materials and dimensioning of installation facilities for processing and transport of produced oil and gas to the shore.
DONG Energy has a good deal of experience of drilling HPHT wells and the Hejre Field will become an important field for DONG Energy – not least in relation to the devel-opment of the infrastructure in the Danish North Sea sector.
The Hejre installation will be an integrated platform with a wellhead, a process area and accommodation. The platform will consist
of a steel structure (jacket) and facilities for processing of oil and gas plus accommo-dation (topsides). All this will be designed to ensure reliable production and process treatment of the oil and gas in the field. The platform will consist of a complete jacket, including piles, a deck for wellheads for pre-drilling and equipment. On top of this will be mounted a complete topsides, including an integrated deck, accommoda-tion and a flare tower.
The 8-legged jacket, with a weight of around 8,000 t, will be installed in 2014 by the help of a launch barge and be erected by means of one of the world’s largest floating cranes, the Hermod. When the 8-legged jacket has been placed correctly, it will be fixed to the seabed by means of long iron piles that are hammered into the seabed.
Topsides with a weight of around 15,000 t will be towed to Hejre Field and lifted into place by the help of the heavy-lift vessel Thialf in the summer 2015.
Figure 10.6– Model of the platform in the Hejre Field, which is expected to come on stream in 2015. Courtesy: Technip.
11C H A P T E R
85O F F S H O R E B O O K 2 0 1 4
11-1 Overview There are many different types of offshore installations, from fixed steel platforms and large concrete gravity structures to a variety of floating production systems and subsea completions. This infrastructure is supported by many thousands of km of pipelines at the seabed that form a complex transmission network, transferring products between offshore facilities and shore-based reception facilities.
Many of the offshore oil and gas facilities installed in the 1960s and 1970s are reach-ing the end of their productive phase, and the questions relating to shutting down production, decommissioning the produc-tion facilities and removing the redundant structures are becoming important issues for consideration. There are number of in-ter-related factors that need to be addressed in developing a strategy for shutting down any specific offshore facility.
Installations include subsea equipment fixed to the marine floor and various installation rigs. There is a very strict legal framework that governs decommissioning.
Public concern is evident, and in some cases has become a significant factor in the search for the most appropriate decommissioning solutions.
One of the main difficulties with decommis-sioning is finding the right balance between:
• Technical Feasibility• Environmental Protection • Health and Safety• Cost• Public Opinion
The process of decommissioning is very strictly regulated by international, regional and national legislation. The options available for decommissioning will depend on the
location of the offshore facility and sub-sequent legislations. One of the most impor-tant steps in the decommissioning process is planning ahead.
11-2 Regulatory Framework The distinction between the removal and disposal of disused offshore oil and gas in-stallations is important as they come under very different types of legislative frame-works. Whilst interlinked, the legal require-ments for removal are primarily concerned with safety of navigation and other users of the sea. The disposal of structures comes under the pollution prevention regulatory framework.
11-3 International Frame-works and Conventions
The Geneva ConventionThe current regulations have evolved from earlier conventions such as the 1958 Geneva Convention on the Continental Shelf that called for the total removal of all marine based structures. This international conven-tion came into force long before deep-sea structures were ever emplaced.
UNCLOSThe Geneva Convention was superseded by the UN Convention on the Law of the Seas 1982 (UNCLOS), of which permits partial re-moval of offshore structures provided IMO criteria are met. The Convention entered into force in 1994.
IMO - the International Maritime OrganizationHeadquartered in London, the Internation-al Maritime Organization (IMO) sets the standards and guidelines for the removal of offshore installations worldwide. The 1989 IMO Guidelines require the complete re-moval of all structures in waters less 100 m
and substructures weighing less than 4,000 t. Those in deeper waters can be partially removed leaving 55 m of clear water column for safety of navigation. All new structures installed after 1 January 1998 must be designed so as to be feasible for complete removal.
The London (Dumping) ConventionThe London Convention (LC) is based at IMO headquarters in London. The 1972 London Convention and the subsequent 1996 Protocol made provision for generic guidance for any wastes that can be dumped at sea. New guidelines – “Guidelines for the assessment of waste and other matters that may be considered for dumping” – to provide specific guidance for different class-es of waste, including platforms and other man-made waste, were adopted in 2000.
Regional ConventionsIn addition to the international legislative framework, there are a number of regional conventions, which govern marine disposal in specific areas. The area that reaches from the east coast of Greenland to the west coast of continental Europe and stretches from the Arctic down to the southern most tip of Eu-rope at Gibraltar is governed by the Oslo and Paris (OSPAR) Convention for the Protection of the Marine Environment of the North East Atlantic. Similar conventions govern other seas such as BARCOM for the Mediter-ranean and HELCOM for the Baltic Sea.
OSPAROSPAR is an international convention drawn up in 1992 and which came into force in March 1998. It replaced the 1972 Oslo Con-vention on dumping from ships and the 1974 Paris Convention on discharges from land to protect the marine environment of the Northeast Atlantic from pollution.
The OSPAR Convention framework works hand in glove with international legisla-tion governing the removal of structures.
DECOMMISSIONING
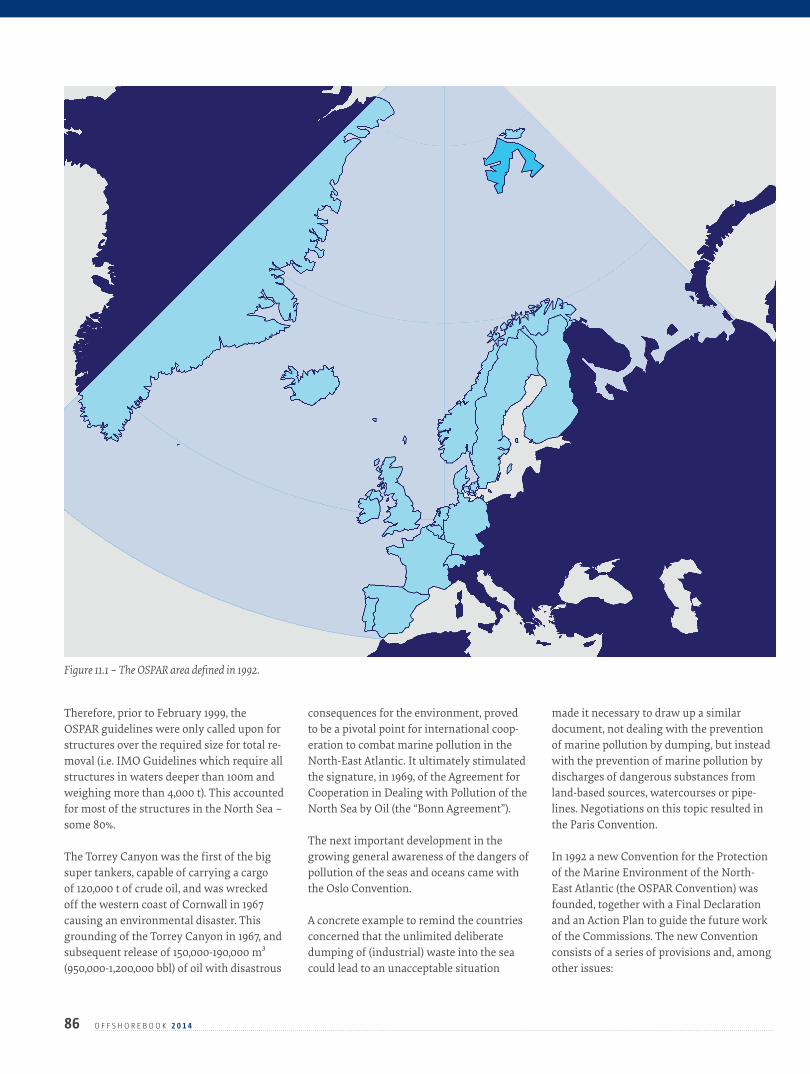
Therefore, prior to February 1999, the OSPAR guidelines were only called upon for structures over the required size for total re-moval (i.e. IMO Guidelines which require all structures in waters deeper than 100m and weighing more than 4,000 t). This accounted for most of the structures in the North Sea – some 80%.
The Torrey Canyon was the first of the big super tankers, capable of carrying a cargo of 120,000 t of crude oil, and was wrecked off the western coast of Cornwall in 1967 causing an environmental disaster. This grounding of the Torrey Canyon in 1967, and subsequent release of 150,000-190,000 m³ (950,000-1,200,000 bbl) of oil with disastrous
consequences for the environment, proved to be a pivotal point for international coop-eration to combat marine pollution in the North-East Atlantic. It ultimately stimulated the signature, in 1969, of the Agreement for Cooperation in Dealing with Pollution of the North Sea by Oil (the “Bonn Agreement”).
The next important development in the growing general awareness of the dangers of pollution of the seas and oceans came with the Oslo Convention.
A concrete example to remind the countries concerned that the unlimited deliberate dumping of (industrial) waste into the sea could lead to an unacceptable situation
made it necessary to draw up a similar document, not dealing with the prevention of marine pollution by dumping, but instead with the prevention of marine pollution by discharges of dangerous substances from land-based sources, watercourses or pipe-lines. Negotiations on this topic resulted in the Paris Convention.
In 1992 a new Convention for the Protection of the Marine Environment of the North-East Atlantic (the OSPAR Convention) was founded, together with a Final Declaration and an Action Plan to guide the future work of the Commissions. The new Convention consists of a series of provisions and, among other issues:
86 O F F S H O R E B O O K 2 0 1 4
Figure 11.1 – The OSPAR area defined in 1992.
1) requires the application of: a) the precautionary principle b) the polluter pays principle c) best available techniques (BAT) and best
environmental practice (BEP), including clean technology
2) provides for the Commission established by the OSPAR Convention to adopt bind-ing decisions
3) provides for the participation of observers, including non-governmental organiza-tions, in the work of the Commission
4) establishes rights of access to information about the maritime area of the Conven-tion
OSPAR requires the following:• The topsides of all installations must be
removed to shore• All sub-structures or jackets weighing less
than 10,000 t must be completely removed and brought to shore for reuse, recycling or disposal on land
• However, it is recognized that there may be difficulty in removing footings of large steel sub-structures weighing over 10,000 t and in removing concrete gravity based installations. An assessment will be made on a case-by-case basis as to whether ex-ceptions from the general rule can be made for such installation.
• Exceptions can be considered for oth-er structures when exception- al and unforeseen circumstances resulting from structural damage or deterioration or other reasons which would prevent the removal of a structure.
11-4 Decommissioning Options
The most important steps in the decommis-sioning process are the planning ahead and the selection of the best decommissioning option. The decommissioning process can take several years from initial planning to removal and disposal onshore.
When faced with the prospect of a platform nearing the end of its useful life, all operat-ing companies begin to think about all the possible options for decommissioning the facilities. Scientific studies are then carried out to assess each possible option using the following criteria:
• Environment (land, sea and air)• Technical feasibility• Cost• Health and Safety• Public opinion
The best decommissioning option is usually a balance of all factors.
11-4-1 Possible Decommissioning Options
The topsides of all installations must be removed to shore, without exception. For structures considered “small” (i.e. those with substructures weighing less than 10,000 t) complete removal is the only permitted option. The best option is then down to evaluating the various methods for carrying out the removal, balancing the same set of criteria.
For structures that are brought back to shore (either as a whole or in pieces), different disposal options must then be evaluated.
The waste hierarchy dictates that there is a preference for reuse (either within or outside the oil and gas industry), followed by recycling and finally disposal, if neither of the other two options are possible. For the large structures (i.e. all steel or concrete installations with substructures weighing more than 10,000 t) a number of options are possible and must be evaluated balancing all the above listed criteria:
• Complete removal• Partial removal leaving 55 m clear water
column for navigational safety• For steel structures the cut-off point would
be at the top of the “footings”• For concrete gravity structures the cut-off
point is usually determined by the con-struction of the installation
• Leave in place (for concrete gravity based installations only and only with the prior authorization from relevant authorities).
11-4-2 Criteria for Decommissioning Solution
When considering the environmental impacts of a given option, it is necessary to assess the wider effects on the land, sea and air of bringing all or parts of the structure to shore. A number of factors may be evaluated before a given task:
• The amount of energy used to remove a structure and take it back to shore
• The emissions to the atmosphere during all
the phases of the decommissioning • Waste streams from all phases of the de-
commissioning of a structure, which must be traced and accounted for
• The environmental effects on other users
of the sea and the local populations on-shore
• The environmental effects on the marine
fauna and flora
All the different available technologies are researched for each phase of the decommis-sioning operation and the best technology used to ensure efficient and safe procedures. New offshore technologies are continually being evaluated, tested and developed.
To date most decommissioning has relied on heavy lift vessels, which take the structure apart offshore piece by piece. However, ma-rine contractors and the oil and gas industry are jointly developing new technologies, which could lift whole topsides off in one go and possibly the whole of the substructures.
As with all businesses, the onus is on the operator to find the most cost-effective op-tion, which does not compromise the safety of workers or the environment. At present the costs for decommissioning structures are relatively high since experience is still limited to a small number of shallow water structures.
The health and safety of the workers is of paramount importance, and every effort is made to ensure that all phases are carried out to the highest industry safety stand-ards. The work offshore is inherently more dangerous as it is the least predictable due to the weather, the sea movement and the equipment being used.
11-5 Reuse Although newer techniques have furnished alternative ways to reduce decommissioning expenditures, the costs for decommission-
87O F F S H O R E B O O K 2 0 1 4
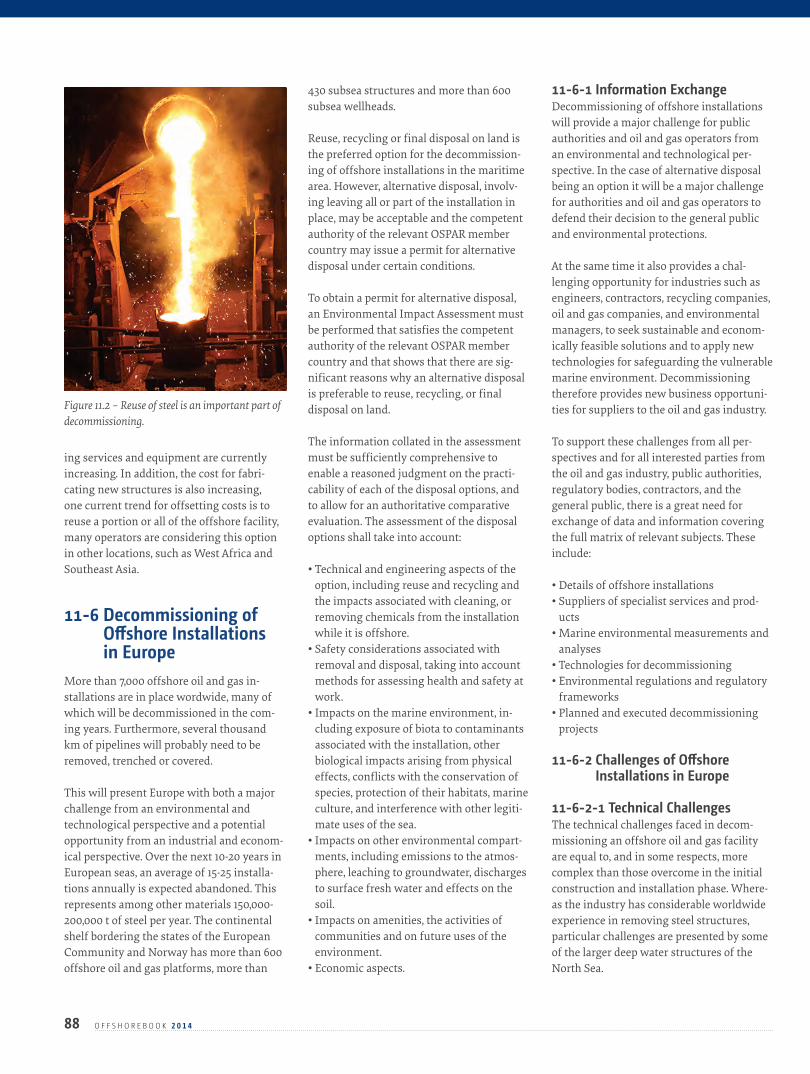
88 O F F S H O R E B O O K 2 0 1 4
ing services and equipment are currently increasing. In addition, the cost for fabri-cating new structures is also increasing, one current trend for offsetting costs is to reuse a portion or all of the offshore facility, many operators are considering this option in other locations, such as West Africa and Southeast Asia.
11-6 Decommissioning of Offshore Installations in Europe
More than 7,000 offshore oil and gas in-stallations are in place wordwide, many of which will be decommissioned in the com-ing years. Furthermore, several thousand km of pipelines will probably need to be removed, trenched or covered.
This will present Europe with both a major challenge from an environmental and technological perspective and a potential opportunity from an industrial and econom-ical perspective. Over the next 10-20 years in European seas, an average of 15-25 installa-tions annually is expected abandoned. This represents among other materials 150,000-200,000 t of steel per year. The continental shelf bordering the states of the European Community and Norway has more than 600 offshore oil and gas platforms, more than
430 subsea structures and more than 600 subsea wellheads.
Reuse, recycling or final disposal on land is the preferred option for the decommission-ing of offshore installations in the maritime area. However, alternative disposal, involv-ing leaving all or part of the installation in place, may be acceptable and the competent authority of the relevant OSPAR member country may issue a permit for alternative disposal under certain conditions.
To obtain a permit for alternative disposal, an Environmental Impact Assessment must be performed that satisfies the competent authority of the relevant OSPAR member country and that shows that there are sig-nificant reasons why an alternative disposal is preferable to reuse, recycling, or final disposal on land.
The information collated in the assessment must be sufficiently comprehensive to enable a reasoned judgment on the practi-cability of each of the disposal options, and to allow for an authoritative comparative evaluation. The assessment of the disposal options shall take into account:
• Technical and engineering aspects of the option, including reuse and recycling and the impacts associated with cleaning, or removing chemicals from the installation while it is offshore.
• Safety considerations associated with removal and disposal, taking into account methods for assessing health and safety at work.
• Impacts on the marine environment, in-cluding exposure of biota to contaminants associated with the installation, other biological impacts arising from physical effects, conflicts with the conservation of species, protection of their habitats, marine culture, and interference with other legiti-mate uses of the sea.
• Impacts on other environmental compart-ments, including emissions to the atmos-phere, leaching to groundwater, discharges to surface fresh water and effects on the soil.
• Impacts on amenities, the activities of communities and on future uses of the environment.
• Economic aspects.
11-6-1 Information ExchangeDecommissioning of offshore installations will provide a major challenge for public authorities and oil and gas operators from an environmental and technological per-spective. In the case of alternative disposal being an option it will be a major challenge for authorities and oil and gas operators to defend their decision to the general public and environmental protections.
At the same time it also provides a chal-lenging opportunity for industries such as engineers, contractors, recycling companies, oil and gas companies, and environmental managers, to seek sustainable and econom-ically feasible solutions and to apply new technologies for safeguarding the vulnerable marine environment. Decommissioning therefore provides new business opportuni-ties for suppliers to the oil and gas industry.
To support these challenges from all per-spectives and for all interested parties from the oil and gas industry, public authorities, regulatory bodies, contractors, and the general public, there is a great need for exchange of data and information covering the full matrix of relevant subjects. These include:
• Details of offshore installations• Suppliers of specialist services and prod-
ucts• Marine environmental measurements and
analyses• Technologies for decommissioning• Environmental regulations and regulatory
frameworks • Planned and executed decommissioning
projects
11-6-2 Challenges of Offshore Installations in Europe
11-6-2-1 Technical ChallengesThe technical challenges faced in decom-missioning an offshore oil and gas facility are equal to, and in some respects, more complex than those overcome in the initial construction and installation phase. Where-as the industry has considerable worldwide experience in removing steel structures, particular challenges are presented by some of the larger deep water structures of the North Sea.
Figure 11.2 – Reuse of steel is an important part of decommissioning.

89O F F S H O R E B O O K 2 0 1 4
11-6-2-2 Health and Safety Challenges
Decommissioning and removal of a complex offshore oil and gas facility is a complex and potentially risky operation. Any proposed decommissioning operation must seek to minimize the associated hazards and risks to personnel to a level that is as low as reasonably practicable. Such operations will be subject to detailed safety analysis and summarized in the abandonment safety case approved by the appropriate regulatory authorities.
11-6-2-3 Environmental ChallengesWhen undertaking and planning decom-missioning, account has to be taken of the environmental impact of each phase of the operation. Results of the various options available will be compared to identify the op-tion of least detriment to the environment.
11-6-2-4 Economic ChallengesThere are many economic decisions involved in planning a decommissioning operation. From defining the optimum time to shut down a producing facility and ensuring adequate financial security is in place to meet decommissioning liabilities, through to selecting the decommissioning option of least cost, which is compatible with tech-nical feasibility, least risk to personnel and least impact on the environment.
11-6-2-5 Construction ChallengesThe process of decommissioning offshore oil and gas facilities raises many complex issues and choices. Because of these complexities and their inter-relation, it is essential that there is fully transparent and well-informed debate between owners, government and all interested parties in society to define consensus solutions.
Decommissioning strategies are not devel-oped in an ad hoc fashion. The oil and gas industry is highly regulated through each phase of its development from exploration, building and installing processing facili-ties, operations and decommissioning. The freedom of National States to define their own abandonment regulatory regimes is constrained by a global framework of con-ventions, guidelines, and regional protocols, which together define international law.National governments will have specific
laws governing decommissioning opera-tions which undoubtedly will seek protec-tion from litigation by enforcing consistency between national and international laws.
11-7 Decommissioning of Offshore Installations in the North Sea
As a consequence of rising international global energy consumption and high-energy prices, a great effort is done to maintain production of oil and gas in the North Sea. Existing installations are optimised and developed, and investments are still being made in test wells in the hunt for oil-rich, new fields.
In the Danish North Sea sector alone, € 600-800 million is invested each year in develop-ment of existing fields plus € 100-150 million in exploration for new deposits, according to the Danish Energy Agency. Nevertheless, many of the oil and gas installations in the northern North Sea are reaching the end of their economic production life, and propos-als for decommissioning are being prepared by operators.
Offshoreenergy.dk records indicate that
almost 600 installations in the North Sea were constructed before 1996 and have therefore reached the age where they should be considered to be decommissioned. In the British North Sea sector alone, 362 instal-lations were set up before 1996, and a few installations have already been decommis-sioned; however, this has not happened in the Danish North Sea sector.
In 1995, proposals by Shell to dispose of the Brent Spar oil storage facility provoked an extensive campaign of protest. The result was a change of plan, with the facility being towed inshore to be dismantled. The mate-rial has been recycled for harbour construc-tion at Mekjarvik, near Stavanger, Norway.
In 1999, ConocoPhillips Petroleum Norway announced their plans to decommission 15 installations in the Ekofisk field. This was not because the installations were obsolete; the reason was a lowered seabed. Conse-quently, the existing installations had to be replaced by higher ones, which was an operation on a much bigger scale than the Brent Spar installation.
The steel structures were taken down and brought onshore for recycling and a large, concrete storage tank was left in situ.
Platforms in the North Sea installed before 1996Number of Platforms by Country
United Kingdom (362)
Norway (107)
Netherlands (84)
Denmark (30)
Others (5)
Figure 11.3 – Platforms in the North Sea installed before 1996. Courtesy: Ramboll Oil & Gas.
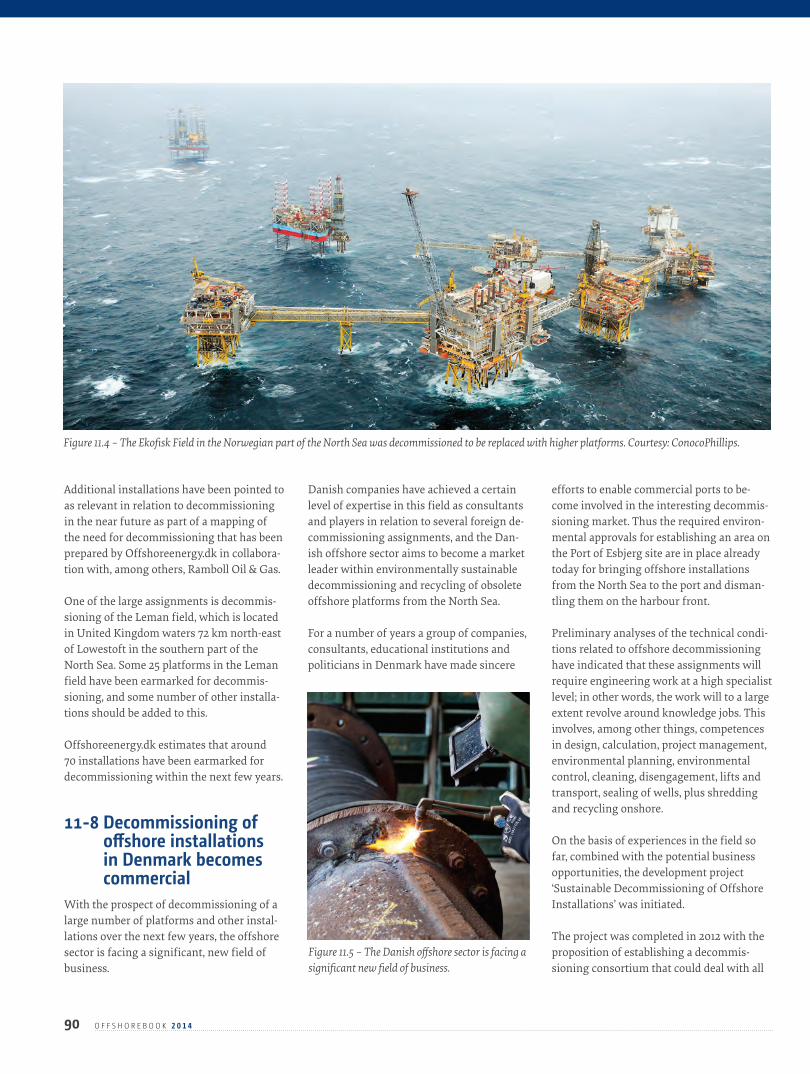
90 O F F S H O R E B O O K 2 0 1 4
Additional installations have been pointed to as relevant in relation to decommissioning in the near future as part of a mapping of the need for decommissioning that has been prepared by Offshoreenergy.dk in collabora-tion with, among others, Ramboll Oil & Gas.
One of the large assignments is decommis-sioning of the Leman field, which is located in United Kingdom waters 72 km north-east of Lowestoft in the southern part of the North Sea. Some 25 platforms in the Leman field have been earmarked for decommis-sioning, and some number of other installa-tions should be added to this.
Offshoreenergy.dk estimates that around 70 installations have been earmarked for decommissioning within the next few years.
11-8 Decommissioning of offshore installations in Denmark becomes commercial
With the prospect of decommissioning of a large number of platforms and other instal-lations over the next few years, the offshore sector is facing a significant, new field of business.
Danish companies have achieved a certain level of expertise in this field as consultants and players in relation to several foreign de-commissioning assignments, and the Dan-ish offshore sector aims to become a market leader within environmentally sustainable decommissioning and recycling of obsolete offshore platforms from the North Sea.
For a number of years a group of companies, consultants, educational institutions and politicians in Denmark have made sincere
efforts to enable commercial ports to be-come involved in the interesting decommis-sioning market. Thus the required environ-mental approvals for establishing an area on the Port of Esbjerg site are in place already today for bringing offshore installations from the North Sea to the port and disman-tling them on the harbour front.
Preliminary analyses of the technical condi-tions related to offshore decommissioning have indicated that these assignments will require engineering work at a high specialist level; in other words, the work will to a large extent revolve around knowledge jobs. This involves, among other things, competences in design, calculation, project management, environmental planning, environmental control, cleaning, disengagement, lifts and transport, sealing of wells, plus shredding and recycling onshore.
On the basis of experiences in the field so far, combined with the potential business opportunities, the development project ‘Sustainable Decommissioning of Offshore Installations’ was initiated.
The project was completed in 2012 with the proposition of establishing a decommis-sioning consortium that could deal with all
Figure 11.4 – The Ekofisk Field in the Norwegian part of the North Sea was decommissioned to be replaced with higher platforms. Courtesy: ConocoPhillips.
Figure 11.5 – The Danish offshore sector is facing a significant new field of business.
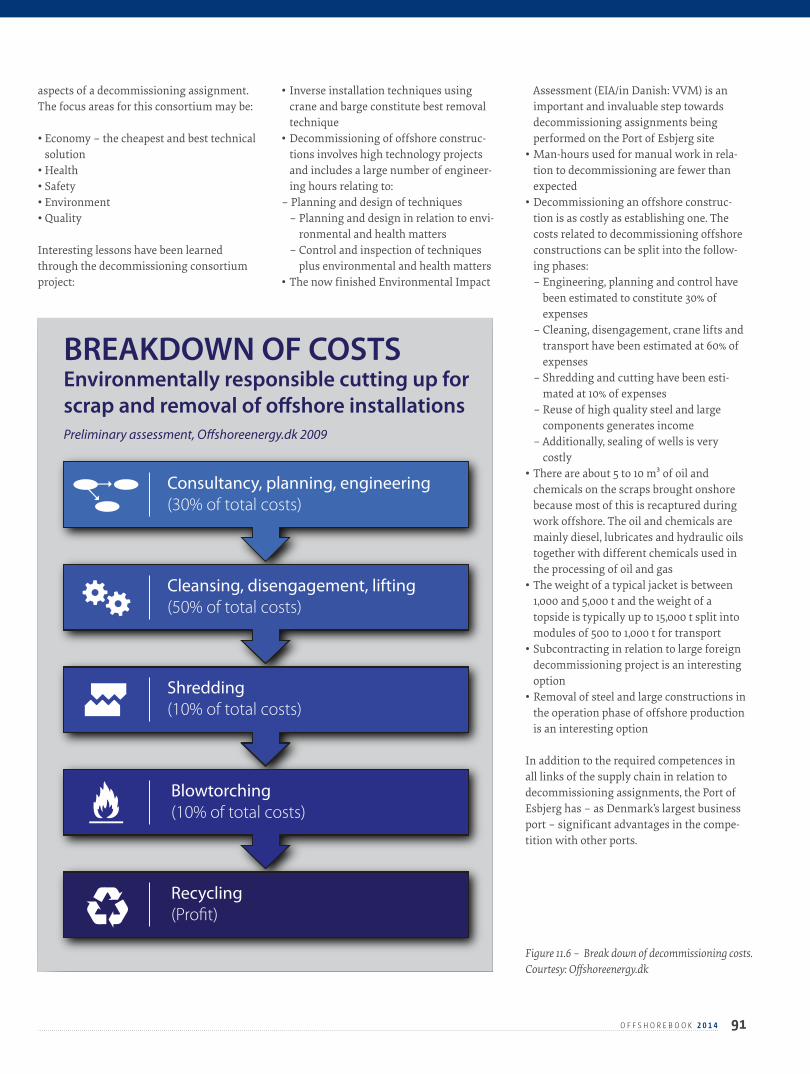
91O F F S H O R E B O O K 2 0 1 4
aspects of a decommissioning assignment. The focus areas for this consortium may be:
• Economy – the cheapest and best technical solution
• Health• Safety• Environment• Quality
Interesting lessons have been learned through the decommissioning consortium project:
• Inverse installation techniques using crane and barge constitute best removal technique
• Decommissioning of offshore construc-tions involves high technology projects and includes a large number of engineer-ing hours relating to:
– Planning and design of techniques – Planning and design in relation to envi-
ronmental and health matters – Control and inspection of techniques
plus environmental and health matters• The now finished Environmental Impact
Assessment (EIA/in Danish: VVM) is an important and invaluable step towards decommissioning assignments being performed on the Port of Esbjerg site
• Man-hours used for manual work in rela-tion to decommissioning are fewer than expected
• Decommissioning an offshore construc-tion is as costly as establishing one. The costs related to decommissioning offshore constructions can be split into the follow-ing phases:
– Engineering, planning and control have been estimated to constitute 30% of expenses
– Cleaning, disengagement, crane lifts and transport have been estimated at 60% of expenses
– Shredding and cutting have been esti-mated at 10% of expenses
– Reuse of high quality steel and large components generates income
– Additionally, sealing of wells is very costly
• There are about 5 to 10 m³ of oil and chemicals on the scraps brought onshore because most of this is recaptured during work offshore. The oil and chemicals are mainly diesel, lubricates and hydraulic oils together with different chemicals used in the processing of oil and gas
• The weight of a typical jacket is between 1,000 and 5,000 t and the weight of a topside is typically up to 15,000 t split into modules of 500 to 1,000 t for transport
• Subcontracting in relation to large foreign decommissioning project is an interesting option
• Removal of steel and large constructions in the operation phase of offshore production is an interesting option
In addition to the required competences in all links of the supply chain in relation to decommissioning assignments, the Port of Esbjerg has – as Denmark’s largest business port – significant advantages in the compe-tition with other ports.
Consultancy, planning, engineering(30% of total costs)
Cleansing, disengagement, lifting(50% of total costs)
Shredding(10% of total costs)
Blowtorching(10% of total costs)
Recycling(Pro�t)
BREAKDOWN OF COSTSEnvironmentally responsible cutting up for scrap and removal of o�shore installationsPreliminary assessment, O�shoreenergy.dk 2009
Figure 11.6 – Break down of decommissioning costs. Courtesy: Offshoreenergy.dk
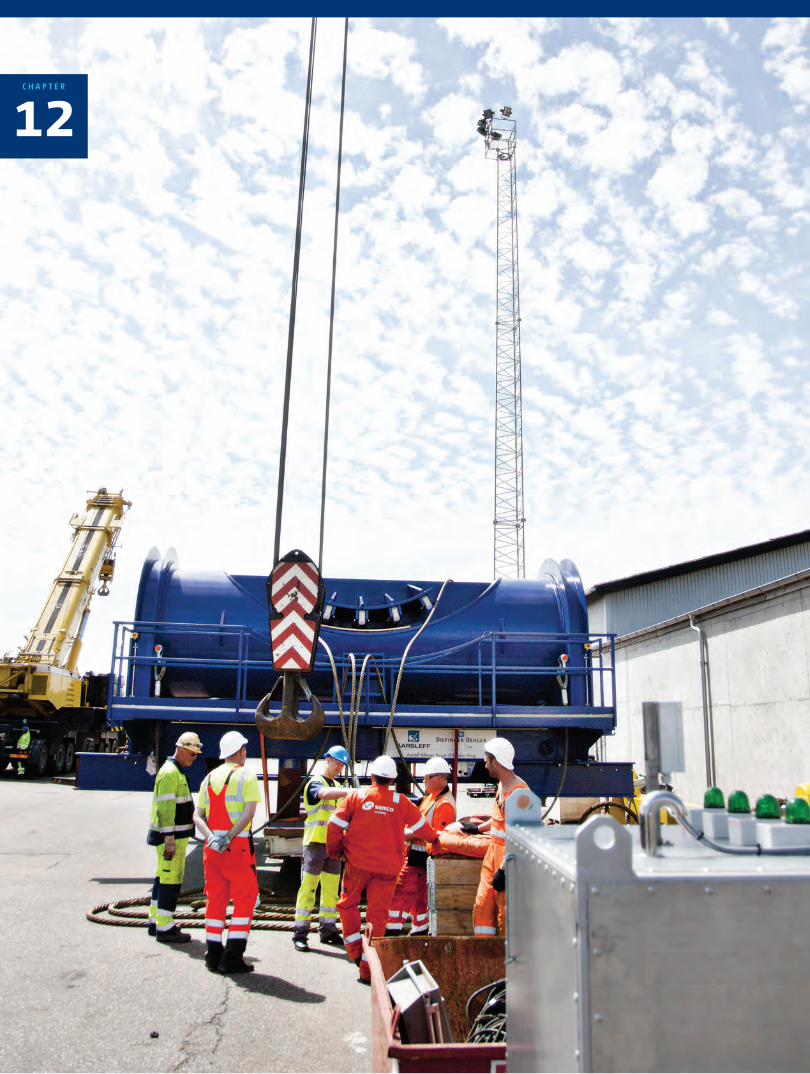
12C H A P T E R
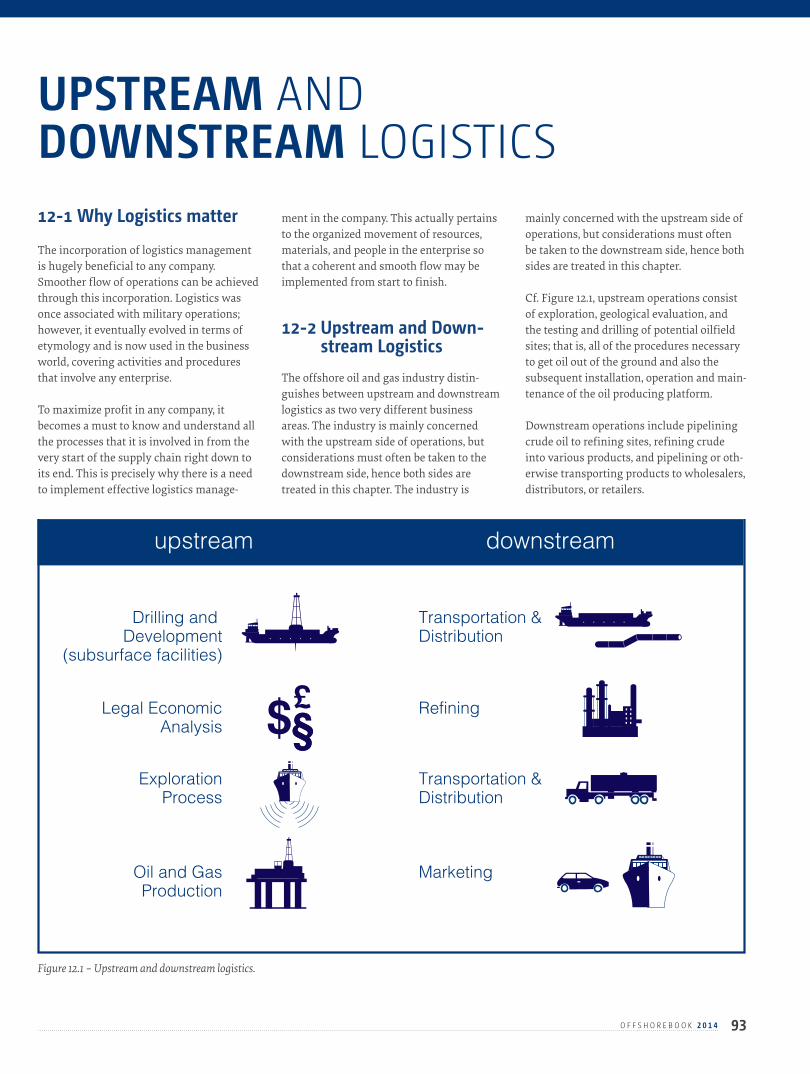
93O F F S H O R E B O O K 2 0 1 4
12-1 Why Logistics matter The incorporation of logistics management is hugely beneficial to any company. Smoother flow of operations can be achieved through this incorporation. Logistics was once associated with military operations; however, it eventually evolved in terms of etymology and is now used in the business world, covering activities and procedures that involve any enterprise.
To maximize profit in any company, it becomes a must to know and understand all the processes that it is involved in from the very start of the supply chain right down to its end. This is precisely why there is a need to implement effective logistics manage-
ment in the company. This actually pertains to the organized movement of resources, materials, and people in the enterprise so that a coherent and smooth flow may be implemented from start to finish.
12-2 Upstream and Down-stream Logistics
The offshore oil and gas industry distin-guishes between upstream and downstream logistics as two very different business areas. The industry is mainly concerned with the upstream side of operations, but considerations must often be taken to the downstream side, hence both sides are treated in this chapter. The industry is
mainly concerned with the upstream side of operations, but considerations must often be taken to the downstream side, hence both sides are treated in this chapter.
Cf. Figure 12.1, upstream operations consist of exploration, geological evaluation, and the testing and drilling of potential oilfield sites; that is, all of the procedures necessary to get oil out of the ground and also the subsequent installation, operation and main-tenance of the oil producing platform.
Downstream operations include pipelining crude oil to refining sites, refining crude into various products, and pipelining or oth-erwise transporting products to wholesalers, distributors, or retailers.
UPSTREAM AND DOWNSTREAM LOGISTICS
Transportation &Distribution
Transportation &Distribution
Refining
Marketing
Drilling and Development
(subsurface facilities)
ExplorationProcess
Legal EconomicAnalysis
Oil and GasProduction
Figure 12.1 – Upstream and downstream logistics.
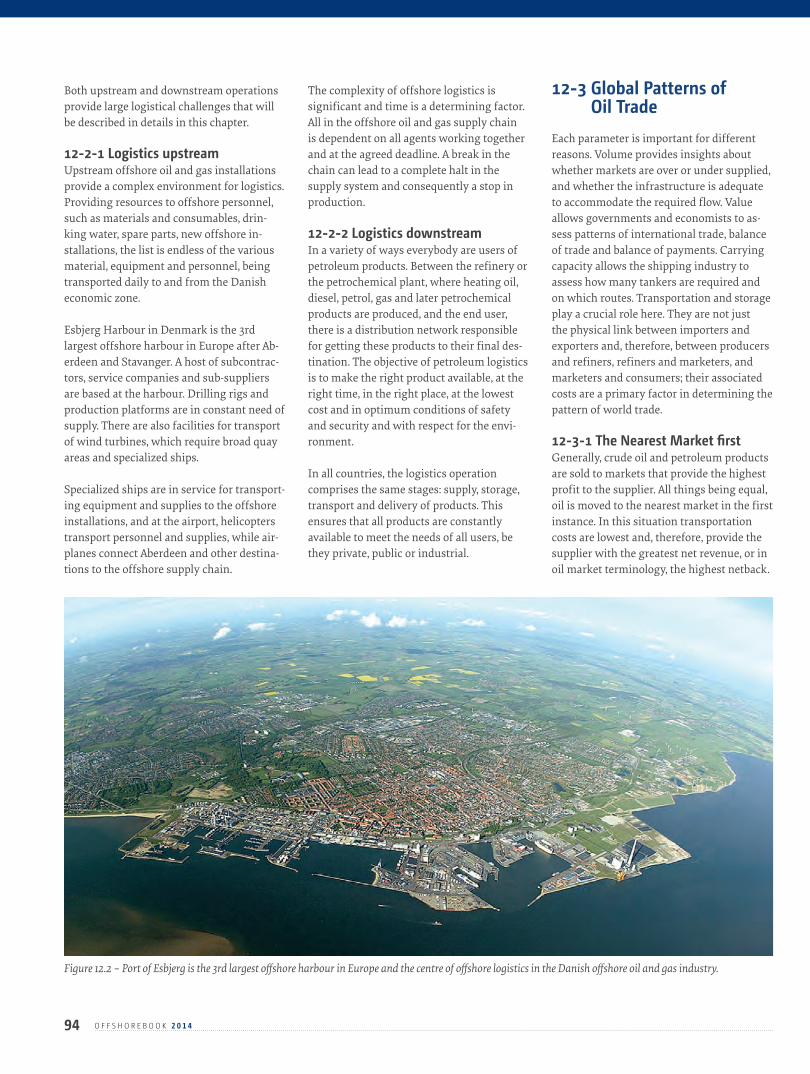
Both upstream and downstream operations provide large logistical challenges that will be described in details in this chapter.
12-2-1 Logistics upstreamUpstream offshore oil and gas installations provide a complex environment for logistics. Providing resources to offshore personnel, such as materials and consumables, drin-king water, spare parts, new offshore in-stallations, the list is endless of the various material, equipment and personnel, being transported daily to and from the Danish economic zone.
Esbjerg Harbour in Denmark is the 3rd largest offshore harbour in Europe after Ab-erdeen and Stavanger. A host of subcontrac-tors, service companies and sub-suppliers are based at the harbour. Drilling rigs and production platforms are in constant need of supply. There are also facilities for transport of wind turbines, which require broad quay areas and specialized ships.
Specialized ships are in service for transport-ing equipment and supplies to the offshore installations, and at the airport, helicopters transport personnel and supplies, while air-planes connect Aberdeen and other destina-tions to the offshore supply chain.
The complexity of offshore logistics is significant and time is a determining factor. All in the offshore oil and gas supply chain is dependent on all agents working together and at the agreed deadline. A break in the chain can lead to a complete halt in the supply system and consequently a stop in production.
12-2-2 Logistics downstream In a variety of ways everybody are users of petroleum products. Between the refinery or the petrochemical plant, where heating oil, diesel, petrol, gas and later petrochemical products are produced, and the end user, there is a distribution network responsible for getting these products to their final des-tination. The objective of petroleum logistics is to make the right product available, at the right time, in the right place, at the lowest cost and in optimum conditions of safety and security and with respect for the envi-ronment.
In all countries, the logistics operation comprises the same stages: supply, storage, transport and delivery of products. This ensures that all products are constantly available to meet the needs of all users, be they private, public or industrial.
12-3 Global Patterns of Oil Trade
Each parameter is important for different reasons. Volume provides insights about whether markets are over or under supplied, and whether the infrastructure is adequate to accommodate the required flow. Value allows governments and economists to as-sess patterns of international trade, balance of trade and balance of payments. Carrying capacity allows the shipping industry to assess how many tankers are required and on which routes. Transportation and storage play a crucial role here. They are not just the physical link between importers and exporters and, therefore, between producers and refiners, refiners and marketers, and marketers and consumers; their associated costs are a primary factor in determining the pattern of world trade.
12-3-1 The Nearest Market firstGenerally, crude oil and petroleum products are sold to markets that provide the highest profit to the supplier. All things being equal, oil is moved to the nearest market in the first instance. In this situation transportation costs are lowest and, therefore, provide the supplier with the greatest net revenue, or in oil market terminology, the highest netback.
94 O F F S H O R E B O O K 2 0 1 4
Figure 12.2 – Port of Esbjerg is the 3rd largest offshore harbour in Europe and the centre of offshore logistics in the Danish offshore oil and gas industry.
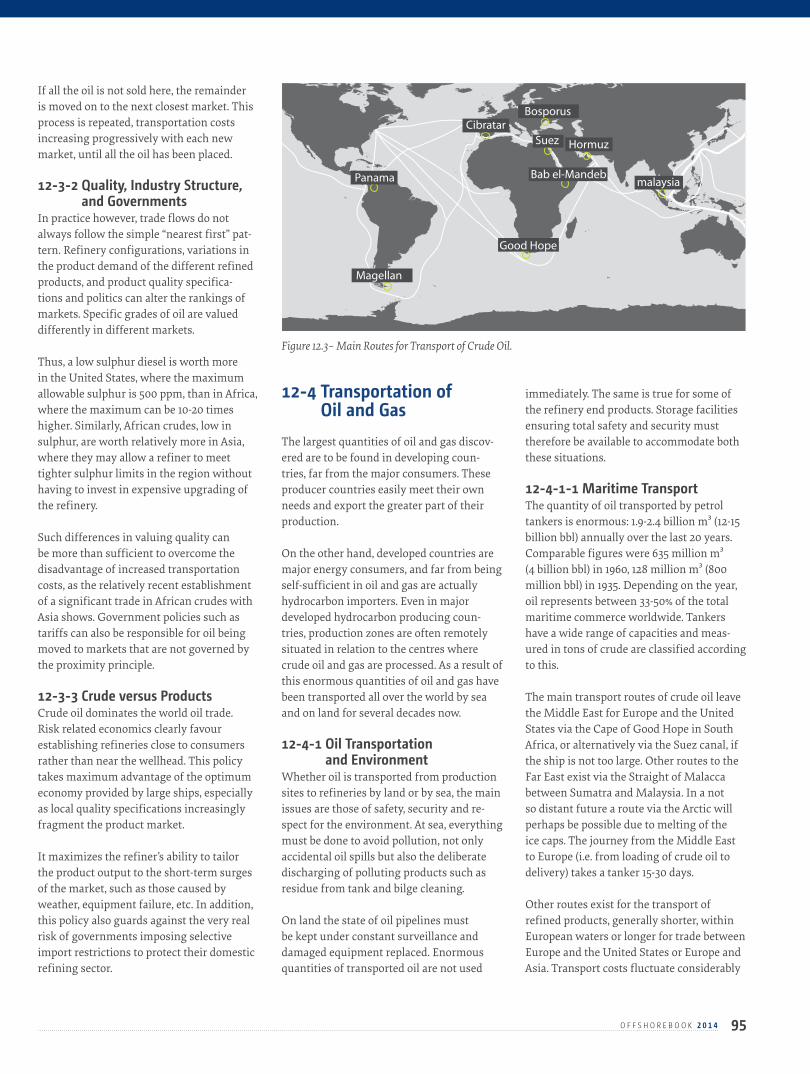
If all the oil is not sold here, the remainder is moved on to the next closest market. This process is repeated, transportation costs increasing progressively with each new market, until all the oil has been placed.
12-3-2 Quality, Industry Structure, and Governments
In practice however, trade flows do not always follow the simple “nearest first” pat-tern. Refinery configurations, variations in the product demand of the different refined products, and product quality specifica-tions and politics can alter the rankings of markets. Specific grades of oil are valued differently in different markets.
Thus, a low sulphur diesel is worth more in the United States, where the maximum allowable sulphur is 500 ppm, than in Africa, where the maximum can be 10-20 times higher. Similarly, African crudes, low in sulphur, are worth relatively more in Asia, where they may allow a refiner to meet tighter sulphur limits in the region without having to invest in expensive upgrading of the refinery.
Such differences in valuing quality can be more than sufficient to overcome the disadvantage of increased transportation costs, as the relatively recent establishment of a significant trade in African crudes with Asia shows. Government policies such as tariffs can also be responsible for oil being moved to markets that are not governed by the proximity principle.
12-3-3 Crude versus ProductsCrude oil dominates the world oil trade. Risk related economics clearly favour establishing refineries close to consumers rather than near the wellhead. This policy takes maximum advantage of the optimum economy provided by large ships, especially as local quality specifications increasingly fragment the product market.
It maximizes the refiner’s ability to tailor the product output to the short-term surges of the market, such as those caused by weather, equipment failure, etc. In addition, this policy also guards against the very real risk of governments imposing selective import restrictions to protect their domestic refining sector.
12-4 Transportation of Oil and Gas
The largest quantities of oil and gas discov-ered are to be found in developing coun-tries, far from the major consumers. These producer countries easily meet their own needs and export the greater part of their production.
On the other hand, developed countries are major energy consumers, and far from being self-sufficient in oil and gas are actually hydrocarbon importers. Even in major developed hydrocarbon producing coun-tries, production zones are often remotely situated in relation to the centres where crude oil and gas are processed. As a result of this enormous quantities of oil and gas have been transported all over the world by sea and on land for several decades now.
12-4-1 Oil Transportation and Environment
Whether oil is transported from production sites to refineries by land or by sea, the main issues are those of safety, security and re-spect for the environment. At sea, everything must be done to avoid pollution, not only accidental oil spills but also the deliberate discharging of polluting products such as residue from tank and bilge cleaning.
On land the state of oil pipelines must be kept under constant surveillance and damaged equipment replaced. Enormous quantities of transported oil are not used
immediately. The same is true for some of the refinery end products. Storage facilities ensuring total safety and security must therefore be available to accommodate both these situations.
12-4-1-1 Maritime TransportThe quantity of oil transported by petrol tankers is enormous: 1.9-2.4 billion m³ (12-15 billion bbl) annually over the last 20 years. Comparable figures were 635 million m³ (4 billion bbl) in 1960, 128 million m³ (800 million bbl) in 1935. Depending on the year, oil represents between 33-50% of the total maritime commerce worldwide. Tankers have a wide range of capacities and meas-ured in tons of crude are classified according to this.
The main transport routes of crude oil leave the Middle East for Europe and the United States via the Cape of Good Hope in South Africa, or alternatively via the Suez canal, if the ship is not too large. Other routes to the Far East exist via the Straight of Malacca between Sumatra and Malaysia. In a not so distant future a route via the Arctic will perhaps be possible due to melting of the ice caps. The journey from the Middle East to Europe (i.e. from loading of crude oil to delivery) takes a tanker 15-30 days.
Other routes exist for the transport of refined products, generally shorter, within European waters or longer for trade between Europe and the United States or Europe and Asia. Transport costs fluctuate considerably
95O F F S H O R E B O O K 2 0 1 4
Figure 12.3– Main Routes for Transport of Crude Oil.
Cibratar
Bab el-Mandeb Panama
Hormuz
Bosporus
Suez
malaysia
Good Hope
Magellan
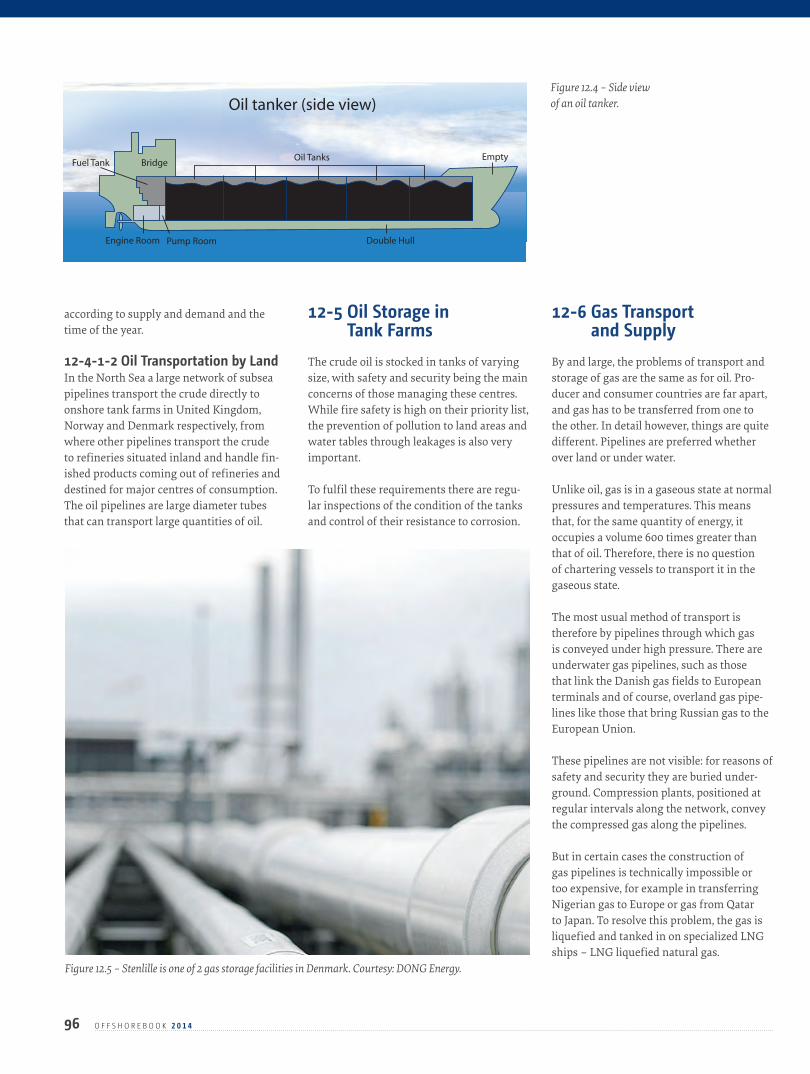
96 O F F S H O R E B O O K 2 0 1 4
according to supply and demand and the time of the year.
12-4-1-2 Oil Transportation by LandIn the North Sea a large network of subsea pipelines transport the crude directly to onshore tank farms in United Kingdom, Norway and Denmark respectively, from where other pipelines transport the crude to refineries situated inland and handle fin-ished products coming out of refineries and destined for major centres of consumption. The oil pipelines are large diameter tubes that can transport large quantities of oil.
12-5 Oil Storage in Tank Farms
The crude oil is stocked in tanks of varying size, with safety and security being the main concerns of those managing these centres. While fire safety is high on their priority list, the prevention of pollution to land areas and water tables through leakages is also very important.
To fulfil these requirements there are regu-lar inspections of the condition of the tanks and control of their resistance to corrosion.
12-6 Gas Transport and Supply
By and large, the problems of transport and storage of gas are the same as for oil. Pro-ducer and consumer countries are far apart, and gas has to be transferred from one to the other. In detail however, things are quite different. Pipelines are preferred whether over land or under water.
Unlike oil, gas is in a gaseous state at normal pressures and temperatures. This means that, for the same quantity of energy, it occupies a volume 600 times greater than that of oil. Therefore, there is no question of chartering vessels to transport it in the gaseous state.
The most usual method of transport is therefore by pipelines through which gas is conveyed under high pressure. There are underwater gas pipelines, such as those that link the Danish gas fields to European terminals and of course, overland gas pipe-lines like those that bring Russian gas to the European Union.
These pipelines are not visible: for reasons of safety and security they are buried under-ground. Compression plants, positioned at regular intervals along the network, convey the compressed gas along the pipelines.
But in certain cases the construction of gas pipelines is technically impossible or too expensive, for example in transferring Nigerian gas to Europe or gas from Qatar to Japan. To resolve this problem, the gas is liquefied and tanked in on specialized LNG ships – LNG liquefied natural gas.
Engine Room Pump Room Double Hull
Fuel TankOil Tanks Empty
Bridge
Oil tanker (side view)
Figure 12.5 – Stenlille is one of 2 gas storage facilities in Denmark. Courtesy: DONG Energy.
Figure 12.4 – Side view of an oil tanker.

97O F F S H O R E B O O K 2 0 1 4
12-7 Gas Storage Facilities Gas consumption fluctuates over the year with the largest consumption during the winter. The maximum supply of natural gas from the North Sea fields is limited to approximately 22-24 million Nm³/day. The gas consumption on a cold winter day may amount to 30-33 million Nm³/day.
In order to handle the difference between production and consumption, it is necessary to be able to store the surplus gas from the summer production to the larger winter consumption.
Therefore, in connection with establishing the Danish natural gas grid, 2 gas storage facilities were established to manage this load equalisation.
Lille Torup gas storage (Jutland):• A total volume of 710 million Nm³ natural
gas distributed on 7 natural salt caverns• Working gas at 441 million Nm³• Hydraulic trains with a total capacity of
10.8 million Nm³/24 hrs• Injection trains with a total capacity of 3.6
million Nm³/24 hrs
Stenlille gas storage (Zealand):• A total volume of 1,160 million Nm³ natural
gas• Working gas at 440 million Nm³• Hydraulic trains with a total capacity of
10.8 million Nm³/24 hrs• Injection trains with a total capacity of 2.9
million Nm³/24 hrs
Lille Torup is owned and operated by Energinet.dk and Stenlille by DONG Energy.
Figure 12.6– Onshore oil and gas transmission system in Denmark.
Fredericia oil Refinery
Lille Torup Gas Storage
Gas from the North Sea
Filsø oil pumpingStation (5 bar)
Nybro gas processing plant(20 bar)
Oil from the North Sea
Export to Germany
Stenlille Gas Storage
Export to Sweden
Kalundborg oil Refinery
Offshore pipeline (natural gas)
Distribution pipeline (natural gas)
Natural gas treatment plant
Natural gas storage
Oil pipeline
Oil pumping station
Oil refinery
StenlilleFredericiaNybro
Li. Torup
13C H A P T E R
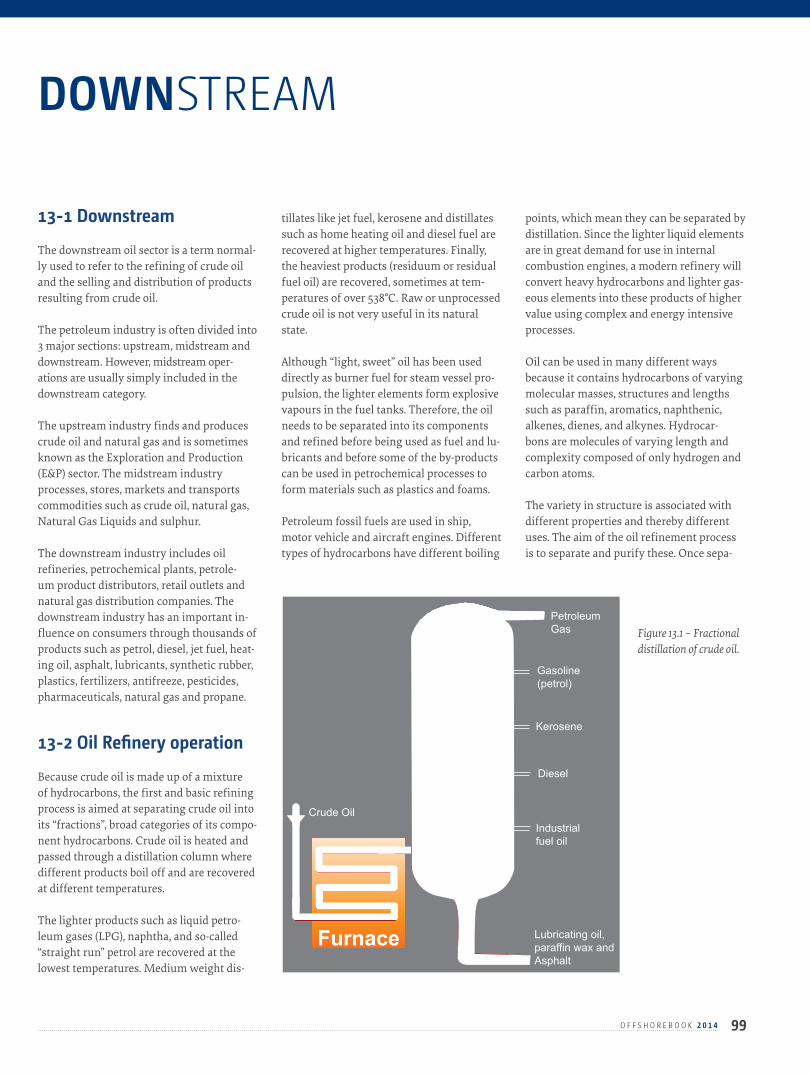
99O F F S H O R E B O O K 2 0 1 4
13-1 Downstream The downstream oil sector is a term normal-ly used to refer to the refining of crude oil and the selling and distribution of products resulting from crude oil.
The petroleum industry is often divided into 3 major sections: upstream, midstream and downstream. However, midstream oper-ations are usually simply included in the downstream category.
The upstream industry finds and produces crude oil and natural gas and is sometimes known as the Exploration and Production (E&P) sector. The midstream industry processes, stores, markets and transports commodities such as crude oil, natural gas, Natural Gas Liquids and sulphur.
The downstream industry includes oil refineries, petrochemical plants, petrole-um product distributors, retail outlets and natural gas distribution companies. The downstream industry has an important in-fluence on consumers through thousands of products such as petrol, diesel, jet fuel, heat-ing oil, asphalt, lubricants, synthetic rubber, plastics, fertilizers, antifreeze, pesticides, pharmaceuticals, natural gas and propane.
13-2 Oil Refinery operation Because crude oil is made up of a mixture of hydrocarbons, the first and basic refining process is aimed at separating crude oil into its “fractions”, broad categories of its compo-nent hydrocarbons. Crude oil is heated and passed through a distillation column where different products boil off and are recovered at different temperatures.
The lighter products such as liquid petro-leum gases (LPG), naphtha, and so-called “straight run” petrol are recovered at the lowest temperatures. Medium weight dis-
tillates like jet fuel, kerosene and distillates such as home heating oil and diesel fuel are recovered at higher temperatures. Finally, the heaviest products (residuum or residual fuel oil) are recovered, sometimes at tem-peratures of over 538°C. Raw or unprocessed crude oil is not very useful in its natural state.
Although “light, sweet” oil has been used directly as burner fuel for steam vessel pro-pulsion, the lighter elements form explosive vapours in the fuel tanks. Therefore, the oil needs to be separated into its components and refined before being used as fuel and lu-bricants and before some of the by-products can be used in petrochemical processes to form materials such as plastics and foams.
Petroleum fossil fuels are used in ship, motor vehicle and aircraft engines. Different types of hydrocarbons have different boiling
points, which mean they can be separated by distillation. Since the lighter liquid elements are in great demand for use in internal combustion engines, a modern refinery will convert heavy hydrocarbons and lighter gas-eous elements into these products of higher value using complex and energy intensive processes.
Oil can be used in many different ways because it contains hydrocarbons of varying molecular masses, structures and lengths such as paraffin, aromatics, naphthenic, alkenes, dienes, and alkynes. Hydrocar-bons are molecules of varying length and complexity composed of only hydrogen and carbon atoms.
The variety in structure is associated with different properties and thereby different uses. The aim of the oil refinement process is to separate and purify these. Once sepa-
DOWNSTREAM
Lubricating oil, paraffin wax and Asphalt
Industrialfuel oil
Diesel
Kerosene
Gasoline(petrol)
PetroleumGas
Crude Oil
Furnace
20° C
150° C
200° C
300° C
370° C
400° C
Figure 13.1 – Fractional distillation of crude oil.
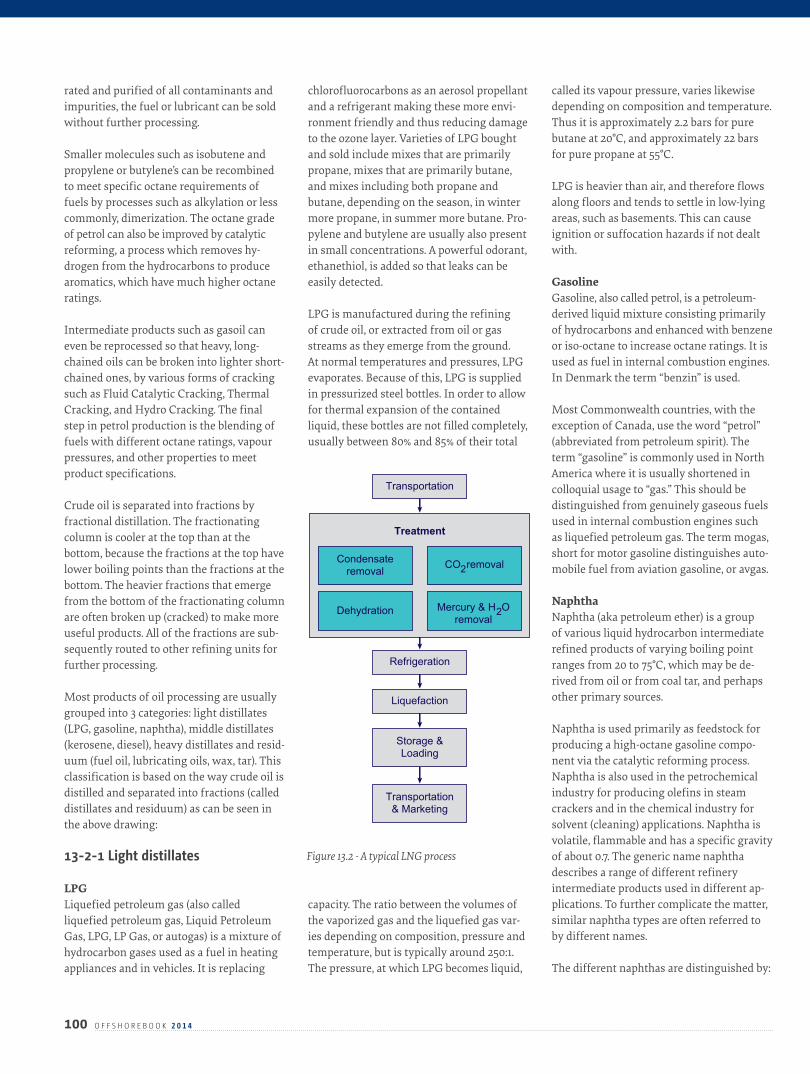
rated and purified of all contaminants and impurities, the fuel or lubricant can be sold without further processing.
Smaller molecules such as isobutene and propylene or butylene’s can be recombined to meet specific octane requirements of fuels by processes such as alkylation or less commonly, dimerization. The octane grade of petrol can also be improved by catalytic reforming, a process which removes hy-drogen from the hydrocarbons to produce aromatics, which have much higher octane ratings.
Intermediate products such as gasoil can even be reprocessed so that heavy, long-chained oils can be broken into lighter short-chained ones, by various forms of cracking such as Fluid Catalytic Cracking, Thermal Cracking, and Hydro Cracking. The final step in petrol production is the blending of fuels with different octane ratings, vapour pressures, and other properties to meet product specifications.
Crude oil is separated into fractions by fractional distillation. The fractionating column is cooler at the top than at the bottom, because the fractions at the top have lower boiling points than the fractions at the bottom. The heavier fractions that emerge from the bottom of the fractionating column are often broken up (cracked) to make more useful products. All of the fractions are sub-sequently routed to other refining units for further processing.
Most products of oil processing are usually grouped into 3 categories: light distillates (LPG, gasoline, naphtha), middle distillates (kerosene, diesel), heavy distillates and resid-uum (fuel oil, lubricating oils, wax, tar). This classification is based on the way crude oil is distilled and separated into fractions (called distillates and residuum) as can be seen in the above drawing:
13-2-1 Light distillates
LPGLiquefied petroleum gas (also called liquefied petroleum gas, Liquid Petroleum Gas, LPG, LP Gas, or autogas) is a mixture of hydrocarbon gases used as a fuel in heating appliances and in vehicles. It is replacing
chlorofluorocarbons as an aerosol propellant and a refrigerant making these more envi-ronment friendly and thus reducing damage to the ozone layer. Varieties of LPG bought and sold include mixes that are primarily propane, mixes that are primarily butane, and mixes including both propane and butane, depending on the season, in winter more propane, in summer more butane. Pro-pylene and butylene are usually also present in small concentrations. A powerful odorant, ethanethiol, is added so that leaks can be easily detected.
LPG is manufactured during the refining of crude oil, or extracted from oil or gas streams as they emerge from the ground. At normal temperatures and pressures, LPG evaporates. Because of this, LPG is supplied in pressurized steel bottles. In order to allow for thermal expansion of the contained liquid, these bottles are not filled completely, usually between 80% and 85% of their total
capacity. The ratio between the volumes of the vaporized gas and the liquefied gas var-ies depending on composition, pressure and temperature, but is typically around 250:1. The pressure, at which LPG becomes liquid,
called its vapour pressure, varies likewise depending on composition and temperature. Thus it is approximately 2.2 bars for pure butane at 20°C, and approximately 22 bars for pure propane at 55°C.
LPG is heavier than air, and therefore flows along floors and tends to settle in low-lying areas, such as basements. This can cause ignition or suffocation hazards if not dealt with.
GasolineGasoline, also called petrol, is a petroleum-derived liquid mixture consisting primarily of hydrocarbons and enhanced with benzene or iso-octane to increase octane ratings. It is used as fuel in internal combustion engines. In Denmark the term “benzin” is used.
Most Commonwealth countries, with the exception of Canada, use the word “petrol” (abbreviated from petroleum spirit). The term “gasoline” is commonly used in North America where it is usually shortened in colloquial usage to “gas.” This should be distinguished from genuinely gaseous fuels used in internal combustion engines such as liquefied petroleum gas. The term mogas, short for motor gasoline distinguishes auto-mobile fuel from aviation gasoline, or avgas.
NaphthaNaphtha (aka petroleum ether) is a group of various liquid hydrocarbon intermediate refined products of varying boiling point ranges from 20 to 75°C, which may be de-rived from oil or from coal tar, and perhaps other primary sources.
Naphtha is used primarily as feedstock for producing a high-octane gasoline compo-nent via the catalytic reforming process. Naphtha is also used in the petrochemical industry for producing olefins in steam crackers and in the chemical industry for solvent (cleaning) applications. Naphtha is volatile, flammable and has a specific gravity of about 0.7. The generic name naphtha describes a range of different refinery intermediate products used in different ap-plications. To further complicate the matter, similar naphtha types are often referred to by different names.
The different naphthas are distinguished by:
100 O F F S H O R E B O O K 2 0 1 4
Transportation
Treatment
Condensateremoval
Dehydration
Refrigeration
Liquefaction
Storage &Loading
Transportation& Marketing
Mercury & H Oremoval
CO removal
Figure 13.2 - A typical LNG process

• Density (g/ml or specific gravity)• PONA, PIONA or PIANO analysis, which
measures (usually in volume % but can also be in weight %)
• Paraffin content (volume %)• Isoparaffin content (only in a PIONA
analysis)• Olefins content (volume %)• Naphthenes content (volume %)• Aromatics content (volume %)
Generally speaking, less dense, “lighter”, naphtha will have higher paraffin content. These are therefore also referred to as paraffinic naphtha. The main application for naphtha is as a feedstock in the petro-chemical production of olefins. This is also the reason they are sometimes referred to as “light distillate feedstock” or LDF (these naphtha types can also be called “straight run gasoline”/ SRG or “light virgin naphtha”/LVN).
When used as feedstock in petrochemical steam crackers, the naphtha is heated in the presence of water vapour and the absence of oxygen or air, until the hydrocarbon molecules fall apart. The primary products
of the cracking process are olefins (ethylene ethane, propylene/ propene and butadiene) and aromatics (benzene and toluene). These are used as feedstock for derivative units that produce plastics (polyethylene and polypropylene for example), synthetic fiber precursors (acrylonitrile), industrial chemi-cals (glycols for instance).
The “heavier” or rather denser types are usu-ally richer in naphthenes and aromatics and therefore also referred to as N&A’s. These can also be used in the petrochemical industry but more often are used as a feedstock for refinery catalytic reformers where they convert the lower octane naphtha to a higher octane product called reformate. Alternative names for these types are Straight Run Ben-zene (SRB) or Heavy Virgin Naphtha (HVN). Naphtha is also used in other applications such as:
• The production of petrol/motor gasoline (as an unprocessed component)
• Industrial solvents and cleaning fluids• An oil painting medium• An ingredient in shoe polish
13-2-2 Middle distillatesThe middle distillates consist of kerosene and diesel.
KeroseneKerosene is obtained from the fractional distillation of petroleum at 150°C and 275°C (carbon chains in the C12 to C15 range). Typ-ically, kerosene directly distilled from crude oil requires treatment, either in a Merox unit or a hydrotreater, to reduce its sulphur content and its corrosiveness. A hydrocrack-er being used to upgrade the parts of crude oil that would otherwise be good only for fuel oil can also produce kerosene. Kerosene was first refined in 1846 from a naturally-oc-curring asphaltum by Abraham Gesner, who thereby founded the modern petroleum industry.
At one time the fuel was widely used in kerosene lamps and lanterns. These were superseded by the electric light bulb and flashlights powered by dry cell batteries. The use of kerosene as a cooking fuel is mostly restricted to some portable stoves for backpackers and to less developed countries, where it is usually less refined and contains
impurities and even debris. The widespread availability of cheaper kerosene was the principal factor in the rapid decline of the whaling industry in the mid to late 19th cen-tury, as its main product was oil for lamps.
DieselDiesel or diesel fuel is a specific fractional distillate of fuel oil that is used as in the diesel engine invented by German engineer Rudolf Diesel. The term typically refers to fuel that has been processed from petrole-um. However there is an increasing tenden-cy to develop and adapt alternatives such as biodiesel or Biomass To Liquid (BTL) or Gas To Liquid (GTL) diesel that are not derived from petroleum.
Diesel is a hydrocarbon mixture, obtained in the fractional distillation of crude oil between 200°C and 350°C at atmospheric pressure. The density of diesel is about 850 grams per l whereas gasoline (British Eng-lish: petrol) has a density of about 720 g/L, about 15% less.
When burnt, diesel typically releases about 40.9 mega joules (MJ) per l, whereas gasoline releases 34.8 MJ/L, about 15% less. Diesel is generally simpler to refine than gasoline and often costs less. Also, due to its high level of pollutants, diesel fuel must undergo additional filtration. Diesel-powered cars generally have a better fuel economy than equivalent gasoline engines and produce less green-house gas pollution. Diesel fuel often contains higher quantities of sulphur, which must be removed as a separate pro-cess at the refinery.
Diesel is immiscible with water. Petroleum-derived diesel is composed of about 75% saturated hydrocarbons (primarily paraffins including n, iso, and cycloparaffins), and 25% aromatic hydrocarbons (including naphtha-lenes and alkylbenzenes).
13-2-3 Heavy Distillates and Residuum
The heavy distillates consist of fuel oil, lubri-cating oils, wax, tar, asphalt, and petroleum coke.
Fuel oilFuel oil is a fraction obtained from petro-leum distillation, either as a distillate or a
101O F F S H O R E B O O K 2 0 1 4
Figure 13.3 – Sewer pipes in plastic is one of many products made from refined petroleum. Courtesy: Shutterstock
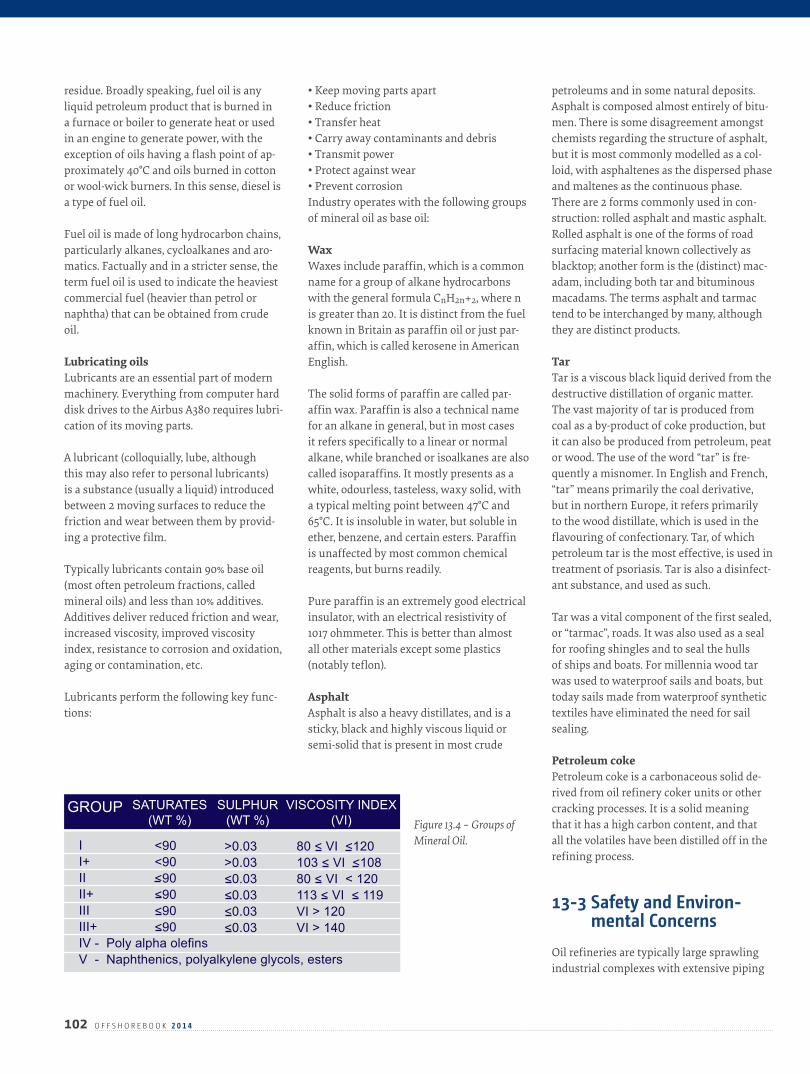
102 O F F S H O R E B O O K 2 0 1 4
residue. Broadly speaking, fuel oil is any liquid petroleum product that is burned in a furnace or boiler to generate heat or used in an engine to generate power, with the exception of oils having a flash point of ap-proximately 40°C and oils burned in cotton or wool-wick burners. In this sense, diesel is a type of fuel oil.
Fuel oil is made of long hydrocarbon chains, particularly alkanes, cycloalkanes and aro-matics. Factually and in a stricter sense, the term fuel oil is used to indicate the heaviest commercial fuel (heavier than petrol or naphtha) that can be obtained from crude oil.
Lubricating oilsLubricants are an essential part of modern machinery. Everything from computer hard disk drives to the Airbus A380 requires lubri-cation of its moving parts.
A lubricant (colloquially, lube, although this may also refer to personal lubricants) is a substance (usually a liquid) introduced between 2 moving surfaces to reduce the friction and wear between them by provid-ing a protective film.
Typically lubricants contain 90% base oil (most often petroleum fractions, called mineral oils) and less than 10% additives. Additives deliver reduced friction and wear, increased viscosity, improved viscosity index, resistance to corrosion and oxidation, aging or contamination, etc.
Lubricants perform the following key func-tions:
• Keep moving parts apart• Reduce friction• Transfer heat• Carry away contaminants and debris• Transmit power• Protect against wear• Prevent corrosionIndustry operates with the following groups of mineral oil as base oil:
WaxWaxes include paraffin, which is a common name for a group of alkane hydrocarbons with the general formula CnH2n+2, where n is greater than 20. It is distinct from the fuel known in Britain as paraffin oil or just par-affin, which is called kerosene in American English.
The solid forms of paraffin are called par-affin wax. Paraffin is also a technical name for an alkane in general, but in most cases it refers specifically to a linear or normal alkane, while branched or isoalkanes are also called isoparaffins. It mostly presents as a white, odourless, tasteless, waxy solid, with a typical melting point between 47°C and 65°C. It is insoluble in water, but soluble in ether, benzene, and certain esters. Paraffin is unaffected by most common chemical reagents, but burns readily.
Pure paraffin is an extremely good electrical insulator, with an electrical resistivity of 1017 ohmmeter. This is better than almost all other materials except some plastics (notably teflon).
AsphaltAsphalt is also a heavy distillates, and is a sticky, black and highly viscous liquid or semi-solid that is present in most crude
petroleums and in some natural deposits. Asphalt is composed almost entirely of bitu-men. There is some disagreement amongst chemists regarding the structure of asphalt, but it is most commonly modelled as a col-loid, with asphaltenes as the dispersed phase and maltenes as the continuous phase.There are 2 forms commonly used in con-struction: rolled asphalt and mastic asphalt. Rolled asphalt is one of the forms of road surfacing material known collectively as blacktop; another form is the (distinct) mac-adam, including both tar and bituminous macadams. The terms asphalt and tarmac tend to be interchanged by many, although they are distinct products.
TarTar is a viscous black liquid derived from the destructive distillation of organic matter. The vast majority of tar is produced from coal as a by-product of coke production, but it can also be produced from petroleum, peat or wood. The use of the word “tar” is fre-quently a misnomer. In English and French, “tar” means primarily the coal derivative, but in northern Europe, it refers primarily to the wood distillate, which is used in the flavouring of confectionary. Tar, of which petroleum tar is the most effective, is used in treatment of psoriasis. Tar is also a disinfect-ant substance, and used as such.
Tar was a vital component of the first sealed, or “tarmac”, roads. It was also used as a seal for roofing shingles and to seal the hulls of ships and boats. For millennia wood tar was used to waterproof sails and boats, but today sails made from waterproof synthetic textiles have eliminated the need for sail sealing.
Petroleum cokePetroleum coke is a carbonaceous solid de-rived from oil refinery coker units or other cracking processes. It is a solid meaning that it has a high carbon content, and that all the volatiles have been distilled off in the refining process.
13-3 Safety and Environ-mental Concerns
Oil refineries are typically large sprawling industrial complexes with extensive piping
II+IIII+IIIIII+IV - Poly alpha olefinsV - Naphthenics, polyalkylene glycols, esters
<90<90<90<90<90<90
>0.03>0.03<0.03<0.03<0.03<0.03
80 < VI <120103 < VI <10880 < VI < 120113 < VI < 119VI > 120VI > 140
GROUP SATURATES(WT %)
SULPHUR(WT %)
VISCOSITY INDEX (VI) Figure 13.4 – Groups of
Mineral Oil.
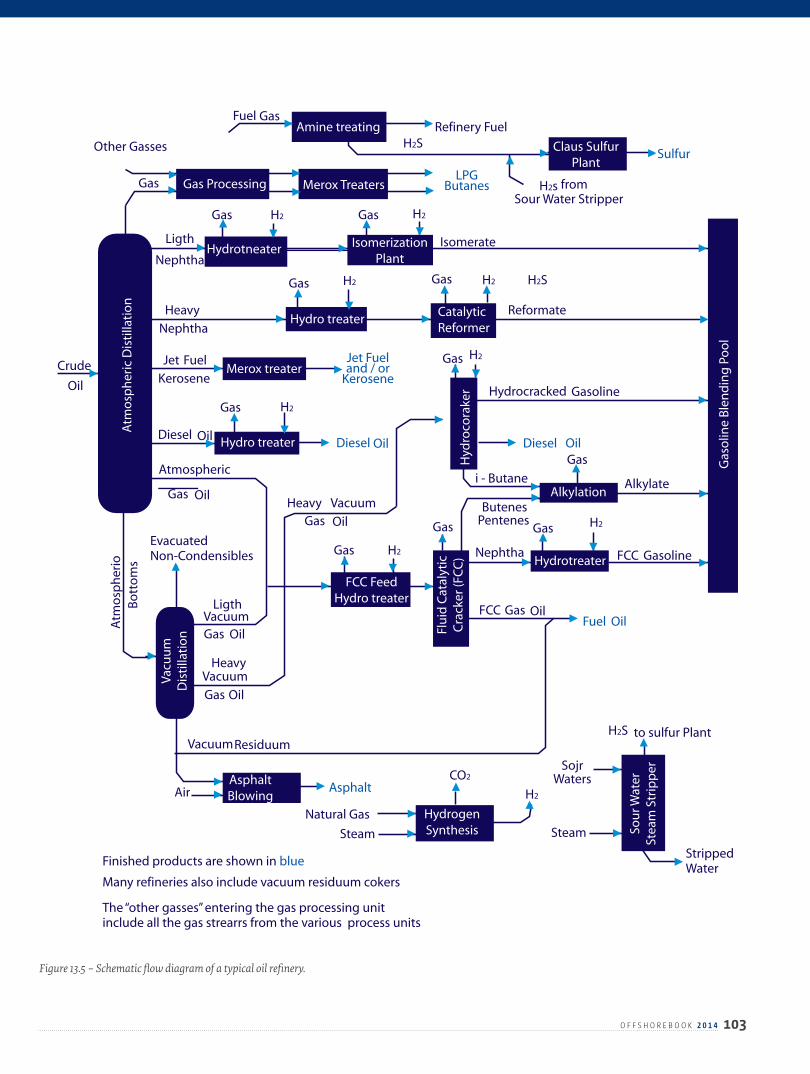
103O F F S H O R E B O O K 2 0 1 4
H2
H2 H2 H2S
H2S
H2S
H2s
H2
H2
H2
H2
H2
H2
Gas
Gas
Gas
Gas
Gas
Gas
Gas
Gas
Gas
Gas
Gas Gas
Gas
Gas
Gas
Gas
Oil
Oil
Oil
Gas Oil
Oil
Oil
Oil
Ligth
Ligth
Heavy
Heavy
Heavy
Diesel
Nephtha
Nephtha
Nephtha
Vacuum
Vacuum
Vacuum
Vacuum
Other Gasses
Refinery Fuel
Crude
Natural Gas
Steam Steam
Stripped Water
to sulfur Plant
CO2
Fuel
FCC
FCC
Gasoline
Gasoline
Alkylate
Jet
Hydrocracked
Reformate
SojrWaters
Air
i - Butane
ButenesPentenes
Isomerate
Kerosene
EvacuatedNon-Condensibles
Atm
osp
her
ioB
ott
om
sAmine treating
Claus SulfurPlant
Merox Treaters
IsomerizationPlant
Gas Processing
Hydrotneater
Hydrotreater
Hydro treater
Hydro treaterCatalyticReformer
Atm
osp
her
ic D
isti
llati
on
Gas
olin
e B
len
din
g P
oo
l
Hyd
roco
rake
r
Vacu
um
Dis
tilla
tio
n
Sou
r Wat
erSt
eam
Str
ipp
er
Flu
id C
atal
ytic
Cra
cker
(FC
C)
FCC FeedHydro treater
HydrogenSynthesis
AsphaltBlowing
Merox treater
Alkylation
Residuum
Atmospheric
Fuel
Oil Oil
Oil
DieselDiesel
Sulfur
Asphalt
Fuel
Jet Fueland / or
Kerosene
LPGButanes from
Sour Water Stripper
Finished products are shown in blue
Many refineries also include vacuum residuum cokers
The “other gasses” entering the gas processing unitinclude all the gas strearrs from the various process units
Figure 13.5 – Schematic flow diagram of a typical oil refinery.
104 O F F S H O R E B O O K 2 0 1 4
running throughout. The refining process releases a large variety of chemicals into the atmosphere with subsequent air pollution and is accompanied by a characteristic odour. In addition to air pollution there are also wastewater concerns, definite risks of fire and explosion, and both occupational and environmental noise health hazards. The sulphur content in crude oil is re-moved as a separate process as the sulphur otherwise is forming sulphurous acid in the atmosphere.
In many countries the public has demand-ed that the government place restrictions on contaminants that refineries release. Therefore most refineries have installed the equipment necessary to comply with the requirements of the pertinent environmen-tal protection regulatory agencies. Environ-mental and safety concerns mean that oil refineries are sometimes located at some distance from major urban areas.
13-3-1 Common Process Units found in a Refinery
• Desalter Unit - washes out salt from the crude oil before it goes into the atmospher-ic distillation unit
• Atmospheric Distillation Unit - distils crude oil into fractions
• Vacuum Distillation Unit - further distils residual bottoms after atmospheric distil-lation
• Naphtha Hydrotreater Unit - desulphurizes naphtha from atmospheric distillation. Naphtha must be hydrotreated before being sent to a Catalytic Reformer Unit
• Catalytic Reformer Unit - contains a cata-lyst to convert the naphtha boiling range molecules into higher octane reformate. The reformate has a higher content of aro-matics, olefins, and cyclic hydrocarbons. An important by-product of a reformer is hydrogen released during the catalyst reaction. This hydrogen is then used either in hydrotreaters and hydrocracker
• Distillate Hydrotreater Unit - desulphuriz-es distillate (e.g. diesel) after atmospheric distillation
• Fluid Catalytic Cracking (FCC) Unit - up-grades heavier fractions into lighter, more valuable products
• Hydrocracker Unit - upgrades heavier frac-tions into lighter, more valuable products.
• Coking unit - processes asphalt into petrol
and diesel fuel, leaving coke as a residual product
• Alkylation unit - produces high octane component for petrol blending
• Dimerization unit - converts olefi ns into higher-octane gasoline blending compo-nents. For example, butenes can be dimer-ized into isooctene which may subsequent-ly be hydrogenated to form isooctane
• Isomerization Unit - converts linear mol-ecules into higher octane branched mol-ecules for blending into petrol or feeding into alkylation units
• Steam reforming Unit - produces hydrogen for the hydrotreaters or hydrocracker.
• Liquefied gas storage units for propane and similar gaseous fuels at pressures suffi-cient to maintain them in the liquid form; these are usually spherical or bullet-shaped
• Storage tanks for crude oil and finished products, usually cylindrical, with some sort of vapour enclosure and surrounded by an earth berm to contain spills
• Utility units such as cooling towers for circulating cooling water, boiler plants for steam generation, and wastewater collec-tion and treating systems to make such water suitable for reuse or for disposal.
13-4 Petrochemicals Petrochemicals are chemical products made from raw materials of petroleum (hydrocar-bon) origin.
The 2 main classes of raw materials are ole-fins, including ethylene and propylene, and aromatics, including benzene and xylene isomers, both of which are produced in very large quantities, mainly by steam cracking and catalytic reforming of refinery hydro-carbons. A very wide range of raw materials used in industry (plastics, resins, fibre, solvents, detergents, etc.) is made from these basic building blocks.
The annual world production of ethylene is 110 million t, of propylene 65 million t and of aromatic raw materials 70 million t. The largest petrochemical industries are found in Western Europe and the USA, though ma-jor growth in new production capacity is to be found in the Middle East and Asia. There is a substantial inter-regional trade in petro-chemicals of all kinds. From chewing gum to
training shoes, from lipstick to throw-away bags, oil is everywhere in our daily life and results from the transformation achieved by the alchemists of modern times, the petrole-um chemists.
The Petrochemical Industry and plastic products in particular are sometimes criti-cized, but without their colours, which liven up our favourite objects like our CDs and DVDs, our snowboarding anorak, we would live almost in black and white! Indeed, the products derived from oil produced by the petroleum chemistry are numerous and varied. They contribute to our comfort, our pleasure and our safety. For people born after 1960, these products represent so much in our everyday lives that we cannot imagine living without them.
Old people will be able to tell you that as young children and adolescents they grew up without knowing polyester sportswear, training shoes, plastic bags which are so practical, and even the outer casings of mobile phones, scooters, televisions and computers. Hard to believe? However, facts speak for themselves. In 1950, consumer products resulting from the petroleum industry reached only 3 million t worldwide, half of which were plastic products. In 2000, 192 million t were produced of which 140 million t were plastics.
Petrochemical PlantsIn a petrochemical Plant the feedstock (generally natural gas or petroleum liquids) is converted into fertilizers, and/or other intermediate and final products such as ole-fins, adhesives, detergents, solvents, rubber and elastomers, films and fibre, polymers and resins, etc.
Petrochemical plants show an infinite variety of configurations depending on the products being produced. The main catego-ries are:
• Ethylene Plants: Ethylene is produced via steam cracking of natural gas or light liquid hydrocarbons. It is one of the main components of the resulting cracked gas mixture and is separated by repeated com-pression and distillation
• Fertiliser Plants: A reforming process converts the feedstock into a raw syngas
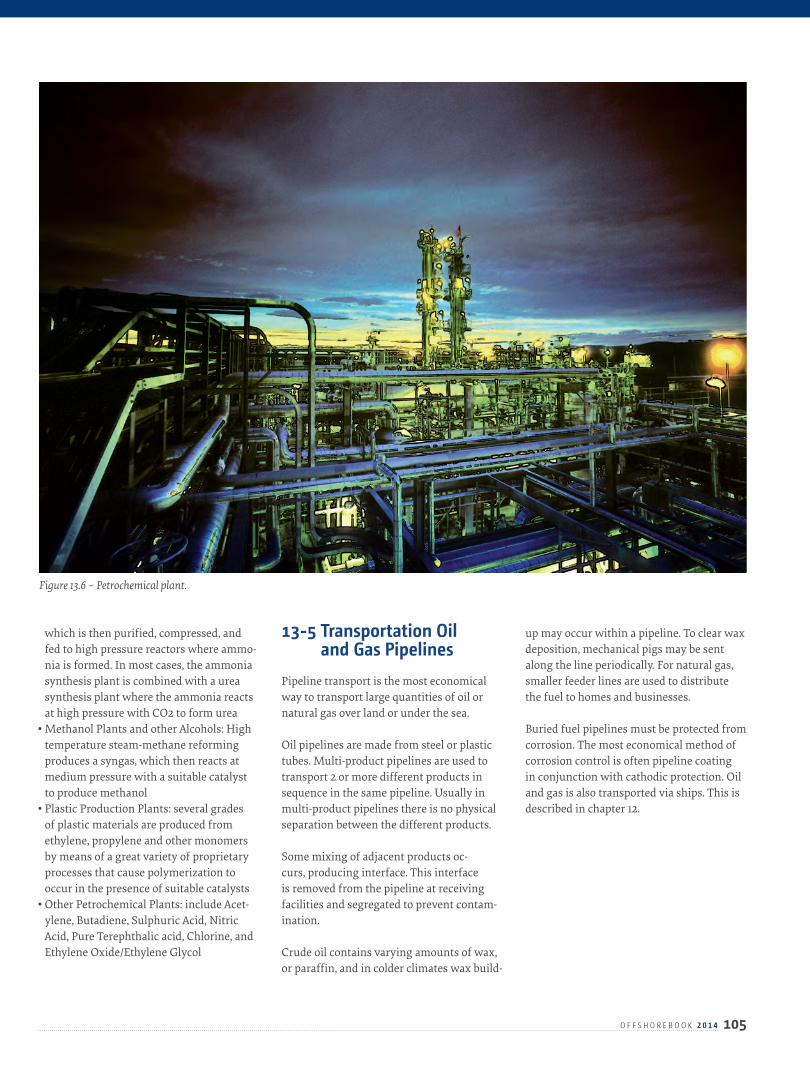
105O F F S H O R E B O O K 2 0 1 4
which is then purified, compressed, and fed to high pressure reactors where ammo-nia is formed. In most cases, the ammonia synthesis plant is combined with a urea synthesis plant where the ammonia reacts at high pressure with CO2 to form urea
• Methanol Plants and other Alcohols: High temperature steam-methane reforming produces a syngas, which then reacts at medium pressure with a suitable catalyst to produce methanol
• Plastic Production Plants: several grades of plastic materials are produced from ethylene, propylene and other monomers by means of a great variety of proprietary processes that cause polymerization to occur in the presence of suitable catalysts
• Other Petrochemical Plants: include Acet-ylene, Butadiene, Sulphuric Acid, Nitric Acid, Pure Terephthalic acid, Chlorine, and Ethylene Oxide/Ethylene Glycol
13-5 Transportation Oil and Gas Pipelines
Pipeline transport is the most economical way to transport large quantities of oil or natural gas over land or under the sea.
Oil pipelines are made from steel or plastic tubes. Multi-product pipelines are used to transport 2 or more different products in sequence in the same pipeline. Usually in multi-product pipelines there is no physical separation between the different products.
Some mixing of adjacent products oc-curs, producing interface. This interface is removed from the pipeline at receiving facilities and segregated to prevent contam-ination.
Crude oil contains varying amounts of wax, or paraffin, and in colder climates wax build-
up may occur within a pipeline. To clear wax deposition, mechanical pigs may be sent along the line periodically. For natural gas, smaller feeder lines are used to distribute the fuel to homes and businesses.
Buried fuel pipelines must be protected from corrosion. The most economical method of corrosion control is often pipeline coating in conjunction with cathodic protection. Oil and gas is also transported via ships. This is described in chapter 12.
Figure 13.6 – Petrochemical plant.
14C H A P T E R

107O F F S H O R E B O O K 2 0 1 4
14-1 Overview
The number of employees in the Danish offshore industry has increased steadily over the last years. In 2012 approximately 27.000 were engaged within offshore, of which 15.700 were engaged within offshore oil and gas, and the number is still growing.
According analyses performed by Region Syddanmark the number of employees will almost double by 2020. In order to ensure the industry’s demands for quality and effectiveness, employees within the offshore oil and gas sector need the proper form of education and training. Offshore education is divided into 4 main areas:
• Safety training• Vocational training for skilled workers• Master and bachelor degrees for engineers• Basic courses for blue-collar workers
With more than 40 years of experience from offshore projects, Danish educational insti-tutions and offshore companies have a long tradition for educating people working on offshore projects. Representatives are:
• Several institutions offering safety training for offshore oil/gas workers, offshore wind workers as well as employees in other areas of the maritime sector
• 2 universities offering master and bachelor modules in a range of offshore relevant courses as well as carrying out research to ensure development of new knowledge
• 3 major schools offering vocational train-ing for skilled workers in offshore relevant areas
• A wide range of private companies provid-ing courses at many levels for their current and/or future employees
• Several private companies offering differ-ent offshore relevant education modules aimed primarily at personnel employed by other companies
• Several technical schools offering different
offshore relevant courses for blue collar workers
Figure 14.1 gives an overview of different levels of education and training.
In order to make the significant educational and career possibilities visible for students and persons who wish to make a career change a new advisory centre has been established in Esbjerg.
Danish Offshore Academy has been estab-lished on initiative of offshore companies, providers of education and training as well as organisations in Esbjerg.
The purpose is to attract qualified manpower to the offshore companies in Esbjerg and to attract students and course participants to the educational opportunities within the offshore industry in the town.
Danish Offshore Academy does not recruit employees but informs about and markets the industry to attract employees/applicants for education/training and companies in that way. Read more at www.danishoffsho-reacademy.dk.
EDUCATION AND TRAINING IN DENMARK
Offshore specific education and training in Denmark
Figure 14.1 –Please note: The table is not complete; it only gives a general overview. Other education and training centers offer a wide range of degrees and courses.
Universities - masters and bachelors
Aalborg University University of Southern Denmark Technical University of Denmark –DTU Aarhus University Copenhagen University
Vocational training AMU-Vest Business Academy Southwest/EASV EUC Vest FORCE Technology Fredericia Maskinmesterskole GEUS Martec Simac Aarhus Maskinmesterskole
Safety training ARBEJDSMILJØEksperten Esbjerg Safety Consult Falck Safety Services Maersk Training Rescue Center Denmark ResQ
Introduction courses Offshoreenergy.dk


![[4] ptk 2014 2015 offshore constructions](https://static.fdocuments.in/doc/165x107/559efa9f1a28abcc768b47ec/4-ptk-2014-2015-offshore-constructions.jpg)


