Offset Waveguide Transmission Measurements - …mln/ltrs-pdfs/NASA-97-tm110341.pdf · NASA...
14
NASA Technical Memorandum 110341 Offset Waveguide Transmission Measurements Robin L. Cravey Langley Research Center, Hampton, Virginia May 1997 National Aeronautics and Space Administration Langley Research Center Hampton, Virginia 23681-0001
Transcript of Offset Waveguide Transmission Measurements - …mln/ltrs-pdfs/NASA-97-tm110341.pdf · NASA...

NASA Technical Memorandum 110341
Offset Waveguide Transmission Measurements
Robin L. CraveyLangley Research Center, Hampton, Virginia
May 1997
National Aeronautics andSpace AdministrationLangley Research CenterHampton, Virginia 23681-0001

1
Abstract
Transmission loss measurements in S-band waveguide due to waveguide section mis-
alignment have been performed in the Electromagnetic Properties Measurement Labora-
tory in NASA Langley’s Electromagnetics Research Branch. These measurements were
performed in support of the Hydrostar program, to determine the feasibility of using
deployable waveguide sections in a large space radiometer. Low losses are essential for
radiometer applications; these measurements were conducted in order to determine
what misalignment tolerances were acceptable for such a deployable structure.
2
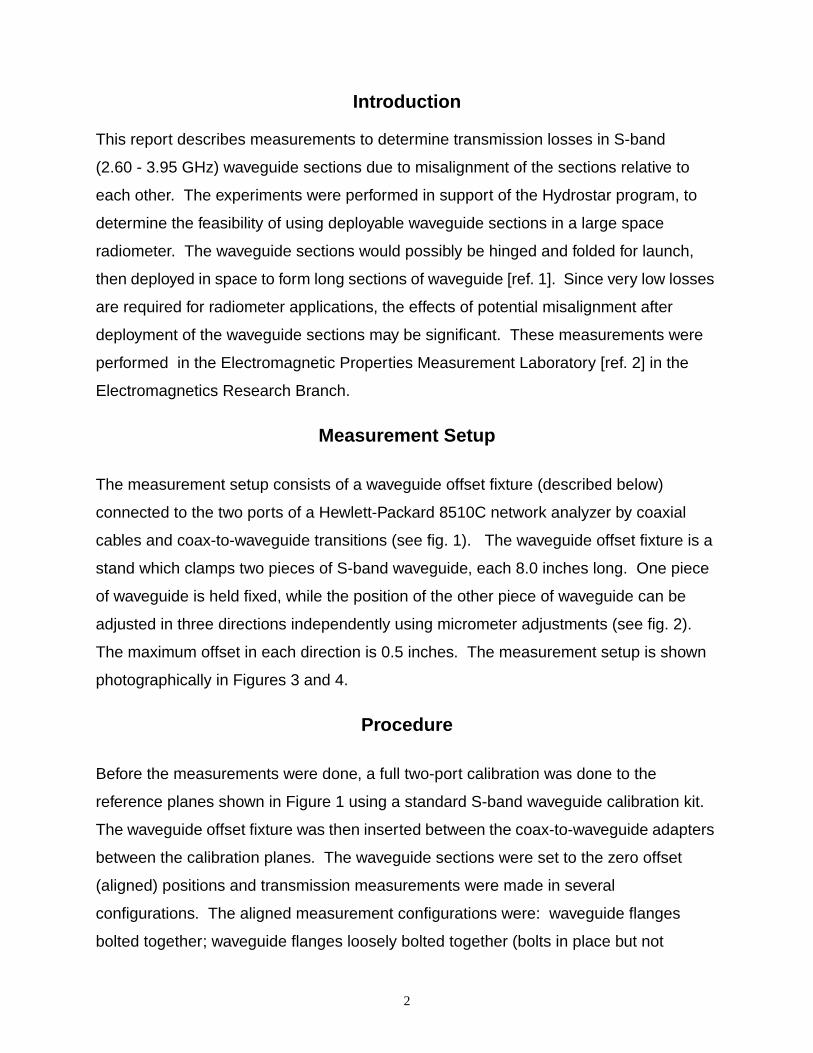
Introduction
This report describes measurements to determine transmission losses in S-band
(2.60 - 3.95 GHz) waveguide sections due to misalignment of the sections relative to
each other. The experiments were performed in support of the Hydrostar program, to
determine the feasibility of using deployable waveguide sections in a large space
radiometer. The waveguide sections would possibly be hinged and folded for launch,
then deployed in space to form long sections of waveguide [ref. 1]. Since very low losses
are required for radiometer applications, the effects of potential misalignment after
deployment of the waveguide sections may be significant. These measurements were
performed in the Electromagnetic Properties Measurement Laboratory [ref. 2] in the
Electromagnetics Research Branch.
Measurement Setup
The measurement setup consists of a waveguide offset fixture (described below)
connected to the two ports of a Hewlett-Packard 8510C network analyzer by coaxial
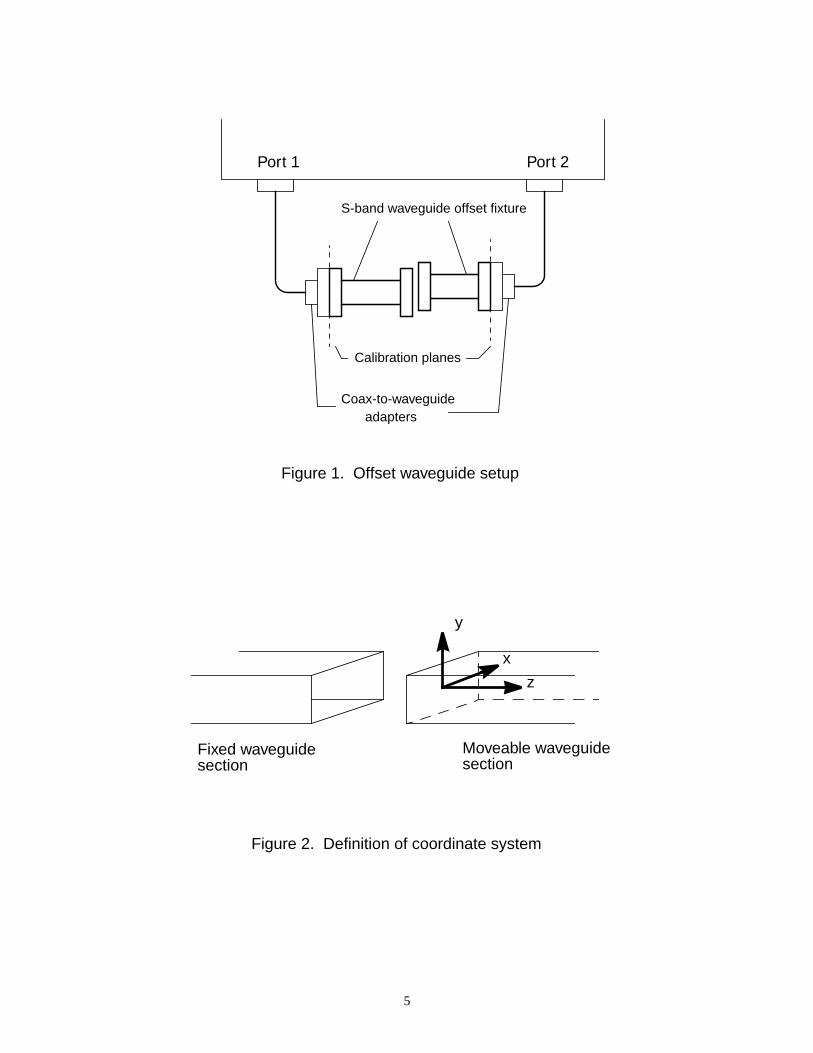
cables and coax-to-waveguide transitions (see fig. 1). The waveguide offset fixture is a
stand which clamps two pieces of S-band waveguide, each 8.0 inches long. One piece
of waveguide is held fixed, while the position of the other piece of waveguide can be
adjusted in three directions independently using micrometer adjustments (see fig. 2).
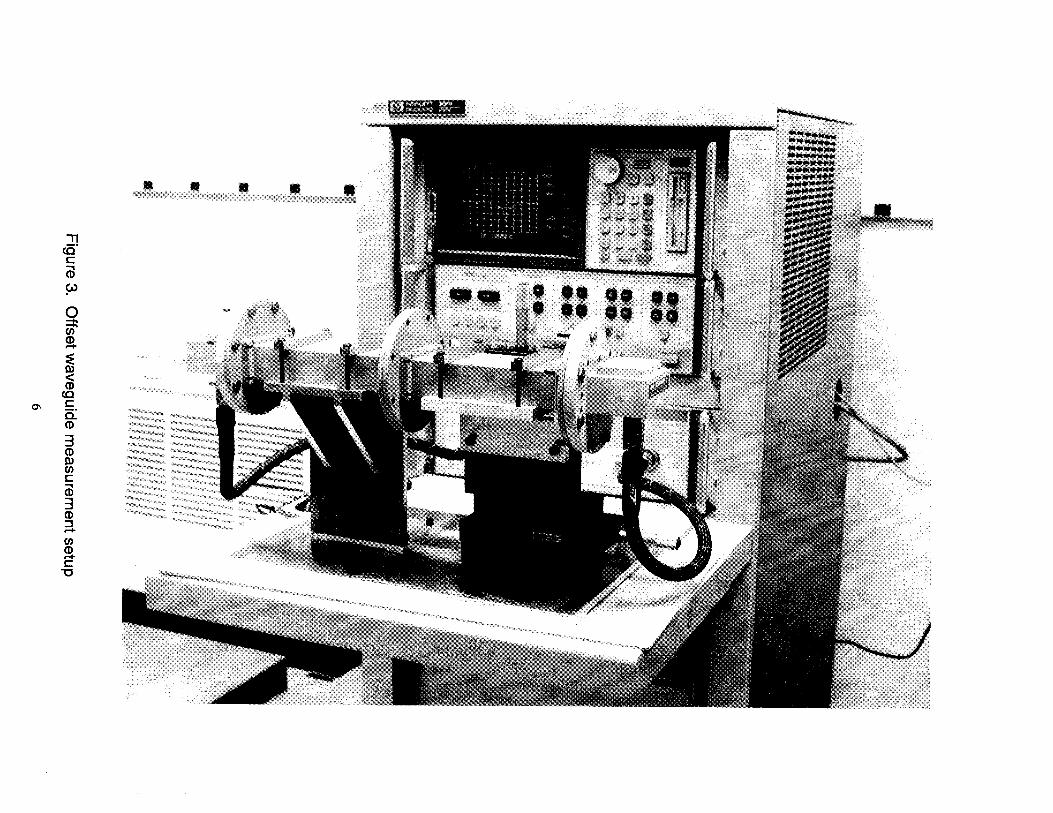
The maximum offset in each direction is 0.5 inches. The measurement setup is shown
photographically in Figures 3 and 4.
Procedure
Before the measurements were done, a full two-port calibration was done to the
reference planes shown in Figure 1 using a standard S-band waveguide calibration kit.
The waveguide offset fixture was then inserted between the coax-to-waveguide adapters
between the calibration planes. The waveguide sections were set to the zero offset
(aligned) positions and transmission measurements were made in several
configurations. The aligned measurement configurations were: waveguide flanges
bolted together; waveguide flanges loosely bolted together (bolts in place but not
3
tightened); waveguide flanges not bolted but clamped together with C-clamps at top and
bottom of flanges; and, waveguide flanges not bolted or clamped. The moveable
waveguide section was then displaced relative to the fixed section along one axis at a
time in increments of 0.025”, with S-parameter data (reflection and transmission
coefficients) being recorded at each increment (see fig. 2 for a definition of the axes).
For the x- and y-offset data, two data files were recorded for each position: one in which
the flanges were clamped together at top and bottom using C-clamps, and another in
which the flanges were held together only by the spring tension in the fixture. Results
were also recorded for cases in which the x- and y-axes were offset equal amounts for
zero z-offset, and also for cases in which the x-, y-, and z-axes were all offset equal
amounts.
Results
The amount of data which was taken in this study precludes plotting all the data in this
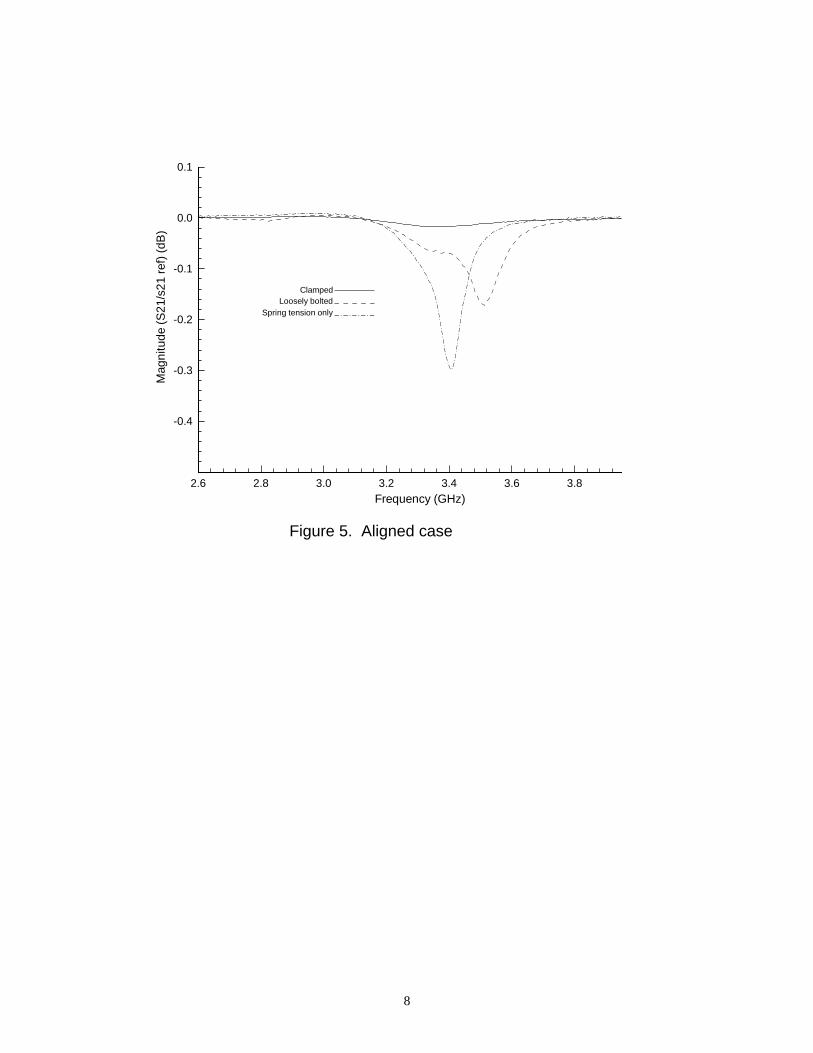
report, so a representative sample has been chosen. The first plot (fig. 5) shows the
transmission coefficient (S21) for various aligned cases. This plot is included in order to
demonstrate the transmission loss which occurs when the flanges of the waveguide
sections are not bolted tightly together, even though they are aligned. The transmission
coefficients given in this plot have been normalized to the transmission coefficient for the
tightly bolted case in order to remove any effects from the connections between the
coax-to-waveguide adapters and the waveguide sections (at the reference planes). It
can be noted from this plot that the case in which the flanges were clamped together
instead of tightly bolted resulted in only a small reduction in the transmission through the
waveguide sections. This clamped, aligned case is used as the reference case for all the
other plots shown here. The x- and y-offset cases which are shown are the
measurements which were performed with the flanges clamped together. This is in order
to eliminate leakage which could occur if the flanges are not tightly in contact with each
other, so that the reductions in transmission should be due only to the misalignment.
Obviously, for the waveguide sections offset in the z-direction relative to each other, the
flanges could not be clamped together.

4
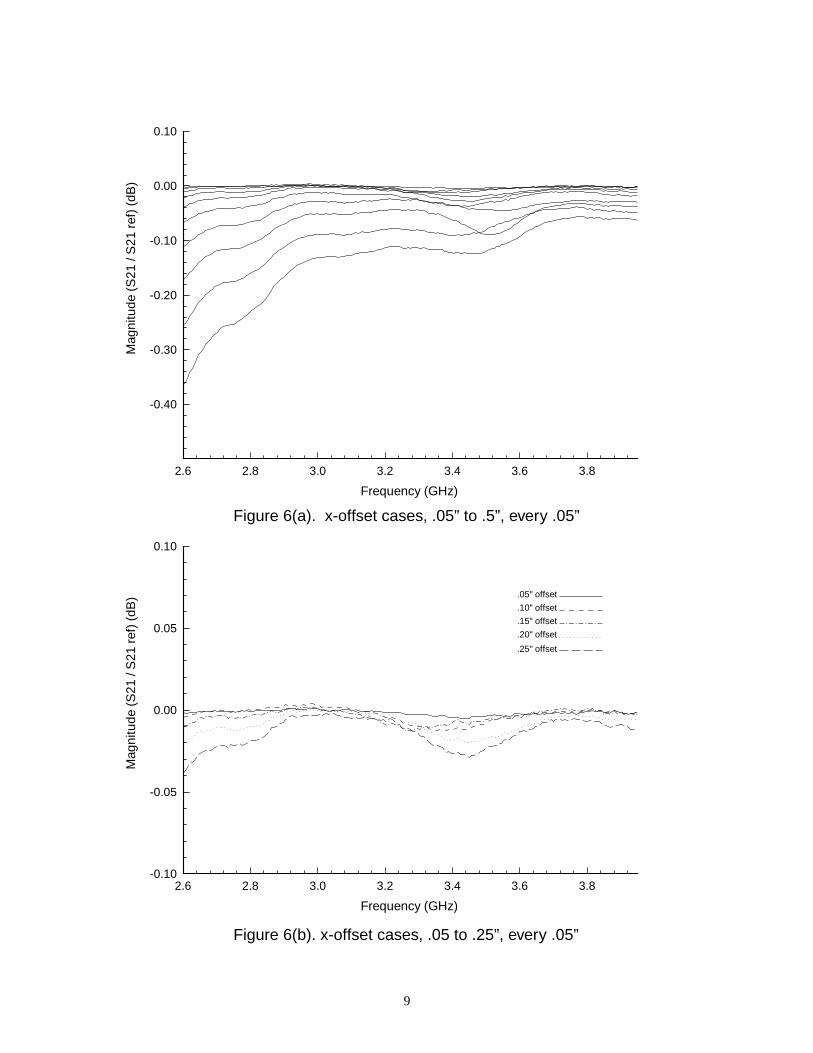
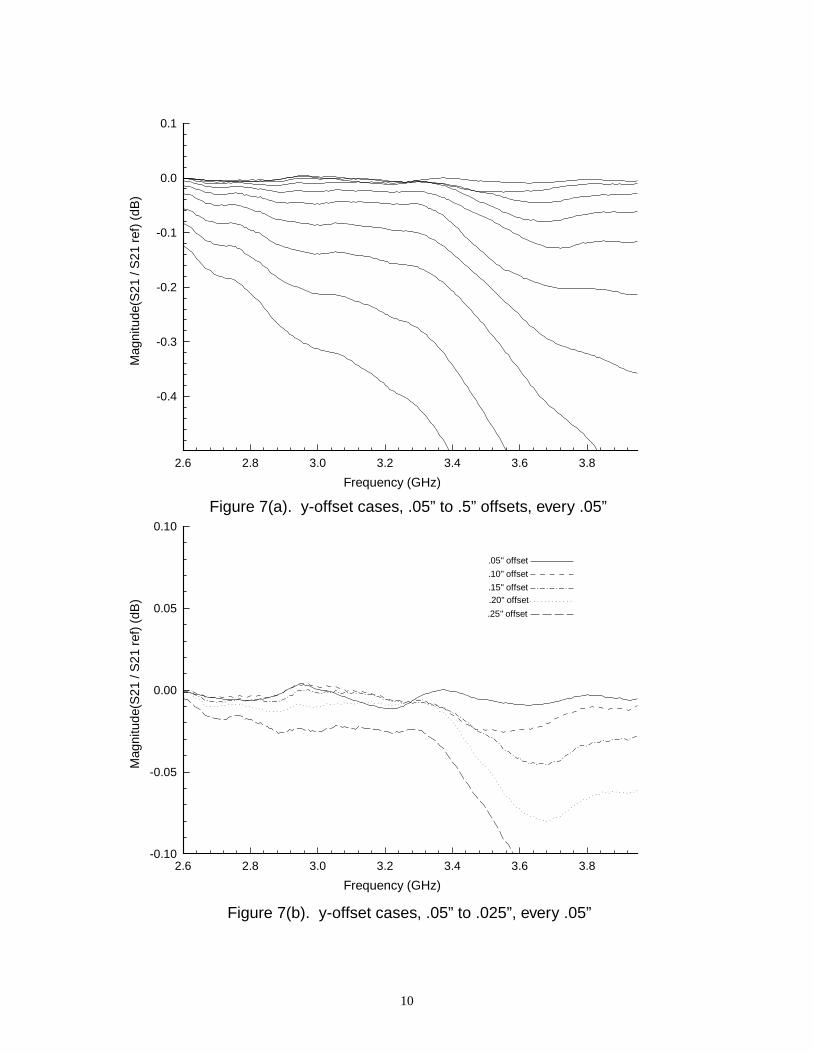
Figures 6 and 7 show the normalized transmission coefficients for the cases when the
waveguide sections are misaligned in the x- and y-directions, respectively. Figure 8
shows the normalized transmission coefficients for simultaneous, equal offsets in the x-
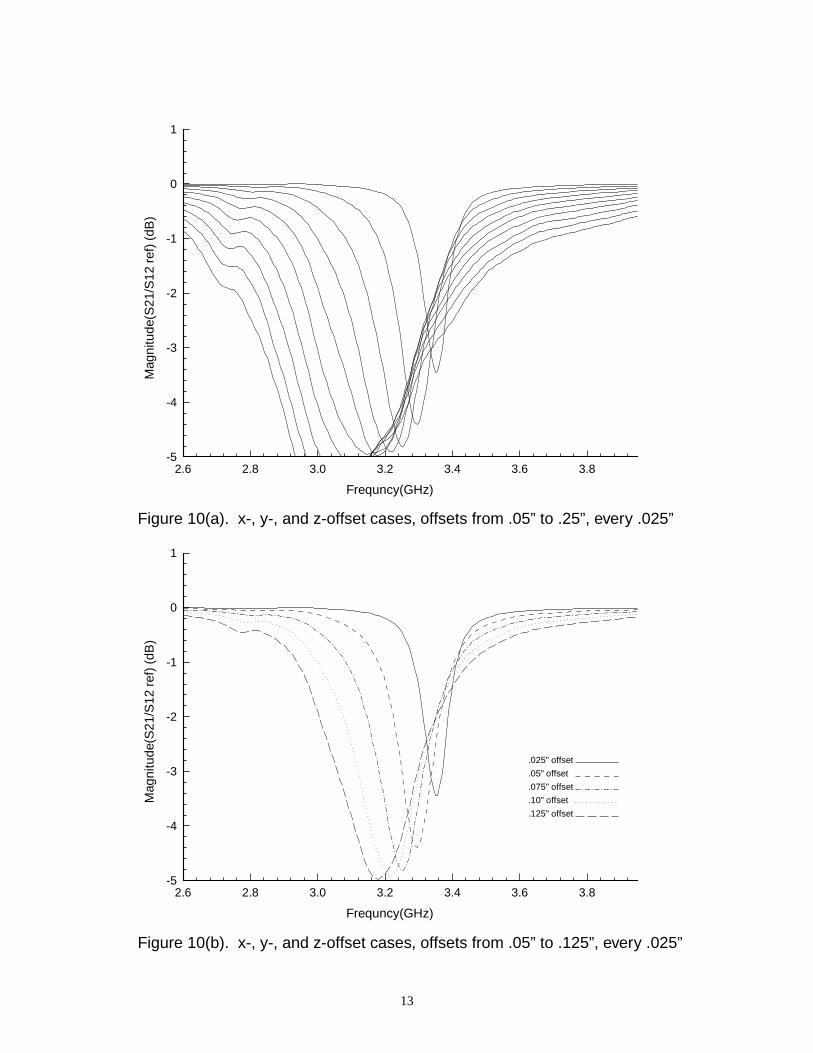
and y-directions. Figure 9 gives results for offsets in the z-directions. Figure 10 gives
results for simultaneous, equal offsets in x-, y-, and z-directions. For each of these
cases, two plots are shown: the first is a plot including a larger range in the offset to
show the overall trend of the reduction in transmission due to the offset; the second is a
plot showing the first few offset cases on an expanded scale for more detail.
Conclusions
This study has demonstrated the measured reduction in transmission through waveguide
sections which are misaligned in various directions. For x-offsets alone, the transmission
reductions are seen to be less than 0.05 dB for offsets up to 0.25 inches. For y-offsets
alone, transmission reductions of up to about 0.1 dB are observed for offsets up to 0.25
inches. For both x- and y-offsets, the transmission reductions are seen to be less than
0.05 dB for offsets up to 0.25 inches, and in fact for some frequencies a tuning effect
seems to be occurring, as the normalized transmission coefficient is greater than 0 dB.
For the cases which involve z-offsets, quite large transmission losses are observed,
especially over a narrow frequency range whose center frequency decreases as the gap
in the z-direction is increased.
References
[1]. Schroeder, Bailey, Harrington, Kendall, and Campbell, “Design Studies of Large
Aperture, High-Resolution Earth Science Microwave Radiometers Compatible With
Small Launch Vehicles”, NASA Technical Paper 3469, September 1994.
[2]. Cravey, Tiemsin, Bussell, Dudley, “Dielectric Property Measurements in the
Electromagnetic Properties Measurement Laboratory”, NASA Technical Memorandum
#110147, April 1995.
5
Port 1 Port 2
Coax-to-waveguideadapters
S-band waveguide offset fixture
Calibration planes
Figure 1. Offset waveguide setup
y
x
z
Fixed waveguidesection
Moveable waveguidesection
Figure 2. Definition of coordinate system

8
2.6 2.8 3.0 3.2 3.4 3.6 3.8
-0.4
-0.3
-0.2
-0.1
0.0
0.1
ClampedLoosely bolted
Spring tension only
Frequency (GHz)
Mag
nitu
de (
S21
/s21
ref
) (d
B)
Figure 5. Aligned case
9
2.6 2.8 3.0 3.2 3.4 3.6 3.8
-0.40
-0.30
-0.20
-0.10
0.00
0.10
Frequency (GHz)
Mag
nitu
de (
S21
/ S
21 r
ef)
(dB
)
Figure 6(a). x-offset cases, .05” to .5”, every .05”
2.6 2.8 3.0 3.2 3.4 3.6 3.8-0.10
-0.05
0.00
0.05
0.10
Frequency (GHz)
Mag
nitu
de (
S21
/ S
21 r
ef)
(dB
) .05" offset
.10" offset
.15" offset
.20" offset
.25" offset
Figure 6(b). x-offset cases, .05 to .25”, every .05”
10
2.6 2.8 3.0 3.2 3.4 3.6 3.8
-0.4
-0.3
-0.2
-0.1
0.0
0.1
Frequency (GHz)
Mag
nitu
de(S
21 /
S21
ref
) (d
B)
Figure 7(a). y-offset cases, .05” to .5” offsets, every .05”
2.6 2.8 3.0 3.2 3.4 3.6 3.8-0.10
-0.05
0.00
0.05
0.10
Frequency (GHz)
Mag
nitu
de(S
21 /
S21
ref
) (d
B)
.05" offset
.10" offset
.15" offset.20" offset
.25" offset
Figure 7(b). y-offset cases, .05” to .025”, every .05”

11
2.6 2.8 3.0 3.2 3.4 3.6 3.8
-0.4
-0.3
-0.2
-0.1
0.0
0.1
Frequency (GHz)
Mag
nitu
de (
S21
/ S
21 r
ef)
(dB
)
Figure 8(a). x- and y-offset cases, offsets from .05” to .5”, every .05”
2.6 2.8 3.0 3.2 3.4 3.6 3.8-0.10
-0.05
0.00
0.05
0.10
Frequency (GHz)
Mag
nitu
de (
S21
/ S
21 r
ef)
(dB
)
.05" offset
.10" offset
.15" offset
.20" offset
.25" offset
Figure 8(b). x- and y-offset cases, offsets from .05” to .25”, every .05”

12
2.6 2.8 3.0 3.2 3.4 3.6 3.8-5
-4
-3
-2
-1
0
1
Frequency (GHz)
Mag
nitu
de(S
21 /
S21
ref
) (d
B)
Figure 9(a). z-offset cases, .05” to .25” offsets, every .025”
2.6 2.8 3.0 3.2 3.4 3.6 3.8-5
-4
-3
-2
-1
0
1
Frequency (GHz)
Mag
nitu
de(S
21 /
S21
ref
) (d
B)
.025" offset
.05" offset
.075" offset
.10" offset
.125" offset
Figure 9(b). z-offset cases, .05” to .125” offsets, every .025”
13
2.6 2.8 3.0 3.2 3.4 3.6 3.8-5
-4
-3
-2
-1
0
1
Frequncy(GHz)
Mag
nitu
de(S
21/S
12 r
ef)
(dB
)
Figure 10(a). x-, y-, and z-offset cases, offsets from .05” to .25”, every .025”
2.6 2.8 3.0 3.2 3.4 3.6 3.8-5
-4
-3
-2
-1
0
1
Frequncy(GHz)
Mag
nitu
de(S
21/S
12 r
ef)
(dB
)
.025" offset
.05" offset
.075" offset
.10" offset
.125" offset
Figure 10(b). x-, y-, and z-offset cases, offsets from .05” to .125”, every .025”