0378 NOV...Title 0378 NOV.pdf Author bszerlet Created Date 1/9/2021 12:35:16 PM

Official Journal ISSN 0378-6986
c 174
of the European Communities Volume 23
14 July 1980
English edition Information and Notices
Contents I Information
Commission
The Community coal market in 1979 and forecasts for 1980 ................. .
. '-.... .....
2

14. 7. 80 Official Journal of the European Communities No C 174/1
I
(Information)
COMMISSION
CONTENTS
The Community coal market in 1979 and forecasts for 1980 ................. .
I. Summary survey 3
I. The coal market in 1979 . . . . . . . . . . . . . . . . . . . . . . . . . . . . . . . . . . . . . . . . . . . . . 3
2. The coal market outlook for 1980 . . . . . . . . . . . . . . . . . . . . . . . . . . . . . . . . . . . . . 4
II. General economic situation and outlook . . . . . . . . . . . . . . . . . . . . . . . . . . . . . . . . . . . . . 5
III. Coal demand by sectors . . . . . . . . . . . . . . . . . . . . . . . . . . . . . . . . . . . . . . . . . . . . . . . . . . . 5
I. Steel industry . . . . . . . . . . . . . . . . . . . . . . . . . . . . . . . . . . . . . . . . . . . . . . . . . . . . . . 5
2. Power stations .................. ·. . . . . . . . . . . . . . . . . . . . . . . . . . . . . . . . . . . 6
3. Various industries . . . . . . . . . . . . . . . . . . . . . . . . . . . . . . . . . . . . . . . . . . . . . . . . . . 7
4. Domestic sector . . . . . . . . . . . . . . . . . . . . . . . . . . . . . . . . . . . . . . . . . . . . . . . . . . . . 7
IV. Community coal production . . . . . . . . . . . . . . . . . . . . . . . . . . . . . . . . . . . . . . . . . . . . . . . 8
I. Production statistics . . . . . . . . . . . . . . . . . . . . . . . . . . . . . . . . . . . . . . . . . . . . . . . . 8
(a) Quantitative analysis of output . . . . . . . . . . . . . . . . . . . . . . . . . . . . . . . . . . . . 8 (b) Manpower and productivity . . . . . . . . . . . . . . . . . . . . . . . . . . . . . . . . . . . . . . 8
2. Financial developments . . . . . . . . . . . . . . . . . . . . . . . . . . . . . . . . . . . . . . . . . . . . . 9 (a) Production costs and proceeds . . . . . . . . . . . . . . . . . . . . . . . . . . . . . . . . . . . . 9
(b) Financial intervention by Member States . . . . . . . . . . . . . . . . . . . . . . . . . . . 9
3. Developments in productive capacity . . . . . . . . . . . . . . . . . . . . . . . . . . . . . . . . . 9
(a) Investments in coal production and preparation . . . . . . . . . . . . . . . . . . . . . 9 (b) Pit closures . . . . . . . . . . . . . . . . . . . . . . . . . . . . . . . . . . . . . . . . . . . . . . . . . . . . . 9
V. Coal prices . . . . . . . . . . . . . . . . . . . . . . . . . . . . . . . . . . . . . . . . . . . . . . . . . . . . . . . . . . . . . . 10
I. List price developments . . . . . . . . . . . . . . . . . . . . . . . . . . . . . . . . . . . . . . . . . . . . . I 0
2. Coking coal . . . . . . . . . . . . . . . . . . . . . . . . . . . . . . . . . . . . . . . . . . . . . . . . . . . . . . . 10
3. Steam coal . . . . . . . . . . . . . . . . . . . . . . . . . . . . . . . . . . . . . . . . . . . . . . . . . . . . . . . . II
4. Outlook for 1980 . . . . . . . . . . . . . . . . . . . . . . . . . . . . . . . . . . . . . . . . . . . . . . . . . . . II

No C 174/2 Official Journal of the European Communities 14. 7. 80
VI. Coke II
I. Developments in coking capacity . . . . . . . . . . . . . . . . . . . . . . . . . . . . . . . . . . . . . II
2. Coke production and coke supplies to cokeries . . . . . . . . . . . . . . . . . . . . . . . . . 12
VII. Trade in coal and coke . . . . . . . . . . . . . . . . . . . . . . . . . . . . . . . . . . . . . . . . . . . . . . . . . . . . 12
I. Intra-Community trade . . . . . . . . . . . . . . . . . . . . . . . . . . . . . . . . . . . . . . . . . . . . . 12
2. Trade with third countries . . . . . . . . . . . . . . . . . . . . . . . . . . . . . . . . . . . . . . . . . . . 13
VIII. Coal and coke stocks . . . . . . . . . . . . . . . . . . . . . . . . . . . . . . . . . . . . . . . . . . . . . . . . . . . . . 14
I. Producers' coal and coke stocks . . . . . . . . . . . . . . . . . . . . . . . . . . . . . . . . . . . . . . 14
2. Coal stocks at power stations . . . . . . . . . . . . . . . . . . . . . . . . . . . . . . . . . . . . . . . . 15
IX. Tables ................................................................. . 16

14. 7. 80 Official Journal of the European Communities No C 174/3
THE COMMUNITY COAL MARKET IN 1979 AND FORECASTS FOR 1980
I. SUMMARY SURVEY
1. The coal market in 1979
Developments in the Community's coal market in 1979 give reasons for guarded optimism. Coal consumption rose substantially, there was a marginal increase in coal production in the Community, no serious problems were encountered with regard to steeply rising imports from outside the Community, consumer stocks at the end of the year were at satisfactory levels while previously excessive producers' stocks of coke and coal had been substantially reduced. There were clear signs of an evolving pattern of the principal coal producing Member States absorbing the bulk of their own production to satisfy their requirements, while growing demand for coal in the other Member States is met through rising imports from outside the Community.
As shown in Table I, internal demand for energy in the Community in 1979 is estimated to have been about 41 232 Petajoules (985 mtoe) (million tonnes of oil equivalent), representing a rise of 5 · 0 % on 1978. This increase was a reflection of economic growth represented by a rise in GOP of 3 · 3 %, slightly above that in 1978. However, had it not been for an unusually long period of cold weather during the early part of the year, the growth in energy demand would probably have been at a slightly lower rate than that of GOP (gross domestic product).
According to statistics available to date, the percentage share of oil in meeting internal energy demand in 1979 at 53·3% was 1·2% lower than in 1978 for the Community as a whole, although in Italy and the Netherlands the trend was the reverse, in the latter case oil compensating a drop in the share of natural gas. The percentage share of coal was 0· 7 %' higher at 19·4 %, while that of lignite at 2·8 %was 0·1lower than the previous year (2·9 %).
Coal consumption in the Community (Table 3) in 1979 at about 308 million tonnes was nearly 21 million tonnes higher than in 1978. The principal motor behind this expansion was demand for electricity generation, up by about 17 · 5 million tonnes on the previous year, but improved performance by the steel industry also played a part. Consumption by other sectors totalling a little over 41 million tonnes was slightly lower than in 1978.
1979 saw a substantial improvement in levels of output of both pig iron and crude steel, continuing in the wake of the improvement of the year before. However, even at 140 million tonnes in 1979, crude steel production in 1979 was still some l 0 % short of its level in 1974, the peak year of the decade. On the other hand, for complex reasons explained in therelevant section in this report, the increase of 5 · 6 % in steel output in 1979 was reflected in a I 0 · 8 % rise in coke consumption.
Gross electricity production in all Member States in 1979 was substantially above the level of the year before, the average rise having been 4 · 9 %. Coal consumpti:m rose to an unprecedented 178 million tonnes, with the United Kingdom registering by far the biggest growth but with notable increases also in Denmark, Germany and France. However, these rises did little to narrow the differences in coal consumption for electricity generation between different Memb·~r States; about 77 % of all hard coal used in power stations was burned in the United Kingdom and Germany, representing only a marginal reduction in their traditional preponderance. With lignite taken into account, this preponderance is even more marked.
The upward trend of coal consumption by general industry has been masked by industrial problems in the cement industry in one Member State giving rise to a slight overall drop. In effect, this is an expanding market with a growth potential over the coming years second only to that of electricity generation.
Coal consumption by the domestic heating market was about the same as last year. However, it might have been slightly higher had there not been supply difficulties for certain special qualities.
For the third year in succession, Community coal production in 1979 was within I % of 240 million tonnes (148 mtoe), but showing a slight upward trend for the first time since 1975. Planned closures of uneconomic pits in Belgium and France were compensated by increased output in Germany.

No C 174/4 Official Journal of the European Communities 14. 7. 80
Underground manpower dropped slightly in 1979 but productivity rose sufficently not to entail a drop in total output in the Community. Production costs rose roughly in line with inflation except in Germany where the increase was slightly lower. However, in spite of steeply rising oil prices, receipts by the Community's coal industry rose more slowly than costs.
Investment in coal production and preparation in 1979 continued at high levels in the United Kingdom and in Germany, particularly in the former.
Intra-Community exchanges of coal and coke have witnessed divergent developments, the former dropping while the latter rose. The principal reasons for these countervailing movements were rising demand for coke by the steel industry and changing sales policies by the German coal industry due to shrinking surplus stocks of coal.
Coal imports from outside the Community rose by some 29 % to about 58 million tonnes in 1979. Of these, about 30 million tonnes went to power stations and close on 24 million tonnes were coking coal. Poland has lost its leading position as the largest external supplier to the Community to South Africa, followed by the USA and Australia in third and fourth places, with deliveries from all other sources representing less than 8 %.
Exports of Community coal at about 1 · 8 million tonnes last year showed a serious drop compared to 1978, but coke exports of some 8 · 5 million tonnes represented a 12% increase, with the US remaining the largest market. Some of the exported coke was produced from US coal imported into the Community for this specific purpose as a result of inadequate indigenous coking capacity.
The balance between stable production plus imports up about 13 million tonnes on the one hand and coal consumption nearly 21 million tonnes higher in 1979 than the previous year plus slightly larger exports on the other, has resulted in a very substantial reduction in previously overlarge German producers' coal and coke stocks. In fact, by the end of 1979, they represented no more than about six weeks' production, or 12 weeks' if the German national coal reserve is taken into account.
2. The coal market outlook for 1980
The slow-down in economic expansion experienced towards the end of last year is likely to become more pronounced in 1980, leading to very modest expansion in world trade, low growth of the Community's GDP and a rise in energy consumption of only around l %.
Although low economic growth will inevitably lead to a fall in steel production, the effect on coke consumption is expected to be moderate. Among the reasons are likely to be substantial rises in specific coke consumption on account of higher fuel oil prices.
After a number of years of rapid growth, coal consumption for electricity generation is expected to level off. While there will be increases in some Member States which have not traditionally been big users of coal in power stations, these will largely be offset by a drop in consumption in the United Kingdom. Although only marginal so far, such a trend towards a broader spread of coal-fired electricity generation throughout the Community is desirable.
After electricity generation, general industry represents the biggest potential field for conversion from oil to coal and an increase in consumption of II · 5 % to close on 20 million tonnes of coal and coke can be expected. Growing interest in this market is being shown by Member Governments and industry, and the Commission is currently devoting special attention to the potential of this field.
No important changes are likely in the traditional domestic heating market. However, renewed expansion of the use of coal in institutional premises and for district heating are probable during the next few years but are unlikely to have a significant impact in 1980.
Coal production in the Community in 1980 is expected to be marginally higher than last year as a result of contraction of output due to pit closures in some coalfields being compensated by higher output elsewhere.
The total of intra-Community exchanges this year is unlikely to differ markedly from 1979, but with a shift from coal to coke. On the other hand, imports from third countries are expected to rise further, mainly to supply power stations in France and in a number of non-coal-producing Member States.
The general picture this year is likely to continue to be that of German and British production covering

14. 7. 80 Official Journal of the European Communities No C 174/5
an overwhelming share of the home market which, in turn. will absorb the bulk of indigenous output, of no great changes in German intra-Community deliveries and of the Belgian and French coal industries enjoying a secure though shrinking share of
their home markets. Growth in demand for coal in these two countries and in the non-coal-producing Member States will be met largely through rising imports from outside the Community.
II. GENERAL ECONOMIC SITUATION AND OUTLOOK
(Table 2)
The modest revival in economic activity in the Community in 1978 continued in 1979. Last year, the Community's gross domestic product is estimated to have risen by about 3 · 3 %.
However, by the end of 1979 symptoms of slower growth became evident, with the trend towards rising industrial production weakening noticeably and business expectations faltering. Consumer spending, which had grown strongly in the first half of the year, was less buoyant in the second half, but, on the other hand, investment was at a higher level during the second half of the year.
The slow-down in growth towards the end of 1979 owes much to unfavourable international economic developments, particularly the very sharp oil price rises. Their effects included inflationary pressures and adverse developments in the Community's balance of payments.
Consumer price rises accelerated in 1979, averaging 9 % over the year, with divergences between Member States widening again. The Community's current
balance of payments moved from a large surplus in 1978 to a deficit in 1979, partly because of worsening terms of trade and partly through worsening performance with regard to volume.
Total employment in the Community, which had started to move upwards in the second half of 1978, continued to rise in 1979. However, as the number of new entrants into the labour market was also increasing, the rate of unemployment changed little from 5 · 5 % in 1978 and remained fairly stable throughout the year.
The slow-clown in the Community's economy in expected to become more pronounced in 1980, with very mode~;t expansion in world trade and the Community's GDP growth probably at 1·2 %. Unemployment will resume its rise, furthe'r strong upward pressure on prices must be expected and the current balance of payments will be substantially in deficit. Problems with oil supplies or failure to minimize the economically depressive but inflationary effects of last year's oil price rises would darken prospects for 1980 still flrther.
Ill. COAL DEMAND BY SECTORS
I. Steel industry
(Tables 4 to 7)
I 979 saw a substantial improvement of output both of pig iron and crude steel. However, even at around
140 million tonnes crude steel production in 1979 was still far short of its level of nearly 156 million tonnes in 1974, the peak year of the decade. Whereas the growth in output in 1978 had largely been the result of increased exports to third countries, last year's rise was due to more buoyant demand within the Community.

No C 174/6 Official Journal of the European Communities 14. 7. 80
By far the largest growth took place in Germany, but there were substantial rises in production also in Belgium/Luxembourg and in the United Kingdom. As steel production in those countries traditionally relies very heavily on pig iron, output of the latter at 98 · 5 million tonnes registered a rise of about 9 · 2 % with consequent effects on coke use. Furthermore, due to an increase in specific coke consumption in most Member States resulting from rising fuel oil prices, coke consumption by the steel industry at 57· 4 million tonnes was l 0 · 8 % higher in 1979 than in 1978 i.e. an increase of 5 · 6 % in steel output was reflected in a l 0 · 8 % rise in coke consumption.
This relatively large increase in coke consumption, plus the fact that the German and Luxembourg steel industries rely almost exclusively on coke produced from German coal, has been an important factor in the substantial reduction in excess coal and coke stocks in Germany described in Section VIII.
However, due to the closure of a coal industry coke oven in the north of France, there has been a drop in French coal used for coke production. There was also a smaller drop in British coal. On balance, the total tonnage of Community coal used in cokeries in 1979 was about the same as the previous year, but there was a steep rise in third country coal, particularly from the US.
During the current year, steel production is expected to fall back by about 4% to between 134 and 135 million tonnes as a result of somewhat lower demand both within the Community and in export markets. Nevertheless, output will still be some 2 million tonnes above its level in 1978. Furthermore, as German and Belgian/Luxembourg production are forecast to remain relatively buoyant, output of pig iron at 93 million tonnes will remain some 3 million tonnes above its 1978 level.
As an additional factor, specific coke consumption is expected to go up further in Belgium, Germany and Luxembourg while remaining stable elsewhere. As an average for the Community as a whole, specific coke consumption is likely to rise by a further 5 to 513 kg this year, after having risen by 8 kg last year. As a result, blast furnace coke consumtpion during the current year is likely to be around 47 · 8 million tonnes, only 2 · 2 million tonnes below its 1979 figure. The combination of these circumstances can be expected to bring another quantitatively fairly satisfactory year for the German coking coal industry.
2. Power stations
(Tables 8 A, B, C, D)
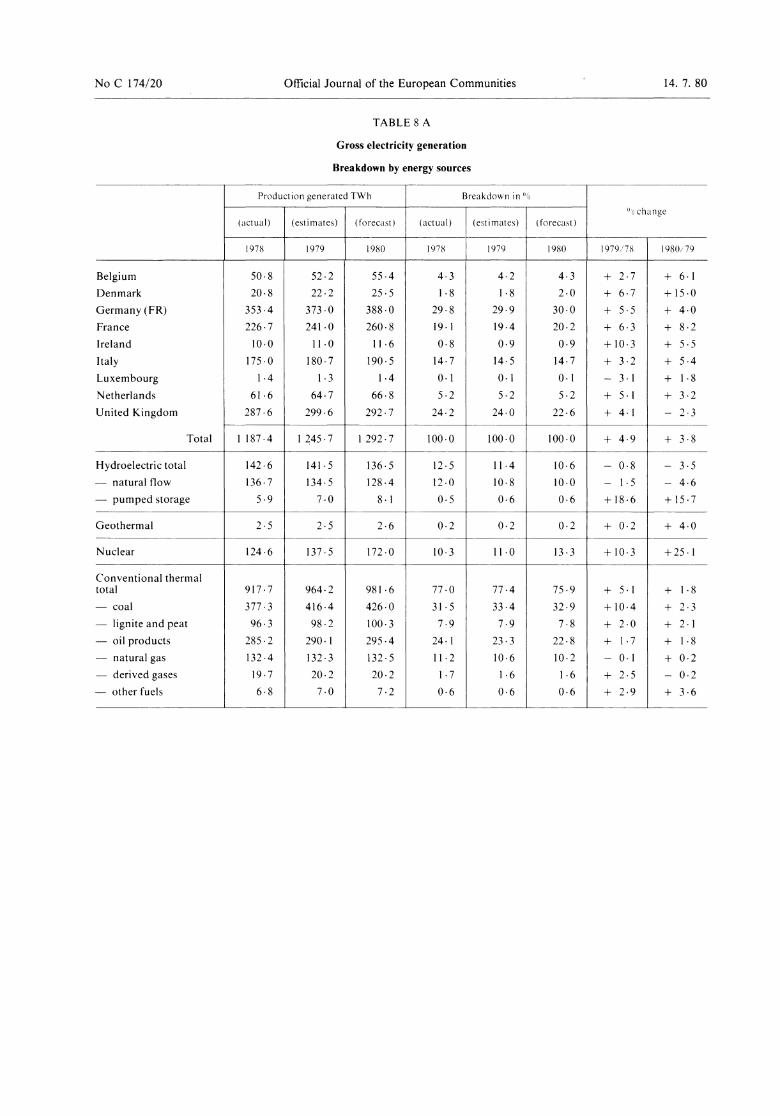
Gross electricity production in all Member States of the Community in 1979 was substantially above that of the previous year; for the Community as a whole, production in 1979 was about 58 TWh or 4·9% higher than the year before. Growth was particularly marked in Denmark, Ireland, France and Germany in that order.
Nuclear generation was about 13 TWh higher, new nuclear plants being brought into service in France at Bugey (two units) and in Germany at Philippsburg. Slightly less favourable hydraulic conditions reduced output from that source by about 1 TWh, while geothermal generation remained virtually unchanged. As a result, of the total increase of some 58 TWh, about 46 · 5 TWh had to be provided through additional use of fossil fuels.
With lignite lacking the flexibility of an economically transportable fuel and usable only in specialized installations, most of the increase in solid fuel consumption was accounted for by hard coal, which rose by some 17 · 5 million tonnes or about l 0 · 4% to 178 million tonnes. By far the largest increase, l 0 million tonnes, was registered in the United Kingdom, but consumption in Denmark, Germany and France also rose by l million tonnes or more in each country.
However, in spite of this increase in solid fuel consumption, oil consumption for electricity generation in the Community as a whole was 2 · 2 % higher last year than it had been in 1978, a rise to which four countries, Belgium, Ireland, Italy and the Netherlands contributed. The increase was particularly marked in the Netherlands where oil-burn has been progressively raised as a substitute for gas in electricity generation. For the Community as a whole, the proportion of oil used for conventional thermal electricity generation ranged from under 10% in Germany to nearly 80% in Italy.
Forecasts for the current year are mixed, with faster rises in electricity production expected in some Member States and slower growth in others, and a drop of some 2 · 3 % expected in the United Kingdom. Overall, electricity production in the Community is expected to rise by some 47 TWh or about 4%.

14. 7. 80 Official Journal of the European Communities No C 174/7
Of this increase, 34 · 5 TWh should be represented by additional nuclear generation due primarily to new nuclear plants expected to be commissioned in France at Tricastin (two units), Gravelines and Dampierre.
Coal consumption is expected to increase by some 20% in Denmark, 30% in Italy and 70% in the Netherlands. However, in absolute terms, the total of this extra consumtpion will only slightly exceed a likely drop of nearly 3 million tonnes in the United Kingdom. The agreement reached in March between the German coal and electricity generating industries progressively to raise Community coal consumption to 47 · 5 million tonnes by 1995 will not affect consumption during the current year, with the result that total coal consumption for electricity generation in the Community is likely to rise by only about 0·5 million tonnes.
In spite of this further slight rise in coal-burn, plus an expected increase of I · 7 % in lignite consumption, oil-burn for electricity generation is forecast to show further growth in all Member States except in Germany and the United Kingdom. Although not large in most Member States and adding up to a net increase of only about I % for the Community as a whole, the persisting growth in total oil consumption for electricity generation demonstrates the continuing need for effective measures to reverse this trend.
3. Various industries
(Table 9)
Next to electricity generation, general industry represents the biggest potential field for conversion from oil to coal.
However, this market raises exceptional statistical complications due to its diversity and very large number of individual units and to problems of definition. Table 9, the principal table dealing with consumption in various industries, includes coke but is otherwise based on a narrow definition. It excludes private electricity generation and most types of space heating.
Table 9 shows a contraction of the market by about 0 · 7 million tonnes or 3 · 6% in 1979 compared to the
previous year, largely due to a drop of some 0 · 9 million tonne> in Belgium. The principal reasons for this were problems in the Belgian cement industry including c. strike.
On the other hand, during the current year sales of coal and coke to general industry are expected to grow by O\ er 2 million tonnes to not far short of 20 million tonnes. Increases are forecast for almost all Member States with the United Kingdom, France and Germany in the lead. In France and Germany this is the result mainly of reconversion to coal of cement manufacture, aided in the case of Germany by the country's annual coal import quota for third country coal having been raised from 5 · 5 to 6 · 6 million tonnes.
Nevertheless, the United Kingdom will still represent nearly 40 % of the whole market. This dominant position is due to the fact that, whereas in most Member States, the use of coal in general industry continues to be largely confined to a very limited range of processes, such as the manufacture of cement and bricks, it is employed in a much wider field in the United Kingdom.
The reasons why coal is used there to a so much larger extent than in other Member States are the availability of attractively priced indigenous coal and an efficient distribution system.
Furthermore, the existence in the United Kingdom of an equipment industry offering installations from coal storage through combustion to ash disposal which do not require much more space or labour nor create substantially more environmental disturbance than comparable oil-fired installations is of growing importanc-e in fostering re-conversion from oil to coal. Another aspect of coal attracting increasing attention in general industry is the fact that in periods of uncertainty, additional quantities can be stocked on any site within the factory compound, whereas oil storage is limited by the capacity of available tanks.
4. Domestic sector
(Tables I 0 A and I 0 B)
Tables 10 A and 10 B show respectively fuels of high calorific value i.e. coal, patent fuel and coke
No C 174/8 Official Journal of the European Communities 14. 7. 80
and those of low calorific value i.e. lignite briquettes and peat. The latter market is insignificant except in a few localities in Germany and Ireland.
Due to an overestimate in domestic coal deliveries in the United Kingdom for 1978 in last year's report, an impression of stabilization of this market over a number of years was created. In effect, it had contracted by about I million tonnes or 5 % to around 19 million tonnes.
This volume remained unchanged in spite of the cold weather during the early part of 1979 and of domestic heating oil supply problems combined with high oil prices. However, there has been a
slight shift as between Member States, namely a drop of about 10% in France due, at least partly, to supply difficulties with anthracite from the USSR, and some growth in Germany and the United Kingdom.
Rising oil prices combined with the advent of compact fluidized-bed boilers and automated coal-handling equipment are expected to lead to renewed expansion of the use of coal for institutional premises and district heating during the present decade. However, with no comparable technological advances foreseeable for small installations and individual domestic heating, continuing contraction of this market appears inevitable. During the current year, its long-term downward drift is likely to persist in most Member States, with the notable exception of Ireland where demand shows an upward trend.
IV. COMMUNITY COAL PRODUCTION
l. Production statistics
(a) Quantitative analysis of output (Tables 11 and 12)
For the third year in succession, Community coal production in 1979 has remained stable within I % of 240 million tonnes as a result of fairly small, mutually compensating changes in production levels in the coal producing Member States. In fact, it showed a slight upward trend for the first time since 1975, and in the case of Germany, since 1968.
Over the three year period 1977 to 1979, French output dropped by 2 · 7 to 18 · 6 million tonnes and Belgian output by 0 · 9 to 6 ·I million tonnes. On the other hand, production in the Unitep Kingdom moved up by I million tonnes from 1977 to 1978, but fell back again by about the same amount to 120 · 6 million tonnes last year. The development in Germany was the reverse - a drop of I · 2 million tonnes from 1977 to 1978 but a renewed rise of 3 · I million tonnes to reach 93 · 3 million tonnes last year.
The contractions in Belgium and France were primarily the result of planned pit closures. The divergent German and British developments, on the other
hand, had their origin in different sets of causes. In the case of Germany, production was deliberately adjusted, first downward and then upward, in response to market conditions, whereas the British development resulted directly from production-related factors - the introduction of a productivity bonus scheme in 1978 and, in 1979, the combination of severe weather and a road transport strike aggravated by industrial relations problems in the opencast mining sector. In fact, deep mined output in the United Kingdom was practically unchanged from the previous year at 107 million tonnes.
The production level of about 240 million tonnes is expected to be maintained during the current year. Belgian and German output will be virtually unchanged from 1979, while a renewed rise in British coal production should largely balance an expected contraction of about 0 · 7 million tonnes in France.
(b) Manpower and productivity (Tables 13 and 14)
Following a lung-standing trend only briefly reversed during an occasional exceptional year, underground manpower has again dropped slightly in 1979, while productivity rose in France and Ger-

14. 7. 80 Official Journal of the European Communities No C 174/9
many and showed slight drops in Belgium and the United Kingdom. In Germany, the increase was 13 kg per underground man/hour, to a considerable extent resulting from the fact that, due to improved market conditions, available manpower was deployed in a more production-orientated manner.
During the current year, there are no reasons to expect substantial changes in recent trends in manpower or productivity, except that rises in productivity ranging from I · 8 to 2 · 9 o/o are hoped for in all Member States.
2. Financial developments
(a) Production costs and proceeds (Table 15)
In 1979, production costs in the Community's coal industry rose to about the same extent as the previous year, with wages and prices of materials rising faster than productivity. However, these rises did not exceed rates of inflations and, in the case of Germany, were slightly lower.
Developments in 1980 are unlikely to differ greatly from those last year.
Receipts, on the other hand, have risen more slowly than costs. In spite of steeply rising oil prices, several factors have been the cause of weakness in the world coal market, affecting the prices obtainable for Community coal. These factors are continuing world-wide slackness in demand for coking coal and temporary surpluses of steam coal, their financial effects aggravated for the coal producing Member States by the decline of the US dollar in relation to their currencies.
Regardless of further developments in the oil market, present facilities for switching to coal for electricity generation and general industrial and space heating uses in the Community and elsewhere are inadequate to boost demand and, hence, world steam coal prices during the current year sufficiently to allow those for Community coal to be raised by more than the general level of inflation. In the case of coking coal, likely continuing weak demand by the steel industry creates an even more unfavourable situation. As a result, the deterioration in the financial position of the Community's coal industry in 1979 is unlikely to be reversed this year.
(b) Financial intervention by Member States (Table 16)
The trend of previous years for all coal producers in the Community to require rising government subsidies has continued in 1979 but the amount per tonne varies greatly between Member States. Table 16 :;hows that the subsidies needed by the Belgian coal industry are by far the largest, while those for tr,e United Kingdom are at a comparatively modest level.
However, in comparing such figures it should be borne in mind that different levels of subsidies arise not only from varying production costs but are determined by the extent to which coal must be sold at prices aligned on the world market or, alternatively, benefit from a protected internal market. Thus, the German coal industry has such a market in the indigenous electricity generating industry which, in turn, can recoup any price disadvantage against fuel oil through a mrcharge to consumers.
For the Community as a whole, the total of subsidies for current production in 1979 under Decisions 73/287/EEC and 76/528/EEC amounted to 2077 MEUA.
3. Developments in productive capacity
(a) Investments in coal production and preparation (Table 17)
In 1979, investment in coal production and preparation has remainded at a high level in the United Kingdom and Germany. It continues to be particularly large in the former in connection with the development of a new coalfield at Selby.
The figures in Table 17 suggest a drop for 1980 except in France, but such forecasts are inevitably somewhar uncertain. However, taking account of inflation, even the slightly higher Community total for 1979 compared to the previous year represents a downward trend in real terms which will continue during the current year.
(b) Pit closures (Table 18)
Although the number of pits closed last year was only slightly smaller than in 1978, the impact of

No C 174/10 Official Journal of the European Communities 14. 7. 80
these closures on the Community's productive capacity was only some 2 · 5 million tonnes compared to 5 · 5 million tonnes the previous year. The main difference was in Germany where two pit closures reduced capacity by 3 · 2 million tonnes in 1978, whereas there were no closures of pits of comparable capacity last year.
The principal feature during the current year is likely to be five further pit closures in the Nord/ pas-de-Calais and Centre-Midi coalfields in France in line with the French government's plans. These
will reduce productive capacity by I million tonnes, plus a further 0-2 mill1on tonnes resulting from the closure of two small pits in the south of Belgium, leaving only one pit to be closed in that area where production will cease in 1981.
Although the possibility of some pit closures in the United Kingdom cannot be excluded, no definite information was available at the time of going to press.
V. COAL PRICES
In view of the importance of fluctuating rates ol exchange, the following list showing the movements of the US dollar in relation to the Community currencies will be helpful:
1 US dollar= Bfrs Dkr DM FF Lit Fl £
2 January 1979 28·545 5-0225 1·8084 4-143 823-00 1-9525 0-4885 2 July 1979 29-49 5-2910 1· 8417 4·268 829-00 2·0233 0-4572 3 January 1980 27· 77 5·328 1· 7055 4-005 799-40 1·888 0-4456 I April/980 31-53 6-101 1-9705 4·5385 911-50 2·1512 0-467
I . List price developments
(Tablesl9 A and 19 B)
Tables 19 A and 19 B show listed pithead prices of different types of coal for certain coalfields, the former in national currencies and the latter in US dollars.
List prices for Community coal have continued to rise in 1979, the extent of these increases ranging from 8 to 52%. However, expressed in US dollars for comparability, these price movements have affected the previous wide price differences between comparable coals from different coalfields to only a very limited extent. The coal price rises, all of them following in the wake of increases in the prices of other fuels, took the following form in the different Member States:
-Belgium: two increases in 1979 ranging in total from 8 to 38 %, followed by rises ranging from 3 to I 0% on I January 1980:
- Germany: an increase of 2% at the beginning of 1979, followed by a rise of around 5 % on I September
and increases of 7 to 10% in domestic coal at the beginning of 1980, followed by a further rise of about II %;
-France: prices rose in three steps in 1979, by 6 to 16% on I Apri I, by 5 to 21 % on I September and by 8 to 12% on I October, followed by further rises ranging from 2 to 15% on I January 1980 and of between 7 and 17 % on I April 1980;
- United Kingdom: increases ranging from 8 to II % on I March followed by further rises ranging from 6 to 14% on I July 1979, and rises ranging from 15 to 20% on I March 1980.
2. Coking coal
The average prices cif ARA for third country coking coal, the so-called indicative price calculated by the Commission, which had been stable at around $ 61 to $ 63 since 1975, rose to over $ 66 in 1979. However, this increase was insufficient to compensate

14. 7. 80 Official Journal of the European Comnunities No C 174/11
the downward movement of the US dollar on the international exchanges with the result that in terms of Community currencies, particularly with respect to the German mark and sterling, there was a net drop in the indicative price in the course of 1979.
As a result, the subsidy rates for the production of Community coking coal had to be raised.
3. Steam coal
Unlike for coking coal, there is no indicative third country price for steam coal on which Community producers traditionally align their own.
In Germany, a surcharge passed to electricity consumer allows coal producers to charge prices fully covering their costs, while in Belgium and France, the system is one of alignment on competing fuels and government subsidies to the coal industry. On the other hand, a substantial proportion of coal produced in the United Kingdom has remained competitive with readily available alternatives, but some subsidies have, nevertheless, been necessary.
Average dollar prices cif ARA of steam coal for electricity generation have moved upward from around $ 34 per tonne at the end of 1978 to the $ 37 to $ 38 region towards the end of 1979, but to draw any conclusions from this statistical rise of some I 0 %, numerous factors must be taken into account.
In the first place, due to the weakness of the US dollar, increases expressed in EUA!TJ have been nearer 7 %. Secondly, movements in average prices are af-
fected by quantitative changes in the origin of imported coal due both to different fob prices and varying freight rates.
Thus, the fact that the steepest increase in steam coal imports originated in South Africa and that this is the largest external source of steam coal for the Community, has a strong statistical impact on average prices. Not only is South African coal the most attractively priced available fob, but, compared to some other countries of origin, the shorter shipping distance has lessened the impact of rising freight rates.
4. Outlook for 1980
Further rises in the prices of Community coal are to be expected in the course of the year.
On the other hand, the world economic outlook does not suggest any substantial movements in world cok ng coal prices. However, repercussions on freight rates of unpredictable political events might find a refl·~ction in these.
As regard> world steam coal prices, in the absence of presently unforseeable circumstances, the quantitative fon~casts of imports into the Community by countries of origin (Table 26), indicating slower growth in imports from South Africa and steeper rises in imports from elsewhere, suggest the likelihood of a more marked increase in the average cif price of imported steam coal during the current year than in 1979.
VI. COKE
I. Developments in coking capacity
(Table 21)
Having risen to some 91 million tonnes in the middle of the decade, coke oven coke production capacity had been reduced to 81 · 6 million tonnes by 1978 and had shrunk to just over 81 million tonnes last year. With coke production at slightly below 66 million tonnes, average utilization in 1979 was
thus about 80 %, an improvement of about 5 % on the previous year.
By far thf' largest contraction in coking capacity during the second half of the decade took place in the German coal industry, involving closures of colliery coke-ovens with a total capacity of some 5 million tonnes. Most of the remaining contraction during this period is accounted for by the closure of colliery coke-ovens in France, of steel industry coke-ovens

No C 174/12 Official Journal of the European Communities 14. 7. 80
in the United Kingdom and of steel industry and independent cokeries in Belgium. In 1979, a coal industry cokery with a capacity of slightly over 0 · 5 million tonnes was closed in the Nord/Pas-deCalais area of France and a steel industry cokery with a capacity of 0 · 4 million tonnes near Liege in Belgium.
The prospects for the current year are of a further drop of 0 · 6 million tonnes in the coking capacity of the French coal industry and of a similar drop in that of the Belgian steel industry. On the order hand, a rise in the capacity of the British steel industry's coke ovens of I · 7 million tonnes and a slight increase in the Netherlands will slightly raise capacity in the Community as a whole over last year's level.
The Commission will examine the question of coking capacity in the Community in the light of the current restructuring of the Community's steel industry. When replacing coke ovens about to reach obsolescence, the location of new installations should be determined in the light of overall demand in the Community as a whole to avoid both local over-capacity or supply difficulties.
2. Coke production and coke supplies to cokeries
(Tables 22 and 23)
After contracting for several years in response to low demand by the steel industry, the year 1979 wit-
nessed a renewed rise in coke production in all Member States to reach slightly over 67 million tonnes, representing an increase of 3 million tonnes or 4 · 7 %. The largest rise amounting to I · I million tonnes took place in Germany, followed by Belgium and France with an increase of about 0 · 7 million tonnes each, while rises elsewhere remained modest.
In spite of the rise in production, stocks of coke at cokeries at the end of 1978 of 18 · 8 million tonnes had dropped to I 0 ·I million tonnes by the end of last year, most of this reduction being accounted for by lower stocks in Germany. This development was due to the combination of larger demand by the Community steel industry and exports to third countries.
Supplies of Community coal to cokeries at 65 · 8 million tonnes last year were the same as in 1978, but with a slight shift from intra-Community to indigenous supplies, represented by German intra-Community coal sales at a lower but coke sales at a higher level. On the other hand, deliveries of coking coal imported from outside the Community, mainly the US, rose by 26% to 21 · 3 million tonnes, but it should be noted that some of the additional coke production was re-exported to the US.
In view of current forecasts of steel production and coke exports and the coke stock situation, coke production during the current year is likely to be I million tonnes lower than in 1979, involving a drop of some I · 7 million tonnes in coal consumption by cokeries. In the light of coal import forecasts, this drop is likely to affect primarily Community coal.
VII. TRADE IN COAL AND COKE
I. Intra-Community trade
(Tables 24 and 25)
1979 has witnessed a significant drop in deliveries of coal from Germany, the principal supplier, to other Member States. The reductions in deliveries apply to most Community countries but have been particularly steep in the case of Belgium and France, reflecting the German coal industry's policy of reducing disposals at unremunerative prices aligned on the world market in view of stronger indigenous demand and contracting stocks.
On the other hand, German coke sales in 1979 were over I · 5 million tonnes or almost 40% higher than the previous year, while all intra-Community coke sales rose by about 35 'Yo to 6 · 9 million tonnes. The Luxembourg steel industry, which obtains its coke from outside the Grand-Duchy. has remained the largest market, with France a close second. An unexpected development has been a rise in coke imports into Belgium of some 0 · 7 million tonnes or 116 %. coupled with a drop in coal imports from Germany of close on 0 · 6 million tonnes. The combination of two factors has caused this development: the closure of a cokery with an annual capacity of some 400 000 tonnes near Liege and the

14. 7. 80 Official Journal of the European Communities NoC 174/13
employment of part of the remaining Belgian coking capacity to produce coke from coal imported from the US for re-export to that country.
Trends in intra-Community trade in coal for the current year suggest little change except for a further drop of some I· 2 million tonnes in German deliveries to France in further pursuit of the policy mentioned in the first paragraph.
On the other hand, the level of intra-Community trade in coke will probably rise by another 3 % to around 7 ·1 million tonnes due primarily to marginal increases in coke deliveries from the Netherlands and the United Kingdom.
2. Trade with third countries
(Tables 26 and 27)
As indicated in the autumn revision (I) of last year's report (2), imports from third countries appeared to be running at a higher level than originally forecast. Indeed, at about 58· 4 million tonnes they were some 15% above original forecasts and not far short of 30% above their total in 1978. However, as indicated below, net imports were some 12 million tonnes below this figure.
The rise of some 11 million tonnes was about equally distributed between steam coal for electricity generation and coking coal. The latter was due to some revival of demand by the Community's steel industry but is also reflected in coke requirements by third countries, particularly the US. In effect, something of the order of I million tonnes of coal were imported into the Community from the US in 1979 and subsequently re-exported there as coke.
The rise in imports to power station coal is shown as about 5 · 7 million tonnes in the form of deliveries to public power plants in Table 8 D, the figures in this table representing virtually all imported coal used for dectricity production. The increase is .:pread over all 7 Member States with coal-fired generating capacity. It ranges from Italy and Denmark with about I · 3 million tonnes and I · 2 million tonnes respectively, through Belgium and France with
(I) OJ No C 278, 7. II. 1979.
(2) OJ No C 120, 14. 5. 1979.
around 1 million tonnes to Germany with slightly under 0·6 million tonnes.
For comparison, it should be noted that the increase of some 5 · 5 to 6 · 0 million tonnes in imports of coal for electricity generation was accompanied by a rise of 5 million tonnes in deliveries of Community coal for this purpose.
Regarding countries of origin, the principal development in 1979 has been a recovery in imports from the US, which were exceptionally low in 1978 due to strikes in the coal-mining industry and on the railways. However, this recovery has not affected the leading position of Poland and South Africa, with the US occupying third place. In fact, for the first time ever, South Africa has moved into first place among external suppliers of coal to the Communtiy. On the other hand, supply problems caused a fall of 11 % in imports from the USSR to a mere 2 · 9 million tonnes, principally of anthracite for the domestic heating market.
Coal exports to countries outside the Community in 1979 continued to be stable at about 2 million tonnes, with Germany as the principal supplier. In view of the high costs of Community coal production, an expansion of these exports is improbable.
On the other hand, coke exports at around 8 million tonnes have been at a much higher level than in 1978. The largest market, representing nearly 3 million tonnes, has been the US due to inadequate indigenous coking capacities resulting from the financial im'pact of environmental legislation on investment in coke ovens. Germany, using indigenous coal and exporting 5 · 5 million tonnes of coke in 1979, has been by far the largest exporter of coke to third countries.
Taking the overall balance between coal and the very small coke imports into the Communtiy on the one hand, and coke and coal exports in 1979 on the other, the Community was a net importer of to the extent of 46 · 5 million tonnes, coke being reckoned at its coal equivalent compared to 33 · 5 million tonnes in 1978.
Prospects of trade with third countries in 1980 are of further large rises in coal imports and a drop in exports, particularly of coke from Germany. The latter will be the combined result of shrinking stocks and stable indigenous demand which provides a more remunerative market than overseas sales of coal.

No C 174/14 Official Journal of the European Communities 14. 7. 80
The forecast increase of about 12% in imports of coal into the Community to close on 65 million tonnes during the current year will be due entirely to growing demand for steam-coal, while coking coal imports are expected to drop by about 1 · 5 million tonnes and quantities of other types will remain unchanged. Of the increase in steam-coal imports of some 8 million tonnes, the greater part will be for electricity generation, but a proportion will be used by industry, particularly for the manufacture of cement and bricks in works reconverted from oil to coal firing.
The largest rises in imports will be into Denmark and France, each accounting for some 2 million
tonnes but, in the case of the former representing an increase of close on 36 % against some 9 % in the case of France.
The four leading coal exporters into the Communtiy - South Africa, Poland, the US and Australia in that order - are all forecast to increase their deliveries. However, in view of production and transport problems in Poland, coupled to internal demand and requirements by neighbouring countries, there is some doubt whether the projected increase in Polish deliveries to the Community of nearly 2 million tonnes can be achieved.
VIII. COAL AND COKE STOCKS
It should be noted that Table 28 giving provisional end of year figures of producers' coal and coke stocks is not strictly comparable with Tables 29, 30 A and 30 B giving stocks at power stations and colliery stocks broken down by type, treatment and areas at the end of September 1979, the latest available at the time of going to press.
1. Producers' coal and coke stocks
(Tables 28 and 29)
The contraction in excess German coal and coke stocks from their peak of 38 · 9 million tonnes (coke being reckoned at its coal equivalent) at the end of March 1978 to 31 · 7 million tonnes by the end of that year continued in 1979, with the result that stocks stood at 21 · 2 million tonnes at the end of 1979. As 11 million tonnes of this total constitutes the national coal reserve financed by the government, the 10 million tonnes of stocks carried by the German coal industry at the end of 1979 thus represented about six weeks' coal production, or 12 weeks' production with the national reserve taken into account, these production figures representing statistical averages derived from annual production theoretically spread evenly over 52 weeks.
Similar, though less dramatic, reductions in producers' stocks took place in France and the United Kingdom in the course of 1979, while Belgian stocks had already been drawn to their minimum operating levels in the course of 1978, coke playing only a minor role in producers' stocks in these three Member States. In terms of average weekly output, producers' stocks in France at the end of 1979 represented about 15 weeks' coal production and those in the United Kingdom a mere five weeks'; as shown in Table 29, a high proportion of these stocks consisted of part treated smalls, run of mine coal and slurry.
Taking coal and coke at its coal equivalent and including the German national reserve, total Community producers' stocks at the end of 1979 stood at under 40 million tonnes compared to 56· 5 million tonnes a year earlier. This dramatic change was due to a number of separate factors. The most significant of these were substantial rises in consumption of indigenous coal for electricity generation in Germany and the United Kingdom, improved performance by the steel industry and a deliberate policy by the German coal industry to reduce excess stocks through sales of coal and coke within the Community and outside.
Although total Community producers' stocks will probably diminish further during the current year,

14. 7. 80 Official Journal of the European Communities No C 174/15
particularly those of coke in Germany, these movements are likely to be small compared to the contraction during the previous 18 months and uneven as between Member States. In fact, in the United Kingdom the combination of increased production, a mild winter and a steel industry strike of several months are likely to lead to a rise in producers' stocks.
2. Coal stocks at power stations
(Table 30)
Coal stocks at power stations at the end of September 1979, the latest figures available at the time of
going to press, ranged from 38 days average consumption in Italy, relying on coal for only a very small proportion of electricity generation, to 180 days in Denmark, the Member State which has made the greatest strides in converting its generating capacity from oil to coal since 1974. Among the coal producing Member States, stocks at power stations ranged from 50 to 70 days, but in their case a substantial proportion of pithead stocks form an additional reserve.
In terms of the Community's security of coal supplies for electricity generation, none of the stock changes since the previous year represent any significant difference.

No C 174/16 Official Journal of the European Communities
TABLE I
Shares of the various forms of primary energy in gross internal energy consumption
ard coal
ignite
H
L
0
N
N
0
il
at ural gas
uclear energy
!hers
Total
---------·
lgium Be
De
Ge
Fr
Ire
Ita
Lu
N
Un
nmark
rmany (FR)
a nee
land
ly
xembourg
etherlands
ited Kingdom
197X 1979
PJ o,, PJ (!n PJ
7 329.7 18·7 8 020·4 19·4 7 995.3
I 121 · 8 2·9 I 167 ·9 2·8 I 167 · 9
21 415.7 54·5 21 993·2 53·3 21 641 ·6
6 726·9 17 ·I 7 233.4 17·5 7 451 ·I
I 193 ·0 3·0 I 310·2 3·2 I 632 · 5
I 477·6 3·8 I 507 · 0 3·5 I 431·6
139264·7 100·0 41 232 ·I 100·0 41 320·0
TABLE 2
Gross domestic product in real terms
('J6 variation compared with previous year)
-------,--
197X 1979 (actual) (provi,ional)
------·
I
2.·6 3·0
0·9 3 ·I
3·2 4·4
3·3 I
3·4
6·1 3·2
2·6 4·9
4·5 2·7
2·4 2·3
3·3 0·2 ----
Community 3·0 3·3
Sour~·e: Doc. COM(80) I 00 final.
19KO
19·3
2·8
52·4
18·0
4·0
3·5
100·0
1980 ( forcca't)
1·9
-0·3
2·1
2·1
1-4
2·0
I· 8
1·0
-2·5
I ·2
14. 7. 80

14. 7. 80 Official Journal of the European Communities No C 174/17
TABLE 3
Community coal consumption by sector and by Member States
(million /annes I= t)
197~ Jl)7l) J9g() 197'l/7H \980/79 (actual) (e,timate) (foreca,t) 00 (~'()
A.
Power stations 160·4 177 ·9 178·4 + 10·4 + 0·3
Coke ovens 83·0 87 .J 85·4 + 4·9 - 2·0
Iron and steel industry 2 ·I 2·2 2·1 + 5·2 - 7·0
Other industries 13·9 13·3 15·5 - 4·3 + 16·2
Domestic heating 19·3 19·1 18·7 - 0·7 - 2·3
Patent fuel plants 4·9 4·9 4·7 - - 4·8
O~n consumption at 2·2 1·9 1·9 -10·4 2·6 mmes -
Gasworks and others 2·1 2 ·I 1·6 - -22·9
Statistical difference -0·4 - - - -
Total 287·4 308·6 308·2 + 7·4 - 0·1
B.
Belgium 16·6 17 .J 16·9 + 3·2 - I· 3
Denmark 5·6 6·8 8 .J +22·0 + 18·8
Germany (FR) 81·9 86·7 87·5 + 5·9 + 0·8
France 44·2 47·3 45·8 + 6·8 - 3·0
Ireland 0·8 1·1 1·1 - -
Italy 12·1 13·3 14·1 + 9·7 + 5·7
Luxembourg 0·5 0·4 0·4 -12·0 -20·0
Netherlands 5·0 5 ·I 6·0 + 2·4 + 17 ·2
United Kingdom 120·6 130·6 128·4 + 8·3 - 1·8
Total 287·4 308·6 308·2 + 7·4 - 0·1

No C 174/18 Official Journal of the European Communities 14. 7. 80
TABLE 4
Steel and pig iron production
(I 000 /annes)
1978 1979 1980 1979/78 1980/79 (actual) (provisional) (forecast) o/o %
A. STEEL I Belgium/Luxembourg 17 391 18 391 18 400 + 5·8 -
Denmark 863 805 830 - 6·7 + 3 ·I
Germany (FR) 41 253 46 033 44000 + 11·6 - 4·4
France 22 837 23 337 22 000 + 2·2
I - 5·7
Ireland 68 72 70 + 5·9 - 2·8
Italy 24 283 23 995 23 200 - 1·2 - 3·3
Netherlands 5 583 5 804 5 500 + 4·0 - 5·2
United Kingdom (1) 20 302 21 571 20 400 + 6·3 - 5·4
Community 132 580 140 013 134 400 + 5·6 - 4·0
B. PIG IRON Belgium/Luxembourg 13 927 14 659 14 510 + 5·3 - 1·0
Germany (FR) 30 148 35 170 32 600 + 16·7 - 7·3
France 18 497 19 405 18 200 + 4-9 - 6·2
Italy II 405 II 386 10 900 - 0·2 - 4·2
Netherlands 4 613 4 813 4 510 + 4·3 - 6·3
United Kingdom (1) II 600 13 097 12 430 + 12·9 - 5 ·I
Community 90 190 98 530 93 150 + 9·2 - 5·5
(1) 1980 figures for the UK do not take into account the strike at the beginning of the year.
TABLE 5
Coke rates or specific coke input in blast furnaces
(kg/tonne)
1978 1979 1980 (actual) (provisional) (forecasts)
Belgium 519 545 550
Germany (FR) 486 490 500
France 491 509 509
Italy 479 480 480
Luxembourg 489 505 530
Netherlands 430 430 430
United Kingdom 577 575 575 ---
Community 500 508 513 --

14. 7. 80 Official Journal of the European Communities No C 174/19
TABLE 6
Consumption of coke oven coke in the iron and steel industry
(I 000 tonnes)
197H 1979 1980 1979/78 1980!79 (actual) (estimates) (forecasts) ~'0 '" '0
Belgium 6 102 6 630 6 510 + 8·6 - I· 8
Denmark 33 35 35 + 6·1 -Germany (FR) 17 008 20 050 19 000 + 17·9 - 5·2
France 10 187 10 910 10 265 + 7, I - 5·9
Ireland 10 10 10 - -Italy 6 299 6 300 6 055 - - 3·9
Luxembourg I 958 2 200 2 370 + ]2,4 + 7,7
Netherlands 2 163 2 290 2 160 + 5·9 - 5·7
United Kingdom 8 060 9 000 8 500 + 11·7 - 5·6
Community 51 820 57 425 54 905 + 10·8 - 4,4
Used in,'
blast furnaces 45 004 50 015 47 805 +II· I - 4·4
sintering 6 544 6 905 6 620 + 4,8 - 3·5
others 271 505 480 +86·3 - 5·0
TABLE 7
Community coke consumption by sector
(I OOOtonnes)
1978 1979 1980 1979/78 1980179 (actual) (provisional) (forecasts) (%) (%)
Iron and steel industry 51 820 57 425 54 905 + 10-8 - 4-4
Other industries 4 581 4 513 4403 - I· 5 - 2·4
Domestic heating 4 885 5 005 4 749 + 2·4 - 5 ·I
Others I 178 I 194 I 168 + I· 3 - 2·2
Total 62 464 68 137 65 225 + 9·1 - 4·3
No C 174/20 Official Journal of the European Communities 14. 7. 80
TABLE 8 A
Gross electricity generation
Breakdown by energy sources
Production generated TWh Breakdown in °/o
0 'o change (actual) (estimates) (forecast) (actual) (estimates) (forecast)
197H 1979 1980 19'H 1979 1980 1979/78 1980;79
Belgium 50·8 52·2 55·4 4·3 4·2 4·3 + 2·7 + 6·1
Denmark 20·8 22·2 25·5 J. 8 I· 8 2·0 + 6·7 + 15·0
Germany (FR) 353·4 373·0 388·0 29·8 29·9 30-0 + 5·5 + 4·0
France 226·7 241·0 260·8 19-1 19-4 20-2 + 6·3 + 8·2
Ireland 10·0 11·0 11·6 0·8 0·9 0-9 + 10-3 + 5-5
Italy 175-0 180-7 190·5 14-7 14-5 14-7 + 3·2 + 5-4
Luxembourg 1·4 J. 3 1·4 0·1 0·1 0·1 - 3 ·I + J. 8
Netherlands 61 ·6 64-7 66·8 5·2 5-2 5-2 + 5 ·I + 3·2
United Kingdom 287-6 299·6 292·7 24-2 24·0 22·6 + 4·1 - 2-3 --
Total I 187-4 I 245 · 7 I 292· 7 100-0 100·0 100-0 + 4-9 + 3-8
Hydroelectric total 142-6 141·5 136·5 12·5 11·4 10·6 - 0·8 - 3·5 - natural flow 136-7 134·5 128·4 12-0 10·8 10-0 - I· 5 - 4-6 - pumped storage 5·9 7-0 8 ·I 0-5 0·6 0-6 + 18·6 + 15-7
Geothermal 2·5 2-5 2·6 0-2 0-2 0-2 + 0·2 + 4·0
Nuclear 124·6 137-5 172·0 10·3 11·0 13·3 + 10-3 +25·1
Conventional thermal total 917-7 964-2 981·6 77-0 77-4 75-9 + 5 ·I + I· 8 -coal 377 ·3 416-4 426-0 31.5 33-4 32-9 + 10·4 + 2·3 - lignite and peat 96·3 98-2 100·3 7-9 7-9 7-8 + 2-0 + 2-1
- oil products 285·2 290·1 295·4 24-1 23·3 22-8 + I· 7 + I· 8 - natural gas 132·4 132·3 132-5 II· 2 10-6 10-2 - 0-1 + 0·2 - derived gases 19-7 20-2 20-2 I· 7 1-6 1·6 + 2·5 - 0-2
- other fuels 6-8 7-0 7·2 0·6 0·6 0·6 + 2·9 + 3·6

14. 7. 80 Official Journal of the European Communities NoC 174/21
TABLE 8 B
Fuel consumption by conventional power plants and coverage of requirements in %
(in Petajoules (1015) LCV)
1978 1979 19~0 change in °1() (actual) (estimates) (forecasts) 11 )
PJ ii'(J PJ o'o PJ % 1979/78 1980/79 ( 1)
Belgium
Coal 102·5 27·9 111·6 28·6 + 8·9
Lignite - - - - -
Oil products 164·7 44-9 166·2 42·5 + 0·9
Natural gas 65·9 17·9 80·8 20·7 +22-7
Others 34·0 9·3 32 ·I 8-2 - 5·6
Total 367 .] 100·0 390·7 100·0 + 6-4 --·---
Denmark
Coals 122·0 57-2 153-7 66·2 +23-9
Oil products 91.3 42·8 78-4 33·8 -15·1
Total 213·3 100-0 232-1 100-0 + 8·8
Germany ( FR)
Coal I 004-3 34-3 1 097 ·I 35-7 + 9·2
Lignite 926-4 3 I· 7 951 ·0 31-0 + 2·7
Oil products 297-0 10·1 272-4 8-9 - 8-2
Natural gas 583 ·I 19-9 622·5 20-3 + 6·8
Others 116-6 4-0 125·7 4- I + 7·8
Total 2 927.5 100-0 3 068.7 100-0 + 4-8
France
Coal 515·3 44-4 574-5 46-5 + 11·5
Lignite 29·2 2·5 30·5 2·5 + 4-6
Oil products 502-2 43·2 494-9 40·1 - 1 . 5
Natural gas 55· I 4-7 73 ·I 5-9 +32·8
Others 60-4 5·2 61.5 5·0 + 1 . 8
Total 1 162·2 100-0 1 234· 5 100·0 + 6-2
Ireland
Coal 0-7 0-7 I ·0 1-0 +41·4
Peat 28·2 29·6 26·0 24-6 - 7-9
Oil products 66·5 69·7 70-6 66-9 + 6·2
Natural gas - - 7-9 7·5 -
t---·---
Total L·4 I 100-0 105·6 100·0 + 10-6
( 1 ) Figures are not yet available.

No C 174/22
Italy
Coal
Lignite
Oil products
Natural gas
Others
Total
Luxembourg
Coal
Oil products
Natural gas
Others
Total
Netherlands
Coal
Oil products
Natural gas
Others
Total
United Kingdom
Coal
Oil products
Natural gas
Others
Total
Community
Coal
Peat/Lignite
Oil products
Natural gas
Others
Total
(1) Figures not yet available.
Official Journal of the European Communities
1978 (actual)
PJ o/o
52·9 4·8
12·6 J.J
891·5 81·7 97 .J 8·9
38·2 3·5
I 092·3 100·0
- -
2·5 17·3
5·6 39·6
6·1 43 .J
14·3 100·0
45·2 8·5
95·3 17·9
360·0 67·7
31· 5 5·9
532·0 100·0
I 893·3 75·6
544·3 21·7
42·4 1·7
24·6 1·0
2 504·6 100·0
3 736·4 41·9
996·4 11·2 2 655.2 29·8
1 209·2 13·6
311· 5 3·5
8 908·7 100·0
TABLE 8 B
(cont'd)
1979 (estimates)
PJ %
95·4 8·2
13·8 1·2
920·9 79·2
95·4 8·2
37·5 3·2
I 163·1 100·0
- -
1·9 14·7
4·8 36·7
6·3 48·6
13·1 100·0
31· 5 5·6
200·3 35·7
294·0 52·5
34·5 6·2
560·3 100·0
2 074·5 78·7
508·1 19·2
33·3 1·3
22·0 0·8
2637·9 100·0
4139·3 44·0
I 021·4 10·9
2 713·8 28·8
1 211·9 12·9
319·5 3·4
9 406·0 100·0
1980 (forecasts) ( 1)
PJ %
4 214·3 44·2
1 038·7 10·9
2 745·0 28·8
1 214·9 12·7 320·5 3·4
9 533 ·3 100·0
14. 7. 80
(in Petajou/es (1015) LCV)
%change
1979/78 1980179 (')
+ 80·4
+ 10·0
+ 3·3 - 1·7
- 1·8
+ 6·5
+ 8·7
- 21·2
- 14·5
+ 3·3
- 0·8
- 30·3
+110·0
- 18·3
+ 9·5
+ 5·3
+ 9·6 - 6·6 - 21·5
- 10·4
+ 5·3
+ 10·8 +1·8
+ 2·5 +1·7
+ 2·2 +1·1
+ 0·2 +0·2
+ 2·6 +0·3
+ 5·6 +1·4

14. 7. 80 Official Journal of the European Communities No C 174/23
TABLE 8 C
Consumption of solid fuels in power plants
(including autoproducers)
(million tonnes)
I 'in 1979 19g0 1979/78 1980/79 (actual) (provisional) (forecasts) % %)
Belgium
Coal 4·7 5·2 5·3 + Il·O + 1·9
Denmark
Coal 4·9 5·9 7. 1 + 19·8 +20·3
Germany (FRJ
Coal 40·6 44·0 44·1 + 8·4 + 0·2
Black lignite 1. 5 I· 5 1 . 5 } + 6·7 + 1·4
Lignite 113 ·4 121.2 122·9
France
Coal 22·9 25·0 25·0 + 9·5 -Black Lignite 1·2 1. 2 1. 2l + 14·7 + 7·5 Lignite 1·2 1. 5 1. 7
Ireland
Coal - - - - -
Peat 3·0 3·0 3·2 - 0·8 + 6·6
Italy
Coal 2. 1 3·3 4·2 +56·0 +30·0 Lignite 1·9 2·0 2·0 + 7·3 -
Netherlands
Coal 1· 7 1·4 2·3 -21·0 +69·1
United Kingdom
Coal 83·4 93·0 90·3 + 11·5 - 3·0
Community
Coal 160·4 177·9 178·4 + 10·4 + 0·3
Black lignite 2·7 2·7 2·7 - -
Peat and lignite 119·5 127·7 129·8 + 6·8 + 1. 7

No C 174/24 Official Journal of the European Communities
TABLE 8 D
Coal supplies to public power plants
(This table does not include colliery power plants or autoproducers- 1979 figures are estimates)
National Coal from
coal other ECSC
countries
Belgium 1977 3 453 222
1978 3 372 304
1979 2 540 560
Denmark 1977 - l 001
1978 - I 080
1979 - 800
Germany (FR) (1) 1977 24964 605
1978 27 258 631
1979 28 765 890
France 1977 3 368 I 692
1978 3 143 3 178
1979 3 345 2 700
Ita~v 1977 - -
1978 - 46
1979 -- 50
Netherlands 1977 16 292
1978 - 387
1979 - 540
United 1977 78 790 221
Kingdom 1978 80 964 54
1979 85 430 70
Community 1977 110 591 4 033
1978 114 737 5 680
1979 120 080 5 610
(1) Including 'Bergbauverbundkraftwerke". NB: 1977/1978- actual; 1979- estimates.
i I 000 tonne.\)
Total Coal from Total ECSC third Supplies coal countrie:.;.
3 675 421 4 096
3 676 704 4 380
3 100 I 750 4 850
I 001 3 625 4 626
l 080 4 286 5 366
800 5 500 6 300
25 569 4 231 29 800
27 889 4 599 32 488
29 655 5 170 34 825
5 060 9 925 14 985
6 321 10 290 16 611
6 045 II 255 17 300
- l 802 I 802
46 I 927 I 973
50 3 250 3 300
308 I 157 I 465
387 I 119 I 506
540 I 860 I 400
79 011 475 79 486
81 018 697 81 715
85 500 I 500 87 000
114 624 21 636 136 260
120 417 23 622 144 039
125 690 29 285 !54 975
14. 7. 80

14. 7. 80 Official Journal of the European Communities No C 174/25
TABLE9
Coal and coke-oven coke consumption in general industry (1 )
(excluding power plants)
( 1 000 tonnes)
1978 1979 1980 1979/78 1980/79 (actual) (estimates) (forecasts) % %
Belgium 2 708 I 796 2 130 -33·7 + 18·6
Denmark 795 825 915 + 3·8 + 10·9
Germany (FR) 4 308 4 350 4 800 + 1·0 + 10·3
France 2 469 2 700 3 250 + 9·4 +20·4
Ireland 36 40 40 +11·1 -
Italy 849 635 610 -25·2 - 4·0
Luxembourg I 2 3 - -
Netherlands 263 310 360 + 17·9 +16·1
United Kingdom 7 048 7 150 7 750 + 1·4 + 8·4
Community 18 477 17 808 19 858 - 3·6 + 11·5
( 1) Coke-oven coke assigned a value of unity.

No C 174/26
Belgium
Denmark
Germany ( FR)
France
Ireland
Italy
Luxembourg
Netherlands
United Kingdom
Community
Official Journal of the European Communities
TABLE lOA
Deliveries of coal, patent fuel and coke for domestic heating
(including issues to workers)
1978 1979 1980 (actual) (estimates) (forecast)
Coal I 636 I 597 1645 Patent fuel 201 200 220 Coke 20 26 25
Total I 857 I 823 1 890
Coal 14 20 20 Coke 28 30 30
Total 42 50 50
Coal 1 369 1 360 1 250 Patent fuel 1 032 I 050 I 000 Coke I 727 I 925 I 750
Total 4 128 4 335 4 000
Coal 3 031 2 630 2 570 Patent fuel 2 416 2 250 2 250 Coke 297 260 230
Total 5 744 5 140 5 050
Coal 725 970 970 Coke 4 4 4
Total 729 974 974
Coal 150 150 135 Patent fuel 10 10 10 Coke 196 250 250
Total 356 410 395
Coal 6 5 5 Patent fuel I I I Coke I 2 2
Total 8 8 8
Coal 117 100 100 Patent fuel 4 4 4 Coke 6 8 8
Total 127 112 112
Coal 12 195 12 300 12 000 Patent fuel I 000 I 000 900 Coke 2 602 2 500 2 450
Total 15 797 15 800 15 350
Coal 19 243 19 132 18 695 Patent fuel 4664 4 515 4 385 Coke 4 881 5 005 4 749
Total 28 788 28 652 27 829
14. 7. 80
( 1 000 tonnes)
1979/78 1980/79 % %
- 2·4 + 3·0 - 0·5 + 10·0 + 30·0 - 3·8
+ 0·7 + 0·8
+ 42·9 -+ 7·1 -
+ 19·0 -
- 0-7 - 8·1 + 1·7 - 4·8 + 11·5 - 9·1
+ 5·0 - 7·7
- 13·2 - 2·3 - 6·9 -- 12·4 -11·5
- 10·5 - 1·8
+ 33·8 -- -
+ 33·6 -
- -10·0 - -
+ 27·6 -
+ 15·2 - 3·7
- 16·7 -- -
+ 100·0 -
- -
- 14·5 -- -
+ 33·3 -
- 11·8 -
+ 0·9 - 2·4 - -10·0
- 3·9 - 2·0
- - 2·8
- 0·7 - 2·3 - 3·2 - 2·9 + 2·4 - 5 ·I
- 0·5 - 2·9

14. 7. 80 Official Journal of the European Communities No C 174/27
TABLE 10 B
Deliveries of peat and lignite for domestic heating
(I !IOU tonnesj
1978 197~ 1980 Difference in ° o
(actual) (estimates) I fcllTC<tst s I r-~
1979 78
Belgium
Lignite briquettes 20 20 20 -
Denmark
Lignite briquettes 15 15 15 -
Germany ( FR!
Lignite briquettes 3 168 3 000 2 800 - 5·3
France
Lignite briquettes 157 !55 155 - l. 3
Black lignite 67 65 65 - 3-0
Ireland
Peat 504 500 500 - 0-8
Peat briquettes 323 320 320 - 0-9
Italv
Lignite 40 40 40 -
Black lignite 20 30 20 +50·0
Luxembourg
Lignite briquettes 36 35 35 - 2-8
Netherlands
Lignite briquettes 9 7 5 -23-3
United Kingdom
Lignite briquettes - - - -
Community 4 359 4 187 3 975 - 4-0
NB: Average calorific value of these fuels: Peat Peat briquettes Lignite briquettes Black lignite
French - Italian
13 800 kJ/kg 18 640 kJ/kg 20 000 kJ/kg
18 750 kJ/kg 19 500 kJ/kg
-
1980. 79
-
-
- 6-6
-
---
-
-
-
-33·3
-
-29-5
-
- 5 ·I

No C !74/28 Official Journal of the European Communities
TABLE II
Hard coal production by areas
-----
Camp
Sud
me
Ruhr
Aache
Niede
Saar
Klein
n
rsachsen
zechen
Nord/ Pas-de-Calais
Lorra
Centr
ine
e-Midi
--
Belgium
German)' ( FR)
(National series)
France
l'r7K ( CIC[UCI II
5 963
627
6 590 r--
72 701
5 300
2 431
9 277
395
I
90 104
(83 541) I t----
5 974
9 764
3 953
19 690 --------------------- ----~
Ireland -----------------------
nd
hire
West
nds/Kent
Wales
Scotia
North
Yorks
North
Mid! a
South
Licen sed mines and opencast
United Kingdom
32 --
8 200
13 104
30 622
ll 045
36 251
7 751
14 722
121 695
Commun~38 Ill
I
1n9 (pro\ j.,ional I
5 613
511
6 124
75 236
5 334
2 333
9 888
486
93 277
(85 800)
5 386
9 595
3 630
18 611
60
8 080
13 562
31 013
10 978
35 731
7 785
13 447
120 596
238 668
14. 7. 80
(I 000 tonnes)
I'JXO (foreca,h)
6 000
320
6 320 ··--
75 000
5 400
2 300
10 300
500
93 500
(t\6 000)
4 500
9 650
3 600
17 750
60
--
..
..
..
..
--
--123 500
---
241 130

14. 7. 80 Official Journal of the European Communities No C 174/29
TABLE12
Hard coal production in Terajoules ( 1)
I 03 tonnes Tj kJ/kg
J978(actual)
Belgium 6 590 177 26 920
Germany (FR) 90 104 2 495 27 690
France 19 690 510 25 880
Ireland 32 1 21 160
United Kingdom 121 695 2 952 24 260
Community 238 111 6 135 25 760
J979(provisional)
Belgium 6 124 165 26 940
Germany (FR) 93 277 2 583 27 690
France 18 611 480 25 790
Ireland 60 1 21160
United Kingdom 120 596 2 933 24 320
Community 238 668 6 162___l_ 25 820
( 1 ) I Terajoule = 34 · 12 tee or 23 · 89 tep.

No C 174/30 Official Journal of the European Communities 14. 7. 80
TABLEI3
Personnel employed underground
(yearly average in I OOOs)
Changes Changes 1978 1979 1980 1979/78 1980/79
(actual) (pro- (forecast) visional) I 000 % I 000 o.,
Belgium 17-6 17 ·1 16·4 -0·5 -2·8 - 0·7 -4·1
Germany (FR) 121·0 119·1 117·0 -1·9 -1·6 - 2·1 -1·8
France 35·7 33-0 30·0 -2·7 -7·6 - 3·0 -9·1
United Kingdom 188-0 184·0 179·0 -4·0 -2·1 - 5·0 -2·7
Community (I) 362·7 353·6 342·8 -9·1 -2·6 -10·8 -3·1
(I) Including 0 · 4 in Ireland.
TABLEI4
Output per man/hour
kg/man/hour 0 o change
1978 1979 1980 1979178 1980/79 (actual) (provisional) (forecast)
Belgium 281 276 281 -1·8 +1·8
Germany (FR) 533 546 557 +2·4 +2·0
France 332 337 345 + 1·5 +2·4
United Kingdom 376 374 385 -0·5 +2·9

14. 7. 80
Belgium
Germany (FR)
France
United Kingdom
Belgium
Germany (FR)
France
United Kingdom
Community
(1) Including coking coal aids. (2) Provisional.
Official Journal of the European Communities
TABLE 15
Production costs and revenue per tonne
(%variation according to data supplied in national currencies)
Production cost~
I 97K, 77 I 979/7R (actual) (prm isional)
+ 6·3 + 7·0
+ 4·0 + 3·0
+ 12·4 + 11·5
+ 17 ·2 + 17·0
TABLE16
State aids to the coal industry
(Direct and indirect aids)
197X/77 (actual)
- 0·2
+ 6·7
+ 5·4
+ 8·8
Direct aids ( 1 ) Indirect aids
1978 I 979 (2 ) 1978 1979 (')
33·82 42·07 2·64 2·92
9·43 10·95 0·10 0·10
24·09 24·66 0·30 0·35
1·56 . . - . .
36·32 . . 0·14 . .
NoC 174/31
Revenue
I 979/7K (prmisional)
- 4·5
+ 3·5
+ 9·0
+ 15·0
( E UA/tonne produced)
Total
197K I 979 (')
36·46 44·99
9·53 11·05
24·39 25·01
I· 56 ..
36·46 ..

No C 174/32
Belgium
Germany (FR)
France
United Kingdom
Official Journal of the European Communities
TABLEI7
Investments in coal production and preparation
(million EUA) -------~-~~-~----~-~---
1 97 X 1979 19KO I')
-------+--·-"_ctual btimatc, I ForcGt't'
19-9 r 30-8 1
__
210. 1 309. 8 235. 7
48·6 41·5 =-t' 42·2 I 699-4 623-3 603-0
_____ c_ommuni~ __ [ 978-0 ~- I 005-4 880-9
( 1 ) Excluding investments not formally decided or engaged.
TABLE18
Pit closures
---
1979 19HIJ --
Previous year Pre\ ious year Number output Number output
(I 000 tonnes) (I 000 tormes)
Belgium
-Sud I 116 2 181
Germany I FR)
- Ruhr I 790 - -
-- N iedersachsen I - (1) - -
Total 2 790 - -
France
- Nord/Pas-de-Calais I 299 2 686
- Lorraine I 476 - -
- Centre-Midi - - 3 396
Total 2 775 5 I 082
United Kingdom
- Northern I 77 . . .. - Yorkshire 2 448 . . .. ~ North Western I 178 . . .. - South Wales I I 109 . . ..
r--------- -- -·-~
Total 5 812 . . .. --
Community 10 2 493 7 l 263 ----- -~
( 1) Without a reduction in production.
14. 7. 80

Cat
ego
ry
Ty
re
An
thra
cite
N
uts
3
20
/30
mm
Lea
n c
oal
Nu
ts 3
2
0/3
0 m
m
Sem
i-N
uts
4
bit
um
ino
us
I0/2
0m
m
Lon
g fl
ame
Nu
ts 2
3
0/5
0 m
m -
-
Lon
g fl
ame
Nu
ts 5
6
/IO
mm
Co
kin
g c
oal
Med
ium
or
high
vol
atil
e
Co
ke
Bla
st f
urna
ce
40
mm
(I)
Car
coke
o (2
) P
ower
sta
tio
ns
300
° 00
to 3
15 °
00 F
FO
(3)
Pow
er s
tati
on
s 41
0°00
to
428
°00
FFO
(
4)
Pow
er s
tati
on
s 30
0 ° 0
0 to
315
° 00
FFo
TA
BL
E 1
9 A
Lis
ted
pith
ead
pric
es f
or C
omm
unit
y co
al a
t 1
July
197
9 an
d 15
Jan
uary
and
1 A
pril
1980
Ru
hr
Aac
hen
S
aar
Bel
giu
m
l'o
rd
Lo
rra
ine
D
ate
DM
D
M
DM
B
frs
FF
FF
I. 7
0 19
79
241°
00
--
4 30
0 56
2°00
-
150
I. 1
980
277°
00
--
4 90
0 67
0°00
-
I. 4
0 19
80
283o
00
--
4 90
0 75
2°00
-
I. 7
0 19
79
231°
00
229°
25
-4
15
0
--
150
I. 1
980
242°
00
263°
00
-4
750
--
I. 4
0 19
80
266°
00
263o
00
-4
750
--
I. 7
0 19
79
185°
50
210°
00
--
--
150
I. 1
980
196°
50
241o
00
--
--
I. 4
0 19
80
229°
50
241°
00
--
--
I. 7
0 19
79
173°
00
-19
6°00
2
800
-31
5°00
I 15
0 I.
198
0 18
3°00
-
206o
00
3 05
0 -
395o
00
I. 4
0 19
80
210°
50
-22
4o00
3
050
-43
4o00
1
----- I. 7
. 19
79
175°
00
-19
3o00
2
700
-27
7 oo
o e>
I 15
. I.
198
0 18
5°00
-
204°
00
2 85
0 -
381°
00 (3
) I.
40
1980
21
0° 5
0 -
-2
850
-41
9°00
(4
)
I. 7
0 19
79
179°
00
188o
00
194°
50
2 50
0 34
0°00
32
1°00
15
0 I.
198
0 18
7°00
19
7o00
20
4°00
2
650
-38
5°00
I.
40
1980
20
7°50
21
6°00
22
1°00
2
650
-38
5°00
I. 7
0 19
79
279°
00
277°
00
303°
00
3 65
0 (I
) 51
0°00
53
5°00
15
0 I.
198
0 29
2o00
29
1°00
31
5°00
3
850
550°
00
562°
00
I. 4
0 19
80
324°
50
319°
00
345°
00
3 85
0 58
3-00
61
3°00
So
uth
S
cotl
and
W
ales
£
£
51°1
0 -
5lo
l0
-59
°80
-
43°6
0 -
43°6
0 -
52°0
0 -
--
--
---
-38
°50
-38
°50
-46
o70
-37
°40
-37
°40
-44
°90
43°7
0 42
°40
43°7
0 42
°40
50°6
0 47
°50
79°5
0 78
°50
87°5
0 86
°40
87o5
0 86
o40
So
uth
Y
ork
shir
e £
- - - - - - - - - 34°3
0 34
°30
41°6
0
32°0
0 32
°00
37°9
0
38°0
0 3
8°0
0
42°9
0
78°0
0 85
o80
85°8
0
- f>- ;--1
00
0 z 0 ('}

TA
BL
E 1
9 B
Lis
ted
pith
ead
pric
es f
or C
omm
unit
y co
al a
t 1
July
197
9, 1
5 Ja
nuar
y an
d 1
Ap
ri11
980
Cat
egor
y T
ype
Dat
e
Ant
hrac
ite
Nut
s 3
I. 7
. 19
79
20
/30
mm
15
. I.
198
0 I.
4.
1980
Lea
n co
al
Nut
s 3
I. 7
. 19
79
20
/30
mm
15
. I.
198
0 I.
4.
1980
Sem
i-N
uts
4 I.
7.
1979
bi
tum
inou
s I0
/20
mm
15
. I.
198
0 I.
4.
1980
Lon
g fl
ame
Nut
s 2
I. 7
. 19
79
30/S
Om
m
15.
I. 1
980
I. 4
. 19
80
Lon
g fl
ame
Nut
s 5
I. 7
. 19
79
6/I
Om
m
15.
I. 1
980
I. 4
. 19
80
Cok
ing
coal
M
ediu
m o
r I.
7.
1979
hi
gh v
olat
ile
15.
I. 1
980
I. 4
. 19
80
Cok
e B
last
fur
nace
I.
7.1
979
40
mm
15
. I.
198
0 I.
4.
1980
(t)
Dol
lar
exch
ange
rat
e:
DM
In
dex
2.7
.19
79
1·
8417
10
0 3.
I.
1980
I·
705
5 93
I.
4.
1980
1·
9788
10
7 (2
) P
rice
s ar
e n
ot
adju
sted
for
qua
lity
dif
fere
nces
. (l
) P
ower
sta
tion
s: 7
0· 2
9 to
73
· 81
$/t
on
ne.
(4
) P
ower
sta
tion
s: 1
02
·37
to 1
06-8
7 $
/to
nn
e.
(5)
Pow
er s
tati
ons:
89
· 95
to 9
3 · 9
0 $
/to
nn
e.
Ru
hr
130·
86
162·
42
143·
02
125·
43
141·
89
134·
42
100·
72
115·
22
115·
98
93·9
3 10
7·30
10
6·38
95-0
2 10
8·47
10
6·38
97 ·1
9 10
9·65
10
4·86
151·
49
171·
21
163·
99
Bfr
s 29
·49
27·7
7 3
1·6
9
Aac
hen
- - -
124-
48
154·
21
132·
91
114·
02
141·
31
121·
79
- - - - - -
102·
08
115·
51
109·
16
150·
40
170·
62
161·
21
Inde
x 10
0 94
107
Saa
r
- - - - - - - - -
106·
42
120·
79
113·
20
104-
79
119·
61
-
105·
34
119·
61
111·
68
164·
52
184·
70
174·
35
FF
4·26
8 4·
005
4·55
8
Bel
gium
I 145·
81
176·
45
154·
62
140·
73
171-
05
149·
89
- - - 94·9
5 10
9·83
9
6·2
4
91 ·
56
102·
63
89-9
3
84·7
7 95
-43
83·6
2
123·
77
138·
64
121·
49
Inde
x 10
0 94
107
----
r N
ord
131·
68
167·
29
164·
98
- - - - - - - - - - - - 79·6
6 - -
119·
49
137.
33
127·
91
£ 0·
4572
0·
4456
0·
4682
Lor
rain
e
- - - - - - - - - 73·8
1 98
·63
95·2
2
64· 9
0 (1
)
95·1
3 (2
)
91·9
3(3)
75·2
1 96
·13
84·4
7
125·
35
140·
32
134·
49
Inde
x 10
0 97
102
Sou
th
Wal
es
Sco
tlan
d
I 11
1·77
-
114·
68
-12
7·72
--
95·3
6 -
97·8
4 -
111·
06
-
--
--
--
-84
·21
-86
·39
-9
9·7
4
-81
-80
-83
·93
-95
-90
95·5
8 9
2·7
4
98-0
6 95
-15
108·
07
101·
45
173·
88
171·
70
196·
36
193·
88
186-
89
184·
54
Sou
th
Low
est
Yor
ks
pric
e
-11
1·77
-
114-
67
--
127·
72
-9
5·3
6
-9
7·8
4
-11
1·06
-10
0·72
-
115·
22
-11
5·98
75·0
2 73
·81
76·9
7 76
-97
88·8
5 88
-85
69·9
9 64
·90
71· 8
1 69
·99
80·9
5 80
·95
77·4
3 75
·21
79·4
4 79
·44
-83
-62
171·
70
119·
49
192·
54
137·
33
183·
26
121·
49
(US
$ (
I) (
2))
Hig
hest
D
iffe
r-pr
ice
ence
145·
81
30
·5
176·
45 .
53
·9
164·
98
29
·2
140·
73
47
·6
171·
05
74
·8
149·
89
35
·0
114-
02
13·2
14
1·31
2
2·6
12
1·79
5
·0
106·
42
44
·2
120·
79
56·9
11
3 ·2
0 2
7·4
104-
79
61·5
11
9·61
7
0·9
10
6·38
3
1·4
105·
34
40·1
11
9·61
5
0·6
11
1·68
3
3·6
173·
88
45
·5
196·
35
43
·0
186·
89
53·8
z 0 ()

14. 7. 80 \ Official Journal of the European Communities
~' TABLE20 Average cif p earn coal imported from third countries as reported by the Member States
~ 1177
In EUAITJ (1) (2)
Maximum I 455
Average I 046
Minimum I 010
In $/tonne
Maximum 41·3
Average 30·4
Minimum 28·6
(') I Terajoule = 34 · 12 tee or 23 · 89 tep. (2) Rounded up to nearest whole figure.
1/78 l/79
I 249 I 105
I 054 I 020
978 953
38·9 40·0
33 .J 34-9
30·0 32·7
TABLE 21
Coke-oven coke production capacity
Belgium Germany France Italy (FR)
19 711 (actual)
Colliery plants - 22·4 6·0 -
Iron and steel industry 7·3 9·1 6·7 9·0
Independent - - - 2·6
Total 7·3 31· 5 12·7 11·6
(of which coastal coking plants) (I· 5) (0·4) (4·2) (II ·6)
/9 79 (provisional)
Colliery plants - 22·4 5·9 -
Iron and steel industry 6·9 9·1 6·5 9·0
Independent - - - 2·6
Total 6·9 31.5 12·4 11·6
(of which coastal coking plants) (I · 5) (0·4) (4·2) (II· 6)
/980(forecasts)
Colliery plants - 22·4 5·3 -
Iron and steel industry 6·6 9·1 6·3 9·0
Independent - - - 2·6
Total 6·6 31.5 11·6 11·6
(of which coastal coking plants) (I· 5) (0·4) (4·2) (11·6)
(1) lncludingLTC.
(average price per quarter)
11/79 111179
I 215 I 251
I 083 I 096
994 951
42·1 45·8
36·3 38·3
33 .J 32·4
Nether- United land' Kingdom
- 4·1
2·4 8·5
0·5 3·0
2·9 15·6
(2·9) ( .. )
- 3·7
2·4 9·1
0·5 3 ·0 (1)
2·9 15·8
(2 ·9) ( .. )
- 3·6
2·5 10·8
0·5 3. 0 (1)
3·0 ' 17·4
(3 ·0) ( .. )
No C 174/35
(million tonnes)
Com-munity
32·5
43·0
6·1
81·6
( .. )
32·0
43·0
6·1
81·1
( .. )
31.3
44-3
6·1
81· 7
( .. )

No C 174/36 Official Journal of the European Communities 14. 7. 80
TABLE 22
Coke-oven coke
(I 000 tonnes)
Production of coke-oven coke
Con..,umptilH1 -
Coal dell\ erie' of 12nal in cok- Variation to coking planh
ing rlanh I 000 tonne' in °o
\erw., the pre\'iou~ year
1978 (actual)
Belgium 7 221 7 403 5 747 + 3·2
Germany (FR) 32 758
I
32 739 25 593 - 5·9
France 12 985 13 034 10 682 - 0·8
Italy 10 006
I 9 779 7 315 - 4·7
Netherlands 3 271 3 283 2401 -- 4·0
United Kingdom
16 "'i 16 721
12 394 -12·7
Community 82 579 82 959 64 132 - 6·0 --
19 79 (estimates)
Belgium 8 468 8 468 6 440 + 12·0
Germany (FR) 33 900 33 900 26 697 + 4·3
France 14 500 14 500 II 400 + 6·7
Italy 9 650 9_650 7 450 + I· 8
Netherlands 3 540 3 540 2 550 + 6·2
United Kindom 17 000 17 000 12 600 - I· 7
Community 87 058 87 058 67 137 + 4·7
/980 (forecasts)
Belgium 7 900 7 900 6 120 - 5·0
Germany (FR) 34 700 34 700 27 000 + ].]
France 12 600 12 600 10 250 -10·1
Italy 9 500 9 500 7 200 - 3·4
Netherlands 3 450 3 450 2 700 + 5·9
United Kingdom 17 220 17 200 12 975 + 3·0
Community 85 370 85 370 66 245 - 1·3

14. 7. 80
Belgium
Official Journal of the European Communities
TABLE 23
Coal supplies to coke ovens
'ation'd coal
Coal from other H'SC
count rie'
-----,----Total I Coal from ECSC third
(I 000 wnnn)
Iota! supplies
COd! 1 COUtlll!CS
1977 3 732 I 344 5 076 2 268 7 344
1978 3 821 I 806 5 627 I 726 7 353
_,_9_79 _______ +-_3_9_7_3_-t-__ 1_3_95 5 368 ~ 00 8 468
Germany(FR)
1977 34 787
1978 32 631 II 100 32 731 27 32 758
1979 33 480 140 I 33 620 280 33 9oo ------1---l -----r---~ France
1977
1978
1979
Italy
1977
1978
1979
Netherlands
1977
1978
1979
United Kingdom
1977
1978
1979
Community
1977
1978
1979
I I I 6288 I 3550 9838 4037 I 13875
5 721 3 362 9 083 1 3 943 , 13 026
5 450 1 3 800 __ 9_250 j_i 5 250 14 500
1---- T--- ! I 2 I I () 2 II 0 I 8 066
I 2 568 2 568 I 7 719
t----2~ t___'_'O'' . + _'_"_0
I 571 57 I i 2 67 5 I j I
' 801 I 801
9 650
10 176
10 287
3 246
? '97 3 093 -- I - ~ - -1
640 640 l-' '()()t . '-""----I
I 17 938 145 18 083 933 19 016
14 794 198 14 992 I 142 I 16 134
14 700 100 14 800 2 200 17 000
62 745 7 905 70 650 18 061 88 711
56 967 8 835 65 802 16 849 82 651
57 603 8 175 65 778 21 280 87 058
NB_· 1977-1978- actual; 1979- estimates.
No C 174/37

No C 174/38 Official Journal of the European Communities 14. 7. 80
TABLE 24
Trend of intra-Community trade in coal
1 I 000 tonnes)
~~' Germany Luxem· 1\et her· United Belgium Denmark France Ireland Italy Total )
(FR) bourg land.') Kingdom
Belgium
1978 - - 4 067 69 - - - 2 !53 4 291
1979 - - 3 420 65 - - - - 240 3 725
1980 - - 3 270 60 - - - - 190 3 520 ---·~---
Denmark i
1978 - = 1::: I - - - - - 131 I 059
1979 - I - - - - 50 180 810
1980 - - 750 - - - - - !50 900 ---·- -··-·--------Germunv ( FR) I
I
1978 104 -
I
- 298 2 - - - 604 I 008
1979 150 - - 350 - I - - - 800 I 300 1980 200 - - 250 - - - - 650 I 100
France
1978 79 - 6 600 - - - - - 892 7 571
1979 70 - 6 740 - - - - - 790 7 600
1980 75 - 5 495 - - - - - 600 6 170
lreland
1978 II -- II - - - - - 200 222
1979 - - - - - - - - 200 200
1980 - - - - - - - - 200 200
Italy
1978 - - 2 534 21 - - - - 52 2 607
1979 5 - 2 155 20 - - - - 20 2 200
1980 10 - 2 350 20 - - - - 20 2 400
Luxembourg
1978 8 - 299 - - - - - 13 320
1979 20 - 120 40 - - - - - 180
1980 - - 160 40 - - - - - 200
Netherlands
1978 10 - I 258 4 I - - - 169 I 442
1979 - - I 160 10 - - - - 180 I 350
1980 - - I 040 10 - - - - 200 I 250
United Kingdom
1978 17 - 260 I 53 - - 2 - 333 1979 - - 375 - - - - - - 375
1980 - - 350 - - - - - - 350 -------··--- f--
I I
Total deliveries I
1978 229 I - I 1s 957 393 55 - - 4 2 214 18 853 1979 245 - 114 550 485 - - - 50 2 410 17 740
1980 285 - 13 415 380 - - - - 2 010 16 090 --

14. 7. 80 Official Journal of the European Communities No C 174/39
TABLE 25
Trend of intra-Community trade in coke-oven coke
(I 000 tonnes)
~ Belgium Denmark Germany France Ireland Italy Lux em- Nether- United Total (FR) bourg lands Kingdom T
I
Belgium
1978 - - 253 112 - - - 207 38 610
1979 - - 965 130 - - - 165 40 1 300
1980 - - l 050 100 - - - 100 50 1 300
Denmark
1978 - - 41 65 - - - - 7 113 1979 - - 25 60 - - - - 15 100
1980 - - 30 60 - - - - 20 110
Germany ( FR)
1978 27 8 - 72 - - - 144 127 378 1979 90 - - 160 - - - 150 100 500 1980 60 - - 200 - - - 150 90
I 500
I
France
1978 93 - I 494 - - 21 - 108 - I 716
1979 170 - 1940 - - 20 - 115 - 2 245
1980 125 - 1965 - - 15 - 320 60 2 485
Ireland
1978 - - - - - - - - 10 10 1979 - - - - - - - - 10 10
1980 - - - - - - - - 10 10
Ita~~·
1978 - - 23 65 - - - - - 88
1979 - - 120 70 - - - - - 190
1980 - - 125 75 - - - - - 200
Luxembourg
1978 78 - 1 795 29 - - - 4 12 1917
1979 5 - 2 065 - - - - - - 2 070
1980 5 - 2 170 - - - - - - 2 175
Netherlands
1978 I - 181 24 - - - - 16 224
1979 5 - 390 30 - - - - 15 440
1980 10 - 235 40 - - - - 15 300
United Kingdom
1978 1 - 13 I - - - - - 15 1979 - - 10 10 - - - - - 20 1980 - - 5 5 - - - - - 10
Total
1978 200 8 3 800 368 - 21 - 463 210 5 071 1979 270 - 5 515 460 - 20 - 430 180 6 875 1980 200 - 5 580 480 - 15 - 570 245 7 090

No C 174/40
A.
B.
c.
Official Journal of the European Communities
TABLE 26
Imports of coal from third countries
1979 (actual) (provisional)
(million tonnes)
19XO (forecasts) L 197S
~- --------·-f----------+------·
By country of destination I
Belgium 2·7 I 5·9 5·6 Denmark 5·0 6·7 8·9
Germany(fR) 5·7 6·9 6·5
I
I France 15·9 19·5
I
21·3 Ireland 0·6 O·ll 0·8
Italy 9·8 11·1
I
II· 7
Luxembourg 0·2 0·2 0·2
Netherlands 3·4 3·8 4·7 I
United Kingdom 2·0 4·0 5·7
Community 45·3 59-0 65·4 -
By country of origin
I USA 7·5 14-7 14-2 Canada 0·9 0·8 0-9 Australia 6·8 8·1 10·2 South Africa 10·7 15·9 16·6
Poland 15·3 15·2 19·8
USSR 3-3 2·8 2·8
Others 0·8 J. 5 0·9
Total 45-3 59·0 65·4
By sector of consumption
Steam coal 24·5 30·5 38·0
Coking coal 17-2 24·0 22·7
Others 3·6 4·5 4·7
Total 45·3 59·0 65·4
14. 7. 80

,
14. 7. 80 Official Journal of the European Communities NoC 174/41
TABLE 27
Imports of coal from third countries -1979
(Provisional figures)
(I 000 tonnes)
USA Canada I ~So~-,~-----,-,--_-,----,--------,~----
1 Australia Africa f><,laml 1 USSR Others Iota!
--------+----+-----+~-~----+--- ----t-----~---+---___J_-----+----~---
1 ::: : ::~ ~ ::; ::: I ,;; : ::: Belgium
Denmark
Germany (FR)
France
Ireland
Italy
Luxembourg
Netherlands
United Kingdom
Community
Belgium
2 523
177
I 768
3 350
50
4 234
!7
56
134
511
73 I 2 407 8 377 4 457 I' 736 92 19 492
I 10 790 sso
139 1 1s - 174 I l 006 l 911 2 450 ! 925:l565 II 091
I 519 ·~ l 026 219 805 I 7 268 3 R44
1---'~03~1---+---- 2 164 38 658 ~--~_s -91 -t--4-04_7
14 669 774 _l__s_Io~9-~-~~5~9~2~5 ___1__1_5~2-o~I -~~7 1 490 J_s_8_9_ss_~
TABLE 28
Community producers' stocks
A. Stocks of coal
(I 000 tonne.\·)
End of End of End of 19HO Difference
1978 1979 (forecast) (actual) (provisional) 1979/7X !980179
265 155 310 - 110 + 155
Germany (FR) (1) 13 831 12 600 12 885 -I 231 + 285
France 4 826
Ireland 30
United Kingdom 13 110
Community(') 32 071
(1) Including 'Notgemeinschaft'. (2) Including 9 in Italy.
3 940
30
9 700
26 425
4 710 - 886 + 770
30 - -9 350 -3 410 - 350
27 285 -5 646 + 860

No C 174/42 Official Journal of the European Communities
Belgium
Germany (FR) (I)
France
Italy
Netherlands
United Kingdom
Community
! . --------t gmm Bel
Ger
Fra
lrel
!tal
Net
Um
many (FR) (I) I nee I
I
and I I
y I
herlands
ted Kingdom
Community
B. Stocks ofcoke-oven coke
End of Fnd of End of 19RO 197X 1979 (forecast) (actual) (pr<'' is ronal)
87 130 130
l3 735 6 619 5 144
l 194 l 000 l 000
487 400 400
35 25 25
3 285 I 950 l 950
18 823 10 124 8 649
C. Stocks of coke and coke-oven coke
End of End of End of 1%0 1978 1979 (forecast) (actual) (provi.sional)
378 324 479
31 687 21 204 19 572
6 378 5 240 6 010
30 30 30
642 520 520
45 32 32
17 380 12 235 II 885
56 540 39 585 38 528
(I) Including 'Notgemeinschaft'.
14. 7. 80
(I 000 tonnes)
Difference
1979n 1980/79
+ 43 --7 116 -I 475
- 194 -
- 87 -
- 10 -
-I 335 -
-8 699 -I 475
(I 000 tonnes)
Difference
1979178 1980179
- 54 + 155
-10 483 -3 632
- l 138 + 770
- -
- 122 -
- 13 -
- 5 145 - 350
-16 955 -I 057

14. 7. 80
•
•
Belgium
Cam pine
Basin Sud
Germany ( FR)
Ruhr
Saar
Aachen
Niedersachsen
Official Journal of the European Communities
TABLE 29 A
Breakdown of coal stocks
(Total colliery stocks at the end of September 1979)
A. By group and by area
Groups Groups Groups l-ll V-Vl lll-Vl-Vll
- 58 -
19 - -
Total 19 58 -
226 4244 69
3 144 809
161 45 403
620 - -
Total I 010 4433 I 281
+ 'Notgemeinschaft' - - -
Total
France
Nord/Pas-de-Calais 737 424 4
Lorraine - I 665 -Centre-Midi 369 390 594
Total I 106 2 479 598
Ireland - - 30
United Kingdom
Scotland - 47 120
Northern - 2 438 162
Yorkshire - 417 763
North Western - 436 81
Midlands - 29 863
South Wales I 513 283 I 571
Open cast 832 352 917
Total 2 345 4 002 4477
Community 4480 10972 6 386
No C 174/43
( 1 000 tonnes)
Total
58
19
77
4 539
956
609
620
6 724
7 275
13 999
I 165
I 665
I 353
4 183
30
167
2 600
1180
517
892
3 367
2 101
10 824
21 838

No C 174/44
Belgium
Groups I+ II
Groups V- VI
Others
Total
Official Journal of the European Communities
TABLE 29 B
Breakdown of coal stocks
(Total colliery stocks at the end of September 1979)
Large and graded
4
14
18
B. By group and by preparation
Smalls washed
3
35
38
U ntrcated smalh and
fines
3
3
Pan-treated smalls
I
6
7
Run of mine Slurry
11
11
14. 7. 80
(1 000 tonnes)
Total
19
58
77 -------------------~---------~--------~---------r----------+---------+---------~---------
Germany ( FR)
Groups I + II
Groups V- VI
Others
I
~ __ : __ !i ___ l :~~:~ ,; 688
2 357
187 --
+ "Notgemeins:oat~~ I 340 I 3 I 80 I 3 232
I ! I ~--------~-
~~~::up~--1 :-TotoJ_t -j 260 ~~ --118 [-:-Groups V- VI I 354 I 369 341 681;
Others I 29 36 239 187
3
1
10
259
650
919
238
726
107
1 010
4 433
I 281
6 724
7 275
13 999
I 106
2 479
598 f-----------f----------+----------+----------+---------~---------+----------
Total 459 665 698 I 286 4 I 071 4 183 ---------------------~----------r----------+---------+---------+---------r---------+----------
Ireland Ill- IV- VII
United Kingdom
Groups I +II
Groups V- VI
Others
Community
Groups I + II
Groups V- VI
Others
Total
Total
13
165
277
455
164
655
453
I 272
641
2 170
971
3 782
1 143
4 266
1 229
6 638
754
574
1 718
3 046
874
921
2 032
3 827
16
141
310
467
1 116
3 192
684
4 992
30
921
952
I 201
3 074
924
953
1 231
3 108
259
985
757
2 001
30
2 345
4 002
4 477
10 824
4 480
10 972
6 386
21 838

14. 7. 80 Official Journal of the European Communities No C 174/45
TABLE 30
• Stocks of coal at power stations
(End of September 1979) --
30. 9_ 19n 30. 9. 1979 Difference
(I 000 tonnes) 197911978 I 000 tonnes Days (I 000 tonnes)
Belgium 863 752 56 - Ill
Denmark 2477 2 915 180 + 438
Germany (FR) 6 086 6 100 50 + 14
France 5 837 4 780 70 - I 057
Ireland - -- - -
Italy 935 350 38 - 585
Luxembourg - - - -
Netherlands 300 300 80 -
United Kingdom 20422 15 726 62 - 4 696 ---
Community 36 920 30 923 64 - 5 997

Bal
ance
of
supp
ly a
nd d
eman
d: h
ard
coal
, 19
80
Bel
gium
D
enm
ark
G
erm
any
F
ran
ce
Irel
and
(F
R)
I.
Pro
duct
ion
(t =
t)
6 32
0 -
93 5
00
17 7
50
60
(nat
iona
l se
ries
) -
-(8
6 00
0)
--
2.
Rec
over
ies
2 05
0 -
600
I 80
0 -
3.
Rec
eipt
s fr
om o
ther
EC
SC
cou
n-tr
ies
3 52
0 90
0 I
100
6 17
0 20
0 4.
Im
port
s fr
om t
hird
cou
ntri
es
5 55
5 8
900
6 50
0 21
300
85
0
5.
Tot
al a
vail
abil
itie
s 17
445
9
800
101
700
47 0
20
I 11
0
6.
Inla
nd
dem
and
: (a
) po
wer
sta
tion
s at
min
es
350
-II
300
7
300
-
(b)
publ
ic p
ower
sta
tion
s 4
900
8 40
0 28
100
17
500
60
(c
) C
okin
g pl
ants
7
900
-34
700
12
600
-
(d) i
ron
and
ste
el i
ndus
try
120
-I
500
I 45
0 -
(of
whi
ch p
ower
sta
tion
s)
(-)
(-)
(I 2
00)
(250
) (-)
(e)
othe
r in
dust
ries
I
900
870
6 60
0 2
150
35
(of
whi
ch p
ower
sta
tion
s)
(-)
(-)
(4 0
00)
(-)
(-)
(f)
dom
esti
c he
atin
g I
630
20
I 00
0 2
450
970
(g)
mis
cell
aneo
us:
I. is
sues
to
wor
kers
15
-
250
120
-2.
pa
tent
fuel
pla
nts
105
-I
500
I 95
0 -
3.
own
cons
umpt
ion
at m
ines
10
-
300
280
-4.
ga
swor
ks
-90
50
0 -
45
5.
rail
way
s 5
-10
0 20
-
6.
othe
rs
--
800
--
Tot
al
16 9
35
9 38
0 86
650
45
820
I
I 10
7.
Del
iver
ies
to o
ther
EC
SC
cou
ntri
es
285
-13
415
38
0 -
8.
Exp
orts
to
thir
d co
untr
ies
70
-I
350
50
-
9.
Tot
al r
equi
rem
ents
17
290
9
380
101
415
46 2
50
I 11
0
10.
Pro
duce
rs' s
tock
s (b
egin
ning
) !5
5 ..
12
600
3
940
30
II.
Add
itio
ns/w
ithd
raw
als
from
sto
cks
+
155
(+
420)
+
28
5 +
77
0 -
12.
Pro
duce
rs' s
tock
s (e
nd)
310
..
12 8
85
4 71
0 30
-·-
Ital
y L
ux
emb
ou
rg
Net
her
lan
ds
--
-
--
--
--
2 40
0 20
0 I
250
II 6
90
ISO
4
740
1409
0 35
0 5
990
--
-4
250
5 2
300
9 50
0 -
3 45
0 15
34
0 -
(-)
(-)
(-)
160
-14
0 (-)
(-)
(-)
135
5 10
0
--
-
10
--
--
-
--
-
20
--
--
-
14 0
90
250
5 99
0
--
-
--
-
14 0
90
350
5 99
0
--
--
--
--
-
Un
ited
Kin
g-d
om
123
500 -
I 50
0
350
5 70
0
131
050
200
88 0
00
17 2
20
200
(100
) 9
600
(2 8
00)
10 2
00
I 80
0 I
100
800
- 40
-
129
160
2 01
0 23
0
131
400
9 70
0 -
350
9 35
0
(J 0
00 t
onne
s)
Co
mm
un
ity
241
130
-
5 95
0
(16
090)
65
385
312
465
19 1
50
!53
515
85 3
70
3 62
5 (I
550
) 21
455
(6
800
) 16
510
2 18
5 4
665
I 39
0 63
5 18
5 80
0
309
485
(16
090)
I
700
311
185
26 4
25
+
860
27 2
85
z 0 n 0 a (") §.:
......
0 c .... ;:; e:..
0 ....,
;.
0 tTi
c .... 0 '0
0 "' ;:; n 0 3 3 c g. ;;;·
Cll

Co
al-
Intr
a-C
omm
unit
y ex
chan
ges
1980
-~om
Bel
gium
D
enm
ark
Ger
man
y Fr
ance
Ir
elan
d To
(F
R)
Bel
gium
-
-3
270
60
-
Den
mar
k
--
750
--
Ger
man
y (
FR
) 20
0 -
-25
0 -
Fra
nce
75
-
5 49
5 -
-
Irel
and
-
--
--
Ital
y 10
-
2 35
0 20
-
Lu
xem
bo
urg
-
-16
0 40
-
Net
her
lan
ds
--
I 04
0 10
-
Un
ited
Kin
gd
om
-
-35
0 -
-
To
tal
deli
veri
es
285
-13
415
38
0 -
... -
Ital
y L
uxem
-N
ethe
r-bo
urg
land
s
--
-
--
-
--
-
--
-
--
-
--
-
--
-
--
-
--
-
--
-
Uni
ted
Kin
gdom
190
150
650
600
200 20
- 200 -
2 01
0
(I
000
ton
ne
s)
Tot
al
rece
ipts
3 52
0
900
I 10
0
6 17
0
200
2 40
0
200
I 25
0
350
16 0
90
0 s (l §.:
.......
0 c .... ::l a 0 ....,
&
(1) m
t: .... 0 '0
(1) § n 0 3 3 t: g. ;:;;· "' z 0 n

I.
Pro
du
ctio
n
-C
oke-
oven
cok
e
-ga
s co
ke
Tot
al
ceip
ts f
rom
oth
er
2.
Re
EC: S
C c
ount
ries
3.
Im p
orts
fro
m t
hir
d c
ount
ries
--------
Bel
giu
m
6 12
0
t -
6 12
0
I 30
0 50
4.
To
t ---------~~--
5.
lnl
(a)
(b)
(c)
(d)
,; "
'ib
bil
i<ie
; ---
j-74
70
and
dem
and
iron
an
d s
teel
ind
ustr
y 6
510
oth
er i
ndus
trie
s
do
mes
tic
user
s
mis
cell
aneo
us
-is
sues
to
wor
kers
-o
wn
co
nsu
mp
tio
n
-ot
hers
6.
De
EC: li
veri
es t
o o
ther
S
C c
ount
ries
7.
Ex
port
s to
thi
rd c
ou
ntr
ies
--------------
X.
Tot
al r
equi
rem
ents
9.
Pro
du
cers
' sto
cks
(beg
inn
ing
)
Tot
al
dit
ion
s/w
ith
dra
wal
s fr
om s
tock
s 10
. A
d
II.
Pro
du
cers
' sto
cks
(en
d)
I
_ _j_
230 20 5 5 -
6 77
0
200
500
7 47
0
130 - 130
Bal
ance
of
supp
ly a
nd d
eman
d: c
oke,
198
0
Den
mar
k
Germ
an
y
Fra
nce
Ir
elan
d
(FR
)
-27
000
10
250
-
60
375
-35
60
27 3
75
10 2
50
35
110
500
2 48
5 10
-40
0 -
-
170
28 2
75
12 7
35
45
35
19 0
00
10 2
65
10
45
I 40
0 I
100
5
30
I 15
0 10
0 4
-60
0 13
0 -
10
250
350
I
-25
0 10
-
120
22 6
50
II 9
55
20
-5
580
480
-
50
I 52
0 30
0 25
170
29 7
50
12 7
35
45
-6
619
I 00
0 -
--
I 47
5 -
-
-5
144
I 00
0 -
Ita
I)
Luxem~
bo
urg
7 20
0 -
--
7 20
0 -
200
2 17
5
-20
0
7 40
0 2
375 --
6 05
5 2
370
450
3
240
2
10
-
50
-
--
-
6 80
5 2
375
15
-
580
-
7 40
0 2
375
400
--
-
400
-
(I 0
00 t
on
ne
sJ
'\ic
rhcr
-U
nit
ed
Co
mm
un
ity
la
nd
s K
inl!
dnrn
c
·-------
--
2 70
0 12
975
66
245
--
470
--
2 70
0 12
975
66
715
----------
300
I 10
(7
090
)
100
--
750
-~
-----
3 10
0 12
985
67
465
--
2 16
0 8
500
54 9
05
I
220
950
4 40
3
8 2
450
4 00
4
--
745
2 24
0 90
8
--
260
---------~------
2 39
0 12
140
65
225
--------
-
I 57
0 24
5 (7
090
)
140
600
3 71
5
3 10
0 12
985
68
940
25
I 95
0 10
124
--
-I
475
25
I 95
0 8
649
. -·
z 0 (")

-...
......
Co
ke-
ov
en c
ok
e-
Intr
a-C
om
mu
nit
y e
xch
ang
es 1
980
(1 0
00 t
onne
s)
Fro
m
I B
elgi
um
Den
mar
k
Ger
man
y
Fra
nce
Ir
elan
d
Ital
y L
ux
em-
Net
her
-
I U
nit
ed
To
tal
-------
(FR
) b
ou
rg
lan
ds
Kin
gd
om
re
ceip
ts
-==::____~-------
To
-----------------
I
Bel
gium
-
-I
050
100
--
-10
0 50
I
300
--t-
r-----~-----·---------------
Den
mar
k -
-30
60
-
--
-20
11
0
-------r--6
0
--
----
----
--
200
--
--!5
0 90
50
0 --
r--
Ger
man
y (
FR
)
Fra
nce
125
-I
965
--
15
-32
0 60
2
485
Irel
and
-I
--
--
--
-10
10
---------
-
Ital
y --
-12
5 75
-
--
--
200
--
Lux
embo
urg
5 -
2 17
0 -
--
--
--2
175
----------------
10
-23
5 40
-
--
-I
15
300
--c-
--
570
I
--
5 5
--
--
10
c--·
~-
--~
tven
es
200
-5
580
480
-15
-
245
7 09
0
Net
herl
ands
Uni
ted
Kin
gdom
Tot
al d
el -
z 0 0

EURONORMS
The Commission of the European Communities (ECSC) has published the following new EURONORMS in German, English, French, Italian and Dutch. The EURONORMS which are available up to the present in English are indicated by an asterisk(*). Sales prices valid from I July 1976.
("") EURONORM 3-79 ("") EURONORM 4-79 (*) EURONORM 5-79 (*) EURONORM 18-79
("") EURONORM 82-79
(*) EURONORM 95-79 (*) EURONORM 96-79 ('') EURONORM 132-79
n EURONORM 133-79
n EURONORM 138-79 (") EURONORM 141-79
(*) EURONORM 142-79
("") EURONORM 143-79
(''") EURONORM 144-79
("") EURONORM 147-79
(''·) EURONORM 148-79
Brinell hardness test for steel - second edition Rockwell hardness test for steel (Scales A, C, B, F) -second edition Vickers hardness test for steel - second edition . Selection and preparation of samples and test pieces for steel and iron and steel products -second edition · Steel for the reinforcement of concrete with an improved bonding action - Dimensions, Mass, Tolerances- General requirements (Sheet I -Sheet 2) Heat resisting steels - Quality requirements . Tool steels- Quality requirements Cold-rolled steel strip for springs - Quality requirements Round wire rod in non-alloy and alloy steel for the manufacture of wire for covered electrodes, for gas-shielded arc welding and for submerged arc welding - Quality standard Prestressing steels Austenitic stainless steel plate and strip for application at low temperature - Technical conditions of delivery . Continuous hot-dip zinc coated unalloyed mild steel sheet and coil for cold forming -Quality standard Continuous hot-dip zinc coated unalloyed mild steel sheet and coil for cold forming -Tolerances on dimensions and shape . Round wire rod in stainless and heat resisting steel intended for the production of welding consumables - Quality standard . Continuous hot-dip zinc-coated unalloyed steel sheet and and coil with specified minimum yield strengths for structural purposes - Quality standard
Continuous hot-dip zinc-coated unalloyed steel sheet and coil with specified minimum yield strengths for structural purposes - Tolerances on dimensions and shape
Price in£
1·30 1·30 1·40
2·00
1·80 2·70 4·00 1·80
1·00 3·75
2·40
2·00
1·30
0·80
I· 80
1·20
\ ,,

The following is a list of all the EURONORMS so far published:
("") Information circular No I EURONORM EURONORM EURONORM EURONORM EURONORM EURONORM EURONORM EURONORM EURONORM EURONORM
EURONORM EURONORM EURONORM EURONORM
EURONORM
EURONORM
EURONORM EURONORM
("") EURONORM (") EURONORM
EURONORM EURONORM EURONORM EURONORM
(") EURONORM EURONORM
EURONORM
EURONORM EURONORM EURONORM
EURONORM EURONORM
EURONORM
EURONORM
EURONORM
EURONORM
EURONORM
EURONORM
EURONORM EURONORM EURONORM EURONORM
EURONORM EURONORM
EURONORM
EURONORM EURONORM EURONORM EURONORM
1-55 2-57 3-55 4-55 5-55 6-55 7-55 8-55 9-55
11-55
12-55 13-55 14-67 15-70
16-70
17-70
18-57 19-57 20-74 21-78
22-70 23-71 24-62 25-72 27-74 28-69
29-69
30-69 31-69 33-70
34-62 36-62
37-62
38-62
40-62
41-65
42-66
43-72
44-63 45-63 46-68 48-65
49-72 50-72
51-70
52-67 53-62 54-63 55-63
Standard samples for the chemical analysis of iron and steel products, second edition (197 4) Fontes et ferro-alliages Essai de traction pour l'acier Essai de durete Brinell pour l'acier Essai de durete Rockwell, echelles B etC pour l'acier Essai de durete Vickers pour l'acier Essai de pliage pour l'acier Essai de resilience Charpy pour l'acier Valeurs de conversion approximatives de Ia duree et Ia resistance a Ia traction de l'acier Valeurs de conversion approximatives des allongements apres rupture de l'acier Essai de traction sur toles et feuillards en acier d'une epaisseur de 0,5 mm indus a 3 mm exclus Essai de pliage des toles et feuillards en acier d'epaisseur inferieure a 3 mm Essai de pliage alternc des toles et feuillards en acier d'epaisseur inferieure a 3 mm Essai d'emboutissage a flans bloques Fil machine en acier non allie d'usage general, destine au trefilage ou a l'etirage- Examen de Ia surface Fil machine en aCier non allie d'usage general, destine au trefilage ou a l'etirage Nuances et qualites Fil machine en aCier non allie d'usage general, destine au trefilage ou a l'etirage Dimensions et tolerances Prelevements et preparation des echantillons et des eprouvettes Poutrelles IPE - Poutrelles a ailes paralleles Definition and classification of grades of steel, second edition General technical delivery requirements for steel and iron and steel products - second edition Determination ou verification de Ia limite d'elasticite de l'acier a temperature elevee Essai de trempabilite par trempe en bout de l'acier- Essai Jominy Poutrelles normales et profiles en U normaux- Tolerances de laminage Aciers de construction d'usage general Designation of steels, third edition Toles et bandes en aCiers non allies pour chaudieres et appareils soumis a pressiOn -Nuances et qualites Toles en acier laminees a chaud d'epaisseur egale ou superieure a 3 mm- Tolerances sur les dimensions, Ia forme et le poids Demi-produits pour forges en aciers de construction d'usage general- Nuances et qualites Demi-produits pour forges- Tolerances sur les dimensions, Ia forme et le poids Toles et larges bandes d'epaisseur inferieure a 3 mm, en acier doux non allie pour emboutissage ou pliage a froid- Tolerances sur les dimensions et sur Ia forme Poutrelles a larges ailes a faces paralleles -Tolerances de laminage Analyse chimique des materiaux siderurgiques - Dosage du carbone total dans les aciers et les fontes- Methode gravimetrique apres combustion dans un courant d'oxygene Analyse chimique des materiaux siderurgiques - Dosage du carbone total dans les aciers et les fontes- Methode gazometrique apres combustion dans un courant d'oxygene Analyse chimique des materiaux siderurgiques - Dosage du carbone de trempe et du graphite dans les aciers et les fontes - Methode gravimerrique et volumerrique apres combustion dans un courant d'oxygene Analyse chimique des materiaux siderurgiques - Dosage du silicium total dans les aciers et les fontes - Methode gravimetrique Analyse chimique des materiaux siderurgiques - Dosage du phosphore dans les aciers et les fontes - Methode alcalimetrique Analyse chimique des mathiaux siderurgiques - Dosage du soufre dans les aciers et les fontes- Methode apres combustion dans un courant d'oxygene Toles et bandes en aciers allies pour chaudieres et appareils soumis a pression- Nuances et qualites Poutrelles IPE laminees a chaud- Tolerances de laminage Essai de choc sur eprouvette bi-appuyee a entaille en V Feuillards a chaud en aciers doux non allies- Norme de qualite, precriptions generales Feuillards lamines a chaud en aciers non allies- Tolerances sur les dimensions, Ia forme et le poids Mesure de Ia rugosite des produits minces en acier lamines a froid et non revetus Analyse chimique des materiaux siderurgiques - Dosage de !'azote dans les aCiers -Methode spectrophotometrique Bandes laminees a chaud de largeur egale ou superieure a 600 mm - Toleranc~s sur les dimensions, Ia forme et le poids Vocabulaire du traitement thermique . Poutrelles a larges ailes a faces paralleles Petits fers U lamines a chaud Fcrs T a ailes egales et a coins arrondis lamines a chaud
1· 85 I· 35 0·85 0·60 0·60 0·60 0·60 0·60 0·60 0·60
0·75 0·60 0·60 0·60
0·60
0·75
1·60 0·60 0·60 1·20
1 . 80 0·75 I· 35 0·60 I· 85 I· 80
I· 20
0·85 I· 00 0·60
0·75 0·60
0·60
0·75
0·60
0·60
0·60
0·60
1·10 0·60 0·60 1·10
0·60 0·60
0·85
0·60 8 ·IS 0·60 0·60 0·60

(") EURONORM ('') EURONORM ('') EURONORM ("") EURONORM ("") EURONORM
EURONORM EURONORM EURONORM
(''") EURONORM EURONORM
EURONORM
EURONORM
EURONORM
(") EURONORM
EURONORM
EURONORM EURONORM EURONORM EURONORM EURONORM EURONORM EURONORM EURONORM EURONORM EURONORM EURONORM
EURONORM (''") EURONORM
EURONORM EURONORM EURONORM
56-77 57-78 58-78 59-78 60-77 61-71 65-67 66-67 67-78 70-71
71-71
72-71
74-72
75-78
76-66
79-69 80-69 81-69 83-70 84-70 85-70 86-70 87-70 88-71 89-71 90-71
91-70 92-75 93-71 94-73 98-71
EURONORM 100-72
EURONORM 103-71 EURONORM 104-70
EURONORM 105-71 EURONORM 106-71
('') EURONORM 107-75 EURONORM 108-72
EURONORM 109-72
('') EURONORM 111-72
EURONORM 113-72 EURONORM 114-72
EURONORM 116-72 (''") EURONORM 117-75
(*) EURONORM 118-75
EURONORM 119-74
EURONORM 120-72 EURONORM 121-72
(") EURONORM 122-75 ('') EURONORM 123-75
Hot-rolled equal angles (with radiused root and toes) - second edition Hot-rolled unequal angles (with radiused root and toes)- second edition Hot-rolled flats for general purposes - second edition Hot-rolled square bars for general purposes - second edition Hot-rolled round bars for general purposes - second edition Hexagones lamines a chaud Barres rondes laminees a chaud pour vis et rivets . Demi-ronds et demi-ronds aplatis, lamines a chaud Hot-rolled bulb flats - second edition Analyse chimique des· materiaux siderurgiques - Dosage du manganese dans les aciers et les fontes - Methode photometrique Analyse chimique des materiaux siderurgiques - Dosage du manganese dans les aciers et les fontes - Methode electrometrique . . . . . . . . . . . . . . . Analyse chimique des materiaux siderurgiques - Dosage de ]'aluminium dans les aciers -Methode gravimetrique Analyse chimique des materiaux siderurgiques - Dosage du cuivre dans les aciers et les fontes - Methode photometrique . . . . . . . . . . . . . . . . . . . Chemical analysis of ferrous materials - Determination of the molybdenum in steels and cast irons - Photometric method - . Analyse chimique des materiaux siderurgiques - Dosage du silicium dans les aciers et les fontes - Methode spectrophotometrique Definitions et classification des produits siderurgiques par formes et dimensions Aciers pour armatures passives du beton - Prescriptions de qualite Ronds a beton lisses lamines :l. chaud - Dimension, poids, tolerances Aciers pour trempe et revenu - Prescriptions de qualite Aciers de cementation - Prescriptions de qualite Aciers de nitruration - Prescriptions de qualite . Aciers pour trempe par induction ~t au chalumeau - Prescriptions de qualite Aciers de decolletage- Prescriptions de qualite (fascicules I a 4) Aciers inoxydables - Prescriptions de qualite Aciers allies pour ressorts formes :l. chaud et traites - Prescriptions de qualite Aciers pour soupapes d'echappement de moteurs a combustion interne - Prescriptions de qualite Larges plats lamines a chaud- Tolerances sur les dimensions, Ia forme et le poids Hot-rolled flats for spring leaves Barres rondes, carrees, plates et hexagonales laminees a chaud- Tolerances de laminage Aciers pour roulements - Prescriptions de qualite Analyse chimique des materiaux siderurgiques - Dosage du manganese dans le ferromanganese - Methode electrometrique Analyse chimique des materiaux siderurgiques - Dosage du chrome dans les aciers et les fontes - Methode photometrique Determination micrographique de Ia grosseur du grain ferrique ou austenitique des aciers Determination de Ia profondcur de decarburation des aciers de construction non allies et faiblement allies . Determination et verification de Ia profondeur conventionnelle de cementation Bandes et toles magnetiques a grains non orientes, laminees a froid et a chaud Grain oriented magnetic sheet and strip Fil machine rond en acier pour articles de boulonnerie formes a froid - Dimensions et tolerances Essais conventionnels de durete Rockwell - Echelles Rockwell HRN et HRT - Echelles Rockwell HRB' et HR 30 T' pour produits minces Continuously hot-rolled non-coated mild unalloyed steel sheet and strip for cold-forming - Quality standard . . . . . . . . . . . . . . . . . . . . . . . . Aciers de construction soudables de qualite speciale - Fascicules I a 3 Determination de Ia resistance a Ia corrosion intergranulaire des ac1ers inoxydables austenitiques - Essai de corrosion en milieu acide sulfurique-sulfate cuivrique ( essai dit de Monypenny-StrauB) Determination de Ia profondeur conventionnelle de trempe apres chauffage superficiel Calibration of reference blocks for use with Rockwell hardness testing machines (B, C, N and T scales) . Methods for determining the magnetic properties of magnetic steel sheet with the 25 em Epstein square Aciers pour frappe a froid et extrusion a froid - Prescriptions de qualite - fascicule I a fascicule 5 Toles et bandes pour bouteilles a gaz. soudees en acier Determination de Ia resistance a l'attaque intergranulaire des aciers inoxydables austenitiques - Essai de corrosion en milieu nitrique par mesure de perte de masse (Essai dit de Huey) Verification of Rockwell hardness testing machines (B, C, Nand T scales) High temperature tests - Creep test for steel
0·60 0·80 0. 80 0· 80 0·60 0·60 0·60 0·60 0·80
0·60
0·60
0·60
0·60
0·80
0·60 0·85 1·10 0·60 2·70 2·20 1·00 I· 70 2·20 I· 85 1-10
0·85 0·60 0·60 0·60 0·60
0·60
0·60 3 ·15
0·60 0·60 1·70 2·20
0·60
1·10
0·80 2·20
0·60 0·60
1·70
1·70
4-40 0·60
0·60 1·70 1·10
-~

C) EURONORM 124-77 Verification of Vickers hardness-testing machines
C) EURONORM 125-77 Verification of Brinell hardness-testing machines
C) EURONORM 126-77 Semi-processed steel strip for the construction of magnetic circuits
("") EURONORM 127-77 Calibration of reference blocks for use with Vickers hardness-testing machines
("") EURONORM 128-77 Calibration of reference blocks for use with Brinell hardness-testing machines
("") EURONORM 129-76 Nickel alloy steel plate and strip for application at low temperature requirements
Quality
C) EURONORM 130-77 Cold-rolled non-coated mild unalloyed steel flat products for cold forming - Quality
0·80
0·60
I ·60
0. 80
0·80
I· 70
standard 0 · 60
("") EURONORM 131-77 Cold-rolled non-coated mild unalloyed steel flat products for cold forming- Tolerances on dimensions and shape 0 · 60
("') FURONORM 134-78 Chemical analysis of ferrous materials - Determination of aluminium in non-alloy steels - Method by atomic absorption spectrophotometry- 0 · 80
C) EURONORM 145-78 Tinplate and blackplate in sheet form- Qualities, dimensions and tolerances- 2 · 65
These publications can be obtained from the national standards institutions, viz.
in the Federal Republic of Germany:
in Belgium and Luxembourg:
in Denmark:
in France:
in Ireland:
in Italy:
in the Netherlands:
in the United Kingdom:
Beuth-Verlag GmbH Burggrafenstralle 4-10, I Berlin 30
Institut beige de normalisation - IBN -avenue de Ia Braban~onne 29, I 040 Bruxelles
Dansk Standardiseringsrad, Aurehojvej 12, DK-2900 Hellerup
Association fran~aise de normalisation- AFNORTour Europe, Cedex 7, 92080 Paris
Institute for Industrial Research and Standards, Ballymun Road, Dublin 9
Ente Nazionale Italiano di unificazione- UNIPiazza A. Diaz, 2, Milan
Nederlands, Normalisatie-Instituut- NNIPolakweg 5, Rijswijk (ZH)
British Standards Institution (BSI), 2 Park Street, London WIA 2BS
Interested residents of third countries are asked to contact the Office for Official Publications of the European Communities, Boite postale I 003, Luxembourg I.

Annual subscription Price per single copy
'Annex-OJ Debates
'L + C' Supplement (March
Sales and 'Subscription Offices National (calendar (Notices 1980-Febru-
currencies and public ary1981i I - 32 33- 80 81 or more year) contracts) Full report pages pages pages
1980 of sessions calendar of the
year 1980 European Parliament
UNITED KINGDOM £ 61·00 26·00 21·25 0·60 1·20 Subscriptions'' Sale of single copies: HM Stationery Office- PO Box 569 London SEI 9NH- Tel. 01-928 69 77, ext. 365 National Giro account No 582~1002
BELGIUM Bfrs 4 000,- 1 700,- 1400,- 40,- 80,-Moniteur beige- 40~42, rue de Lou vain I 000 Bruxelles - Belgisch Staatsblad - Leuvense-stra.:a 40-42 - I 000 Brussel - Postal cheque account: 000-200 5502-27 -Tel. 512 00 26
DENMARK Dkr 700,- 300,- 252,- 7,20 14,40
Subscriptions* Sale of single copies: J. H. Schultz- Boghandel- M0ntergade 19 DK 1116 K0benhavn K- Tel. 14-11-95
FRANCE FF 580,- 250,- 204,- 5,80 11,60 ... v >
Servin· de vente en France des publications des 0
Commun·autes europeennes- Journal officiel u c: 26, rue Desaix- 75732 Paris Cedex IS 0
Tel. 5 78 61 39- Post.al cheque account: Paris 23-96 -o v GERMANY DM 252,- 108,- 87,50 2,50 5,- c
Bundesanzeiger- 5000 Koln I - Breite StraBe ·;: 0..
Tel. (02 21) 21 03 48 -o Postfach I 08/006 c: T dex: Anzeiger Bonn 08 882 595 "' Postal cheque account: 83 400 Koln v
~ IRELAND £ Ir1 66·40 28·00 23-25 0·70 1·40 u
..c Subscriptions* u
"' v Sale of single copies: 8 Government Publications WJ Sales Office c: G.P.O. Arcade- Dublm I "2 or by post from 0
u Stationery Office
u
"' Dublin 4- Ireland- Tel. 78 96 44 -o v ITALY Lit 113 000 48 500 39 100 1 120 2 240 c:
Subscriptions* '§ v
Sale of single copies: v -o
Libreria dello Stato v Piazza G. Verdi, 10-00198 Rome- Tel. (06) 85 08
u ·;:
Postal cheque account: 38700 I 0...
LUXEMBOURG Lfrs 4 000,- 1 700,- 1400,- 40,- 80,-Subscriptions to the 0 J may be arranged and paid for at Post Offices
Sale of single copies: Office for Official Publications of the European Communities -TeL 49 00 81 Boite postale 1003- Luxembourg and 5, rue du Commerce Postal cheque accoum: 19 190-81 Bank current account: B.I.L 8-109/6003/300
NETHERLANDS Fl 273,- 117,- 96,- 2,80 5,60 Staatsdrukkerij- en Uitgeverijbedrijf Christoffel Plantijnstraat- The Hague Tel. (070) 78 99 II- Postal cheque account· 42 53 00
OTHER COUNTRIES Bfrs 4 000,- 1 700,- 1400,- 40,- 80,-
Subscriptions and sale of single copies''
• Office for Official Publications of the European Communities-Tel. 49 00 81 Bolte postale I 003 - Luxembourg Special mailing charges are invoiced separately Postal cheque account: 19 190-81 Bank currt-nt account: B.I.L 8-109/6003/300
Other European Communities' publications on sale, whether periodical or otherwise, may be obtained at the abovementioned Offices. Price lists sent free on request.
OFFICE FOR OFFICIAL PUBLICATIONS OF THE EUROPEAN COMMUNITIES- Boite postale 1003, LUXEMBOURG
I