OFFICE OF THE DIRECTOR OF NATIONAL INTELLIGENCE …
28
ANNUAL DEMOGRAPHIC REPORT: OFFICE OF THE DIRECTOR OF NATIONAL INTELLIGENCE Hiring and Retention of Minorities, Women, and Persons with Disabilities in the United States Intelligence Community FISCAL YEAR 2017 This report was prepared by the Office of Intelligence Community Equal Employment Opportunity and Diversity (IC EEOD) in the Office of the Director of National Intelligence (ODNI). Please direct inquiries regarding this report to the ODNI Office of Legislative Affairs at (703) 275-2474.
Transcript of OFFICE OF THE DIRECTOR OF NATIONAL INTELLIGENCE …

ANNUAL DEMOGRAPHIC REPORT:
OFFICE OF THE DIRECTOR OF NATIONAL INTELLIGENCE
Hiring and Retention of Minorities, Women, and Persons with Disabilities in the United States Intelligence Community
FISCAL YEAR 2017
This report was prepared by the Office of Intelligence Community Equal Employment Opportunity and Diversity (IC EEOD) in the Office of the Director of National Intelligence (ODNI). Please direct inquiries regarding this report to the ODNI Office of Legislative Affairs at (703) 275-2474.


(U) TABLE OF CONTENTS
EXECUTIVE SUMMARY 2
INTRODUCTION 6
INDIVIDUALS EMPLOYED IN THE IC 10
INDIVIDUALS EMPLOYED IN THE IC BY PAY GRADE 12
INDIVIDUALS HIRED BY THE IC ELEMENTS 16
APPENDIX–DIVERSITY AND INCLUSION 20
1FY 2017 DEMOGRAPHIC REPORT
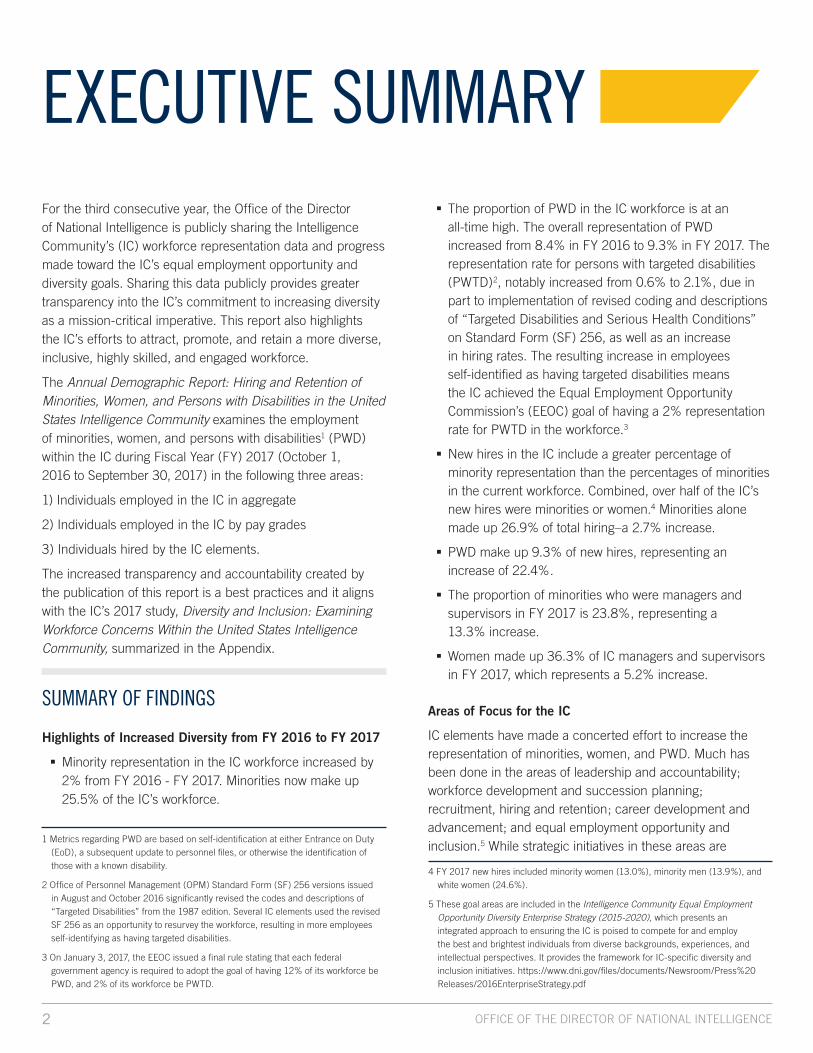
EXECUTIVE SUMMARYFor the third consecutive year, the Office of the Director of National Intelligence is publicly sharing the Intelligence Community’s (IC) workforce representation data and progress made toward the IC’s equal employment opportunity and diversity goals. Sharing this data publicly provides greater transparency into the IC’s commitment to increasing diversity as a mission-critical imperative. This report also highlights the IC’s efforts to attract, promote, and retain a more diverse, inclusive, highly skilled, and engaged workforce.
The Annual Demographic Report: Hiring and Retention of Minorities, Women, and Persons with Disabilities in the United States Intelligence Community examines the employment of minorities, women, and persons with disabilities1 (PWD) within the IC during Fiscal Year (FY) 2017 (October 1, 2016 to September 30, 2017) in the following three areas:
1) Individuals employed in the IC in aggregate
2) Individuals employed in the IC by pay grades
3) Individuals hired by the IC elements.
The increased transparency and accountability created by the publication of this report is a best practices and it aligns with the IC’s 2017 study, Diversity and Inclusion: Examining Workforce Concerns Within the United States Intelligence Community, summarized in the Appendix.
SUMMARY OF FINDINGS
Highlights of Increased Diversity from FY 2016 to FY 2017
� Minority representation in the IC workforce increased by 2% from FY 2016 - FY 2017. Minorities now make up 25.5% of the IC’s workforce.
� The proportion of PWD in the IC workforce is at an all-time high. The overall representation of PWD increased from 8.4% in FY 2016 to 9.3% in FY 2017. The representation rate for persons with targeted disabilities (PWTD)2, notably increased from 0.6% to 2.1%, due in part to implementation of revised coding and descriptions of “Targeted Disabilities and Serious Health Conditions” on Standard Form (SF) 256, as well as an increase in hiring rates. The resulting increase in employees self-identified as having targeted disabilities means the IC achieved the Equal Employment Opportunity Commission’s (EEOC) goal of having a 2% representation rate for PWTD in the workforce.3
� New hires in the IC include a greater percentage of minority representation than the percentages of minorities in the current workforce. Combined, over half of the IC’s new hires were minorities or women.4 Minorities alone made up 26.9% of total hiring–a 2.7% increase.
� PWD make up 9.3% of new hires, representing an increase of 22.4%.
� The proportion of minorities who were managers and supervisors in FY 2017 is 23.8%, representing a 13.3% increase.
� Women made up 36.3% of IC managers and supervisors in FY 2017, which represents a 5.2% increase.
Areas of Focus for the IC
IC elements have made a concerted effort to increase the representation of minorities, women, and PWD. Much has been done in the areas of leadership and accountability; workforce development and succession planning; recruitment, hiring and retention; career development and advancement; and equal employment opportunity and inclusion.5 While strategic initiatives in these areas are
1 Metrics regarding PWD are based on self-identification at either Entrance on Duty (EoD), a subsequent update to personnel files, or otherwise the identification of those with a known disability.
2 Office of Personnel Management (OPM) Standard Form (SF) 256 versions issued in August and October 2016 significantly revised the codes and descriptions of “Targeted Disabilities” from the 1987 edition. Several IC elements used the revised SF 256 as an opportunity to resurvey the workforce, resulting in more employees self-identifying as having targeted disabilities.
3 On January 3, 2017, the EEOC issued a final rule stating that each federal government agency is required to adopt the goal of having 12% of its workforce be PWD, and 2% of its workforce be PWTD.
4 FY 2017 new hires included minority women (13.0%), minority men (13.9%), and white women (24.6%).
5 These goal areas are included in the Intelligence Community Equal Employment Opportunity Diversity Enterprise Strategy (2015-2020), which presents an integrated approach to ensuring the IC is poised to compete for and employ the best and brightest individuals from diverse backgrounds, experiences, and intellectual perspectives. It provides the framework for IC-specific diversity and inclusion initiatives. https://www.dni.gov/files/documents/Newsroom/Press%20Releases/2016EnterpriseStrategy.pdf
2 OFFICE OF THE DIRECTOR OF NATIONAL INTELLIGENCE

producing positive results, there is still work to do, especially in terms of increasing the representation of minorities, women, and PWD in higher pay grades and in senior level executive positions.
� The overall percentage of minorities (25.5%) in the IC is below comparable external benchmarks, such as the Federal Workforce (35.4%), Civilian Labor Force (32.5%) and the U.S. Population (38.2%).6
� The shares of minorities (23.8%) and PWD (9.8%) among employees who left the IC increased in FY 2017. For PWD, the share of attrition outpaced their share of hiring.
� There is a low proportion of minorities and PWD at higher pay grades. Their representation rates drop off at the GS/GG-15 and senior pay levels.
� Minorities earn fewer promotions than expected for their rate of representation in the workforce. Minorities make up 25.5% of the IC workforce, but earned 23.9% of promotions. The shares of overall promotions for women and minorities both decreased from FY 2016 to FY 2017.
� The representation of women in the IC workforce remains unchanged, holding steady at 38.5% for the last four years.
� The share of women hires is 38.8%, representing a 1.0% decrease from FY 2016.
ONGOING IMPACT INITIATIVESThe IC is committed to increasing diversity and fostering inclusion in its workforce. The IC engages in a broad range of strategic initiatives to increase the representation of minorities, women, and PWD. While individual IC elements require unique skills to advance their missions, collective use of enterprise solutions across intelligence disciplines is more likely to yield workforce diversity and the competitive advantage it brings.
Creating a culture within the IC that promotes equal employment opportunity, diversity, and inclusion is the responsibility of every intelligence officer. By employing a multi-agency approach across all 17 elements of the IC, the IC is positioned to build and maintain the talent and capabilities necessary to accomplish its mission. The following are highlights of IC diversity and inclusion activities.
Collaborative IC Recruitment and Outreach Events Reach a Broad Network.
The IC continued to nurture existing relationships with minority-serving institutions and professional organizations. The IC sponsored diversity, critical language, and science, technology, engineering, and math (STEM) focused events. In addition to individual IC elements’ recruitment and outreach events, the IC sponsored events with combined IC-wide participation. Collectively, these events provided the IC with the opportunity to reach over 28,000 individuals. The FY 2017 recruitment and outreach events included the following:
� Hispanic Association of Colleges and Universities Annual Conference – October 2016
� Keynote address by Former Director of National Intelligence James R. Clapper at Morehouse College and Miles College – November 2016
� Society of Hispanic Professional Engineers Conference – November 2016
� American Council of Teachers of Foreign Languages Career Fair – November 2016
� American Indian Science & Engineering Society Conference – November 2016
� Out in Science, Technology, Engineering, and Mathematics Conference – November 2016
� Ygnite Korean-American Scientists and Engineering Association Young Generation Technical and Leadership Conference – January 2017
� Morehouse/Spelman College Career Fair – February 2017
� Boren Forum National Security Education Program Alumni Career Night – March 2017
� Women in Cybersecurity Career Fair – March 2017
� Conference on Asian and Pacific American Leadership Internship Program Career Fair – July 2017
� Black Data Processing Associates Conference – July 2017
� Summer IC Student Program Virtual Career Fair – August 2017
� Congressional Black Caucus Annual Legislative Conference Career Fair – September 2017
� Congressional Hispanic Caucus Leadership Conference – September 2017
� Northern Virginia Community College Featured Employer Day - September 2017
6 The composition of the IC was compared to the most recent benchmark year at the time that the Annual report was published. Thus, FY 2017 IC composition is compared to the Federal Workforce and Civilian Labor Force for 2014, taken from the Federal Equal Opportunity Recruitment Program. In addition, the source of population information changed during the course of the last five years. The population comparison group for FY 2012-2016 is taken from the FY 2010 American Community Survey which includes projections from the American Community Survey.
3FY 2017 DEMOGRAPHIC REPORT
IC Student Program Yields High Diversity.
The IC Undergraduate Scholar Program7 (or “Stokes”) continues to maintain excellent minority representation. In FY 2017, minority representation was 74.2% of the Stokes students employed in the IC.
Fostering an Inclusive Culture is Everyone’s Business.
The IC has worked to identify and promote employment practices designed to attract, retain, and develop a diverse workforce. Employee resource groups (ERGs) are recognized as a best-practice for employers who seek to increase diversity and inclusion within their workforce, and provide employees opportunities for greater visibility with leaders at all levels of the organization. ERGs are voluntary, employee-led groups that serve as a resource for members and organizations by fostering a diverse, inclusive workplace aligned with organizational mission, values, goals, business practices, and objectives. ERGs bring significant business value as they convey a broad range of diverse perspectives to corporate challenges and opportunities. ERGs promote learning and awareness within the whole workforce, support outreach and recruitment initiatives, and give exposure to unique cohort concerns. They provide opportunities to highlight the talents and contributions of all employees, which in turn increases morale and maximizes retention and productivity. Within the IC, ERGs also offer employees an opportunity to network, address common issues and concerns, and engage with senior leaders on mission-related challenges. Highlights of ERG accomplishments include:
� The IC’s Lesbian, Gay, Bisexual, Transgender and Allies Affinity Group, IC Pride, was awarded the “ERG of the Year” Outie Award at the Out & Equal 2017 Workplace Summit held in Philadelphia. In the field of leading private sector ERGs such as Comcast NBC Universal, Deutsche Bank, Verizon, Walmart, AT&T and others, IC Pride was recognized as a leader in advancing equality for lesbian, gay, bisexual, and transgender people in workplaces globally.
� The Deaf and Hard of Hearing IC Affinity Network (founded in December 2016) was recognized with an IC Equal Employment Opportunity and Diversity (IC EEOD) Professional Award for team achievement serving as an advocate, educator, and trailblazer advancing diversity and inclusion initiatives across the IC.
� The National Reconnaissance Office (NRO) Federal Women’s Program made significant contributions by providing training, leadership, and mentoring opportunities, effectively educating and empowering women and men to influence cultural change. The NRO’s Federal Women’s Program was recognized with an IC EEOD Professional Award for outstanding performance as a team.
� The African-American ERG Academic Outreach team of the Office of the Director of National Intelligence (ODNI) made significant contributions to advancing diversity and inclusion in the IC by implementing a robust outreach and engagement program with the Atlanta University Consortium, to develop deeper and more consistent relationships to increase the diversity of entry-level candidates within the IC.
Focus on Building a Leadership Pipeline is Crucial for a Long-Term Culture of Inclusion.
The IC sponsors summits to increase focus on diversity best practices and challenges across the IC. The summits bring together IC employees and provide them with opportunities to network, learn, and engage with IC leaders. The summits include executive guest speakers, diversity and inclusion experts, and leadership development trainers. The summits are designed to cultivate future talent and strengthen the leadership pipeline. The FY 2017 summits included the following events:
� Fifth IC Women’s Summit, March 28, 2017 (hosted by the National Security Agency). The Women’s Summit was designed to address challenges and opportunities experienced by women in the areas of career development and advancement. Workshops included a focus on creating gender partnerships, personal branding, networking, and anti-harassment.
� Sixth Annual IC Lesbian, Gay, Bisexual, Transgender, and Allies (LGBTA) Summit, June 15, 2017 (hosted by the Federal Bureau of Investigation). The summit highlighted how multiple aspects of individual’s identities–including race, disability, sexual orientation, and gender identity–are interconnected and impact personal and professional lives. The summit also focused on amplifying the voices of LGBTA people of color and people with disabilities.
7 The Louis Stokes Educational Scholarship Program (or “Stokes”) was authorized under Title 50 U.S.C. 3614. This highly competitive program selects high-achieving and committed undergraduate and graduate students interested in a career in public service. They are offered tuition assistance to accredited colleges or universities, provided challenging summer work, and offered full-time work after graduation.
4 OFFICE OF THE DIRECTOR OF NATIONAL INTELLIGENCE

� IC EEO and Diversity Professionals’ Conference, September 14, 2017 (hosted by ODNI). Highlights included discussions with private industry diversity professionals, whose ERG models will help inform the IC future approach to employee engagement. Administrative judges from the EEOC shared best practices for conducting investigations. Additional focus included examining new measures for ensuring diversity and inclusion efforts remain relevant and have the ability to advance the intelligence mission.
� Second Annual Leadership Pipeline Development Summit, focused on African-Americans and Hispanics, September 25, 2017 (hosted by the National Geospatial-Intelligence Agency). Highlights included plenary sessions on developing and sustaining a leadership brand and tools to increase resiliency to better meet mission requirements. IC leaders shared lessons in leadership by sharing their experiences, advice, and inspiration to attendees.
IC DIVERSITY AND INCLUSION BEST PRACTICES AT A GLANCE AGENCY BEST PRACTICE PURPOSE FY 2016 TO FY 2017
CIA
Establishment of Agency Signature Schools Program
Develop trusted relationships that drive recruitment at selected schools with at least 50 percent diversity in their student populations
1.4% INCREASE in the minority representation in the applicant pipeline
DHS
Hired an Onboarding Program Manager
To focus on retaining talent 16.0% DECREASE in the proportion of minorities leaving the workplace
DIA
Leadership actively involved in recruiting talent
To aid DIA in its quest to recruit and retain a diverse workforce and increase diversity of thought
6.9% INCREASE in the proportion of minorities hired
NGA
PWD Program Manager was active in recruiting
To increase the percentage of PWTD INCREASED the proportion of PWTD hired FROM 0.2% TO 2.3%
NSA
Participation in the Stokes Educational Scholarship Program
To improve the talent pipeline 75.0% of the IC Stokes students WORK AT NSA – 83.3% ARE MINORITIES; The vast majority of these students become full-time NSA employees
TREASURY
Developed strategic plan that holds leadership accountable for results in diversity efforts
To ensure diversity and inclusion efforts are aligned with mission needs and are effective, efficient, and merit-based
19.8% INCREASE in the proportion of minorities hired; 46.7% INCREASE in the proportion of women hired
Base FillText
Stars
USAF
Participation in recruiting for all occupations at major Diversity events
To increase the IC’s ability to recruit, hire, develop, and retain a more diverse workforce
22.6% INCREASE in the proportion of minorities hired
5FY 2017 DEMOGRAPHIC REPORT

INTRODUCTIONThe Annual Demographic Report: Hiring and Retention of Minorities, Women, and Persons with Disabilities in the United States Intelligence Community (IC) is prepared in accordance with Section 114 of the National Security Act of 1947, as amended by Section 324 of the Intelligence Authorization Act of 2003. This report summarizes demographic data on the individuals employed within the IC during fiscal year (FY) 2017 (between October 1, 2016 and September 30, 2017).
The purpose of this report is to describe the composition of minorities, women, and PWD employed in the IC. This report examines these groups in three areas:
1) Individuals employed in the IC in aggregate
2) Individuals employed in the IC by pay level grades
3) Individuals hired by the IC elements.
The IC is dedicated to increasing diversity and inclusion in the IC workforce, recognizing that diversity is key to solving complex national security threats against our country. “We currently face the most complex array of threats that we have ever seen. To meet that challenge, we need an innovative workforce that takes advantage of all the strengths, talents, and skills of our employees. We need an inclusive workplace that allows all our officers to thrive.”8
While the IC continues to increase minority representation, there is still work to be done. When comparing IC demographics to external benchmarks such as the Federal Workforce, Civilian Workforce, and the U.S. Population, the IC workforce minority representation is lower.
THE U.S. INTELLIGENCE COMMUNITYThe IC’s mission is to collect, analyze, and disseminate foreign intelligence and counterintelligence information to America’s leaders so they can make sound decisions to protect our country. Our customers include the President, policy-makers, law enforcement, and the military.
The IC is made up of 17 elements. Six large elements and 11 other elements9 compose the IC.
6 Large Elements
� Central Intelligence Agency (CIA)
� Defense Intelligence Agency (DIA)
� Federal Bureau of Investigation Intelligence Branch (FBI/IB)
� National Geospatial-Intelligence Agency (NGA)
� National Reconnaissance Office (NRO)
� National Security Agency (NSA)
11 Other Elements
� Department of Energy (DOE), Office of Intelligence and Counterintelligence (DOE-IN)
� United States Air Force (USAF), 25 AF, National Air and Space Intelligence Center (NASIC)
� Department of Homeland Security (DHS), Office of Intelligence and Analysis (I&A), and Homeland Security Investigations
� United States Army Intelligence and Security Command (INSCOM), National Ground Intelligence Center (NGIC)
� Department of State’s (DOS), Bureau of Intelligence and Research (State INR)
� United States Coast Guard (USCG) Intelligence Coordination Center (ICC) (part of DHS)
� Department of the Treasury (Treasury), Office of Intelligence and Analysis (OIA)
� United States Marine Corps (USMC), MC Intelligence Activity (MCIA)
� Drug Enforcement Administration (DEA), Office of National Security Intelligence
� United States Navy (USN), Naval Intelligence Activity (NIA)
� Office of the Director of National Intelligence (ODNI)
8 The Honorable Daniel Coats, Director of National Intelligence, “Remarks from the Annual Equal Employment Opportunity and Diversity Professionals Awards Ceremony,” December 6, 2017.
9 The 11 Other Elements include intelligence elements within Department of Defense services and other federal departments and agencies.
6 OFFICE OF THE DIRECTOR OF NATIONAL INTELLIGENCE
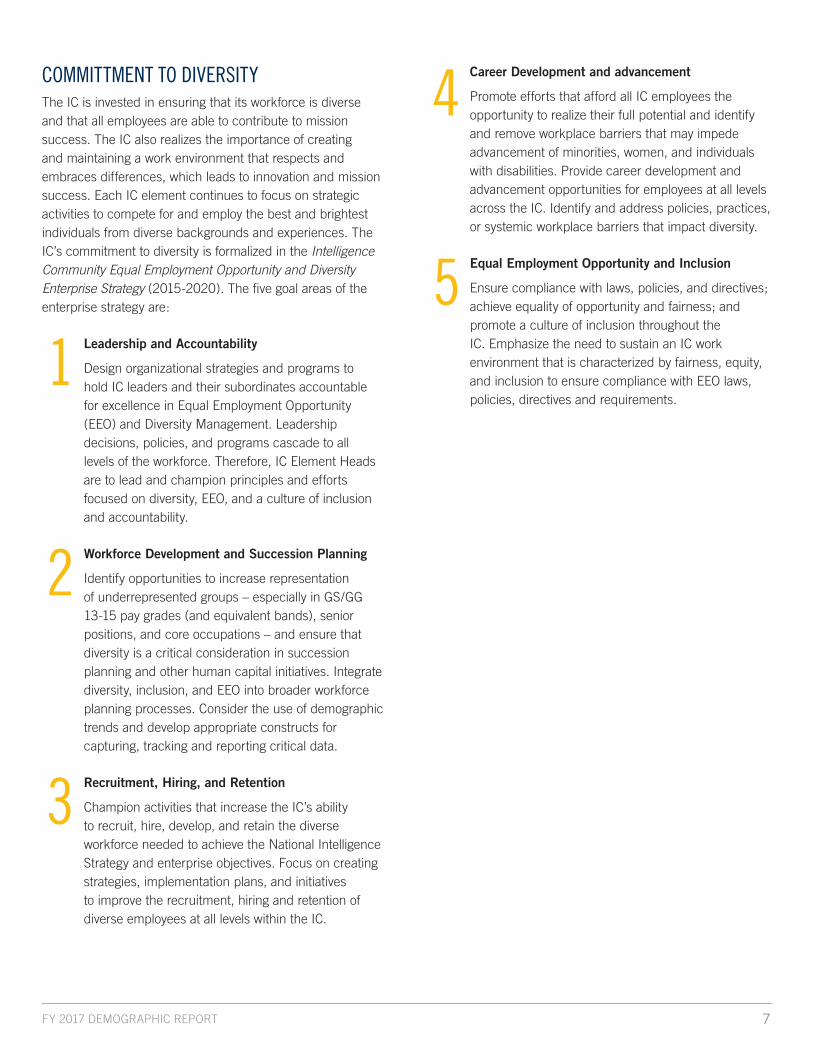
COMMITTMENT TO DIVERSITYThe IC is invested in ensuring that its workforce is diverse and that all employees are able to contribute to mission success. The IC also realizes the importance of creating and maintaining a work environment that respects and embraces differences, which leads to innovation and mission success. Each IC element continues to focus on strategic activities to compete for and employ the best and brightest individuals from diverse backgrounds and experiences. The IC’s commitment to diversity is formalized in the Intelligence Community Equal Employment Opportunity and Diversity Enterprise Strategy (2015-2020). The five goal areas of the enterprise strategy are:
Leadership and Accountability
Design organizational strategies and programs to hold IC leaders and their subordinates accountable for excellence in Equal Employment Opportunity (EEO) and Diversity Management. Leadership decisions, policies, and programs cascade to all levels of the workforce. Therefore, IC Element Heads are to lead and champion principles and efforts focused on diversity, EEO, and a culture of inclusion and accountability.
Workforce Development and Succession Planning
Identify opportunities to increase representation of underrepresented groups – especially in GS/GG 13-15 pay grades (and equivalent bands), senior positions, and core occupations – and ensure that diversity is a critical consideration in succession planning and other human capital initiatives. Integrate diversity, inclusion, and EEO into broader workforce planning processes. Consider the use of demographic trends and develop appropriate constructs for capturing, tracking and reporting critical data.
Recruitment, Hiring, and Retention
Champion activities that increase the IC’s ability to recruit, hire, develop, and retain the diverse workforce needed to achieve the National Intelligence Strategy and enterprise objectives. Focus on creating strategies, implementation plans, and initiatives to improve the recruitment, hiring and retention of diverse employees at all levels within the IC.
Career Development and advancement
Promote efforts that afford all IC employees the opportunity to realize their full potential and identify and remove workplace barriers that may impede advancement of minorities, women, and individuals with disabilities. Provide career development and advancement opportunities for employees at all levels across the IC. Identify and address policies, practices, or systemic workplace barriers that impact diversity.
Equal Employment Opportunity and Inclusion
Ensure compliance with laws, policies, and directives; achieve equality of opportunity and fairness; and promote a culture of inclusion throughout the IC. Emphasize the need to sustain an IC work environment that is characterized by fairness, equity, and inclusion to ensure compliance with EEO laws, policies, directives and requirements.
1
2
3
4
5
7FY 2017 DEMOGRAPHIC REPORT

PAGE INTENTIONALLY LEFT BLANK
8 OFFICE OF THE DIRECTOR OF NATIONAL INTELLIGENCE

IC WORKFORCE DIVERSITY AT A GLANCE PWDWOMENMINORITIES
THERE ARE NO EMPLOYEES AT THE GS/GG-01 PAY GRADE IN THE IC
WOMEN
INDIVIDUALS EMPLOYED IN THE IC BY PAY GRADE (FY 2017)
INDIVIDUALS HIRED BY THE IC ELEMENTS
WAGE GRADE
GS/GG-01
GS/GG-02
GS/GG-03
GS/GG-04
GS/GG-05
GS/GG-06
GS/GG-07
GS/GG-08
GS/GG-09
GS/GG-10
GS/GG-11
GS/GG-12
GS/GG-13
GS/GG-14
GS/GG-15
SENIOR PAY LEVELS
ALL PAY GRADES
PWD
7.6%39.2%
MINORITIES
26.2%
WOMEN
INDIVIDUALS HIRED BY THE IC ELEMENTS
PWD
9.3%38.8%
MINORITIES
26.9%
PWD NON-PWD
0% 20% 40% 60% 80% 100%
MEN WOMEN
0% 20% 40% 60% 80% 100%0% 20% 40% 60% 80% 100%
20172016
25.0%38.5%
8.4%
25.5%38.5%
9.3%
INDIVIDUALS EMPLOYED IN THE IC INDIVIDUALS EMPLOYED IN THE IC
NON-MINORITIES NO RNOMINORITIES
9FY 2017 DEMOGRAPHIC REPORT

INDIVIDUALS EMPLOYED IN THE ICThe greatest progress has been made in the representation of PWD. Though overall representation of PWD remains below 10% of the workforce, PWD percentages from FY 2013 to FY 2017 have steadily climbed from 6.8% to 9.3%, a growth rate of 36.8%. The proportion of minorities continues to increase incrementally, with a growth rate of 7.6% from FY 2013 to FY 2017. The representation of women has remained constant at 38.5% over the past four years, FY 2014 to FY 2017.
MINORITIES EMPLOYED IN THE ICThe representation of minorities increased at a rate of 2%, from 25.0% to 25.5%. The proportion of minorities in the IC workforce increased for African-American, Hispanic, Asian, and Two or More Races in FY 2017.10 The representation of American Indian Alaska Native and Native Hawaiian Pacific Islander groups remained unchanged from FY 2016 to FY 2017. The representation of employees who did not report race and national origin (RNO) remained unchanged at 1.1%.
Minority representation at 25.5% remains lower than comparable benchmarks of 35.3% for the Federal workforce, 32.5% for the Civilian Labor Force, and 38.2% of the general population.
WOMEN EMPLOYED IN THE ICOver the previous five years, the percentage of women employed in the IC has remained fairly constant. While the representation of women in the IC has stayed at 38.5% from FY 2014 to FY 2017, the proportion of minority women in the IC increased from 11.8% to 12.0% in FY 2017. Women hold at least one of the top three executive leadership positions in five of the six large IC elements. Since 2011, a woman has served as the Principal Deputy Director of National Intelligence.11
The overall percentage of women employed in the IC is below comparable external benchmarks.
The lack of growth in the percentage of women in the IC workforce since FY 2014 is consistent with other studies, to include the McKinsey & Company Women in the Workplace 2017 report,12 which concludes that while companies are focused on diversity, progress is slow or stalling. According to the McKinsey report, the reason for this challenge is that “we have blind spots when it comes to diversity, and we can’t solve problems that we don’t see or understand clearly.” It is conceivable that the IC’s perception of women’s advancement opportunities and proportional leadership representation are in concert with the cross-industry McKinsey report.
The McKinsey report also indicates that “efforts to make the workplace fair benefit us all. An equitable workplace allows the best talent to rise to the top, regardless of gender, race and ethnicity, background, or beliefs. Diversity leads to stronger business results, as numerous studies have shown.”
PWD EMPLOYED IN THE ICThe overall representation of PWD at 9.3% represents a rate increase of 10.7% from FY 2016 to FY 2017. The greatest change was in the reported population of persons with targeted disabilities (PWTD), which improved from 0.6% to 2.1% in FY 2017. While the FY 2017 change means the IC achieved the EEOC’s goal of having a 2% representation rate for PWTD in the workforce, the actual net increase of PWTD employees may partially be due to existing employees using the revised SF-256 to self-identity as PWTD.
10 The minority RNO representational percent increases from FY 2016 to FY 2017 included African-American (0.8%), Hispanic (3.3%), Asian (2.4%), and Two or More Races (5.3%).
OVERALL REPRESENTATION
11 The Principal Deputy Director of National Intelligences works alongside the Director of National Intelligence in leading the IC and the Office of the Director of National Intelligence.
12 The Women in the Workplace 2017 is a comprehensive study of the state of women in corporate America conducted by LeanIn.Org and McKinsey. The study draws on data from 222 companies employing more than 12 million people, as well as on a survey of over 70,000 employees and a series of qualitative interviews.
10 OFFICE OF THE DIRECTOR OF NATIONAL INTELLIGENCE

25.5%OF THE IC ARE MINORITIES*
AFRICAN-AMERICAN
HISPANIC
ASIAN
TWO OR MORE RACES
AMERICAN INDIAN ALASKAN NATIVE
NATIVE HAWAIIAN PACIFIC ISLANDER
12.1%
6.3%
4.3%
2.0%
0.5%
0.2%
*Not shown: 73.4% race is White1.1% race is Unknown
*FEDERAL WORKFORCE: 56.8% 43.2%*CIVILIAN LABOR FORCE: 53.9% 46.1%*U.S. POPULATION: 50.3% 49.7%*Benchmark as of 2014
38.5% OF THE IC ARE WOMEN
EXTERNAL BENCHMARKS MEN WOMEN
PROPORTION OF WORKFORCE REPRESENTATIONFIVE-YEAR TRENDS FOR MINORITIES, WOMEN, & PWD
REPRESENTATION FOR MINORITIES, WOMEN, & PWD (FY 2017)
9.3%* OF THE IC ARE PWD
*due to rounding in spreadsheets
** the IC achieved the EEOC goal of having a 2% representation rate for PWTD in the workforce.
NON-TARGETED DISABILITIES7.3%
TARGETED DISABILITIES**2.1%
2013
2014
2015
2016
2017
MINORITIES
23.7%
24.4%
24.6%
25.0%
25.5%
WOMEN
37.4%
38.5%
38.5%
38.5%
38.5%
PWD
6.8%
7.3%
7.9%
8.4%
9.3%
11FY 2017 DEMOGRAPHIC REPORT
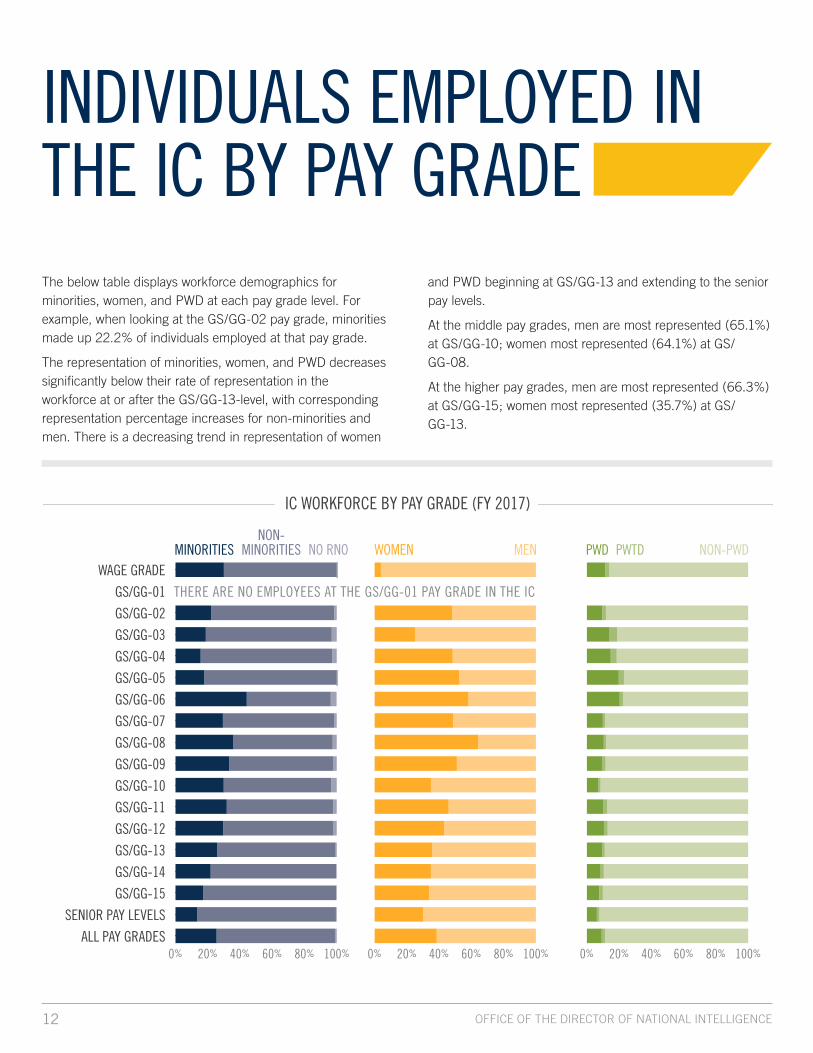
INDIVIDUALS EMPLOYED IN THE IC BY PAY GRADEThe below table displays workforce demographics for minorities, women, and PWD at each pay grade level. For example, when looking at the GS/GG-02 pay grade, minorities made up 22.2% of individuals employed at that pay grade.
The representation of minorities, women, and PWD decreases significantly below their rate of representation in the workforce at or after the GS/GG-13-level, with corresponding representation percentage increases for non-minorities and men. There is a decreasing trend in representation of women
and PWD beginning at GS/GG-13 and extending to the senior pay levels.
At the middle pay grades, men are most represented (65.1%) at GS/GG-10; women most represented (64.1%) at GS/GG-08.
At the higher pay grades, men are most represented (66.3%) at GS/GG-15; women most represented (35.7%) at GS/GG-13.
THERE ARE NO EMPLOYEES AT THE GS/GG-01 PAY GRADE IN THE IC
IC WORKFORCE BY PAY GRADE (FY 2017)
WAGE GRADE
GS/GG-01
GS/GG-02
GS/GG-03
GS/GG-04
GS/GG-05
GS/GG-06
GS/GG-07
GS/GG-08
GS/GG-09
GS/GG-10
GS/GG-11
GS/GG-12
GS/GG-13
GS/GG-14
GS/GG-15
SENIOR PAY LEVELS
ALL PAY GRADES
PWTDPWD NON-PWD
0% 20% 40% 60% 80% 100%
MEN WOMEN
0% 20% 40% 60% 80% 100%
NON-MINORITIES NO RNOMINORITIES
0% 20% 40% 60% 80% 100%
12 OFFICE OF THE DIRECTOR OF NATIONAL INTELLIGENCE

MINORITIES BY PAY GRADESWithin the minority population, 60.4% are at the GS/GG 11-13 pay grades, with 30.7% of minorities in this grade group at the GS/GG-13 level. A total of 23.8% of managerial and supervisory work roles in the IC are held by minorities, representing a 13.3% increase from FY 2016 to FY 2017, but a rate that is still slightly below their 25.5% FY 2017 baseline representation rate in the overall workforce. However, the overall representation of minorities continues to be a challenge across grade groups, as the share of minority representation declines at the higher pay grade levels.
WOMEN BY PAY GRADESWithin the population of women, 65.2% of women are at the GS/GG 12-14 pay grades, with most women (28.0%) at the GS/GG-13 pay grade. Women make up 36.3% of IC managers and supervisors in FY 2017, which represents a 5.2% increase from 34.5% in FY 2016, but in this category they are still below their 38.5% FY 2017 baseline representation rate in the overall workforce.
The overall representation of women continues to be a challenge across pay grade groups, as the FY 2017 data show women have a lower share of representation in higher pay grade groups.
A deeper analysis reveals an even more significant decrease in the representation of minority women at the higher and senior pay grades.
PWD BY PAY GRADESWithin the population of PWD, most PWD (68.8%) are at the GS/GG 12-14 pay grades. The majority of PWD (44.8%) in this grade group are at the GS/GG-13 pay grade. This same pattern holds true for PWTD.
The overall representation of PWD continues to be a challenge across grade groups, and mirrors minorities and women, with lower representation rates at the higher pay grade groups than their 9.3% FY 2017 baseline representation rate in the overall workforce.
WAGE GRADEto GS/GG-10
GS/GG11 to 13
GS/GG14 to 15
SENIORPAY LEVELS
PAY LEVELS
MINORITIES NON-MINORITIES
MINORITIES BY PAY GRADE (FY 2017)
WOMEN BY PAY GRADE (FY 2017)
PWD BY PAY GRADE (FY 2017)
31.6%
27.9%
20.1%
13.4%
WAGE GRADEto GS/GG-10
GS/GG11 to 13
GS/GG14 to 15
SENIORPAY LEVELS
PAY LEVELS
WOMEN MEN
47.7%
39.4%
34.5%
30.0%
WAGE GRADEto GS/GG-10
GS/GG11 to 13
GS/GG14 to 15
SENIORPAY LEVELS
PAY LEVELS
PWD NON-PWD
9.7%
10.0%
8.2%
6.2%
13FY 2017 DEMOGRAPHIC REPORT

PAGE INTENTIONALLY LEFT BLANK
14 OFFICE OF THE DIRECTOR OF NATIONAL INTELLIGENCE
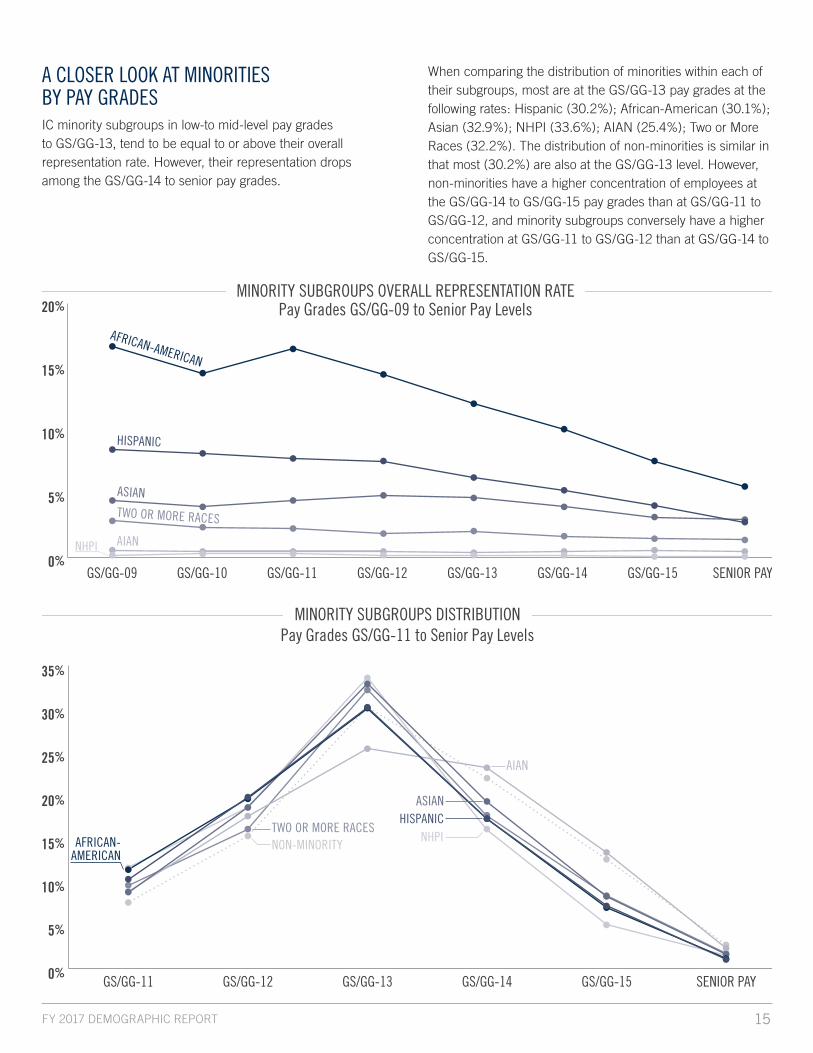
A CLOSER LOOK AT MINORITIES BY PAY GRADESIC minority subgroups in low-to mid-level pay grades to GS/GG-13, tend to be equal to or above their overall representation rate. However, their representation drops among the GS/GG-14 to senior pay grades.
When comparing the distribution of minorities within each of their subgroups, most are at the GS/GG-13 pay grades at the following rates: Hispanic (30.2%); African-American (30.1%); Asian (32.9%); NHPI (33.6%); AIAN (25.4%); Two or More Races (32.2%). The distribution of non-minorities is similar in that most (30.2%) are also at the GS/GG-13 level. However, non-minorities have a higher concentration of employees at the GS/GG-14 to GS/GG-15 pay grades than at GS/GG-11 to GS/GG-12, and minority subgroups conversely have a higher concentration at GS/GG-11 to GS/GG-12 than at GS/GG-14 to GS/GG-15.
MINORITY SUBGROUPS OVERALL REPRESENTATION RATEPay Grades GS/GG-09 to Senior Pay Levels
GS/GG-13GS/GG-09 GS/GG-10 GS/GG-11 GS/GG-12 GS/GG-14 GS/GG-15 SENIOR PAY
AFRICAN-AMERICAN
HISPANIC
ASIAN
TWO OR MORE RACES
AIANNHPI0%
5%
10%
15%
20%
MINORITY SUBGROUPS DISTRIBUTIONPay Grades GS/GG-11 to Senior Pay Levels
NHPI
GS/GG-13GS/GG-11 GS/GG-12 GS/GG-14 GS/GG-15 SENIOR PAY0%
5%
10%
15%
20%
25%
30%
35%
AFRICAN-AMERICAN
ASIANHISPANIC
TWO OR MORE RACESNON-MINORITY
AIAN
15FY 2017 DEMOGRAPHIC REPORT

INDIVIDUALS HIRED BY THE IC ELEMENTSThe share of minorities hired increased at a rate of 10.7% from FY 2013 to FY 2017. The share of women hired in FY 2016 and FY 2017 was above their overall rate of workforce representation (38.5%) for those years. The PWD share of hiring fluctuated over the last five years, and in FY17 rebounded to 9.3% from a low of 7.6% in FY16.
MINORITIES HIRED IN THE ICMinorities made up 26.9% of the IC’s new hires in FY 2017, a 2.7% increase over FY 2016. The greater proportion of hiring (26.9%) and lower proportion of attrition (23.8%), reflects higher retention, which helped their representation increase at a rate of 2%, from 25.1% to 25.5%.
The representation of minority new hires in FY 2017 include – Hispanic (6.8%); African-American (12.6%); Asian (4.6%); NHPI (0.1%); AIAN (0.3%); Two or More Races (2.4%).
WOMEN HIRED IN THE ICWomen made up 38.8% of the IC’s new hires in FY 2017, a 1% decrease from FY 2016. The share of women who left the IC decreased from 38.6% in FY 2016 to 37.3% in FY 2017. The relatively similar rates of hiring and attrition of women contribute to the stagnant representation proportion. Strategic initiatives to increase hiring and retention of women will continue.
PWD HIRED IN THE ICPWD made up 9.3% of the IC new hires in FY 2017, a 22.4% rate of increase from FY 2016 (7.6%). PWTD made up 1.0% of new hires, a 66.7% increase rate from FY 2016.
There is an unfavorable gap between the proportions of hiring (9.3%) and attrition (9.9%) for PWD. According to 2017 findings in a comprehensive study released by the IC, Diversity and Inclusion: Examining Workforce Concerns Within the United States Intelligence Community (summarized in the Appendix), the root cause is complex, ranging from security considerations to inefficient processes. The IC will focus on enterprise solutions to promote greater support to individuals with disabilities and promote the IC as an employer of choice.
16 OFFICE OF THE DIRECTOR OF NATIONAL INTELLIGENCE

201720162017201620172016
COMPARING FY 2016 AND FY 2017 OF MINORITIES, WOMEN, AND PWD EMPLOYED, HIRED, AND DEPARTED FROM THE IC
PROPORTION OF HIRING: FIVE YEAR TRENDS FOR MINORITIES, WOMEN, AND PWD
PWDWOMENMINORITIES
HIRED
EMPLOYED
DEPARTED
26.9%
25.5%
26.2%
25.0%
23.8%22.9%
HIRED
EMPLOYED
DEPARTED
38.8%
38.5%
39.2%
38.5%
37.3%38.6%
HIRED
EMPLOYED
DEPARTED
9.3%
9.3%
7.6%
20172016 20172016 20172016
8.4%
9.9%9.1%
2013
2014
2015
2016
2017
PWDMINORITIES
24.3% 7.6%
23.5%
24.9%
26.2%
9.4%
8.5%
7.6%
26.9%
WOMEN
37.1%
40.5%
38.2%
39.2%
38.8% 9.3%
17FY 2017 DEMOGRAPHIC REPORT

COMPARING REPRESENTATION OF MINORITIES IN THE SIX LARGE ELEMENTS AND OTHER IC ELEMENTSWhen comparing the FY 2017 minority representation in the six large agencies and other IC elements to total IC minority representation (25.5%), the proportion of minorities (25.1%) is lower in the six large elements than the other IC elements (26.9%).
The African-American, Hispanic, Asian, and Two or More Races representation in the six large IC elements grew between FY 2016 and FY 2017. The representation of the remaining groups stayed unchanged in the six large elements.
In the other IC elements, the proportion of the African-American and Hispanic population grew between FY 2016 and FY 2017. The representation of the remaining groups was unchanged.
COMPARING REPRESENTATION OF WOMEN IN THE SIX LARGE ELEMENTS AND OTHER IC ELEMENTSWhen comparing the FY 2017 proportion of women in the six large elements and other IC elements to total IC women’s representation (38.5%), the proportion of women (40.5%) is higher in the six large elements than the other IC elements (29.8%).
The representation of women in the six large elements grew from 40.1% in FY 2016 to 40.5% in FY 2017.
The representation of women in the other elements decreased from 30.1% in FY 2016 to 29.8% in FY 2017.
COMPARING REPRESENTATION OF PWD IN THE SIX LARGE ELEMENTS AND OTHER IC ELEMENTSWhen comparing the FY 2017 proportion of PWD in the six large agencies and other IC elements to total IC PWD representation (9.3%), the proportion of PWD (7.6%) is lower in the six large elements than the other IC elements (16.8%). The proportion of PWTD (2.3%) is higher in the six large elements than the other IC elements (0.8%).
The representation of PWD in the six large elements grew from 6.4% in FY 2016 to 7.6% in FY 2017. The representation of PWTD in the six large elements grew from 0.7% to 2.3%.
The representation of PWD in the other elements increased from 14.1% in FY 2016 to 16.8% in FY 2017. The representation of PWTD in the other elements increased from 0.3% to 0.8%.
OTHER ELEMEN
TS
6 LA
RGE
ELEMENTS OTHER ELEM
ENTS
6 LA
RGE
ELEMENTS OTHER ELEM
ENTS
6 LA
RGE
ELEMENTS
PWDWOMENMINORITIES
ALL MINORITIES
NON-MINORITIES
NO RNOs
25.1%
73.5%
1.3%
26.9%
73.1%
0.1%
PWTD
ALL OTHER PWD
TOTAL PWD
2.3%
5.2%
7.6%
0.8%
16.0%
16.8%
WOMEN
MEN
40.5%
59.5%
29.8%
70.2%
SIX LARGE IC ELEMENTS COMPARED TO OTHER IC ELEMENTS (FY 2017)
18 OFFICE OF THE DIRECTOR OF NATIONAL INTELLIGENCE

CONCLUSIONLike other successful organizations, each of the 17 elements of the IC can achieve success in diversity and inclusion by treating the process as an enterprise change initiative linked to other critical mission priorities. Diversity is not about counting people, but rather embedding diversity and inclusion into every organizational process—from talent acquisition, to workforce development, to leadership planning, and more. It means engaging the entire workforce and ensuring involvement of senior leadership. If handled effectively, diversity will be less about compiling demographic statistics and more about making the IC a more dynamic and agile workforce capable of meeting the national security demands of a more global and interconnected world. Diversity initiatives must be strongly supported by research, implemented carefully, and then evaluated to ascertain their effectiveness. The findings of this report point to areas where increased diversity improvements have been made as well as where more focus should be applied. The IC will diligently continue diversity and inclusion initiatives to address these areas as a priority item, so that continued progress can be achieved.
19FY 2017 DEMOGRAPHIC REPORT

APPENDIX–DIVERSITY AND INCLUSION: A separate report, summarized here, Diversity and Inclusion: Examining Workforce Concerns Within the United States Intelligence Community was commissioned by the Office of the Intelligence Community Equal Employment Opportunity and Diversity (IC EEOD) to conduct an in-depth examination of barriers pertaining to hiring, retention, and career development of women, minorities, and persons with disabilities (PWE) in the IC. Utilizing external resources for neutrality and objectivity, employees were given the opportunity to speak candidly and share individual perspectives on diversity and inclusion—inclusion being the glue that ultimately allows diversity to stick.13 The report also examined underrepresented groups’ concerns in the workplace through the lens of an extensive literature review, with the goal of determining why these issues continue to exist despite numerous attempts to break them down.
THE CASE FOR DIVERSITY AND INCLUSION IS CLEARGiven its national security mission, there is no more important place to encourage and support a culture of diversity and inclusion than in today’s IC. As the Director of National Intelligence (DNI) affirms,14 the intelligence effort is only strengthened by the presence of diversity and inclusion to attract and retain the type of employee who is most qualified for acting in the defense of this nation. The value of increasing diversity, especially in underrepresented segments such as minority groups, women, and PWD, expands the talent base and more accurately reflects analytic capabilities necessary to evaluate and meet mission requirements.15 Indeed, one of the main goals stated by the DNI in Leading Intelligence Integration is to “promote a diverse, highly skilled intelligence workforce that reflects the strength of America.”16
ALTHOUGH THERE HAS BEEN A GREAT DEAL OF RESEARCH ON THE SOURCES OF WORKPLACE INEQUALITY, THERE HAS BEEN LITTLE ON THE EFFECTIVENESS OF DIFFERENT PROGRAMS FOR COUNTERING ITResearch has shown that, at best, “best practices” are “best guesses.”17 As one noted researcher observed, “We know a lot about the disease of workplace inequality, but not much about the cure.”18 A challenge is often then issued from leadership, that “What we have been doing has not been effective and we need to do something different.” The IC EEOD study took a somewhat different approach from a traditional barrier analysis and shifted emphasis toward a more workforce impact-focused methodology complimented by a strong literature review addressing what empirical research has identified. The study strove to allow members of the IC workforce to be comfortable in commenting on issues they are unlikely to say directly to supervisors or managers and, in some cases, even avoid reporting to EEOD offices or to Ombudsmen. Frequently, direct quotes are presented in the report to illustrate problem areas from the perspective of workforce members.
EXAMINING WORKFORCE CONCERNS
WITHIN THE UNITED STATES INTELLIGENCE COMMUNITY REPORT
13 Riordan, Christine, “Diversity is Useless without Inclusivity.” Harvard Business Review, June 5, 2014. https://hbr.org/2014/06/ diversity-is-useless-without-inclusivity/.
14 ODNI, Director of National Intelligence’s Statement on Intelligence Community Equal Employment Opportunity and Diversity, Washington, DC, November, 2010. https://www.dni. gov/files/documents/Statement%20on%20Intelligence%20 Community%20EEOD.pdf.
15 Kohli. J., et al. “A Better, More Diverse Senior Executive Service in 2050: More Representative Leadership Will Improve the Effectiveness and Efficiency of the Federal Government.” Center for American Progress, September 22, 2011. https://www. americanprogress.org/issues/race/report/2011/09/22/10251/a-better-more-diverse-senior-executive-service-in-2050/.
16 ODNI. IC EEOD. Director’s Statement on Intelligence Community Equal Employment Opportunity and Diversity. ODNI Website. https://www.dni.gov/files/documents/Statement%20on%20 Intelligence%20Community%20EEOD.pdf.
17 Dobbin, F., Kalev, A., and Kelly, E. “Best Practices or Best Guesses? Assessing the Efficacy of Corporate Affirmative Action and Diversity Policies.” American Sociological Review, 2006, Vol. 71 (August: 589:617).
18 Dobbin, F., Kalev, A., and Kelly, E. “Best Practices or Best Guesses? Assessing the Efficacy of Corporate Affirmative Action and Diversity Policies.” American Sociological Review, 2006, Vol. 71 (August: 589:617).
20 OFFICE OF THE DIRECTOR OF NATIONAL INTELLIGENCE

The study highlighted six major areas where the IC can take an integrated approach to reduce or eliminate workplace challenges to hiring, developing, and retaining a more diverse workforce.
These areas are Leadership, Organizational Culture/Work Environment, Recruitment and Selection, Advancement, Work/Life Integration, and Disabilities and Reasonable Accommodations.
Within these six areas, specific associated points, or subcategories, narrow discussion to the most relevant topics for the IC as a whole. In all, the study had 36 separate findings and recommendations.
Following the introduction is a summary of the recommendations found in the main report. The recommendations are provided in a concise manner to convey the core of each individual recommendation and are followed by “smart practices,” which are actions that IC leadership can implement to effect change.
These changes will take extraordinarily strong leadership, and in turn will require focused implementation strategies from the individual IC element for any substantial results to occur. As in any organization, the leadership of each element plays a vital role in setting the tone of the work climate. Leadership’s example must be mirrored by the individual managers and supervisors within each respective IC element who are in the most critical positions to impact culture. The actions and behaviors of middle management are crucial to implementing successful change initiatives.
Implementation of these recommendations are important measures in overcoming the ongoing challenges to establishing a diverse and inclusive workplace. However, effective change requires a parallel, long-term effort that often favors a series of smaller steps to produce a deep-rooted and durable impact over larger-scale initiatives that generally do not provide lasting results. IC leaders should consider taking a multi-pronged approach to making changes to existing diversity and inclusion policies. Leaders should continue to raise awareness of barriers in the workplace, ideally with empathy training combined with unconscious bias training. Leaders should also seek to increase employees’ exposure to qualified managers and employees of diverse backgrounds. Leaders can take actions to increase exposure and modify the way they see others different from themselves by providing activities, such as highlighting positive, diverse role models in positions of leadership; getting involved with
employee resource groups; implementing formal mentorship and shadowing programs; and more. Finally, leadership should encourage social accountability, rather than force compliance as a means of mitigating bias and improving diversity and inclusion.
THE IC CAN ACHIEVE SUCCESS IN DIVERSITY AND INCLUSION BY TREATING THE PROCESS AS AN ENTERPRISE CHANGE INITIATIVE LINKED TO OTHER CRITICAL MISSION PRIORITIES Diversity is not about counting people, but rather embedding diversity into every organizational process creating, in effect, a culture of inclusion19—from talent acquisition, to workforce development, to leadership planning, and more. It means engaging the entire workforce and ensuring involvement of senior leadership. If handled effectively, diversity and inclusion will be less about checking boxes and more about making the IC a dynamic and agile force capable of meeting the national security demands of a global and interconnected world.
19 Shore, L., Randel, A., Chung, B., Dean, M., Ehrhart, K., and Singh, G. “Inclusion and Diversity in Work Groups: A Review and Model for Future Research.” Journal of Management. July 2011. Vol. 37 No. 4, July 2011 1262-1289.
21FY 2017 DEMOGRAPHIC REPORT

PAGE INTENTIONALLY LEFT BLANK
22 OFFICE OF THE DIRECTOR OF NATIONAL INTELLIGENCE

READ THE FULL DIVERSITY AND INCLUSION: EXAMINING WORKFORCE CONCERNS WITHIN THE UNITED STATES INTELLIGENCE COMMUNITY REPORT ON-LINE
https://www.dni.gov/files/documents/Newsroom/IC_EEOD_Barriers_Analysis.pdf
23FY 2017 DEMOGRAPHIC REPORT

PAGE INTENTIONALLY LEFT BLANK
24 OFFICE OF THE DIRECTOR OF NATIONAL INTELLIGENCE

PAGE INTENTIONALLY LEFT BLANK
25FY 2017 DEMOGRAPHIC REPORT

032703