OFFICE OF CLINICAL PHARMACOLOGY ... OF CLINICAL PHARMACOLOGY: PHARMACOMETRIC REVIEW NDA 22,065/S006,...
21
OFFICE OF CLINICAL PHARMACOLOGY: PHARMACOMETRIC REVIEW NDA 22,065/S006, SDN 080, 082 and SDN 085 Drug Name Ixempra® (ixabepilone) Dosage Ixempra for injection Applicant Bristol-Myers Squibb Pharmacometrics Reviewer Jeanne Fourie Zirkelbach, PhD Pharmacometrics Team Leader Christine Garnett, PharmD Clinical Pharmacology Team Leader Qi Liu, PhD Indication Solid Tumors Type of Submission Request for Pediatric Exclusivity Submission Date 1/18/11, 3/8/11 and 7/8/11 1 SUMMARY OF FINDINGS 1.1 Key Review Questions The purpose of this review is to address the following key questions. 1.1.1 What are the characteristics of ixabepilone pharmacokinetics in pediatric cancer patients? The applicant conducted a population pharmacokinetic (PPK) analysis for ixabepilone used data from pediatric cancer patients enrolled in a phase 1 dose-escalation trial (CTEP-5425). Patients received ixabepilone QD x 5, every 21 days as a 1-hour intravenous infusion. Table 1 below summarizes the parameter estimates for the final PPK model. The applicant concludes: • That the ixabepilone concentration-time profiles in pediatric cancer patients were adequately described by a linear two-compartment PK model. • Clearance (CL) was determined to increase with increasing body surface area (BSA), and the effect of gender and total body weight (BWT) on CL and Volume of the central compartment (VC) was not significant after adjusting for the effect of BSA. Submission Number Page 1 of 20 NDA22065 PPK.doc Reference ID: 3016693
Transcript of OFFICE OF CLINICAL PHARMACOLOGY ... OF CLINICAL PHARMACOLOGY: PHARMACOMETRIC REVIEW NDA 22,065/S006,...

OFFICE OF CLINICAL PHARMACOLOGY: PHARMACOMETRIC REVIEW
NDA 22,065/S006, SDN 080, 082 and SDN 085
Drug Name Ixempra® (ixabepilone)
Dosage Ixempra for injection
Applicant Bristol-Myers Squibb
Pharmacometrics Reviewer Jeanne Fourie Zirkelbach, PhD
Pharmacometrics Team Leader Christine Garnett, PharmD
Clinical Pharmacology Team Leader Qi Liu, PhD
Indication Solid Tumors
Type of Submission Request for Pediatric Exclusivity
Submission Date 1/18/11, 3/8/11 and 7/8/11
1 SUMMARY OF FINDINGS
1.1 Key Review Questions The purpose of this review is to address the following key questions.
1.1.1 What are the characteristics of ixabepilone pharmacokinetics in pediatric cancer patients?
The applicant conducted a population pharmacokinetic (PPK) analysis for ixabepilone used data from pediatric cancer patients enrolled in a phase 1 dose-escalation trial (CTEP-5425). Patients received ixabepilone QD x 5, every 21 days as a 1-hour intravenous infusion. Table 1 below summarizes the parameter estimates for the final PPK model. The applicant concludes:
• That the ixabepilone concentration-time profiles in pediatric cancer patients were adequately described by a linear two-compartment PK model.
• Clearance (CL) was determined to increase with increasing body surface area (BSA), and the effect of gender and total body weight (BWT) on CL and Volume of the central compartment (VC) was not significant after adjusting for the effect of BSA.
Submission Number Page 1 of 20
NDA22065 PPK.doc
Reference ID: 3016693

Table 1. Parameter Estimates for Final PPK Model
1.1.2 Is the clearance of ixabepilone similar in adult and pediatric cancer patients? Yes, the clearance of ixabepilone in pediatric cancer patients was similar to that in adults with the same dosing schedule (Figure 1). This was established by comparing the summary measures of exposure in pediatric subjects determined by applying the sponsor’s final PPK model from the current submission and corresponding measures of exposure determined by applying a previous PPK model in adult patients from 5 clinical studies using the identical dosing schedule.
Submission Number Page 2 of 20
NDA22065 PPK.doc
Reference ID: 3016693
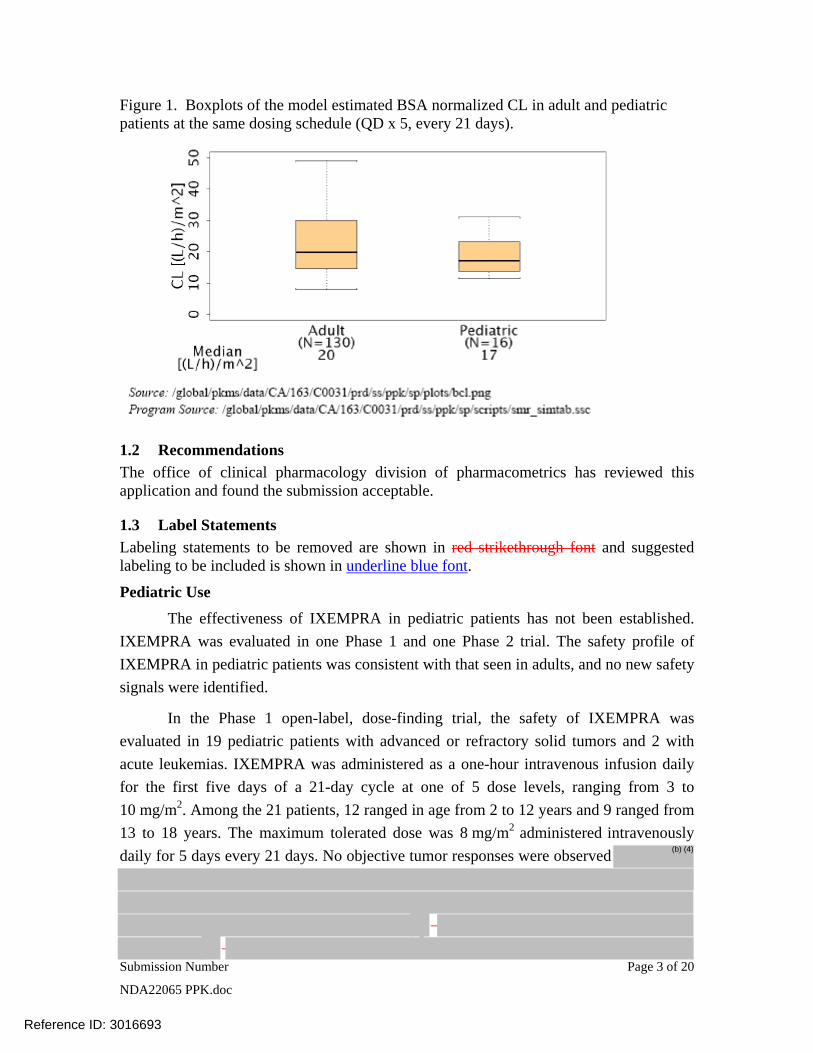
Figure 1. Boxplots of the model estimated BSA normalized CL in adult and pediatric patients at the same dosing schedule (QD x 5, every 21 days).
1.2 Recommendations The office of clinical pharmacology division of pharmacometrics has reviewed this application and found the submission acceptable.
1.3 Label Statements Labeling statements to be removed are shown in red strikethrough font and suggested labeling to be included is shown in underline blue font.
Pediatric Use
The effectiveness of IXEMPRA in pediatric patients has not been established. IXEMPRA was evaluated in one Phase 1 and one Phase 2 trial. The safety profile of IXEMPRA in pediatric patients was consistent with that seen in adults, and no new safety signals were identified.
In the Phase 1 open-label, dose-finding trial, the safety of IXEMPRA was evaluated in 19 pediatric patients with advanced or refractory solid tumors and 2 with acute leukemias. IXEMPRA was administered as a one-hour intravenous infusion daily for the first five days of a 21-day cycle at one of 5 dose levels, ranging from 3 to 10 mg/m2. Among the 21 patients, 12 ranged in age from 2 to 12 years and 9 ranged from 13 to 18 years. The maximum tolerated dose was 8 mg/m2 administered intravenously daily for 5 days every 21 days. No objective tumor responses were observed (b) (4)
Submission Number Page 3 of 20
NDA22065 PPK.doc
Reference ID: 3016693

(b) (4)
The pharmacokinetics of ixabepilone were characterized by population pharmacokinetic analysis of data for 16 patients from this trial, who were aged 2 to 18 years (median 12 years). The pharmacokinetic parameters of ixabepilone in these pediatric patients were compared to the corresponding parameters of 130 adult patients enrolled in clinical trials with the same dosing schedule. The median BSA normalized clearance of ixabepilone in pediatric patients (17 L/h/m2) was similar to that in adult patients (20 L/h/m2).
In the Phase 2 trial of 59 patients with advanced or refractory solid tumors, 28 patients ranged in age from 3 to 12 years and 19 patients ranged in age from 13 to 18 years. Twelve additional patients over the age of 18 were treated in this trial. IXEMPRA was administered intravenously at a dose of 8 mg/m2 daily for 5 days every 21 days. This trial was terminated early due to lack of efficacy.
2 PERTINENT BACKGROUND Relevant Clinical Pharmacokinetics of ixabepiline in cancer patients (reproduced from current package insert):
Following administration of a single 40 mg/m2 dose of IXEMPRA in patients with cancer, the mean Cmax was 252 ng/mL (coefficient of variation, CV 56%) and the mean AUC was 2143 ng•hr/mL (CV 48%). Typically Cmax occurred at the end of the 3 hour infusion. In cancer patients, the pharmacokinetics of ixabepilone were linear at doses of 15 to 57 mg/m2. The mean volume of distribution of 40 mg/m2 ixabepilone at steady-state was in excess of 1000 L. Ixabepilone has a terminal elimination half-life of approximately 52 hours. No accumulation in plasma is expected for ixabepilone administered every 3 weeks. Based upon a population pharmacokinetic analysis in 676 cancer patients, gender, race, and age do not have meaningful effects on the pharmacokinetics of ixabepilone.
3 PERTINENT REGULATORY BACKGROUND Ixabepilone (IXEMPRA, a microtubule inhibitor) in combination with capecitabine is indicated for the treatment of metastatic or locally advanced breast cancer in patients after failure of an anthracycline and a taxane. Ixabepilone (40 mg/m2, administered as a single intravenous (IV) dose over 3 hours, every 3 weeks) as monotherapy is indicated for the treatment of metastatic or locally advanced breast cancer in patients after failure of an anthracyclines, taxanes, and capecitabine.
The current submission is Bristol-Myers Squibb’s response to an Information Request (IR) for the previous labeling supplement (S-006), originally submitted on 1/14/11. The S-006 labeling supplement included proposed labeling and pediatric study results from two clinical trials to address the Pediatric Written Request first issued by the Division of Drug Oncology Products (DDOP) on 22 June, 2007, with amendments made on 22 April,
Submission Number Page 4 of 20
NDA22065 PPK.doc
Reference ID: 3016693

2008 and 25 October 2010. The IR made during the review of the S-006 supplement was as follows:
• Develop a pharmacokinetic model to obtain an accurate ixabepilone clearance estimate in pediatric patients. (Located in Module 5.3.3.5).
• Submit the detailed pharmacokinetic model report, datasets, and model codes. The report should contain goodness-of-fit plots and a summary of the model parameters and covariates effects (e.g., body weight on CL and V). (Located in Module 5.3.3.5).
• Compare the pediatric pharmacokinetic parameters (Cmax, AUC, V and CL) with those in adults with the same dosing schedule. The adult comparison data should be from the clinical trials conducted as part of the original NDA submission (e.g. CA163001). (Located in Module 5.3.3.2).
4 RESULTS OF SPONSOR’S ANALYSIS The applicant performed a PPK analysis to characterize ixabepilone pharmacokinetics (PK) in pediatric cancer patients. The analysis also determine the effects of covariates on ixabepilone PK, in particular: age, gender and body size (body weight, BWT and body surface area, BSA). The results are described in the proposed label.
4.1.1 Clinical Trial Used In pediatric PPK Analysis The PPK analysis for ixabepilone was conducted with plasma concentration values from pediatric cancer subjects enrolled in protocol CTEP-5425.
Protocol CTEP-5425 was a phase 1 dose-escalation trial of ixabepilone in children and adolescents with solid refractory tumors, which included rhabdomyosarcoma and other soft tissue sarcomas, Ewing’s sarcoma, osteosarcoma, neuroblastoma, Wilm’s tumor and primary brain tumors. Specific objectives of the Pediatric Written Request included characterization of the pharmacokinetics of ixabepilone in pediatric patients, and a comparison of the ixabepilone pharmacokinetic parameters in pediatric patients to those in adults with the same dosing schedule. Pediatric patients enrolled in this study were treated at 1 of 5 ixabepilone dose levels: 3, 4.5, 6, 8 and 10 mg/m2/day as 1 hr infusion for 5 consecutive days, every 21 days (QD×5, every 21 days). Based on the phase 1 trial, the maximum tolerated dose (MTD) of ixabepilone was determined to be 8 mg/m2/day.
Blood samples for PK determinations were collected before infusion and 0.5, 1.0 (end of infusion), 1.25, 1.5, 1.75, 2, 3, 4, 6, 8, 10-12 (if feasible) and 24 hours after the start of infusion on the first dose on Cycle 1. Trough (before infusion) and peak (end of infusion) samples were obtained for doses 2 through 5, and 24-hour and 48-hour samples were drawn after the 5th dose. The PPK analysis dataset included all subjects noted in for whom ixabepilone plasma concentration data were available. Table 2 provides a summary of the 16 subjects in study CTEP-5425 that are included in the PPK analysis dataset.
Submission Number Page 5 of 20
NDA22065 PPK.doc
Reference ID: 3016693

Table 2. Summary of Subjects Included in PPK Analysis.
Table 3 provides summary statistics of the baseline demographic covariates in the PPK analysis dataset.
Table 3. Summary Statistics of Baseline Demographics of patients in the PPK analysis dataset.
Figure 2 shows the Ixabepilone plasma-concentration time profiles from patients included in the PPK dataset.
Submission Number Page 6 of 20
NDA22065 PPK.doc
Reference ID: 3016693

(b) (4)
1000
0 24 48 72 96 120 144 168
Time (h)
Con
cent
ratio
n (n
g/m
L)
3 mg/m2 100 4.5 mg/m2 6 mg/m2 8 mg/m2
10 10 mg/m2
1
Figure 2. Plasma PK of ixabepilone in children and adolescents from study CTEP-5425.
Mean Concentration-Time Profiles (SD) of Ixabepilone
(b) (4)
4.1.2 Bioanalytical Methods for Data used in Pediatric PPK Analysis All reported results for ixabepilone in human plasma by LC-MS/MS were generated in analytical runs using a two validated bioanalytical method. A subset of samples were analyzed at BMS, New Brunswick NJ. The remainder of samples were analyzed at (Pediatric Oncology Branch, NCI), Richmond VA.
Table 4. Summary of Assay Performance for Ixabepilone in Human Plasma for Method 1 at BMS and and Method 2 at
Submission Number Page 7 of 20
NDA22065 PPK.doc
Reference ID: 3016693

4.1.3 Adult PPK model Dataset Summary measures of exposure determined in the pediatric PPK analysis were compared with corresponding measures of exposure in adults who were administered the same dosing schedule (QD×5, every 21 days), and for whom PK parameters were available from the sponsor’s previous adult PPK analysis. The adult PPK model dataset included 12 ixabepilone monotherapy studies (2 Phase 1 and 10 disease specific Phase 2 studies), of which there were 5 clinical studies in which the ixabepilone dosing schedule was QD×5, every 21 days (CA163011, CA163012, CA163014, CA163036 and CA163051).
4.1.4 Applicant’s Methods The current PPK analysis for ixabepilone was conducted with 294 plasma concentration values from pediatric cancer subjects enrolled in protocol CTEP-5425. A description of this study and the PK sampling schedule can be found in Section 3.1.1.
The pharmacokinetics of ixabepilone was characterized by a nonlinear mixed-effects “population” compartmental model using NONMEM version 6.2.0.
The goal of the base model development was to determine a stable model that best describes the data without considering the effect of subject covariates.
Applicant’s Base Model Components: 1) A structural model, which describes plasma concentrations of ixabepilone as a function of time. 2) An interindividual variability (IIV) model, which describes random variability in structural model parameters between individuals in the study population. 3) A residual error model that characterizes the random variability in observed data within an individual and dosing occasion.
Applicant’s Model Selection Criteria The selection of a base model was based on the following criteria: • Successful NONMEM minimization and covariance steps. • Reductions in NONMEM objective function value (OFV). • Good predictive performance for pre-specified exposure measures. • Improvements in diagnostic plots. • Reductions in interindividual variability of structural model parameters and residual
error. • Acceptability of the parameter correlation matrix condition number (ratio of largest to smallest given value of the correlation matrix). • Acceptability of predictive performance.
Structural Model The basic structural exposure model describes the functional relationship between the dependent variable (plasma concentration of ixabepilone) and the independent variables (time, dose and regimen). The main component of the structural model is the number of compartments that best describe the pharmacokinetics of ixabepilone. Alternative
Submission Number Page 8 of 20
NDA22065 PPK.doc
Reference ID: 3016693

structural models were assessed using the likelihood ratio test, and diagnostic plots. Once the applicant identified the basic structural model, a final model that incorporated covariates was identified. The covariate-parameter relationships were screened visually by plotting the individual estimates of parameter values versus the covariate, and were screened statistically by the stepwise backward elimination method to finalize the covariate model structure. Standard diagnostics including goodness-of-fit plots and plots of weighted residual error were also used to elucidate model structure and covariate correlation.
Model Evaluation Model evaluation was conducted using visual predictive check (VPC), which provides an evaluation of model assumptions and population parameter estimates by comparing model predictions and observations. The VPC was performed with 500 simulated datasets obtained from the final model by Monte Carlo simulation. Each simulated dataset was identical to the PPK dataset, except that simulated values were substituted for actual observations. The check was performed by plotting the observed plasma concentration-time data with the corresponding 10th, 50th, and 90th percentiles of the model-based predictions. Approximately 80% of the observed values should fall between the 10th and 90th percentiles of model predictions (the 80% prediction interval).
In addition, model evaluation was also performed by comparing NCA parameter estimates of CL, volume of distribution at steady state (Vss), area under the curve at infinity (AUCinf), and terminal half-life (T-HALF) with corresponding parameters derived from the PPK model parameter value. As NCA analyses was based on Day 1 data, parameter estimates from PPK model were also re-estimated using only Day 1 data to compare with NCA estimates.
Model Application The pediatric PPK model was applied to obtain estimates of individual exposure in subjects from CTEP-5425, and these exposure estimates were compared with exposures in adults receiving the same ixabepilone dosing schedule (QD×5, every 21 days). A previously developed adult PPK model was used to obtain ixabepilone exposures.
The subjects in pediatric and adult PPK model datasets were in different dose cohorts: 3, 4.5, 6, 8 and 10 mg/m2 in pediatrics compared to 6 mg/m2 in adults. Given the limited number of pediatric subjects in each dose cohort, dose normalized exposure across the dose cohort was used to compare between the given populations. Summary measures of exposure assessed in this analysis were peak and trough concentrations on Day-1 and Day-5 (Cmax and Cmin, respectively) and area under the curve, AUCinf.
Summary measures of exposure (Cmax, Cmin and AUCinf) were derived from the predicted concentration-time profiles using the PPK model based individual parameter estimates for CL, VC, VP and Q.
4.1.5 Applicant’s Results & Conclusions for the Base Model Base Model:
Submission Number Page 9 of 20
NDA22065 PPK.doc
Reference ID: 3016693

• The IIV parameters of the base model were specified by a lognormal IIV model on CL, VC, VP and Q with a diagonal variance-covariance matrix (Table 5). Variances of the random- effect parameters specifying IIV on CL, VC, Q, and VP are denoted as ω2CL, ω2VC, ω2Q, and ω2VP respectively in Table 4.
• The residual error was described by a proportional error model. The base model provides reasonably precise estimates of CL, VC, Q and VP with RSE% 12.3, 19.7, 14.5 and 13.1, respectively.
• The plasma concentration-time profile of ixabepilone in children and adolescents was characterized by an initial rapid distributive phase followed by biphasic elimination as shown in Figure 3. This supported the assumption to investigate the two-compartment model as structural model. Figure 3 shows observed and model predicted concentration-time profiles following the 1st-dose. Ixabepilone concentration-time data were well described by the base model.
Table 5. Parameter Estimates for Sponsor’s PPK Base Model.
Submission Number Page 10 of 20
NDA22065 PPK.doc
Reference ID: 3016693
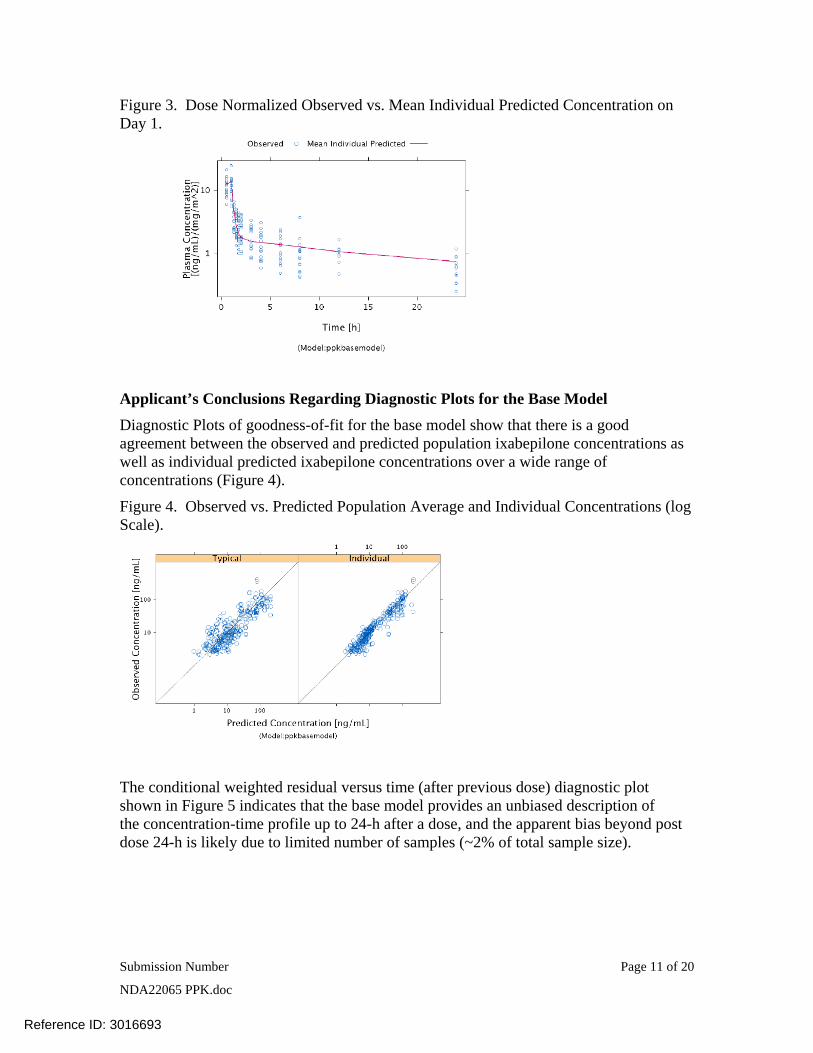
Figure 3. Dose Normalized Observed vs. Mean Individual Predicted Concentration on Day 1.
Applicant’s Conclusions Regarding Diagnostic Plots for the Base Model Diagnostic Plots of goodness-of-fit for the base model show that there is a good agreement between the observed and predicted population ixabepilone concentrations as well as individual predicted ixabepilone concentrations over a wide range of concentrations (Figure 4).
Figure 4. Observed vs. Predicted Population Average and Individual Concentrations (log Scale).
The conditional weighted residual versus time (after previous dose) diagnostic plot shown in Figure 5 indicates that the base model provides an unbiased description of the concentration-time profile up to 24-h after a dose, and the apparent bias beyond post dose 24-h is likely due to limited number of samples (~2% of total sample size).
Submission Number Page 11 of 20
NDA22065 PPK.doc
Reference ID: 3016693

Figure 5. Conditional Weighted Residual vs. Time After Previous Dose.
The lack of a trend in the conditional weighted residual versus time (after first dose) shown in Figure 6 suggests that the pharmacokinetics of ixabepilone are time-invariant (the slight over prediction at 140 hours is likely due to limited samples (~8) as well as bias in the observed data, as a consequence of some (~20%) observations being below the LLOQ.
Figure 6. Conditional Weighted Residuals vs. Time After First Dose.
Note: Dash line represents locally weighted smooth line.
The conditional weighted residual versus population prediction diagnostic plot shown in Figure 7 indicates the model was mostly unbiased over the dose range studied. It also shows a slight bias towards over-predicting concentrations >100 ng/mL in some subjects in the 10 mg/m2/day and 8 mg/m2/day group. However, the presence of this trend was not detected later in the model evaluation using a visual predictive check. All the observations were within pre-specified CWRES range for outlier identification (-5 to +5), suggesting the performance of the base model is acceptable.
Submission Number Page 12 of 20
NDA22065 PPK.doc
Reference ID: 3016693

Figure 7. Conditional Weighted Residual vs. Predicted (Typical) Plasma Concentration.
4.1.6 Applicant’s Results & Conclusions for the Final Model The effects of age, body weight, BSA and gender covariates on CL and Volume of the Central Compartment (VC) of the base model were assessed using the stepwise backward elimination method.
The final model was a two-compartment, zero-order IV infusion and first-order elimination model with a combined residual error model, with a random effect on CL, VC, Q and VP, and with BSA as a covariate on CL. None of the other covariate-parameter relationships were significant, after adjusting for the effect of BSA on CL.
CLTV is typical value of CL at the reference values of BSA (1.23 mg/m2) and CLBSA is the power-model coefficient of the BSA on CL. The reference value of BSA was selected to be approximately median value of variable in the PPK dataset.
Figure 8, shows BSA inclusion resulted in approximately ± 50% change in CL, relative to the typical value of CL for a reference subject. None of the other covariate relationships to CL and VC were statistically significant.
Submission Number Page 13 of 20
NDA22065 PPK.doc
Reference ID: 3016693
Figure 8. BSA covariate Effect on CL (PPK Final Model).
Note 1: Continuous covariate effects (95% CI) at the 5th/95th percentiles of the covariate are represented by the end of horizontal boxes (horizontal lines). Open/shaded area of boxes represents the range of covariate effects from the median to the 5th/95th percentile of the covariate. Note 2: Reference subject BSA=1.23 m2. Parameter estimate in reference subject is considered as 100% (vertical solid line) and dashed vertical lines are at 80% and 120% of this value.
Parameter estimates from the final model and the associated 95% confidence intervals are provided in Table 6.
Submission Number Page 14 of 20
NDA22065 PPK.doc
Reference ID: 3016693

Table 6. Parameter Estimates for PPK Final Model.
4.1.7 Applicant’s Final Model Evaluation Conclusions: Model evaluation was performed with VPC as described in Section 4.1.3. The results are depicted graphically on log-scale and normal scale for concentration over Day 1 in Figure 9. The results show that most of dose normalized observed ixabepilone plasma concentrations fall within the 90% prediction interval, indicating that the final model adequately describes ixabepilone time-concentration profile across the different dose regimen.
In contrast to the CWRES versus predicted concentration plot (Figure 7) where the model was slightly over predicting the higher concentration in some individuals, VPC demonstrated that the model had the ability to predict well, even higher concentrations. Therefore, the final model is considered to provide an adequate description of the population pharmacokinetics of ixabepilone in pediatric cancer patients.
Submission Number Page 15 of 20
NDA22065 PPK.doc
Reference ID: 3016693

Figure 9. Dose Normalized Observed Plasma Concentrations (normal and log-scale) and 90% Prediction Intervals of Simulated Data for Ixabepilone at Day 1.
Additional PPK Final Model Evaluation: Model evaluation was also performed by NCA parameter estimates as described in Section 3.1.2. The results are presented in Table 7. Parameter estimates with PPK model only using Day 1 data are provided in Table 8.
Table 7. Comparison of Geometric Mean PK Parameter Values determined by NCA and PPK Analyses (Day 1 Data and All Data).
The geometric mean value for CL from NCA and PPK model using Day 1 data only are in close agreement (<1% difference), while the difference was approximately 28% for the PPK model estimated with all available data. The geometric mean values of Vss and THALF determined by NCA methods were within 20% of the PPK determined values, except for the estimate of T-HALF of approximately 19 hr that was determined by PPK analysis of all available data, which was markedly higher than the NCA value.
The differences in parameter values determined by NCA analyses (with Day 1 data) and PPK analyses (with all available data) could be due to several factors. First, actual dose amount and PK sampling time were not available for the pediatric subjects, and the PPK analysis was performed with nominal dose amount and time. Differences between nominal and actual dose amount and time subsequent to Day 1 could result in differences between the NCA and PPK parameter estimates. Furthermore, the NCA parameter
Submission Number Page 16 of 20
NDA22065 PPK.doc
Reference ID: 3016693

estimates were determined using only Day 1 data, with PK sampling up to only 24 hr post-dose, which is short relative to the NCA estimated T-HALF of approximately 13 hours. Therefore, limitations in the sampling schedule used in the NCA analysis could result in imprecise NCA parameter estimates. It should be noted that PPK model parameter values determined with only Day 1 data were consistent with NCA parameter values.
Table 8. Parameter Estimates for Final Model using Day 1 Data Only.
4.1.8 Applicant’s Results and Conclusions for the Model Application This section presents results from model based comparison of exposure in pediatric and adult patients. Comparison of summary exposure of ixabepilone between adult and pediatric patients in same dosing schedule (QD×5, every 21 days) is presented in Table 9.
Submission Number Page 17 of 20
NDA22065 PPK.doc
Reference ID: 3016693

Table 9. Summary exposure of ixabepilone in pediatric and adult patients with the same dosing schedule (QDx5, every 21 days).
Figure 10 shows the distribution of the dose normalized AUCinf in adult and pediatric patients. The dose normalized median AUCinf in adults and pediatrics was 49 vs. 58 (ng.h/mL)/(mg/m2), respectively.
Figure 10. Dose normalized ixabepilone AUCinf in adult and pediatric at same dosing schedule (QD×5, every 21 days).
Submission Number Page 18 of 20
NDA22065 PPK.doc
Reference ID: 3016693

Figure 11 shows boxplots of model estimated BSA normalized CL in adult and pediatric patients receiving ixabepilone daily for 5 days every 21 days. BSA normalized CL of ixabepilone was similar in pediatric and adult patients (median values of 17 and 20 L/h/m2, and geometric mean values of 18.12 and 20.16 L/kg, respectively).
Figure 11. Boxplots of body surface area normalized clearance in adult and pediatric patients receiving ixabepilone (QD×5, every 21 days).
4.1.9 Applicant’s Overall Conclusions from the PPK Analysis and PPK Model Application:
• Ixabepilone concentration-time data were well described by a linear, two-compartment, zero-order IV infusion model with first-order elimination. The model established the relationship between CL and BSA, where CL increases with increase in BSA. The PPK model with parameter estimates reported in Table 5 provides an adequate fit and predictive performance to the time course of ixabepilone PK data for subjects receiving ixabepilone QD×5, every 21 days.
• The effect of BSA on CL was statistically significant (p<0.001) and clinically relevant (more than a 20% change in point estimates after inclusion). This further supports body surface area based dosing of ixabepilone in adults and pediatrics. No other covariates were statistically significant, after adjusting for the effect of BSA on CL.
• The ixabepilone pediatric PPK model was judged to adequately describe the observed data, based on VPC model evaluation with observed data. Differences between ixabepilone PK parameter values determined by NCA and PPK model is attributable to differences in the data used to determine these parameters, as the differences were within approximately 20% when only Day1 data are used to estimate the PPK model parameters.
Submission Number Page 19 of 20
NDA22065 PPK.doc
Reference ID: 3016693

• Summary measures of exposure (dose normalized Cmax at Day 1 and Day 5, Cmin at 24 hr post Day-1 and Day-5 dose and AUCinf) in pediatric patients are similar to adults.
4.1.10 Reviewer’s comments on Sponsor’s PPK Analysis The current PPK analysis and final model using all data appears adequate to describe the PK of ixabepilone in pediatric subjects for subjects receiving ixabepilone QD×5, every 21 days.
This PPK analysis was requested as an IR from the applicant based on shortcomings in the NCA submitted in S-006. Specifically in S-006, the applicant only did the NCA using the Day 1 pharmacokinetic data. Due to the relatively long half-life of ixabepilone reported in the current package insert, the pharmacokinetic data on day 1 alone may not allow for reliable estimates of the AUCinf and half-life, which would lead to problems in estimating the clearance and Vss as well. This is confirmed by the FDA reviewer’s analyses on the percent extrapolated ixabepilone AUC beyond Clast to AUCinf. Based on the FDA noncompartmental analysis, the percent extrapolated ixabepilone AUC beyond Clast to AUCinf was ≥ 20% for 11 out of the total number of 16 patient concentration-time curves (69% of patients) in the pharmacokinetic dataset (Table 10). Therefore, the pharmacokinetic parameters reported by the applicant in based on the NCA may not have been reliable, and are not suitable for labeling purposes.
Table 10. Percent extrapolated ixabepilone AUC beyond Clast to AUCinf from the FDA noncompartmental analysis for study CTEP-5425.
Ixabepilone dose (mg/m2/day)
(N)
AUC% Extrap
(%)
Mean
(range)
3 mg/m2
(n=3)
26 (16-34)
4.5 mg/m2
(n=4)
35 (24-46)
6 mg/m2
(n=3)
20 (14-28)
8 mg/m2
(n=5)
25 (11-46)
10 mg/m2
(n=1)
19 (n/a)
AUC%Extrap: Percent extrapolated ixabepilone AUC beyond Clast to AUCinf
Submission Number Page 20 of 20
NDA22065 PPK.doc
Reference ID: 3016693
---------------------------------------------------------------------------------------------------------
---------------------------------------------------------------------------------------------------------
----------------------------------------------------
This is a representation of an electronic record that was signed electronically and this page is the manifestation of the electronic signature.
/s/
JEANNE FOURIE 09/19/2011
CHRISTINE E GARNETT 09/19/2011
QI LIU 09/19/2011
Reference ID: 3016693