Office Market in Colombo: An Empirical Analysis Abstract
21
Sri Lankan Journal of Real Estate 18 Department of Estate Management Valuation University of Sri Jayewardenepura Office Market in Colombo: An Empirical Analysis R G Ariyawansa 16 and U J M Dilhani 17 Abstract Office can be defined as a place where mass of data is accumulated in a systematic manner and is analyzed for management actions and channels of communication within and outside of an organization. Hence, office market is an important area in the real estate sector particularly in developed cities where office market has the similar importance as the housing market. These cities have identified office as what accelerates the wheels of businesses. Therefore, there are heavy investments and returns in the office market. In developing cities like Colombo, office market seems to be less recognized compared to the other real estate markets, for instance, “housing market”. Therefore, “an assessment on the recognition of the office market in Colombo” is an important area for real estate research. It is also possible to compare Colombo’s situation with established office markets like New York, Hong Kong, and Berlin etc. However, this study aims to analyze the general pattern of the private sector office market in Colombo and to identify the determinants of the demand for office buildings. Data was obtained through a questionnaire survey using 30 private offices having selected through systematic random sampling technique within the Colombo Municipal Council limits. Elementary statistics as percentage and probability concepts and weighted score techniques were used for analysis. The study found that nearly 10% of real estate in the study area represents office properties. Eventhough the office market represents significant amount of real estate, there is no separate database, which maintains specifically for office property information. The Colombo Municipal Council has catergorized office properties as commercial buildings. According to the analysis 78% of offices are maintained as pure office and only 22% of offices are maintained as mixed office within the study area. As far as the ownership is concerened, the largest market segment is for the “leasehold office space in the city centre” according to the respondents’ view. Keywords: Office Market, Office Property, Real Estate Market 16 , Professor, Department of Estate Management and Valuation, University of Sri Jayewardenepura, Sri Lanka 17 Valuation trainer, Government Valuation Department,Sri Lanka
Transcript of Office Market in Colombo: An Empirical Analysis Abstract

Sri Lankan Journal of Real Estate
18
Department of Estate Management Valuation University of Sri Jayewardenepura
Office Market in Colombo: An Empirical Analysis R G Ariyawansa16 and U J M Dilhani17
Abstract Office can be defined as a place where mass of data is accumulated in a systematic manner and is analyzed for management actions and channels of communication within and outside of an organization. Hence, office market is an important area in the real estate sector particularly in developed cities where office market has the similar importance as the housing market. These cities have identified office as what accelerates the wheels of businesses. Therefore, there are heavy investments and returns in the office market. In developing cities like Colombo, office market seems to be less recognized compared to the other real estate markets, for instance, “housing market”. Therefore, “an assessment on the recognition of the office market in Colombo” is an important area for real estate research. It is also possible to compare Colombo’s situation with established office markets like New York, Hong Kong, and Berlin etc.
However, this study aims to analyze the general pattern of the private sector office market in Colombo and to identify the determinants of the demand for office buildings. Data was obtained through a questionnaire survey using 30 private offices having selected through systematic random sampling technique within the Colombo Municipal Council limits. Elementary statistics as percentage and probability concepts and weighted score techniques were used for analysis. The study found that nearly 10% of real estate in the study area represents office properties. Eventhough the office market represents significant amount of real estate, there is no separate database, which maintains specifically for office property information. The Colombo Municipal Council has catergorized office properties as commercial buildings. According to the analysis 78% of offices are maintained as pure office and only 22% of offices are maintained as mixed office within the study area. As far as the ownership is concerened, the largest market segment is for the “leasehold office space in the city centre” according to the respondents’ view.
Keywords: Office Market, Office Property, Real Estate Market 16, Professor, Department of Estate Management and Valuation, University of Sri
Jayewardenepura, Sri Lanka 17 Valuation trainer, Government Valuation Department,Sri Lanka

Sri Lankan Journal of Real Estate
19
Department of Estate Management Valuation University of Sri Jayewardenepura
Background The place “office” can be identified as an important part of an organization. Successful administration of an organization mostly depends on its office. Whether it is a government department, or a business enterprise or any form of organization, office is a vital component for its functions. It is very difficult to define the term “office” due to its broadness of application. It has been defined in a variety of ways. Generally, an office can be identified as a place where clerical operations of an organization are carried out. It is not too simple as Arora (1992) argues as the term office is identified with an activity not only a place and it is described as “any place where information on paper is come together and documented, preserved and used for current and future operations of business”. According to the functions of an office, it can be defined as any place where the mass of data is accumulated in a systematic manner and is analyzed for management actions and channels of communication within and outside of the organization.
Business organizations are facing with the rapidly changing conditions. As Terry (1996) describes man’s greatest tool to handle the dynamic situations is information. Information is required by all members of an enterprise. Retaining, analyzing and furnishing an appropriate type of information for various purposes to various people and from time to time is a basic need of enterprises. Broadly speaking, these activities are described as the functions of a modern office (Arora, 1992). In this way, office market has become an important part of the real estate sector. In the Western world, office market has the same importance as the housing market has since it is the office that moves the wheels of business efficiently. Therefore, there are heavy investments and returns in the office market. For instance, according to Colliers International Houston Office Market Report in 2008, they have earned 1719 million dollars from 2008 office sales. (www.collierstexas.com).
In Sri Lanka, real estate is a booming industry in which many innovations appear. However, office market related studies in the country seem not prominent. The reasons for that may be higher complexities in identifying an exact office market in Sri Lanka, even though most of other countries have well demarcated office markets such as New York Manhattan Office Market, Hong Kong Office Market, and Berlin Office Market etc. This study, therefore, aims to analyze the general pattern of the office market and to discuss the determinants of the demand for office space in Colombo.

Sri Lankan Journal of Real Estate
20
Department of Estate Management Valuation University of Sri Jayewardenepura
Methodology The primary data was obtained through questionnaire administration and interview methods. The semi structured questionnaire was administered on 30 private offices having selected through systematic random sampling technique within a municipal district area. Interview method was used to verify the ideas of relevant managers of selected offices. Elementary statistics as percentage and probability concepts and weighted score techniques were used to analyze the data.The study is confined to the firm’s point of view rather than investor’s point of view. The study focused only on the “private sector offices in Colombo Municipal Council Limit except the “Fort” area of Colombo. Views on Office Market in Different Contexts From firms’ point of view, a modern office is a very important and sophisticated administrative center. Its work is essential to an enterprise’s operations. It contributes significantly to the attainment of goals and to the progress of the enterprise (Terry, 1980). In words of office design consultant and an author Francis Duffy, "The office building is one of the great icons of the twentieth century. Office towers dominate the skylines of cities in every continent… the most visible index of economic activity, of social, technological, and financial progress, they have come to symbolize much of what this century has been about" (Duffy, 1997). Having proven the Duffy’s views, Adams et al (2005) stated that Philadelphia in Pennsylvania has enjoyed explosive growth in commercial office construction that has dramatically changed the appearance of the Philadelphia skyline in just a few years. Even, Conway (2007) justifies that the office building is the most tangible reflection of a profound change in employment patterns that has occurred over the last one hundred years. Further he says that “in present-day, America, Northern Europe, and Japan, at least 50% of the working population is employed in office settings as compared to 5% of the population at the beginning of the 20th century”. Demand and Supply of Space Real estate space markets involve transactions of the “rights to use” of land and buildings. On the demand side of this market, there are people, business firms and other entities willing to pay and use space for consumption or production purposes. The supply side of this market consists of property owners who are willing to sell such space to users so as to fulfill their need. The price of use in the space market is often called ‘rent’, even if the user is the owner occupant of the space (Charles and Marcus, 2002).

Sri Lankan Journal of Real Estate
21
Department of Estate Management Valuation University of Sri Jayewardenepura
Users of space often have specific requirements for the type of space they demand and the locations of that space. For instance, special community members such as elders, disables need specific facilities in office and other public buildings (Perera, 2008). Suppliers in the space market have buildings that are designed for needs of specific users and are fixed in suitable locations. Because supply and demand is location and type specific, real estate space markets are highly segmented and confined to regions. For instance, office space in Los Angelo is vastly a different market from the warehouse space market and office market in Texas. Further, the price (rents) for one type of space may be very different from the price for a different type of space in the same geographic area and prices for the same type of space in two different geographic areas may differ dramatically (Charles and Marcus, 2002). These differences exist mainly due to the inexpressible nature of demand for office and other space uses. For instance, the demand for office space may reduce in a situation of recession and as the market recovers, it can be expected to see an increase in demand. Peter and Alan (1998) described the respondents’ view of preferred accommodation type. This study considered the office market and illustrated the views over the certain types of properties. Accordingly, it is seen that smaller office occupiers hold no great preference in choice, but as the occupier group increases so does the demand for new and refurbished accommodation. This is a direct consequence of the lack of new large floor in buildings and the availability of larger refurbished accommodation. However, this situation is undoubtedly different for large business firms. Paul Strohm (1992) reports that there appears to be a division in thought as to how demand for offices has changed with the introduction of modern working practices. “On one hand subjective evidence suggests new working practices will cut the demand. On the other hand, figures indicate demand is not too far short of its 1987 peak” (Estates Gazette, 1997). This is a fact that tells about the complexity of the space market. Accordingly, the demand for offices depends on the actual business need and application of working practice. As a specific objective of Peter and Alan (1998) research, responses were viewed with regard to the demand for office space as a result of the implementation of modern working practices. Modern working practice is a multi-dimensioned area. It relates with the changes of employees, technology and social systems etc. For instance, as a legal requirement in the UK, all public buildings should provide adequate convenience access and other facilities for the elders and disables by year 2025 (Perera, 2008). All these suggest a need of systematic alteration to the space to be functionable. Peter’s research shows how views vary with occupier size. The smaller occupiers show little

Sri Lankan Journal of Real Estate
22
Department of Estate Management Valuation University of Sri Jayewardenepura
change in their demand, whereas the larger occupiers conversely show that a reduction in space would be required in the future. Occupational demand criteria: An important decision that any potential occupier will have to make is whether to purchase or to rent a suitable space for the requirement. The decision to buy or to rent will be affected by following factors (Ventolo et al, 2005).
i. The nature of the business and the requirement, or otherwise, for significant investment in specialist equipment.
ii. The image of the business and whether it requires to promote its own corporate ‘stamp’ on premises.
iii. The availability or otherwise of appropriate premises. iv. The financial implications, including the effect of taxation. v. Company policy.
Above mentioned factors seem to be generic determinants of space requirements. Whichever decision made by a particular person, there are common requirements as well. According to the general argument, any building choice, occupiers will take their property buying decision considering ‘three Ls i.e. Location, Layout, and Leasing; all of these will affect on their cost levels. Douglas (1995) also describes the same factors in detail as factors affect the decision to own or to lease of space. Some of these are difficult to incorporate explicitly in a “lease versus own” analysis, but they may affect on the final decision. They are space requirements; amount of space needed, risk bearing, management expertise, maintenance, special purpose buildings, tax considerations, access to capital market, control and effect on financial statements etc. The Supply for office space Supply refers to the amount of a good or service available in a market at various prices (Charles and Marcus, 2002). Ariyawansa (2008) emphasized the general objective of the land market as to ensure that lands are supplied in needed quantities, appropriate tenures, at the right time and appropriate prices having regarded to issues of efficiency and social equity. Though it may not be the same in the office market, it gives a general idea about the objective of the office market. David (2002) says that there remain significant “inefficiencies” in real estate, in both its commodity (or space) markets as well as its capital (or investment) markets. Further he shows in the space markets (the demand and supply factors that drive absorption, rents and vacancy rates), the most obvious evidence of

Sri Lankan Journal of Real Estate
23
Department of Estate Management Valuation University of Sri Jayewardenepura
inefficient markets are the double digit office vacancy rates. However, Ariyawansa (2008) argues that location and many other variances in the price in land market can be minimized if suppliers provide lands and property in appropriate locations and appropriate time with required infrastructures. Office supply in central business district vs. decentralized district: According to Archer and Smith (1994) despite the fact that Grade “A” office accommodation in the Central Business District (CBD) deserves certain market niches because of a more prestigious image and the clustering effect of professional firms or financial institutes. However, experts argue that the emergence of a Decentralized District (DD) around major cities and their continual expansion may reduce the future role of formal CBDs. However, Eddie and Raymond (2003) have examined the decentralization in Hong Kong’s office market, both the upturn and downturn and found different results. It has analyzed the vacancy trend of the Grade-A office market in Hong Kong: Decentralized Districts versus Central Business District (CBD), based on a Decentralization Index. This study reveals that the CBD has a more stable office market sector than the non-CBD. During a market upturn, the Grade-A office market in Hong Kong DD has outperformed than that are in the CBD. However, during a market downturn, the vacancy rate in the DD tends to increase at a greater rate than in the CBD. However, the finding of this study cannot be accepted and generalized without arguing. The result depends on the maturity level of DDs. Once the DDs are fully established and well matured, they may serve better than CBDs even at recessions. In such a situation, result of the same analysis may be different. Office markets in developed and developing cities There are many differences between developed and developing cities relating to the property markets such as market maturity (Keugh and D’ary, 1994 in Keugh and D’Ary, 1999 in Ariyawansa, 2008) and market efficiency (Gavin and Simon, 2000 in Ariyawansa, 2008). Office markets in many cities in developed countries have begun to perform as international office markets (Ariyawansa, 2008). For instance, Colliers International has 293 offices within 61 countries on 6 continents and they publish office market reports annually or quarterly as an international network (www.collierstexas.com accessed on 06.02.2009). At the same time, so many cities, particularly in developing cities, are not important in the global context and they do not function as global or secondary level cities (Ariyawansa, 2008). Accordingly Office markets in developing countries are far behind to developed cities in connection with the existence, performance and implications in the market.

Sri Lankan Journal of Real Estate
24
Department of Estate Management Valuation University of Sri Jayewardenepura
Office Market in Sri Lanka As a developing country, Sri Lanka has been overwhelmingly adopting the market system from the beginning of liberalized economic policy. It also seems that Sri Lanka has particular interest of real estate sector along with these changes (Central Bank, 1998). Since Colombo is promoted as the commercial and financial center of the country, need of land and property for office purposes has increased considerably. A vast majority of private and public institutions maintain their head offices and several branches in the Colombo city (Ariyawansa, 2008; Edirisinghe, 2004). This may be a result of the global economic trends in connecting cities for economic activities worldwide and nationalwide. Dodankotuwa (2000) points out that offices constructed in Colombo city recently were sold before the completion of construction. All these evident that there is a high potential demand for office space in Colombo. Results and discussion General pattern of the demand for office in Colombo Colombo Municipal Council (CMC) consists with 47 wards within five Administrative Districts (ADs) established for planning purposes (figure 01). Figure 1 - Colombo Municipal Council and its ADs
1
36
5
6
20
34
40
41
3
38
2
44
4
24 33
4239
9
8
43
37
46
23
29
7
47
21
35
45
22
28
31
15
12 14
13
3230
1816
25
26
1119
10
27
17
1000 0 1000 2000 Miles
CMC Administrative district map N
Administrative district1
2A2B345
Source: Colombo Municipal Council (2009)

Sri Lankan Journal of Real Estate
25
Department of Estate Management Valuation University of Sri Jayewardenepura
Accordingly, with the help of the Assessment Books which are maintained for each ward, under the section 235 of the Municipal Councils Ordinance (Chapter 252) & Register under the relevant bylaws relating to the registration of names and addresses of owners of lands and buildings by the Colombo Municipal Council (CMC) and through other relevant books, maps and reports, office related information within the Colombo Municipal Council Limit was collected. Colombo Municipal Council does not maintain a separate database for offices properties. For the rating and other administrative purposes, both office and shop properties have been categorized under the “commercial properties” by the CMC. In this circumstance, in order to identify office properties, this study uses the available data of the CMC property registry. Table 01 shows the categories and number of properties in each ward of the CMC by the time of the data collection. All the above properties can be clustered as per the 05 administrative districts as well. This helps to have a more specific view on the distribution of office properties within the CMC limit. Figure 02 shows the wards in administrative districts.
Table 1 – Type and Number of properties in the CMC Municipal Ward Residential Commercial Other Exempted Total
1.Mattakuliya 6297 443 34 57 6831
2.Modera 3134 252 56 67 3509
3.Mahawatte 2289 422 36 38 2785
4.Aluthmawatha 2541 182 379 28 3130
5.Lunupokuna 2050 160 140 126 2476
6.Bloemandhal 1718 439 83 239 2479
7.Kotahena East 1313 281 391 17 2002
8.Kotahena West 1876 323 29 174 2402
9.Kochchikade North 1338 1114 24 230 2706
10.Gintupitiya 1738 309 1 21 2069
11.Masangas Weediya 1262 860 5 119 2246
12.New Bazaar 1177 776 577 166 2696
13.Grandpass North 1377 274 436 30 2117
14.Grandpass South 1328 277 896 37 2538
15.Maligawatte West 840 335 1670 297 3142
16.Aluthkade East 1562 798 126 36 2522
17.Aluthkade West 1082 408 113 20 1623

Sri Lankan Journal of Real Estate
26
Department of Estate Management Valuation University of Sri Jayewardenepura
18.Kehelwatte 1012 371 372 29 1784
19.Kochchikade South 1428 1090 153 19 2690
20.Fort 275 9213 447 296 1,0231
21.Kopannaweediya 1301 307 68 35 1711
22.Wekande 1067 438 251 101 1857
23.Hunupitiya 848 432 195 72 1547
24.Suduwella 1080 610 67 60 1817
25.Panchikawatte 1228 590 270 56 2144
26.Maradana 927 546 4 44 1521
27.Maligakande 1324 243 136 45 1748
28.Maligawatte East 1212 149 725 56 2142
29.Dematagoda 2316 342 49 54 2761
30.Wanathamulla 1897 175 86 105 2263
31.Kuppiawatte East 1553 137 286 72 2048
32.Kuppiawatte West 1245 307 11 15 1578
33.Borella North 2465 144 283 83 2975
34.Narahenpita 2750 253 973 50 4026
35.Borella South 1172 613 90 309 2184
36.Cinnamon Gardens 2336 563 254 50 3203
37.Kollupitiya 1884 1195 79 21 3179
38.Bambalapitiya 2701 1536 78 23 4338
39.Milagiriya 2187 1191 8 20 3406
40.Thimbirigasyaya 2301 406 437 73 3217
41.Kirula 3941 518 327 27 4813
42.Havelock Town 2779 472 39 21 3311
43.Wellewatte North 3797 751 9 151 4708
44.Kirillapone 3424 308 7 131 3870
45.Pamankada East 2670 289 3 105 3067
46.Pamankada West 3633 373 5 81 4092
47.Wellewatte South 2908 388 20 107 3423 Total 92,538 31,603 10,728 4,013 138,927
Source: Colombo Municipal Council (2009)

Sri Lankan Journal of Real Estate
27
Department of Estate Management Valuation University of Sri Jayewardenepura
Figure 2 - Administrative Districts in CMC
Source: Prepared by the Author using the information from the CMC (2009) Table 2 shows the percentages of commercial (office and shops) properties in Administrative Districts (ADs). As such, administrative district 01, 2B, 2A, 03, 04 and 05, possess 9.77%, 23.91%, 28.09%, 13.41%, 9.30%, and 22.61% commercial properties respectively. In view of that, the highest numbers of office and shop properties are located within the area of the Administrative District 2A. Table 2 - Percentages of Office and Shops in Ads
Administrative District No-01 Ward Ward Name Total Shop+Office Shop+Office
1 Mattakuliya 6831 443 6.49 2 Modera 3509 252 7.18 3 Mahawatte 2785 422 15.15 4 Aluthmawatha 3130 182 5.81 5 Lunupokuna 2476 160 6.46

Sri Lankan Journal of Real Estate
28
Department of Estate Management Valuation University of Sri Jayewardenepura
6 Bloemandhal 2479 439 17.71 7 Kotahena East 2002 281 14.04 8 Kotahena West 2402 323 13.45
Total 25614 2502 9.77 Administrative District No-2B
Ward Ward Name Total Shop+Office Shop+Office 9 Kochchikade North 2706 1114 41.17 10 Gintupitiya 2069 309 14.93 11 Masangas Weediya 2246 860 38.29 12 New Bazaar 2696 776 28.78 13 Grandpass North 2117 274 12.94 14 Grandpass South 2538 277 10.91 15 Maligawatte West 3142 335 10.66 16 Aluthkade East 2522 798 31.64 17 Aluthkade West 1623 408 25.14 18 Kehelwatte 1784 371 20.80 19 Kochchikade South 2690 1090 40.52 28 Maligawatte East 2142 149 6.96
Total 28275 6761 23.91 Administrative District No-2A
Ward Ward Name Total Shop+Office Shop+Office 21 Slave Island 1711 307 17.94 22 Wekande 1857 438 23.59 23 Hunupitiya 1547 432 27.93 24 Suduwella 1817 610 33.57 25 Panchikawatte 2144 590 27.52 26 Maradana 1521 546 35.90 27 Maligakande 1748 243 13.90 37 Kollupitiya 3179 1195 37.59
Total 15524 4361 28.09 Administrative District No-03
Ward Ward Name Total Shop+Office Shop+Office 29 Dematagoda 2761 342 12.39 30 Wanathamulla 2263 175 7.73 Cont. 31 Kuppiawatte East 2048 137 6.69

Sri Lankan Journal of Real Estate
29
Department of Estate Management Valuation University of Sri Jayewardenepura
32 Kuppiawatte West 1578 307 19.46 33 Borella North 2975 144 4.84 35 Borella South 2184 613 28.07 36 Cinnamon Gardens 3203 563 17.58
Total 17012 2281 13.41 Administrative district- No 04
Ward Ward Name Total Shop+Office Shop+Office 34 Narahenpita 4026 253 6.28 40 Thimbirigasyaya 3217 406 12.62 41 Kirula 4813 518 10.76 44 Kirillapone 3870 308 7.96 45 Pamankada East 3067 289 9.42 46 Pamankada West 4092 373 9.12
Total 23085 2147 9.30 Administrative district-No 05
Ward Ward Name Total Shop+Office Shop+Office 38 Bambalapitiya 4338 1536 35.41 39 Milagiriya 3406 1191 34.97 42 Havelock Town 3311 472 14.26 43 Wellewatte North 4708 751 15.95 47 Wellewatte South 3423 388 11.34
Total 19186 4338 22.61 Sources: Compiled by the author using data and information from the CMC (2009) The comparative stance of the distribution of office and shop properties is more clearly illustrated by the following figure 03.Since the highest numbers of office and shops are located in the Administrative District 2A, this study made detail analysis of the properties in the area to identify the general pattern of office property distribution in the city. It consists with 8 wards and shown in the figure 4.

Sri Lankan Journal of Real Estate
30
Department of Estate Management Valuation University of Sri Jayewardenepura
Figure 3 – Percentage of Office and Shop in each Ads of the CMC
Source: Compiled by the Author Figure 04- Administrative District 2A
Source: Compiled by the Author

Sri Lankan Journal of Real Estate
31
Department of Estate Management Valuation University of Sri Jayewardenepura
According to the usage of office space, office properties can be categorized as Pure Office and Mixed Office. Table 03 shows that 78% of offices are used as Purely Office purpose and the rest of 22% of premises are used as Mixed Office purposes. Table 3 - Usage of Office Space
Ward No Ward Name Pure Office Mixed Office Total 21 Slave Island 42 15 57 22 Wekande 170 30 200 23 Hunupitiya 131 50 181 24 Suduwella 208 81 289 25 Panchikawatte 16 31 47 26 Maradana 81 25 106 27 Maligakande 18 14 32 37 Kollupitiya 471 80 551
Total 1137 326 1463 Percentage 78% 22% 100% Source: Colombo Municipal Council (2009) According to above table total amount of office properties are 1463 in the Administrative District 2 A and the total number of commercial properties (office and shops) are 4361, which accounts for 28% of the total properties i.e. 15524. Further, it is noted that the number of shop properties are greater than office as (4361-1463) 2898. Hence percentage of shop properties is 18.6% and percentage of office properties from total properties is 9.4% while the rest of 72% represents residential and other properties. According to the figure 05 and 06, the distribution of offices within Administrative District 2A, particularly in the areas of Wekanda, Hunupitiya, Suduwella and kollupitiya wards are more significant than Slave Island, Panchikawaththa, Maradana and Maligakanda. 128696 As per the above results, the highest numbers of offices are located in Wekanda, Hunupitiya, Suduwella and Kollupitiya wards. Hence, those wards were considered as the most suitable areas for primary data collection to identify the determinants of the demand for office. Table 04 shows the composition of the sample.

Sri Lankan Journal of Real Estate
32
Department of Estate Management Valuation University of Sri Jayewardenepura
Figure 05 – Percentages of Office and Shop Properties in the AD-2A (ward wise)
Source: Compiled by the Author Figure 06 – Percentages of Office Properties in the AD-2A (ward wise)
Source: Compiled by the Author
Sri Lankan Journal of Real Estate
33
Department of Estate Management Valuation University of Sri Jayewardenepura
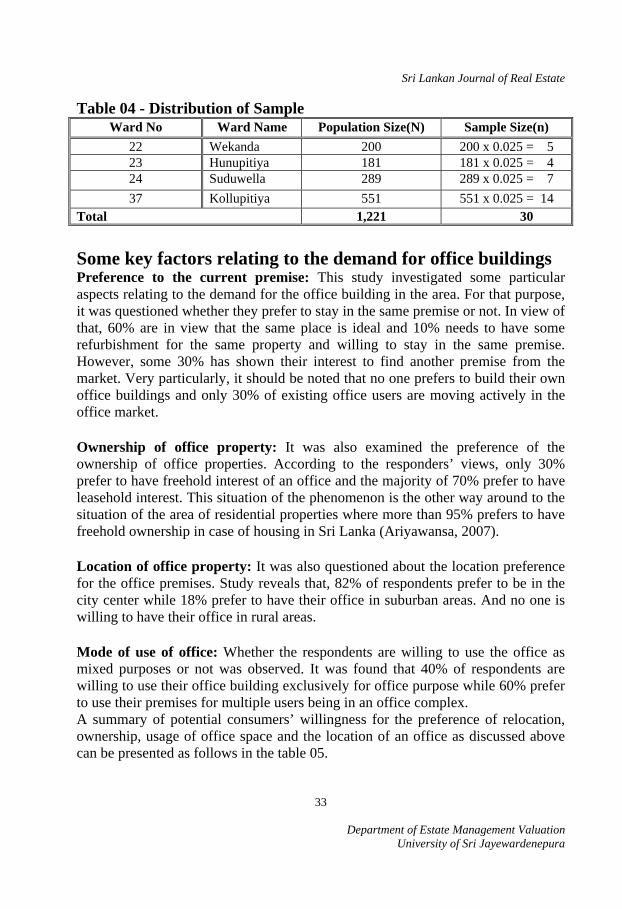
Table 04 - Distribution of Sample Ward No Ward Name Population Size(N) Sample Size(n)
22 Wekanda 200 200 x 0.025 = 5 23 Hunupitiya 181 181 x 0.025 = 4 24 Suduwella 289 289 x 0.025 = 7 37 Kollupitiya 551 551 x 0.025 = 14
Total 1,221 30
Some key factors relating to the demand for office buildings Preference to the current premise: This study investigated some particular aspects relating to the demand for the office building in the area. For that purpose, it was questioned whether they prefer to stay in the same premise or not. In view of that, 60% are in view that the same place is ideal and 10% needs to have some refurbishment for the same property and willing to stay in the same premise. However, some 30% has shown their interest to find another premise from the market. Very particularly, it should be noted that no one prefers to build their own office buildings and only 30% of existing office users are moving actively in the office market. Ownership of office property: It was also examined the preference of the ownership of office properties. According to the responders’ views, only 30% prefer to have freehold interest of an office and the majority of 70% prefer to have leasehold interest. This situation of the phenomenon is the other way around to the situation of the area of residential properties where more than 95% prefers to have freehold ownership in case of housing in Sri Lanka (Ariyawansa, 2007). Location of office property: It was also questioned about the location preference for the office premises. Study reveals that, 82% of respondents prefer to be in the city center while 18% prefer to have their office in suburban areas. And no one is willing to have their office in rural areas. Mode of use of office: Whether the respondents are willing to use the office as mixed purposes or not was observed. It was found that 40% of respondents are willing to use their office building exclusively for office purpose while 60% prefer to use their premises for multiple users being in an office complex. A summary of potential consumers’ willingness for the preference of relocation, ownership, usage of office space and the location of an office as discussed above can be presented as follows in the table 05.

Sri Lankan Journal of Real Estate
34
Department of Estate Management Valuation University of Sri Jayewardenepura
Table 05 - Percentage preferences for each attribute
Attributes % Preferences for each attributeStay at the same place SS (60%) RF (10%) OM (30%) Ownership FH (30%) LH (70%) Usage of office space SI (40%) MU (60%) Location CC (80%) SU (20%)
Notes SS: stay at same place RF: refurbished OM: office market (lease, rent or buy) FH: freehold (buy) LH: leasehold (lease) SI: single use MU: multiple use CC: office in city center SU: office in suburban
Thus, the probability (P) of willingness to stay at the same office building of a randomly selected occupier is 60%. It can be expressed as, P (SS) =60%. Accordingly the probability of one who prefers to buy freehold ownership of an office for single use can be computed as P (FH)*P (SI) = 0.30*0.40 = 12 %. Similarly size of the office market according to the above criteria can be computed as shown in the following table 06. Table 06 - Potential Office Market Segments
Market Segment Size from the sample
Those who prefer to buy freehold interest office building for single use.FH (30%).SI (40%)
12%
Those who prefer to buy freehold interest & to be one of the multiple users in an office complex. FH (30%).MU (60%)
18%
Those who prefer to buy Leasehold interest office building for single use. LH (70%).SI (40%)
28%
Those who prefer to buy Leasehold interest & to be one of multiple users in an office complex. LH (70%).MU (60%)
42%
Those who prefer to buy Leasehold interest in city center. LH (70%).CC (80%0
56%
Those who prefer to buy Leasehold interest to be one of multiple users in an office complex in City center. LH (70%).MU (60%).CC (80%)
34%
Those who prefer to buy Leasehold interest to be one of multiple users in an office complex in suburban center. LH (70%).MU (60%).SU (20%)
8%

Sri Lankan Journal of Real Estate
35
Department of Estate Management Valuation University of Sri Jayewardenepura
According to the computation, the largest market segment is for the leasehold office space in the city centre while the least market segment is for the leasehold interest for multiple uses in suburban areas. Some more factors of concerned in Demand There are some common factors that the respondents mentioned in addition to the preference of existing premises, ownership of office property, location of office property and usage pattern of office property. Appearance: The need for an image to be reflected by means of the appearance of the office building is regarded as an important matter of fact. In this regard, 80% of respondents indicated that external appearance is an important in the case of office premises. Accessibility: In general, it is said that higher accessibility is a must for office. However, this study clearly found that such a higher accessibility is not considered as an important matter. They expect average accessibility for their office workers as well as their clients. Notwithstanding, they expect higher “Image for location” to ensure a good working environment during the working hours. Flexibility with ownership agreements: This is another common objective of many firms. Under the flexibility they highlighted the following rights in agreements.
i. Providing the appropriate contraction and expansion ii. Early termination rights
iii. Sublease right Use of IT facilities: It is obvious that the information technology began to have a marked effect on the demand for office accommodation. Because all the firms are needed to verify whether appropriate facilities are available for fittings of hardware. Hence, understanding of firms’ usage of information technology is also important. According to the response of interviewees, all the organizations use internet and e-mail facilities. Figure 07 shows percentages of staff that uses computers of the organizations.

Sri Lankan Journal of Real Estate
36
Department of Estate Management Valuation University of Sri Jayewardenepura
Figure 07 – Percentage of staff using of computers
Source: Authors’ fieldwork 2009. According to these statistics, the highest numbers of organizations are within the range of 50% - 75%, which means 50% - 75% of their staff uses computers with internet connections. Quality and Comfort: Quality and comfort are crucial to visitors and workers of office. Because they emphasized that there should be an appropriate office layout and good condition of electrical, mechanical, life safety and telecommunication systems.
Mix of amenities: They expect a certain mix of amenities from office building in addition to the above requirement such as,
i. Conference halls ii. Security services
iii. Parking facilities
Price or rental value: Price is also remaining as a decisive factor for office space according to the respondents’ view.
Concluding Remarks The analysis shows that nearly 10% of real estate in the study area represents office premises. Eventhough office represent significant amount of real estate, nobody has maintained a separate database for office properties. Even, the Colombo Municipal Council has identified offices as commercial buildings. Accordingly, both shops and office properties have been categorized as commercial properties.

Sri Lankan Journal of Real Estate
37
Department of Estate Management Valuation University of Sri Jayewardenepura
Study found that the Administrative District 2A has the highest number of office buildings in the Colombo city. The results show that Wekanda, Hunupitiya, Suduwella and Kollupitiya wards are significant. Since the boundries of all these wards are adjoing with each other, there is a good relationship among them and it can be concluded that Colombo office market is mainly concentrated into these wards. According to the results of the analysis 78% of offices are maintained as pure office and only 22% of offices are maintained as mixed office within the study area. Based on this result, another conclusion that can be drawn is that there is a high demand for pure office building rather than mixed use office building. As far as the ownership is concerened, the largest market segment is for the leasehold office space in the city centre while the least market segment is for the leasehold interest for multiple uses in suburban areas. Analysis revealed that only 30% of office occupires in the case study area would like to move their exisisting place and accoredingly there is a high demand for “leasehold interest of office complexes in the city center”. The highest potential market segment in the ofiice market is the “leasehold interest for office in the city centre”. In addition, it was identified several other determinants of office demand. Providing a mix of amenities is critical including a conference center, security services, and parking. Flexibility is another common objective of many firms, such as receiving the appropriate contraction expansion and early termination rights as well as sublease rights are important. Information technology is another demand factor as more organizations use internet, e-mail facilities and other computer applications. Quality and comfort are also critical to certain tenants. Thus, suppliers have to consider seriously about the infrastructure such as electrical, mechanical, life safety and telecommunication systems etc. Most of firms prefer to be cluster in a location which has prestige image and only an average accessibility is considered. Price and building appearance are also remaining as decisive factors for office space in Colombo. References a) Ariyawansa R G (2007), “An Empirical Study of Consumer Behavior in the
Housing Market in Colombo”, Built-Environment-Sri Lanka, Vol.08, No.01, pp. 11-19
b) Ariyawansa R G (2008), “Property Market in Colombo”, Published by the author, Colombo

Sri Lankan Journal of Real Estate
38
Department of Estate Management Valuation University of Sri Jayewardenepura
c) Arora S P (1992), “Office Organization and Management”, Vikas; New Delhi d) Central Bank of Sri Lanka (1998),”Economic Progress of Independent Sri
Lanka”, Central Bank Publication, Colombo e) Charles F and Marcus T (2002), “Real Estate Principles”, Dearborn Real
estate Education, Chicago. f) Colombo Municipal Council (2009), Reports g) Conway B (2007), “The Office Building”, The Planning Site, LLC Last
updated: 05-25-2007 h) David P (2002), “Is Real Estate an Efficient Market? Not Yet, But So What?”,
Kennedy Associates Real Estate Council i) Dodankotuwa J B (2000), “Recent Trends in Real Estate Market”, in
www.lankaproperty.net/news.htm. j) Douglas S (1995), “Property Asset Management”, E & F N Spon, London k) Duffy F (1997), “The New Office”, Conran Octopus Limited, London. l) Eddie C and Raymond Y C (2004), “Assessment of Office Market in Hong
Kong decentralized district vs. CBD Boom &Gloom”, Property Management, 22(2):pp.93-107.
m) Edirisinghe P (2004), “Colombo - Then and Now”, Sunday Observer, February 14th 2004 in www.sundayobserver.lk/2004/02/15/fea15.html
n) Estates Gazette, (1997), UK http://www.citypopulation.de / Sri Lanka (Census, 2001) (accessed on 16.03.2009)
o) Perera M A N R M (2008), Are We Ready to Care Our Senior Citizens?” Economic Review, Special issue on An Issue on Ageing of Population: An Emerging Issue, People’s Bank Publications, Sri Lanka, April/May
p) Peter D and Alan W (1998), “Corporate real Estate: Changing Office Occupier Needs”, Property Value and Investment, Vol. 16(4) pp.411-418.MCB University press.
q) Terry G (1996), “Office Management and Control”, Richard D. Irwin; Homewood
r) Ventolo W et al. (2005), “Fundamental of Real Estate Appraisal”, Dearborn, Chicago
s) www.collierstexas.com (accessed on 11.02.2009) t) http://www.statistics.gov.lk/census (accessed on 11.02.2009)