OFFICE DEPOT - VICTORIA CROSSING - LoopNetimages4.loopnet.com/d2/74ZLppDL9POcaMQvUOFAAlqB7... ·...
11
536 OFFICE DEPOT - VICTORIA CROSSING N NAVARRO STREET AT LOOP 463 VICTORIA, TX 77904 LYNANN PINKHAM LYNANN PINKHAM 5541 BEAR LANE, SUITE 240 CORPUS CHRISTI, TX 78405 T 361.289.5168 F 361.289.5442 CRAVEYREALESTATE.COM
Transcript of OFFICE DEPOT - VICTORIA CROSSING - LoopNetimages4.loopnet.com/d2/74ZLppDL9POcaMQvUOFAAlqB7... ·...

53
6
OFFICE DEPOT - VICTORIA CROSSINGN NAVARRO STREET AT LOOP 463 VICTORIA, TX 77904
LYNANN PINKHAMLYNANN PINKHAM
5541 BEAR LANE, SUITE 240 CORPUS CHRISTI, TX 78405 T 361.289.5168 F 361.289.5442 CRAVEYREALESTATE .COM

OFFICE DEPOT - VICTORIA CROSSING
TABLE OF CONTENTS
The information contained was obtained from sources believed reliable, however, Cravey Real Estate Services, Inc. makes no guarantees, warranties or representations as to the completeness or accuracy thereof. The presentation of this project is submitted subject to the errors, omissions and change of price or conditions prior to lease or withdrawal.
SECTION I.. ... ... ... ... ... ... ... EXECUTIVE SUMMARY
SECTION II. ... ... ... ... ... ... ... MAPS
SECTION III ... ... ... ... ... ... ... AERIALS
SECTION IV... ... ... ... ... ... ... SITE PLAN
SECTION V ... ... ... ... ... ... ... DEMOGRAPHICS
SECTION VI... ... ... ... ... ... ... AGENCY DISCLOSURE
©CRAVEY REAL ESTATE SERVICES, INC.

OFFICE DEPOT - VICTORIA CROSSING
EXECUTIVE SUMMARY
PROPERTY HIGHLIGHTS Office Depot is part of the Victoria Crossing Power Center located within the city’s primary retail corridor and directly across from Victoria Mall, the only shop-ping mall within a 100-mile radius. Victoria Crossing is surrounded by national retailers including Dillard’s, Home Depot, JC Penney, and Lowe’s just to name a few. Victoria, TX is strategically located equal distance between San Antonio and Houston and near Corpus Christi and the Gulf of Mexico. Victoria is the retail, medical and higher education hub of the seven-coun-ty region known as the “Golden Crescent” which is home to over 250,000 residents.
LOCATION N Navarro Street at Loop 463 Victoria, TX 77904
GLA 23,500 SF (approximate)
RENTAL RATE Contact Broker for pricing
TRIPLE NETS $3.00 PSF per year
KEY TENANTS Target, Ross Dress for Less, Bed Bath & Beyond, and PetSmart
AREA RETAILERS Best Buy, Beall’s, Sears, Cinemark Theaters, Kohls, Academy Sports & Outdoors, WalMart and Sam’s Club
TRAFFIC COUNTS (2015 TxDOT) Loop 463 (Zac Lentz Pkwy) 34,072 CPD Navarro Street 36,938 CPD
CONTACT LYNANN PINKHAM, BROKER ASSOCIATE 361.288.3102 [email protected]
DEMOGRAPHIC SNAPSHOT 3 Mile 5 Miles 7 Miles
2017 Estimated Population 33,912 63,411 76,085
2017 Estimated Households 13,519 24,450 28,815
Daytime Population 15,773 35,124 39,266
Average Household Income $83,743 $75,235 $73,467
SECTION I

OFFICE DEPOT - VICTORIA CROSSING
MAPS
SECTION II
OFFICE DEPOT VICTORIA CROSSING
OFFICE DEPOT VICTORIA CROSSING

OFFICE DEPOT - VICTORIA CROSSING
VICTORIA MALL
34,072 CPD
VICTORIA CROSSING
36
,93
8 C
PD
SU
BJ
EC
TSECTION III
AERIAL

OFFICE DEPOT - VICTORIA CROSSING
SUBJECT
36
,93
8 C
PD
VICTORIA MALL
34,072 CPD
Shared Store EntrancePoint with Target
SECTION III
AERIAL

OFFICE DEPOT - VICTORIA CROSSING
SITE PLANS
SECTION IV
SUBJECT
SITE PLAN

OFFICE DEPOT - VICTORIA CROSSING
DEMOGRAPHICS
SECTION V
Demographic Source: Applied Geographic Solutions 04/2017, TIGER Geography page 1 of 3©2017, Sites USA, Chandler, Arizona, 480-491-1112
Thi
s re
port
was
pro
duce
d us
ing
data
from
priv
ate
and
gove
rnm
ent s
ourc
es d
eem
ed to
be
relia
ble.
The
info
rmat
ion
here
in is
pro
vide
d w
ithou
t rep
rese
ntat
ion
or w
arra
nty.
FULL PROFILE2000-2010 Census, 2017 Estimates with 2022 ProjectionsCalculated using Weighted Block Centroid from Block Groups
Lat/Lon: 28.8662/-96.9991RF1
Navarro at Loop 4633 mi radius 5 mi radius 7 mi radius
Victoria, TX 77904
PO
PU
LATI
ON
2017 Estimated Population 33,912 63,411 76,0852022 Projected Population 35,640 66,929 80,5492010 Census Population 31,603 56,983 69,4832000 Census Population 29,721 54,708 67,179Projected Annual Growth 2017 to 2022 1.0% 1.1% 1.2%Historical Annual Growth 2000 to 2017 0.8% 0.9% 0.8%
HO
US
EH
OLD
S 2017 Estimated Households 13,519 24,450 28,8152022 Projected Households 14,444 26,254 31,0392010 Census Households 12,317 21,712 25,9612000 Census Households 11,288 20,341 24,402Projected Annual Growth 2017 to 2022 1.4% 1.5% 1.5%Historical Annual Growth 2000 to 2017 1.2% 1.2% 1.1%
AG
E
2017 Est. Population Under 10 Years 14.9% 14.6% 14.7%2017 Est. Population 10 to 19 Years 13.3% 13.4% 13.6%2017 Est. Population 20 to 29 Years 13.9% 14.8% 14.6%2017 Est. Population 30 to 44 Years 18.9% 19.0% 18.8%2017 Est. Population 45 to 59 Years 16.6% 17.0% 17.1%2017 Est. Population 60 to 74 Years 14.6% 14.2% 14.3%2017 Est. Population 75 Years or Over 7.8% 7.0% 6.8%2017 Est. Median Age 35.3 34.7 34.6
MA
RIT
AL
STA
TUS
&G
EN
DE
R
2017 Est. Male Population 47.5% 48.6% 48.7%2017 Est. Female Population 52.5% 51.4% 51.3%
2017 Est. Never Married 24.3% 28.3% 29.1%2017 Est. Now Married 54.8% 50.3% 49.9%2017 Est. Separated or Divorced 14.2% 15.4% 15.1%2017 Est. Widowed 6.6% 5.9% 5.9%
INC
OM
E
2017 Est. HH Income $200,000 or More 6.5% 5.3% 4.9%2017 Est. HH Income $150,000 to $199,999 5.3% 4.7% 4.5%2017 Est. HH Income $100,000 to $149,999 18.6% 15.9% 15.6%2017 Est. HH Income $75,000 to $99,999 13.1% 12.4% 12.0%2017 Est. HH Income $50,000 to $74,999 17.2% 17.5% 17.7%2017 Est. HH Income $35,000 to $49,999 13.4% 14.1% 14.5%2017 Est. HH Income $25,000 to $34,999 8.4% 10.0% 10.5%2017 Est. HH Income $15,000 to $24,999 9.8% 10.9% 10.9%2017 Est. HH Income Under $15,000 7.9% 9.3% 9.5%2017 Est. Average Household Income $83,743 $75,235 $73,4672017 Est. Median Household Income $71,575 $64,855 $62,7882017 Est. Per Capita Income $33,462 $29,222 $28,012
2017 Est. Total Businesses 1,507 3,341 3,7362017 Est. Total Employees 15,773 35,124 39,266

OFFICE DEPOT - VICTORIA CROSSING
DEMOGRAPHICS
SECTION VDemographic Source: Applied Geographic Solutions 04/2017, TIGER Geography page 2 of 3©2017, Sites USA, Chandler, Arizona, 480-491-1112
Thi
s re
port
was
pro
duce
d us
ing
data
from
priv
ate
and
gove
rnm
ent s
ourc
es d
eem
ed to
be
relia
ble.
The
info
rmat
ion
here
in is
pro
vide
d w
ithou
t rep
rese
ntat
ion
or w
arra
nty.
FULL PROFILE2000-2010 Census, 2017 Estimates with 2022 ProjectionsCalculated using Weighted Block Centroid from Block Groups
Lat/Lon: 28.8662/-96.9991RF1
Navarro at Loop 4633 mi radius 5 mi radius 7 mi radius
Victoria, TX 77904
RA
CE
2017 Est. White 79.6% 77.1% 76.4%2017 Est. Black 6.4% 7.3% 7.7%2017 Est. Asian or Pacific Islander 2.4% 2.0% 1.8%2017 Est. American Indian or Alaska Native 0.5% 0.6% 0.6%2017 Est. Other Races 11.2% 13.1% 13.6%
HIS
PA
NIC 2017 Est. Hispanic Population 12,495 28,484 36,032
2017 Est. Hispanic Population 36.8% 44.9% 47.4%2022 Proj. Hispanic Population 38.5% 46.5% 48.9%2010 Hispanic Population 35.8% 43.2% 46.1%
ED
UC
ATI
ON
(Adu
lts25
orO
lder
)
2017 Est. Adult Population (25 Years or Over) 22,078 41,025 49,0412017 Est. Elementary (Grade Level 0 to 8) 3.6% 6.5% 7.5%2017 Est. Some High School (Grade Level 9 to 11) 7.2% 9.4% 9.9%2017 Est. High School Graduate 29.1% 30.4% 30.9%2017 Est. Some College 25.4% 23.9% 23.5%2017 Est. Associate Degree Only 10.1% 9.1% 8.8%2017 Est. Bachelor Degree Only 17.3% 14.4% 13.4%2017 Est. Graduate Degree 7.2% 6.3% 5.9%
HO
US
ING 2017 Est. Total Housing Units 14,237 26,027 30,865
2017 Est. Owner-Occupied 58.3% 54.3% 55.1%2017 Est. Renter-Occupied 36.7% 39.6% 38.3%2017 Est. Vacant Housing 5.0% 6.1% 6.6%
HO
ME
SB
UIL
TB
YY
EA
R 2010 Homes Built 2005 or later 1.7% 1.4% 1.4%2010 Homes Built 2000 to 2004 9.7% 9.3% 9.8%2010 Homes Built 1990 to 1999 18.4% 15.1% 14.9%2010 Homes Built 1980 to 1989 25.5% 21.3% 20.4%2010 Homes Built 1970 to 1979 21.2% 19.4% 19.6%2010 Homes Built 1960 to 1969 12.2% 12.0% 11.7%2010 Homes Built 1950 to 1959 15.8% 18.8% 18.1%2010 Homes Built Before 1949 5.0% 10.7% 11.3%
HO
ME
VA
LUE
S
2010 Home Value $1,000,000 or More - - - 2010 Home Value $500,000 to $999,999 2.5% 2.2% 2.1%2010 Home Value $400,000 to $499,999 2.3% 2.1% 2.0%2010 Home Value $300,000 to $399,999 5.9% 6.4% 6.5%2010 Home Value $200,000 to $299,999 20.3% 17.1% 16.0%2010 Home Value $150,000 to $199,999 24.1% 20.8% 19.5%2010 Home Value $100,000 to $149,999 29.4% 26.0% 24.4%2010 Home Value $50,000 to $99,999 17.3% 22.2% 23.4%2010 Home Value $25,000 to $49,999 3.8% 7.0% 8.3%2010 Home Value Under $25,000 2.9% 3.0% 3.8%2010 Median Home Value $158,387 $146,184 $140,9402010 Median Rent $691 $647 $667

OFFICE DEPOT - VICTORIA CROSSING
DEMOGRAPHICS
SECTION V
Demographic Source: Applied Geographic Solutions 04/2017, TIGER Geography page 3 of 3©2017, Sites USA, Chandler, Arizona, 480-491-1112
Thi
s re
port
was
pro
duce
d us
ing
data
from
priv
ate
and
gove
rnm
ent s
ourc
es d
eem
ed to
be
relia
ble.
The
info
rmat
ion
here
in is
pro
vide
d w
ithou
t rep
rese
ntat
ion
or w
arra
nty.
FULL PROFILE2000-2010 Census, 2017 Estimates with 2022 ProjectionsCalculated using Weighted Block Centroid from Block Groups
Lat/Lon: 28.8662/-96.9991RF1
Navarro at Loop 4633 mi radius 5 mi radius 7 mi radius
Victoria, TX 77904
LAB
OR
FOR
CE
2017 Est. Labor Population Age 16 Years or Over 26,071 49,029 58,5892017 Est. Civilian Employed 62.7% 61.1% 60.9%2017 Est. Civilian Unemployed 3.8% 3.5% 3.5%2017 Est. in Armed Forces 0.1% 0.1% 0.1%2017 Est. not in Labor Force 33.4% 35.3% 35.5%2017 Labor Force Males 46.8% 47.8% 48.0%2017 Labor Force Females 53.2% 52.2% 52.0%
OC
CU
PA
TIO
N
2010 Occupation: Population Age 16 Years or Over 16,689 29,267 35,6722010 Mgmt, Business, & Financial Operations 13.7% 12.1% 11.9%2010 Professional, Related 26.2% 24.1% 22.9%2010 Service 13.9% 16.5% 17.4%2010 Sales, Office 27.3% 24.9% 24.6%2010 Farming, Fishing, Forestry - 0.1% 0.1%2010 Construction, Extraction, Maintenance 7.2% 10.0% 10.6%2010 Production, Transport, Material Moving 11.7% 12.3% 12.5%2010 White Collar Workers 67.2% 61.1% 59.4%2010 Blue Collar Workers 32.8% 38.9% 40.6%
TRA
NS
PO
RTA
TIO
NTO
WO
RK
2010 Drive to Work Alone 81.9% 80.7% 80.2%2010 Drive to Work in Carpool 12.3% 13.2% 13.5%2010 Travel to Work by Public Transportation 0.3% 0.9% 1.0%2010 Drive to Work on Motorcycle 0.5% 0.3% 0.3%2010 Walk or Bicycle to Work 1.3% 1.4% 1.3%2010 Other Means 0.2% 0.3% 0.3%2010 Work at Home 3.4% 3.1% 3.3%
TRA
VE
LTI
ME 2010 Travel to Work in 14 Minutes or Less 59.3% 55.8% 51.3%
2010 Travel to Work in 15 to 29 Minutes 29.5% 30.8% 34.6%2010 Travel to Work in 30 to 59 Minutes 10.8% 11.0% 10.8%2010 Travel to Work in 60 Minutes or More 4.2% 3.9% 4.0%2010 Average Travel Time to Work 13.1 13.6 14.3
CO
NS
UM
ER
EX
PE
ND
ITU
RE
2017 Est. Total Household Expenditure $839 M $1.40 B $1.63 B2017 Est. Apparel $29.3 M $49.0 M $56.8 M2017 Est. Contributions, Gifts $59.0 M $96.2 M $110 M2017 Est. Education, Reading $34.1 M $55.4 M $63.6 M2017 Est. Entertainment $47.3 M $78.8 M $91.3 M2017 Est. Food, Beverages, Tobacco $127 M $214 M $249 M2017 Est. Furnishings, Equipment $29.2 M $48.3 M $55.8 M2017 Est. Health Care, Insurance $72.6 M $123 M $143 M2017 Est. Household Operations, Shelter, Utilities $260 M $435 M $504 M2017 Est. Miscellaneous Expenses $12.3 M $20.8 M $24.1 M2017 Est. Personal Care $10.9 M $18.2 M $21.1 M2017 Est. Transportation $158 M $266 M $309 M
OFFICE DEPOT - VICTORIA CROSSING SECTION VI
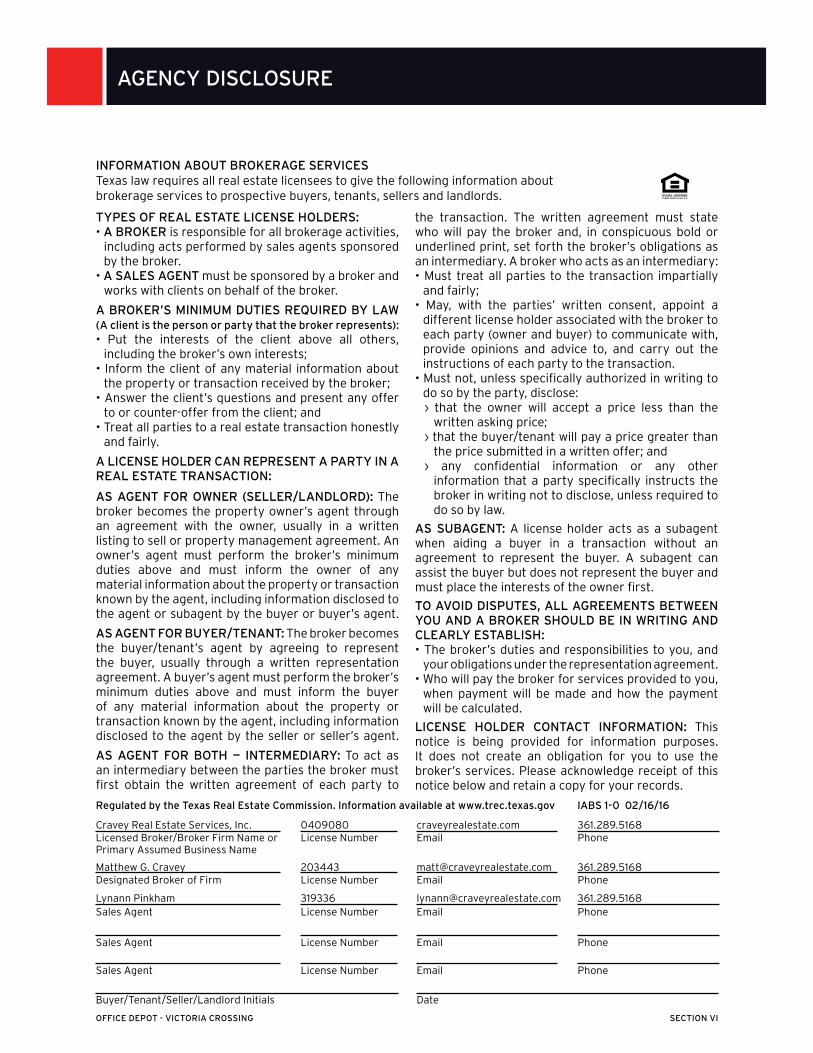
AGENCY DISCLOSURE
INFORMATION ABOUT BROKERAGE SERVICESTexas law requires all real estate licensees to give the following information about brokerage services to prospective buyers, tenants, sellers and landlords.
Licensed Broker/Broker Firm Name or Primary Assumed Business Name
License Number Email PhoneCravey Real Estate Services, Inc. 0409080 craveyrealestate.com 361.289.5168
Designated Broker of Firm License Number Email PhoneMatthew G. Cravey 203443 [email protected] 361.289.5168
Regulated by the Texas Real Estate Commission. Information available at www.trec.texas.gov IABS 1-0 02/16/16
Buyer/Tenant/Seller/Landlord Initials Date
Sales Agent License Number Email Phone
Sales Agent License Number Email Phone
Sales Agent License Number Email Phone
Lynann Pinkham 319336 [email protected] 361.289.5168