OFFERING MEMORANDUM - LoopNetimages3.loopnet.com/.../document.pdf · 2017-09-14 · OFFERING...
31
CHAMPLAIN COURT 643 East 71st Street • Chicago, IL 60619 OFFERING MEMORANDUM
Transcript of OFFERING MEMORANDUM - LoopNetimages3.loopnet.com/.../document.pdf · 2017-09-14 · OFFERING...

CHAMPLAIN COURT643 East 71st Street • Chicago, IL 60619
OFFERING MEMORANDUM

N O N - E N D O R S E M E N T A N D D I S C L A I M E R N O T I C E
Confidentiality and DisclaimerThe information contained in the following Marketing Brochure is proprietary and strictly confidential. It is intended to
be reviewed only by the party receiving it from Marcus & Millichap and should not be made available to any other
person or entity without the written consent of Marcus & Millichap. This Marketing Brochure has been prepared to
provide summary, unverified information to prospective purchasers, and to establish only a preliminary level of
interest in the subject property. The information contained herein is not a substitute for a thorough due diligence
investigation. Marcus & Millichap has not made any investigation, and makes no warranty or representation, with
respect to the income or expenses for the subject property, the future projected financial performance of the
property, the size and square footage of the property and improvements, the presence or absence of contaminating
substances, PCB's or asbestos, the compliance with State and Federal regulations, the physical condition of the
improvements thereon, or the financial condition or business prospects of any tenant, or any tenant's plans or
intentions to continue its occupancy of the subject property. The information contained in this Marketing Brochure
has been obtained from sources we believe to be reliable; however, Marcus & Millichap has not verified, and will not
verify, any of the information contained herein, nor has Marcus & Millichap conducted any investigation regarding
these matters and makes no warranty or representation whatsoever regarding the accuracy or completeness of the
information provided. All potential buyers must take appropriate measures to verify all of the information set forth
herein. Marcus & Millichap is a service mark of Marcus & Millichap Real Estate Investment Services, Inc. © 2017
Marcus & Millichap. All rights reserved.
Non-Endorsement NoticeMarcus & Millichap is not affiliated with, sponsored by, or endorsed by any commercial tenant or lessee identified in
this marketing package. The presence of any corporation's logo or name is not intended to indicate or imply
affiliation with, or sponsorship or endorsement by, said corporation of Marcus & Millichap, its affiliates or
subsidiaries, or any agent, product, service, or commercial listing of Marcus & Millichap, and is solely included for
the purpose of providing tenant lessee information about this listing to prospective customers.
ALL PROPERTY SHOWINGS ARE BY APPOINTMENT ONLY.
PLEASE CONSULT YOUR MARCUS & MILLICHAP AGENT FOR MORE DETAILS.
CHAMPLAIN COURT
Chicago, IL
ACT ID Y0670372

TABLE OF CONTENTS
SECTION
INVESTMENT OVERVIEW 01Offering Summary
Regional Map
Local Map
Aerial Photo
FINANCIAL ANALYSIS 02Rent Roll Summary
Rent Roll Detail
Rent Roll Summary Commercial
Operating Statement
Pricing Detail
MARKET COMPARABLES 03Sales Comparables
MARKET OVERVIEW 04
Market Analysis
Demographic Analysis
CHAMPLAIN COURT

CHAMPLAIN COURT
4
INVESTMENT
OVERVIEW

CHAMPLAIN COURT
#
EXECUTIVE SUMMARY
OFFERING SUMMARY
MAJOR EMPLOYERS
EMPLOYER # OF EMPLOYEES
Bernard Mitchell Hospital 4,150
Pullman Wheel Works Apartments 3,900
Alden-Wentworth Nursing Center 3,102
Provident Medical Center 2,533
University of Chicago 1,872
City of Chicago 1,649
Ford 1,518
Walgreens 1,496
Holy Cross Hospital 1,380
Edsal Manufacturing Co Inc 1,300
Streets and Sanitation Dept 1,191
Water Management Dept of 1,178
DEMOGRAPHICS
1-Miles 3-Miles 5-Miles
2016 Estimate Pop 34,328 304,599 633,288
2016 Census Pop 33,997 302,535 628,235
2016 Estimate HH 13,561 125,052 237,258
2016 Census HH 13,348 123,379 233,718
Median HH Income $28,499 $30,106 $32,645
Per Capita Income $16,620 $20,191 $19,063
Average HH Income $41,787 $48,492 $50,301
VITAL DATA
CURRENT YEAR 1
Price $1,845,000 CAP Rate 7.75% 8.47%
Down Payment 25% / $461,250 Net Operating Income $143,018 $156,301
Loan Amount $1,383,750 Net Cash Flow After Debt Service 11.00% / $50,722 13.88% / $64,005
Loan Type Proposed New Total Return 17.64% / $81,376 20.83% / $96,068
Interest Rate / Amortization 4.50% / 25 Years
Total Rentable SF 29,550
Price/SF $62.44
Year Built 1926
5
UNIT MIX
UNIT COUNT
UNIT TYPE AVG. SFCURRENT AVG.
RENTSAVG.
RENTS/SFMONTHLY INCOME
POTENTIAL RENTS
AVG. RENTS/SF
MONTHLYINCOME
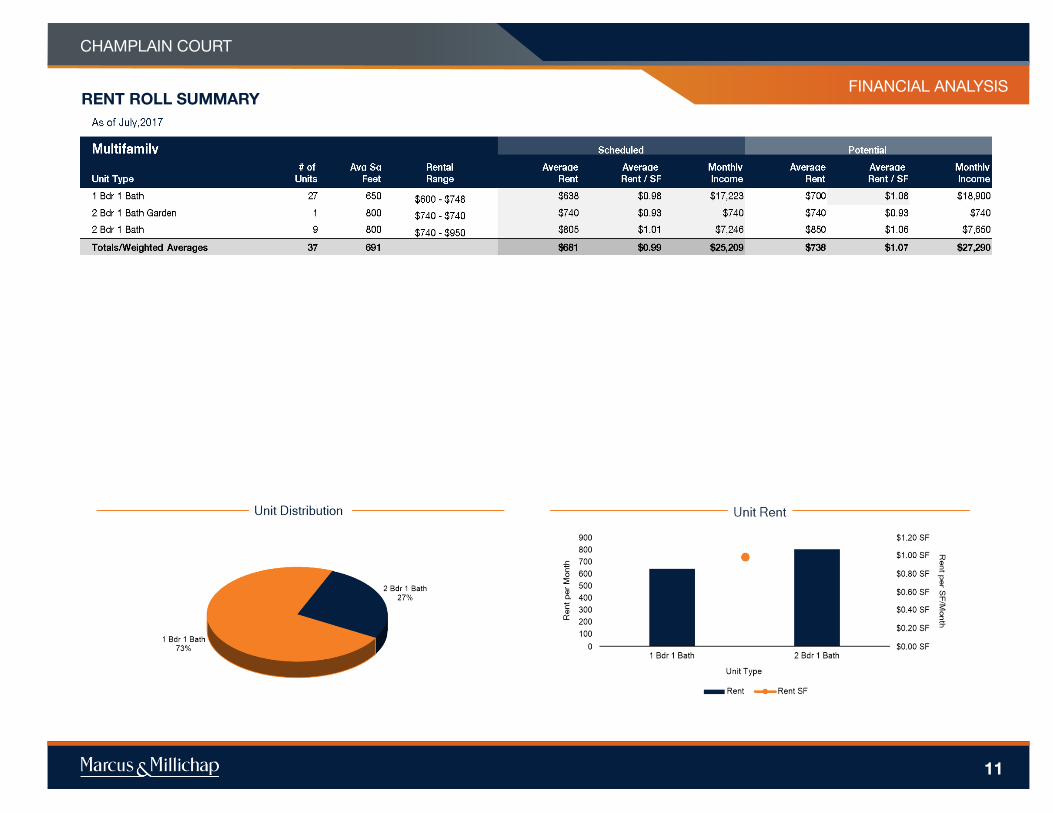
27 1 Bdr 1 Bath 650 $638 $0.98 $17,223 $700 $1.08 $18,900
10 2 Bdr 1 Bath 800 $799 $1.00 $7,986 $839 $1.05 $8,390
SUITE COUNT
TYPE TOTAL GLA CURRENT RENT RANGECURRENT MONTHLY
INCOMEPRO FORMA
MONTHLY INCOME
3 Retail 3,000 $700 - $900 $2,400 $2,400
1 Office 1,000 $1,100 - $1,100 $1,100 $1,100
CHAMPLAIN COURT
#
OFFERING SUMMARY
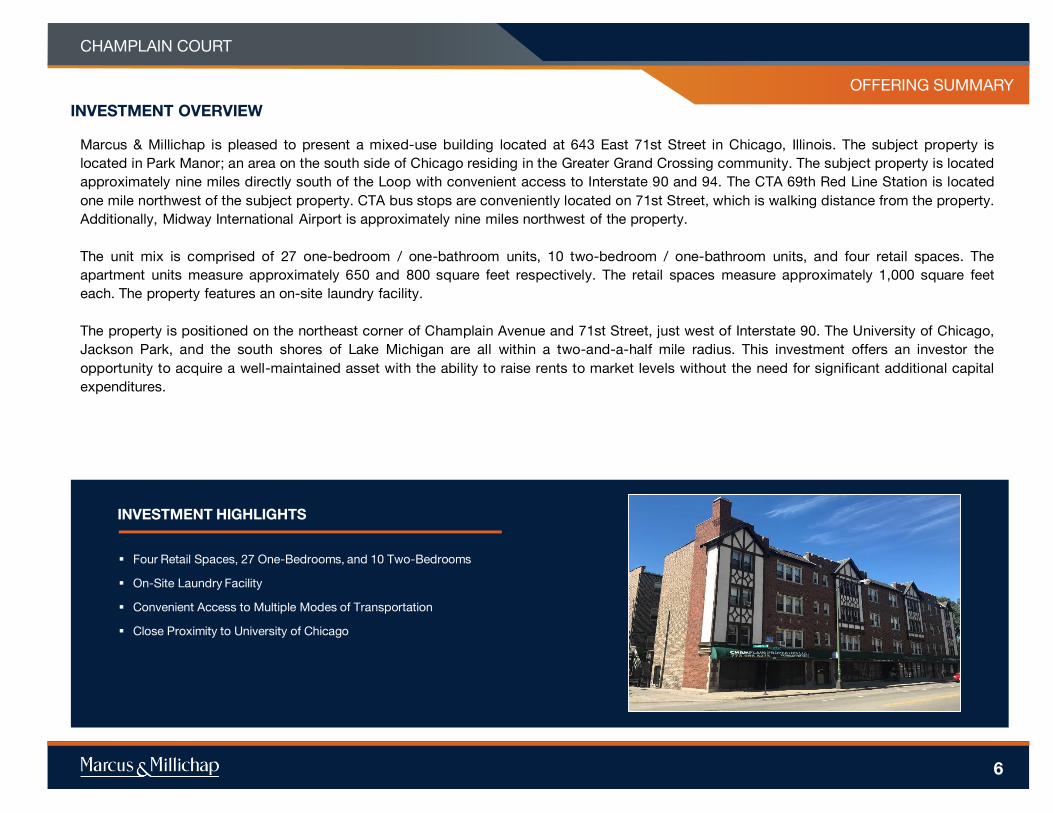
Four Retail Spaces, 27 One-Bedrooms, and 10 Two-Bedrooms
On-Site Laundry Facility
Convenient Access to Multiple Modes of Transportation
Close Proximity to University of Chicago
INVESTMENT HIGHLIGHTS
Marcus & Millichap is pleased to present a mixed-use building located at 643 East 71st Street in Chicago, Illinois. The subject property is
located in Park Manor; an area on the south side of Chicago residing in the Greater Grand Crossing community. The subject property is located
approximately nine miles directly south of the Loop with convenient access to Interstate 90 and 94. The CTA 69th Red Line Station is located
one mile northwest of the subject property. CTA bus stops are conveniently located on 71st Street, which is walking distance from the property.
Additionally, Midway International Airport is approximately nine miles northwest of the property.
The unit mix is comprised of 27 one-bedroom / one-bathroom units, 10 two-bedroom / one-bathroom units, and four retail spaces. The
apartment units measure approximately 650 and 800 square feet respectively. The retail spaces measure approximately 1,000 square feet
each. The property features an on-site laundry facility.
The property is positioned on the northeast corner of Champlain Avenue and 71st Street, just west of Interstate 90. The University of Chicago,
Jackson Park, and the south shores of Lake Michigan are all within a two-and-a-half mile radius. This investment offers an investor the
opportunity to acquire a well-maintained asset with the ability to raise rents to market levels without the need for significant additional capital
expenditures.
INVESTMENT OVERVIEW
6

CHAMPLAIN COURT
#
PROPERTY SUMMARY
OFFERING SUMMARY
PROPOSED FINANCING
First Trust Deed
Loan Amount $1,383,750
Loan Type Proposed New
Interest Rate 4.50%
Amortization 25 Years
Loan Term 5 Years
Loan to Value 75%
Debt Coverage Ratio 1.55
THE OFFERING
Property Champlain Court
Price $1,845,000
Property Address 643 East 71st Street, Chicago, IL
Assessors Parcel Number 20-27-205-001-0000
SITE DESCRIPTION
Number of Units 41
Number of Buildings One
Number of Stories Four
Year Built/Renovated 1926
Apartments - Rentable Square Feet 25,550
Retail - Gross Leaseable Area (GLA) 3,000
Office - Rentable Square Feet 1,000
Total Rentable Square Feet 29,550
Lot Size 0.35 acre(s)
7

REGIONAL MAP
CHAMPLAIN COURT
8
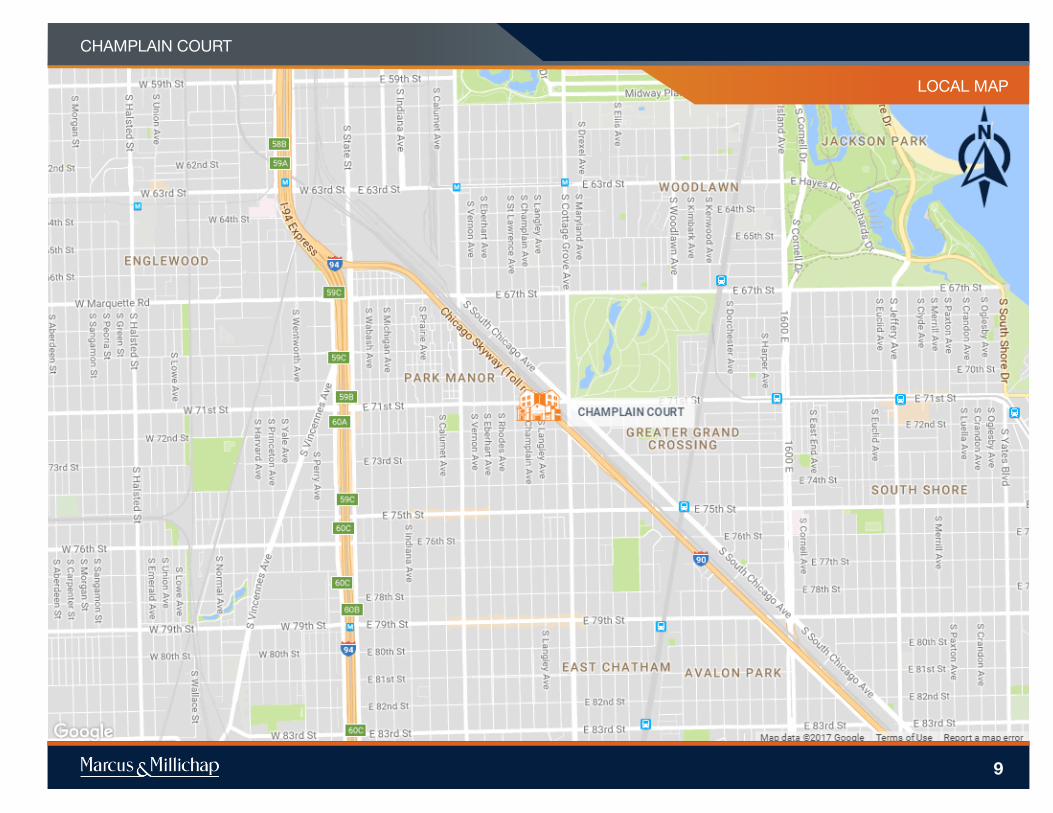
LOCAL MAP
CHAMPLAIN COURT
9

CHAMPLAIN COURT
10
FINANCIAL
ANALYSIS
FINANCIAL ANALYSIS
CHAMPLAIN COURT
RENT ROLL SUMMARY
11

FINANCIAL ANALYSIS
CHAMPLAIN COURT
12
RENT ROLL DETAIL
FINANCIAL ANALYSIS
CHAMPLAIN COURT
13
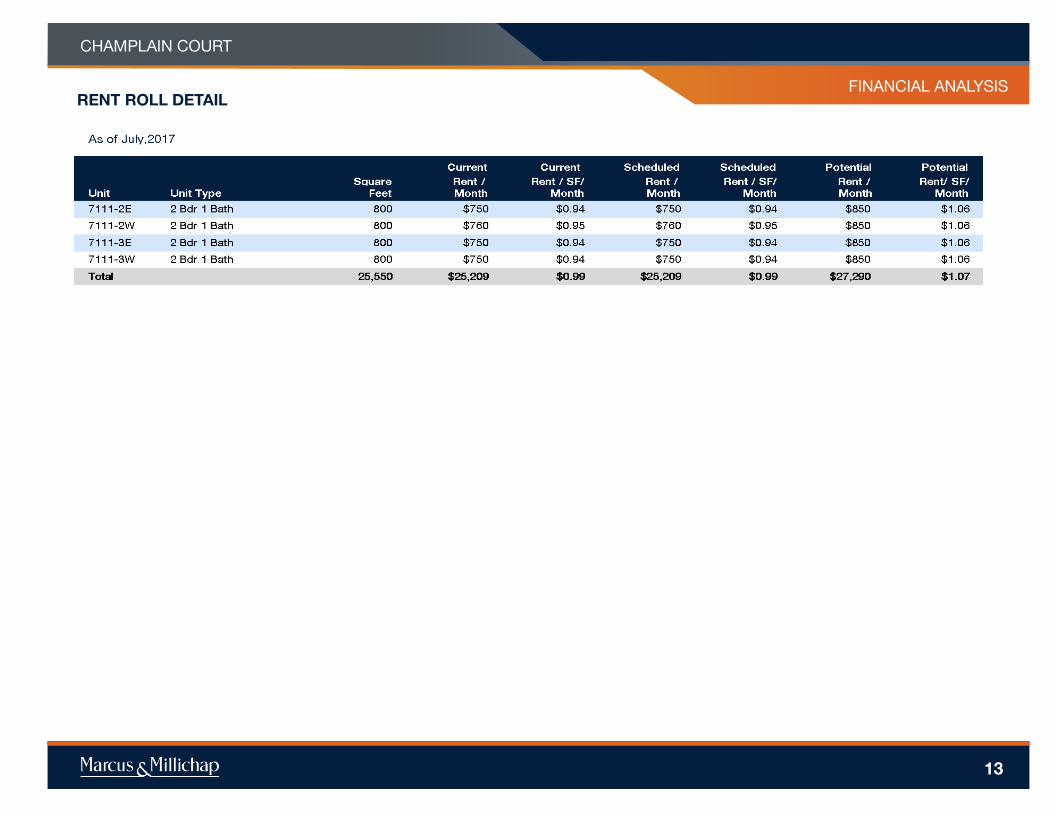
RENT ROLL DETAIL

FINANCIAL ANALYSIS
CHAMPLAIN COURT
14
RENT ROLL SUMMARY

FINANCIAL ANALYSIS
CHAMPLAIN COURT
OPERATING STATEMENT
15

FINANCIAL ANALYSIS
CHAMPLAIN COURT
OPERATING STATEMENT
16

FINANCIAL ANALYSIS
CHAMPLAIN COURT
PRICING DETAIL
17

CHAMPLAIN COURT
18
MARKET
COMPARABLES

8
CHAMPLAIN COURT
SALES COMPARABLES MAP
19
CHAMPLAIN COURT
(SUBJECT)
614 East 71st Street
6857 South King Drive
435-445 East 71st Street
7508 South Essex Avenue
6250 South Mozart Street
SALES COMPARABLES
1
2
3
4
5

20
PROPERTY NAMECHAMPLAIN COURT
SALES COMPARABLES
Avg. $49.43
$0.00
$10.00
$20.00
$30.00
$40.00
$50.00
$60.00
$70.00
$80.00
$90.00
$100.00
Champlain
Court
614 East
71st Street
6857 South
King Drive
435-445
East 71st
Street
7508 South
Essex
Avenue
6250 South
Mozart
Street
Average Price Per Square Foot
SALES COMPARABLES SALES COMPS AVG

21
PROPERTY NAMECHAMPLAIN COURT
SALES COMPARABLES
Avg. $53,729
$0
$10,000
$20,000
$30,000
$40,000
$50,000
$60,000
$70,000
Champlain
Court
614 East
71st Street
6857 South
King Drive
435-445
East 71st
Street
7508 South
Essex
Avenue
6250 South
Mozart
Street
Average Price Per Unit
SALES COMPARABLES SALES COMPS AVG

PROPERTY NAME
MARKETING TEAM
CHAMPLAIN COURT
SALES COMPARABLES
rentpropertyname1
rentpropertyaddress1
rentpropertyname1
rentpropertyaddress1
rentpropertyname1
rentpropertyaddress1
22
SALES COMPARABLES
Type
Offering Price $1,845,000 27 1 Bdr 1 Bath
Price/Unit $45,000 10 2 Bdr 1 Bath
Price/SF $62.44 3 Retail
CAP Rate 7.75% 1 Office
Year Built 1926
Total Apartment Units 37
Total Commercial Suites 4
CHAMPLAIN COURT643 East 71st Street, Chicago, IL 60619
Type
Close Of Escrow 5/22/2017 16 1 Bdr 1 Bath
Sales Price $1,227,824 5 Retail
Price/Unit $58,468
Price/SF $81.31
Year Built 1928
Total Apartment Units 16
Total Commercial Suites 5
1
NOTES
Part of portfolio sale- Portfolio cap rate was 9.95%
614 EAST 71ST STREETChicago, IL 60619
Type
Close Of Escrow 5/22/2017 5 2 Bdr 1 Bath
Sales Price $537,173 2 3 Bdr 1 Bath
Price/Unit $53,717 3 Retail
Price/SF $44.76
Year Built 1915
Total Apartment Units 7
Total Commercial Suites 3
2
NOTES
Part of portfolio sale- Portfolio cap rate was 9.95%
6857 SOUTH KING DRIVEChicago, IL 60637

PROPERTY NAME
MARKETING TEAM
CHAMPLAIN COURT
SALES COMPARABLES
rentpropertyname1
rentpropertyaddress1
rentpropertyname1
rentpropertyaddress1
rentpropertyname1
rentpropertyaddress1
23
SALES COMPARABLES
Type
Close Of Escrow 7/12/2017 6 0 Bdr 1 Bath
Sales Price $460,434 2 Retail
Price/Unit $46,043 2 Office
Price/SF $39.35
Year Built 1900
Total Apartment Units 6
Total Commercial Suites 4
3
NOTES
Part of portfolio sale- Portfolio cap rate was 9.95%
435-445 EAST 71ST STREETChicago, IL 60619
Type
Close Of Escrow 5/11/2016 2 1 Bdr 1 Bath
Sales Price $875,000 7 2 Bdr 1 Bath
Price/Unit $58,333 2 2 Bdr 2 Bath
Price/SF $33.65 1 3 Bdr 2 Bath
CAP Rate 11.40% 3 Retail
Year Built 1923
Total Apartment Units 12
Total Commercial Suites 3
4
7508 SOUTH ESSEX AVENUEChicago, IL 60649
Type
Close Of Escrow 6/26/2016 21 1 Bdr 1 Bath
Sales Price $1,250,000 3 Retail
Price/Unit $52,083
Price/SF $48.08
CAP Rate 10.0%
Year Built 1930
Total Apartment Units 21
Total Commercial Suites 3
5
6250 SOUTH MOZART STREETChicago, IL 60629

CHAMPLAIN COURT
24
MARKET
OVERVIEW

MARKET OVERVIEW
OVERVIEW
CHICAGO
Chicago-Naperville-Elgin is one of the largest metros in the nation.
Also know as the greater Chicagoland area, it is bounded to the east
by Lake Michigan, expands over a 5,000-square-mile region in
northeastern Illinois and extends into Wisconsin and Indiana. The
metro houses 9.6 million people and comprises 14 counties. The city
of Chicago contains 2.7 million residents. The greatest growth during
the past 20 years occurred in the western portion of the region. In
recent years, however, businesses are relocating back into the city to
attract young workers, supporting the development of high-rise
residential towers in the downtown Chicago.
MARKET OVERVIEW
METRO HIGHLIGHTS
THIRD-LARGEST METROPOLITAN AREA
The metro population trails only New York City and
Los Angeles in size, expanding to nearly 10 million
residents.
WEALTH OF INTELLECTUAL CAPITAL
The number of corporate headquarters in Chicago is
second only to New York City. There are 32 Fortune
500 companies based locally.
LARGE, DIVERSE EMPLOYMENT BASE
The Chicago metro employs more than 4.6 million
individuals in an array of industries, including a
growing tech sector.
CHAMPLAIN COURT
25

MARKET OVERVIEWMARKET OVERVIEW
TRANSPORTATION
The region’s transit network ranks among the largest and most
efficient in the world.
The vast network of freeways, centralized location, the largest rail-
truck intermodal facility in the U.S., as well as the Port of Chicago
contribute to the metro’s position as a major distribution and
logistics hub.
Chicago is the nation’s premier freight rail hub, with four carriers,
BNSF, Union Pacific, CSX, Norfolk Southern, servicing the region.
Amtrak routes originate from Union Station, while the Metra
commuter rail and the Chicago L provide passenger service
throughout the metro area and beyond.
International airports include O’Hare, Midway and Gary/Chicago.
Seven smaller airports also provide air service for the region.
MORE THAN OF ILLINOIS RESIDENTS LIVE IN
THE SUBURBS OF CHICAGO,
MANY OF WHOM COMMUTE INTO
THE CITY FOR WORK40%
17.2Million TEU’s
MOVED THROUGH METRO
IN 2015
3CHICAGO HAS
INTERNATIONAL
AIRPORTS
7FOR FREIGHT, PASSENGER
AND COMMUTER
RAIL LINES
CHAMPLAIN COURT
26

MARKET OVERVIEW
ECONOMY
The metro has one of the biggest economies in the nation
and is buoyed by its distribution, finance, manufacturing
operations and growing high-tech sectors.
There are 32 Fortune 500 companies headquartered in the
metro including Boeing, Walgreens and McDonald’s.
The area is a major global tourist and convention destination.
Last year, a record 54.1 million people visited the metro
spending $15 billion and supporting 145,000 jobs.
Large tech firms such as Amazon, Groupon and Google
attract startup companies.
The workforce is considered one of the most diverse and well
trained among major U.S. metros.
MAJOR AREA EMPLOYERS
Abbott Labs
Advocate Healthcare
Wal-Mart
Motorola Solutions Inc.
United Continental Holdings Inc.
Allstate Corp.
Walgreens Co.
Target Corp.
JPMorgan Chase
AT&T
SHARE OF 2016 TOTAL EMPLOYMENT
MANUFACTURING GOVERNMENT
HEALTH SERVICES
EDUCATION AND
+
LEISURE AND HOSPITALITY FINANCIAL ACTIVITIES
CONSTRUCTION
PROFESSIONAL AND
BUSINESS SERVICES
OTHER SERVICES
AND UTILITIES
TRADE, TRANSPORTATION INFORMATION
* Forecast
CHAMPLAIN COURT
9% 18% 6%12% 10%
4%20% 2%4% 15%
27

MARKET OVERVIEW
Chicago is the third most populous metro in the U.S. and is
expected to grow by approximately 275,000 people during the next
five years.
Younger professionals moving to the area for employment provide a
skilled workforce and contribute to the median age of 36.8 years,
below that of the nation.
World class education institutions including Northwestern University
and the University of Chicago help provide a skilled labor pool.
Nearly 35 percent of residents age 25 and older hold a bachelor’s
degree and of these, 13 percent have also earned a graduate or
professional degree.
Local homeownership of 65 percent is slightly above the national
rate of 64 percent.
QUICK FACTS
36.8
2016
MEDIAN AGE:
U.S. Median:
37.7
$62,100
2016 MEDIAN
HOUSEHOLD INCOME:
U.S. Median:
$54,500
3.5M
2016
HOUSEHOLDS:
Growth
2016-2021*:
3.5%
9.6M
2016
POPULATION:
Growth
2016-2021*:
2.9%
* Forecast
DEMOGRAPHICS
CHAMPLAIN COURT
28

MARKET OVERVIEW
Sources: Marcus & Millichap Research Services; BLS; Bureau of Economic Analysis; Experian; Fortune;
Moody’s Analytics; U.S. Census Bureau
QUALITY OF LIFE
The Chicago metro has something to offer every one of its residents and visitors,
whether it is legendary blues and jazz music, cultural and educational venues,
professional sports, dining, entertainment, shopping or recreational amenities.
The Chicago area’s relative affordability is largely due to its lower housing costs. The
median home price is significantly less than in other cities of its size and is below that
of many smaller cities, including Seattle and Denver.
Cultural activities and venues underpin the metro’s cosmopolitan lifestyle. The region
is home to various well-known museums, including the world-class Field Museum,
Shedd Aquarium, Art Institute of Chicago and Adler Planetarium. The theatre scene
rivals the world’s best, and troupes, dance companies, symphony orchestras and
music venues abound.
29 MILESOF SHORELINE
$237,400MEDIAN HOME PRICE VARIOUS MUSUEMS
70
ARTS & ENTERTAINMENT
CHAMPLAIN COURT
29

PROPERTY NAME
MARKETING TEAM
CHAMPLAIN COURT
DEMOGRAPHICS
Source: © 2016 Experian
Created on July 2017
POPULATION 1 Miles 3 Miles 5 Miles
2021 Projection
Total Population 33,443 298,837 621,676
2016 Estimate
Total Population 34,328 304,599 633,288
2010 Census
Total Population 33,997 302,535 628,235
2000 Census
Total Population 40,776 358,002 738,929
Daytime Population
2016 Estimate 24,363 255,166 518,052
HOUSEHOLDS 1 Miles 3 Miles 5 Miles
2021 Projection
Total Households 13,335 124,376 236,070
2016 Estimate
Total Households 13,561 125,052 237,258
Average (Mean) Household Size 2.51 2.38 2.61
2010 Census
Total Households 13,348 123,379 233,718
2000 Census
Total Households 15,181 135,906 255,091
Growth 2015-2020 -1.67% -0.54% -0.50%
HOUSING UNITS 1 Miles 3 Miles 5 Miles
Occupied Units
2021 Projection 13,335 124,376 236,070
2016 Estimate 16,850 148,854 277,539
Owner Occupied 4,635 41,821 94,483
Renter Occupied 8,926 83,231 142,775
Vacant 3,288 23,803 40,281
Persons In Units
2016 Estimate Total Occupied Units 13,561 125,052 237,258
1 Person Units 35.11% 38.84% 34.06%
2 Person Units 25.94% 25.99% 25.18%
3 Person Units 16.02% 14.84% 15.62%
4 Person Units 10.68% 9.69% 11.11%
5 Person Units 5.97% 5.34% 6.72%
6+ Person Units 6.29% 5.29% 7.32%
HOUSEHOLDS BY INCOME 1 Miles 3 Miles 5 Miles
2016 Estimate
$200,000 or More 0.72% 2.00% 1.95%
$150,000 - $199,000 1.37% 2.23% 2.17%
$100,000 - $149,000 5.85% 6.30% 7.10%
$75,000 - $99,999 6.87% 7.35% 8.09%
$50,000 - $74,999 14.55% 14.20% 14.99%
$35,000 - $49,999 13.10% 12.53% 13.01%
$25,000 - $34,999 11.49% 11.01% 11.58%
$15,000 - $24,999 17.37% 15.31% 15.03%
Under $15,000 28.68% 29.07% 26.10%
Average Household Income $41,787 $48,492 $50,301
Median Household Income $28,499 $30,106 $32,645
Per Capita Income $16,620 $20,191 $19,063
POPULATION PROFILE 1 Miles 3 Miles 5 Miles
Population By Age
2016 Estimate Total Population 34,328 304,599 633,288
Under 20 29.41% 26.64% 28.11%
20 to 34 Years 19.66% 21.75% 21.29%
35 to 39 Years 5.75% 5.80% 5.97%
40 to 49 Years 12.55% 12.25% 12.44%
50 to 64 Years 19.82% 19.23% 18.51%
Age 65+ 12.83% 14.33% 13.69%
Median Age 35.80 36.34 35.49
Population 25+ by Education Level
2016 Estimate Population Age 25+ 21,889 200,339 407,751
Elementary (0-8) 2.85% 2.77% 5.82%
Some High School (9-11) 11.92% 11.97% 12.44%
High School Graduate (12) 27.58% 24.90% 27.29%
Some College (13-15) 29.74% 26.19% 24.65%
Associate Degree Only 8.43% 7.00% 6.49%
Bachelors Degree Only 13.43% 14.11% 12.37%
Graduate Degree 5.41% 11.98% 9.42%
Population by Gender
2016 Estimate Total Population 34,328 304,599 633,288
Male Population 44.38% 44.32% 45.39%
Female Population 55.62% 55.68% 54.61%
30

8
CHAMPLAIN COURT
DEMOGRAPHICS
31