Off-Gas Generation Rate during Chemical Cleaning ... · Off-Gas Generation Rate during Chemical...
13
WM2012 Conference, February 26-March 1, 2012, Phoenix, AZ 1 Off-Gas Generation Rate during Chemical Cleaning Operations at the Savannah River Site - 12499 Bruce J. Wiersma Savannah River National Laboratory, Aiken, SC 29808 Karthik H. Subramanian and Edward T. Ketusky Savannah River Remediation, Aiken, SC 29808 ABSTRACT The enhanced chemical cleaning process (ECC) is being developed at the Savannah River Site (SRS) to remove the residual radioactive sludge heel that remains in a liquid waste storage tank. Oxalic acid is the chemical agent utilized for this purpose. However, the acid also corrodes the carbon steel tank wall and cooling coils. If the oxalic acid has little interaction with the sludge, hydrogen gas could conceivably evolve at cathodic areas due to the corrosion of the carbon steel. Scenarios where hydrogen evolution could occur during ECC include the initial filling of the tank prior to agitation and near the end of the process when there is little or no sludge present. The purpose of this activity was to provide a bounding estimate for the hydrogen generation rate during the ECC process. Sealed vessel coupon tests were performed to estimate the hydrogen generation rate due to corrosion of carbon steel by oxalic acid. These tests determined the maximum instantaneous hydrogen generation rate, the rate at which the generation rate decays, and the total hydrogen generated. The tests were performed with polished ASTM A285 Grade C carbon steel coupons. This steel is representative of the Type I and II waste tanks at SRS. Bounding conditions were determined for the solution environment. The oxalic acid concentration was 2.5 wt.% and the test temperature was 75 °C. The test solution was agitated and contained no sludge simulant. Duplicate tests were performed and showed excellent reproducibility for the hydrogen generation rate and total hydrogen generated. The results showed that the hydrogen generation rate was initially high, but decayed rapidly within a couple of days. A statistical model was developed to predict the instantaneous hydrogen generation rate as a function of exposure time by combining both sets of data. An upper bound on the maximum hydrogen generation rate was determined from the upper 95% confidence limit. The upper bound limit on the maximum instantaneous generation rate at 5 hours was 6.1 x 10 -5 m 3 /m 2 /minute. After two and five days the upper bound limit decayed to 7.9 x 10 -6 and 1.3 x 10 -6 m 3 /m 2 /minute, respectively. The total volume of hydrogen gas generated during the test was calculated from the model equation. An upper bound on the total gas generated was determined from the upper 95% confidence limit. The upper bound limit on the total hydrogen generated during the 163 hour test was 0.101 m 3 /m 2 . Corrosion rates were determined from the coupon tests and also calculated from the measured hydrogen generation rates. Excellent agreement was achieved between the time averaged corrosion rate calculated from the hydrogen generation rates and the
Transcript of Off-Gas Generation Rate during Chemical Cleaning ... · Off-Gas Generation Rate during Chemical...
WM2012 Conference, February 26-March 1, 2012, Phoenix, AZ
1
Off-Gas Generation Rate during Chemical Cleaning Operations at the Savannah River Site - 12499
Bruce J. WiersmaSavannah River National Laboratory, Aiken, SC 29808
Karthik H. Subramanian and Edward T. KetuskySavannah River Remediation, Aiken, SC 29808
ABSTRACT
The enhanced chemical cleaning process (ECC) is being developed at the Savannah River Site (SRS) to remove the residual radioactive sludge heel that remains in a liquid waste storage tank. Oxalic acid is the chemical agent utilized for this purpose. However, the acid also corrodes the carbon steel tank wall and cooling coils. If the oxalic acid has little interaction with the sludge, hydrogen gas could conceivably evolve at cathodic areas due to the corrosion of the carbon steel. Scenarios where hydrogen evolution could occur during ECC include the initial filling of the tank prior to agitation and near the end of the process when there is little or no sludge present. The purpose of this activity was to provide a bounding estimate for the hydrogen generation rate during the ECC process.
Sealed vessel coupon tests were performed to estimate the hydrogen generation rate due to corrosion of carbon steel by oxalic acid. These tests determined the maximum instantaneous hydrogen generation rate, the rate at which the generation rate decays, and the total hydrogen generated. The tests were performed with polished ASTM A285 Grade C carbon steel coupons. This steel is representative of the Type I and II waste tanks at SRS. Bounding conditions were determined for the solution environment. The oxalic acid concentration was 2.5 wt.% and the test temperature was 75 °C. The test solution was agitated and contained no sludge simulant.
Duplicate tests were performed and showed excellent reproducibility for the hydrogen generation rate and total hydrogen generated. The results showed that the hydrogen generation rate was initially high, but decayed rapidly within a couple of days. A statistical model was developed to predict the instantaneous hydrogen generation rate as a function of exposure time by combining both sets of data. An upper bound on the maximum hydrogen generation rate was determined from the upper 95% confidence limit. The upper bound limit on the maximum instantaneous generation rate at 5 hours was 6.1 x 10⁻⁵ m3/m2/minute. After two and five days the upper bound limit decayed to 7.9 x 10⁻⁶ and 1.3 x 10⁻⁶ m3/m2/minute, respectively. The total volume of hydrogen gas generated during the test was calculated from the model equation. An upper bound on the total gas generated was determined from the upper 95% confidence limit. The upper bound limit on the total hydrogen generated during the 163 hour test was 0.101 m3/m2. Corrosion rates were determined from the coupon tests and also calculated from the measured hydrogen generation rates. Excellent agreement was achieved between the time averaged corrosion rate calculated from the hydrogen generation rates and the
WM2012 Conference, February 26-March 1, 2012, Phoenix, AZ
2
corrosion rates determined from the coupon tests. The corrosion rates were on the order of 0.45 mmpy. Good agreement was also observed between the maximum instantaneous corrosion rate as calculated from the hydrogen generation rate and the corrosion rate determined by previous electrochemical tests.
INTRODUCTION
Radioactive liquid waste has been stored in underground carbon steel tanks for nearly 60 years at the Savannah River Site (SRS). The site is currently in the process of removing the waste from these tanks in order to place it into vitrified, stable state for longer term storage. The final stage in the removal sequence is a chemical cleaning step that breaks up and dissolves metal oxide solids that cannot be easily pumped out of the tank. Oxalic acid was selected for this purpose because it is an effective chelating agent for the solids and is not as corrosive to the carbon steel tank as other acids.
As a part of chemical cleaning, oxalic acid is added to the waste tank to dissolve and break up the residual sludge heel that remains after bulk sludge removal is complete [1]. However, the acid also corrodes the carbon steel tank wall and cooling coils. If sludge has dissolved into the oxalic acid, little or no hydrogen evolution is anticipated due to corrosion of the carbon steel or other chemical reactions. Various corrosion tests, including those at 1 wt%, 2.5 wt.% and 8 wt% [2, 3], show that when the sludge simulant is present, the electrochemical potential shifts toward more oxidizing values and therefore reduces the likelihood of hydrogen generation.
On the other hand, if the oxalic acid has little interaction with the sludge, hydrogen gas, could conceivably evolve at cathodic areas due to the corrosion of the carbon steel. Scenarios where hydrogen evolution could occur during ECC include the initial filling of the tank prior to agitation and near the end of the process when there is little or no sludge present. The purpose of this activity was to provide a bounding estimate for the hydrogen generation rate during the ECC process.
A test condition that was expected to result in the highest instantaneous corrosion rate was selected. An upper bound oxalic acid concentration of 2.5 wt.% was utilized for the tests. The oxalic acid concentration of the ECC process will nominally be 2 wt.%. No sludge was present in the test to address the scenarios where the tank is essentially empty and oxalic acid is added back either inadvertently or for a final rinse. Hydrogen evolution may occur at these acidic, reducing conditions.
Previous electrochemical tests indicated that the highest corrosion rates in 2.5 wt.% oxalic acid were observed at 75 °C in an agitated solution (i.e., approximately 7.6 mmpy) [2]. However, corrosion rates measured on 30 day coupon tests at the same test conditions indicated that the corrosion rate is on the order of 0.51 mmpy [2]. This result indicates that after an initially high corrosion rate, the surface is passivated and the corrosion rates decrease dramatically. Based on this observation, the hydrogen generation rates measured initially will be quite high, and will decay significantly as the corrosion rate decreased.
WM2012 Conference, February 26-March 1, 2012, Phoenix, AZ
3
The tests reported in this document determined the maximum instantaneous hydrogen generation rate, the rate at which the generation rate decays, and the total hydrogen generated.
EXPERIMENTAL METHOD
The material tested was ASTM A285, Grade C carbon steel (UNS K02200). This material has similar chemical and physical properties to the waste storage tanks that will be the focus of the initial chemical cleaning operations. The chemical composition and the mechanical properties (see Tables 1 and 2) of the as-received coupons were vendor certified. The dimensions of each coupon were measured with digital calipers to the nearest 0.025 mm. The coupons were weighed on an analytical balance to the nearest 0.0001 grams.
The initial surface condition of the coupons was a 600 grit polished finish. The polished coupons provide a uniform, reproducible surface finish ideal for studying reactions between the steel and the environment.
Table 1. Chemical Composition (Wt %) of A285 Grade C, Carbon Steel
C Mn P S Cu Ni Cr Si Fe0.18 0.75 0.011 0.008 0.03 0.03 0.06 - balance
Table 2. Mechanical Properties of A285 Grade C, Carbon Steel
Yield Strength (ksi)
Tensile Strength (ksi)
% Elongation
48 67 31 (2 inch)
The 2.5 wt.% oxalic acid solution utilized for the tests was prepared with reagent grade C2H2O4-2H2O. The solution was prepared by adding 35 g of the reagent to 1 liter of distilled water. The solution temperature during the test was 75 ± 5 ºC.
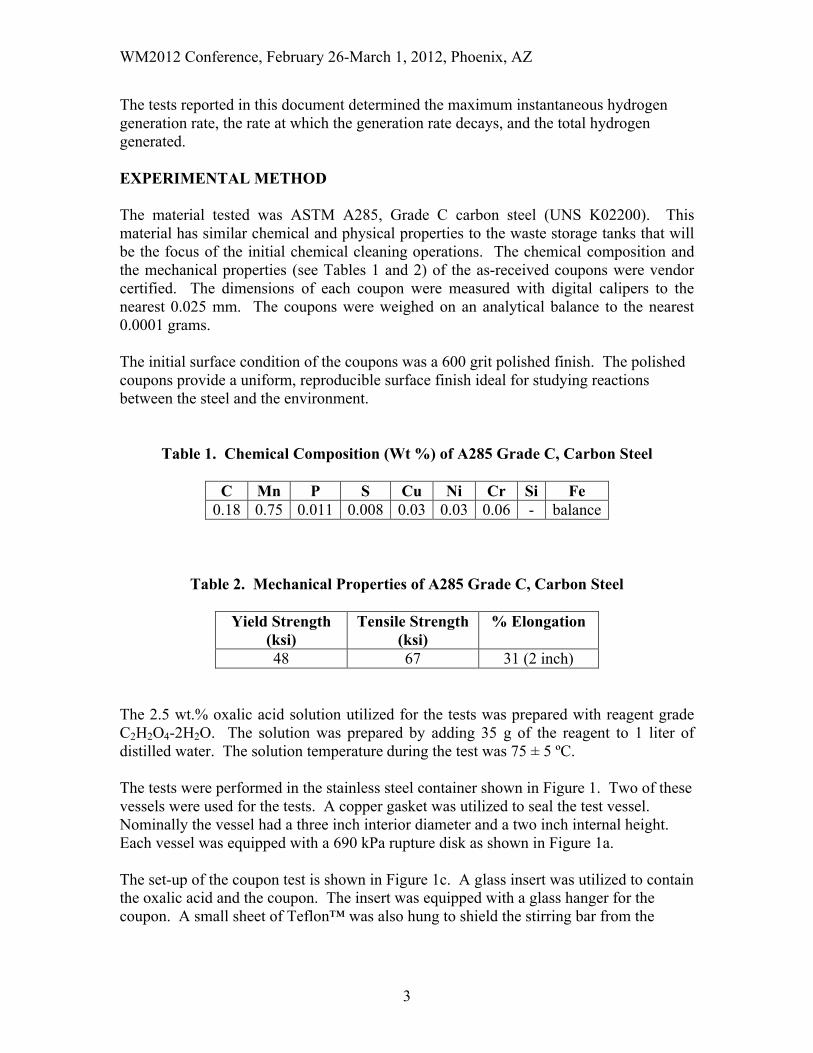
The tests were performed in the stainless steel container shown in Figure 1. Two of these vessels were used for the tests. A copper gasket was utilized to seal the test vessel. Nominally the vessel had a three inch interior diameter and a two inch internal height. Each vessel was equipped with a 690 kPa rupture disk as shown in Figure 1a.
The set-up of the coupon test is shown in Figure 1c. A glass insert was utilized to contain the oxalic acid and the coupon. The insert was equipped with a glass hanger for the coupon. A small sheet of Teflon™ was also hung to shield the stirring bar from the
WM2012 Conference, February 26-March 1, 2012, Phoenix, AZ
4
carbon steel coupon. Agitation was achieved with the magnetic stirring bar on a stirring hot plate.
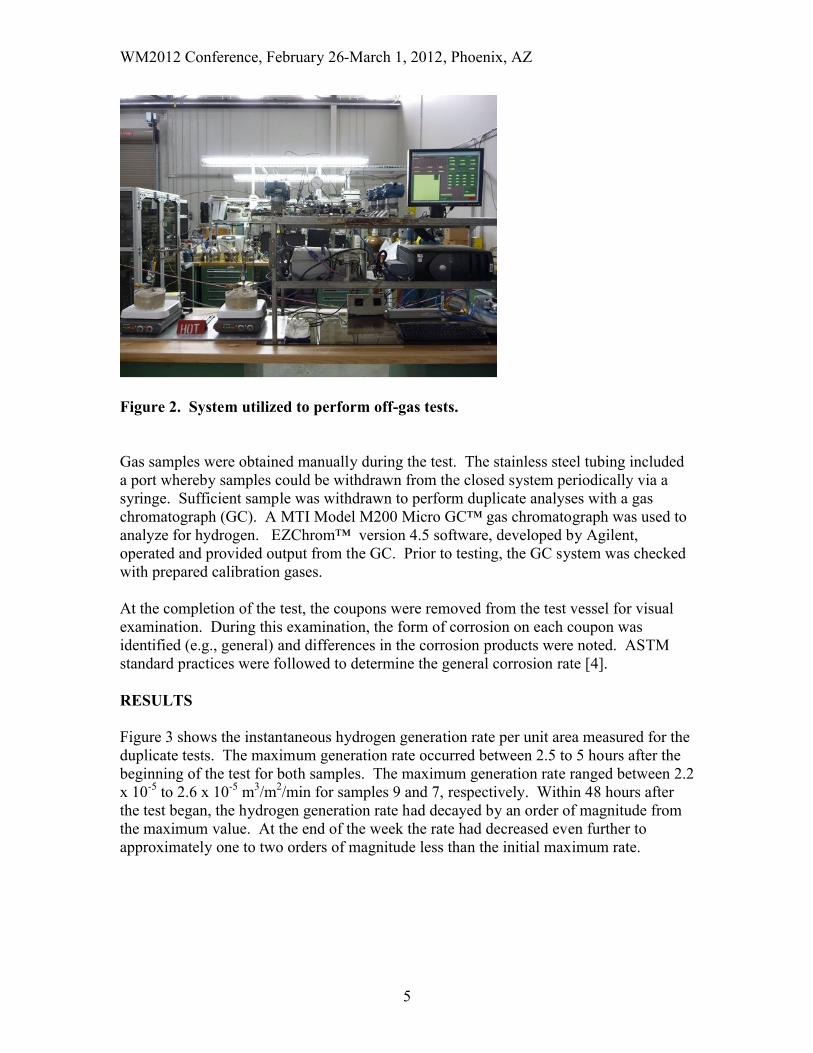
The complete system is shown in Figure 2. The test vessels were placed in a bed of sand on a hot plate with stirring capability. The sand was utilized to moderate the temperature of the vessel during the test. Type E thermocouples were used to monitor the container temperature. The pressure in each container was measured with a Rosemount™ Model 1151DP pressure transducer (see Figure 3). The transducers were calibrated with a range of 0 to 150 inches of water (0 to 37.2 kPa). The temperature and pressure were monitored with LabVIEW™ 7.1 (National Instruments) software.
(a) (b)
(c)
Figure 1. Sealed vessel utilized for off-gas tests (a) vessel with rupture disk assembly, (b) interior of vessel, and (c) vessel with coupon and solution.
WM2012 Conference, February 26-March 1, 2012, Phoenix, AZ
5
Figure 2. System utilized to perform off-gas tests.
Gas samples were obtained manually during the test. The stainless steel tubing included a port whereby samples could be withdrawn from the closed system periodically via a syringe. Sufficient sample was withdrawn to perform duplicate analyses with a gas chromatograph (GC). A MTI Model M200 Micro GC™ gas chromatograph was used to analyze for hydrogen. EZChrom™ version 4.5 software, developed by Agilent, operated and provided output from the GC. Prior to testing, the GC system was checked with prepared calibration gases.
At the completion of the test, the coupons were removed from the test vessel for visual examination. During this examination, the form of corrosion on each coupon was identified (e.g., general) and differences in the corrosion products were noted. ASTM standard practices were followed to determine the general corrosion rate [4].
RESULTS
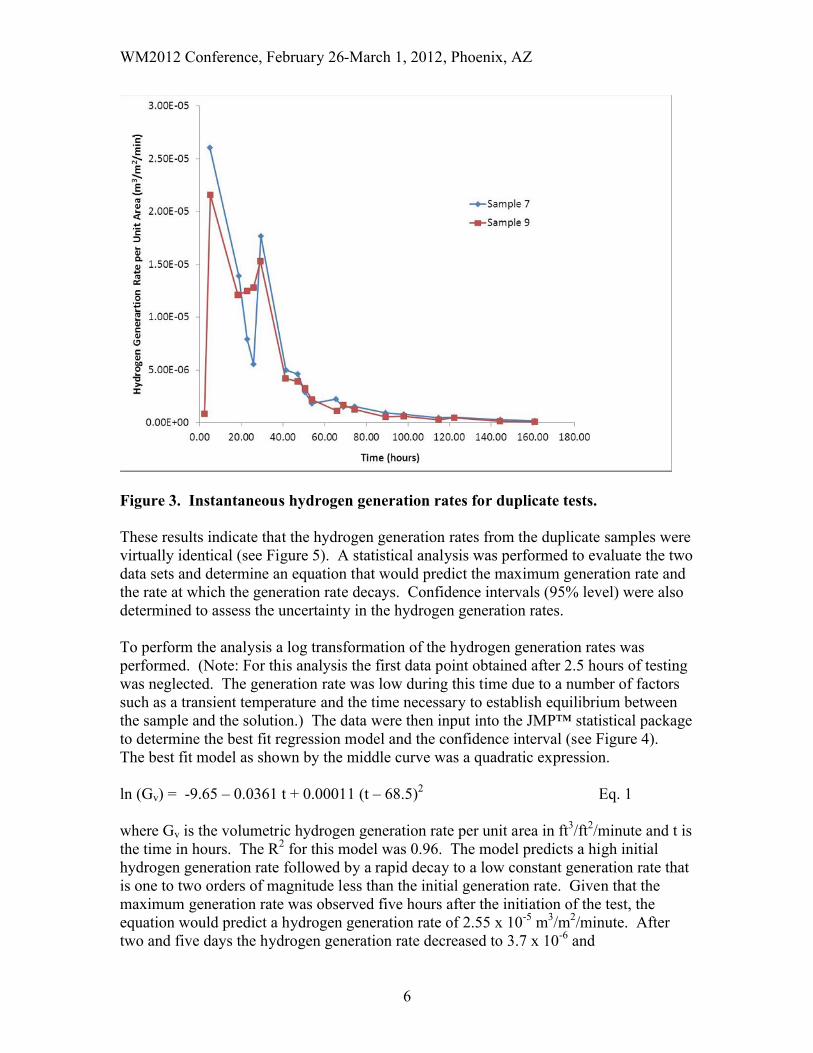
Figure 3 shows the instantaneous hydrogen generation rate per unit area measured for the duplicate tests. The maximum generation rate occurred between 2.5 to 5 hours after the beginning of the test for both samples. The maximum generation rate ranged between 2.2x 10⁻⁵ to 2.6 x 10⁻⁵ m3/m2/min for samples 9 and 7, respectively. Within 48 hours after the test began, the hydrogen generation rate had decayed by an order of magnitude from the maximum value. At the end of the week the rate had decreased even further to approximately one to two orders of magnitude less than the initial maximum rate.
WM2012 Conference, February 26-March 1, 2012, Phoenix, AZ
6
Figure 3. Instantaneous hydrogen generation rates for duplicate tests.
These results indicate that the hydrogen generation rates from the duplicate samples were virtually identical (see Figure 5). A statistical analysis was performed to evaluate the two data sets and determine an equation that would predict the maximum generation rate and the rate at which the generation rate decays. Confidence intervals (95% level) were also determined to assess the uncertainty in the hydrogen generation rates.
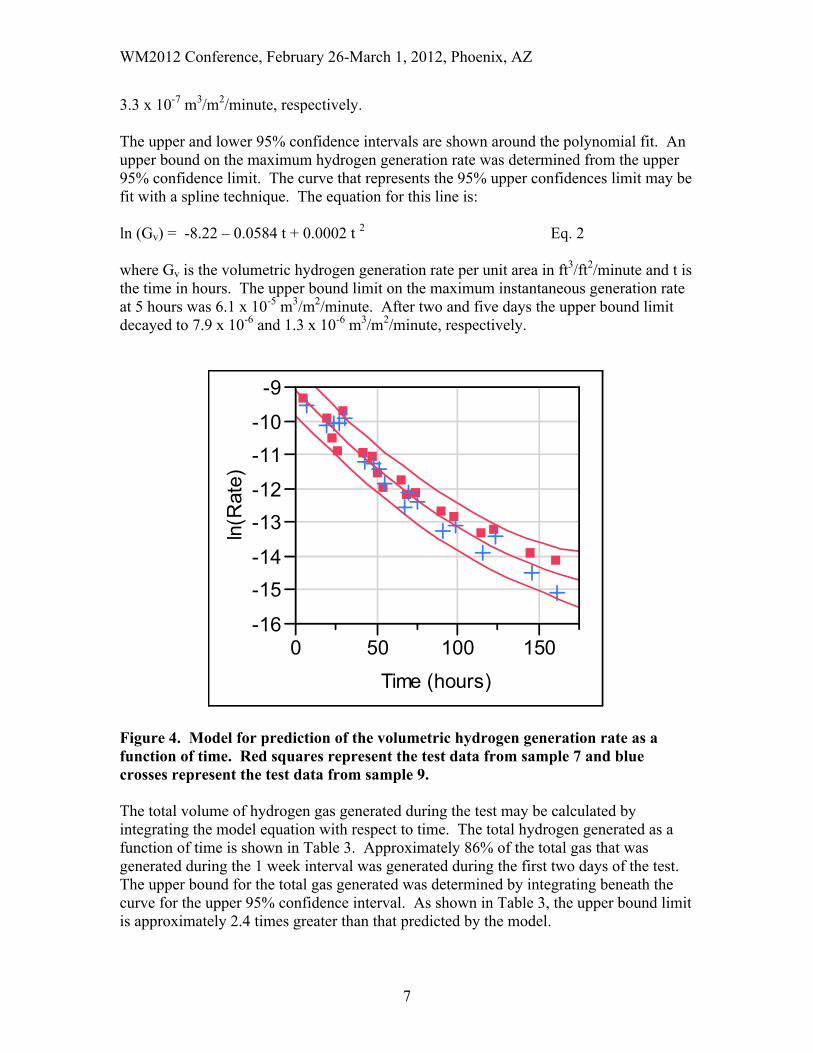
To perform the analysis a log transformation of the hydrogen generation rates was performed. (Note: For this analysis the first data point obtained after 2.5 hours of testing was neglected. The generation rate was low during this time due to a number of factors such as a transient temperature and the time necessary to establish equilibrium between the sample and the solution.) The data were then input into the JMP™ statistical package to determine the best fit regression model and the confidence interval (see Figure 4). The best fit model as shown by the middle curve was a quadratic expression.
ln (Gv) = -9.65 – 0.0361 t + 0.00011 (t – 68.5)2 Eq. 1
where Gv is the volumetric hydrogen generation rate per unit area in ft3/ft2/minute and t is the time in hours. The R2 for this model was 0.96. The model predicts a high initial hydrogen generation rate followed by a rapid decay to a low constant generation rate that is one to two orders of magnitude less than the initial generation rate. Given that the maximum generation rate was observed five hours after the initiation of the test, the equation would predict a hydrogen generation rate of 2.55 x 10⁻⁵ m3/m2/minute. After two and five days the hydrogen generation rate decreased to 3.7 x 10⁻⁶ and
WM2012 Conference, February 26-March 1, 2012, Phoenix, AZ
7
3.3 x 10⁻⁷ m3/m2/minute, respectively.
The upper and lower 95% confidence intervals are shown around the polynomial fit. An upper bound on the maximum hydrogen generation rate was determined from the upper 95% confidence limit. The curve that represents the 95% upper confidences limit may be fit with a spline technique. The equation for this line is:
ln (Gv) = -8.22 – 0.0584 t + 0.0002 t 2 Eq. 2
where Gv is the volumetric hydrogen generation rate per unit area in ft3/ft2/minute and t is the time in hours. The upper bound limit on the maximum instantaneous generation rate at 5 hours was 6.1 x 10⁻⁵ m3/m2/minute. After two and five days the upper bound limit decayed to 7.9 x 10⁻⁶ and 1.3 x 10⁻⁶ m3/m2/minute, respectively.
Figure 4. Model for prediction of the volumetric hydrogen generation rate as a function of time. Red squares represent the test data from sample 7 and blue crosses represent the test data from sample 9.
The total volume of hydrogen gas generated during the test may be calculated by integrating the model equation with respect to time. The total hydrogen generated as a function of time is shown in Table 3. Approximately 86% of the total gas that was generated during the 1 week interval was generated during the first two days of the test. The upper bound for the total gas generated was determined by integrating beneath the curve for the upper 95% confidence interval. As shown in Table 3, the upper bound limit is approximately 2.4 times greater than that predicted by the model.
-16
-15
-14
-13
-12
-11
-10
-9
ln(R
ate)
0 50 100 150
Time (hours)

WM2012 Conference, February 26-March 1, 2012, Phoenix, AZ
8
Table 3. Total Volume of Hydrogen Gas Per Unit Area Generated During the Test
Time (hours) Total Volume of Hydrogen from Model
Equation (m3/m2)
Total Volume of Hydrogen Upper 95% Confidence Interval
(m3/m2)5 0.009 0.02248 0.037 0.085120 0.042 0.098160 0.043 0.101
The moles of hydrogen generated are related to the volume of hydrogen generated by the ideal gas law. Furthermore, in the case of iron in an acidic reducing environment, the number of moles of hydrogen generated is equal to the number of moles of iron corroded [5]. A linear relationship exists between the hydrogen generation rate and the corrosion rate as shown in Eq. 3 [6]:
Corrosion Rate = Gr/SA/(3.8 x 10-5) Eq. 3
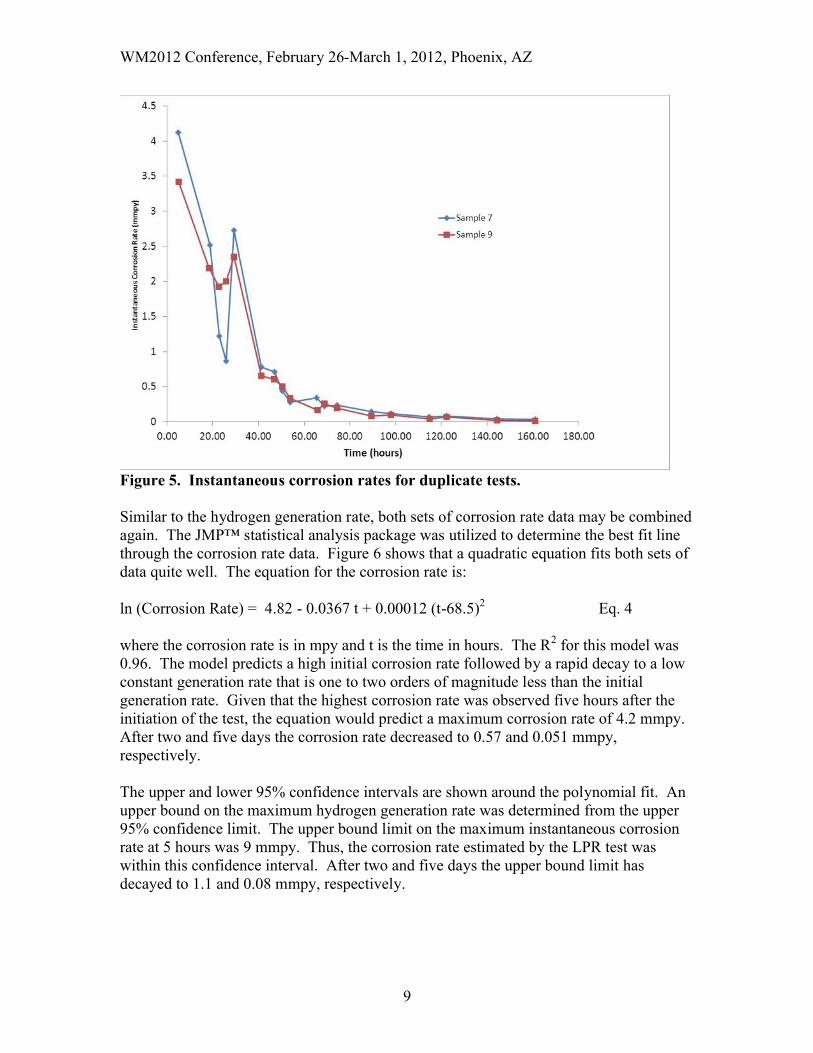
where Gr is the hydrogen generation rate in moles/hr, SA is the surface area in ft2, and the corrosion rate is in mpy (mils per year). The instantaneous corrosion rate as a function of time was calculated based on the instantaneous hydrogen generation rates and the surface area of each sample. Figure 5 shows that the maximum corrosion rate also occurred between 2.5 and 5 hours after the initiation of the test and ranged between 3.4 and 4.1 mmpy for samples 9 and 7, respectively. The corrosion rates also decay by an order of magnitude after 48 hours. This decay in the corrosion rate clearly indicates that passivation occurs at this relatively high temperature.
These corrosion rates were approximately a factor of 2 less than the corrosion rates measured previously by the linear polarization resistance (LPR) technique [2]. Duplicate LPR tests on carbon steel samples resulted in corrosion rates of 6.7 and 7.9 mmpy. However, the LPR test was conducted approximately 2 hours after the sample was exposed and lasted approximately 10 minutes. On the other hand, these corrosion rates were calculated based on measurements that were taken over a 2.5 hour time period. Thus, given the decay of the corrosion rate with time the lower corrosion rate obtained for the longer test time interval is not surprising that the initial instantaneous corrosion rate is lower for the hydrogen generation tests than the LPR tests.
WM2012 Conference, February 26-March 1, 2012, Phoenix, AZ
9
Figure 5. Instantaneous corrosion rates for duplicate tests.
Similar to the hydrogen generation rate, both sets of corrosion rate data may be combined again. The JMP™ statistical analysis package was utilized to determine the best fit line through the corrosion rate data. Figure 6 shows that a quadratic equation fits both sets of data quite well. The equation for the corrosion rate is:
ln (Corrosion Rate) = 4.82 - 0.0367 t + 0.00012 (t-68.5)2 Eq. 4
where the corrosion rate is in mpy and t is the time in hours. The R2 for this model was 0.96. The model predicts a high initial corrosion rate followed by a rapid decay to a low constant generation rate that is one to two orders of magnitude less than the initial generation rate. Given that the highest corrosion rate was observed five hours after the initiation of the test, the equation would predict a maximum corrosion rate of 4.2 mmpy. After two and five days the corrosion rate decreased to 0.57 and 0.051 mmpy, respectively.
The upper and lower 95% confidence intervals are shown around the polynomial fit. An upper bound on the maximum hydrogen generation rate was determined from the upper 95% confidence limit. The upper bound limit on the maximum instantaneous corrosion rate at 5 hours was 9 mmpy. Thus, the corrosion rate estimated by the LPR test was within this confidence interval. After two and five days the upper bound limit has decayed to 1.1 and 0.08 mmpy, respectively.
WM2012 Conference, February 26-March 1, 2012, Phoenix, AZ
10
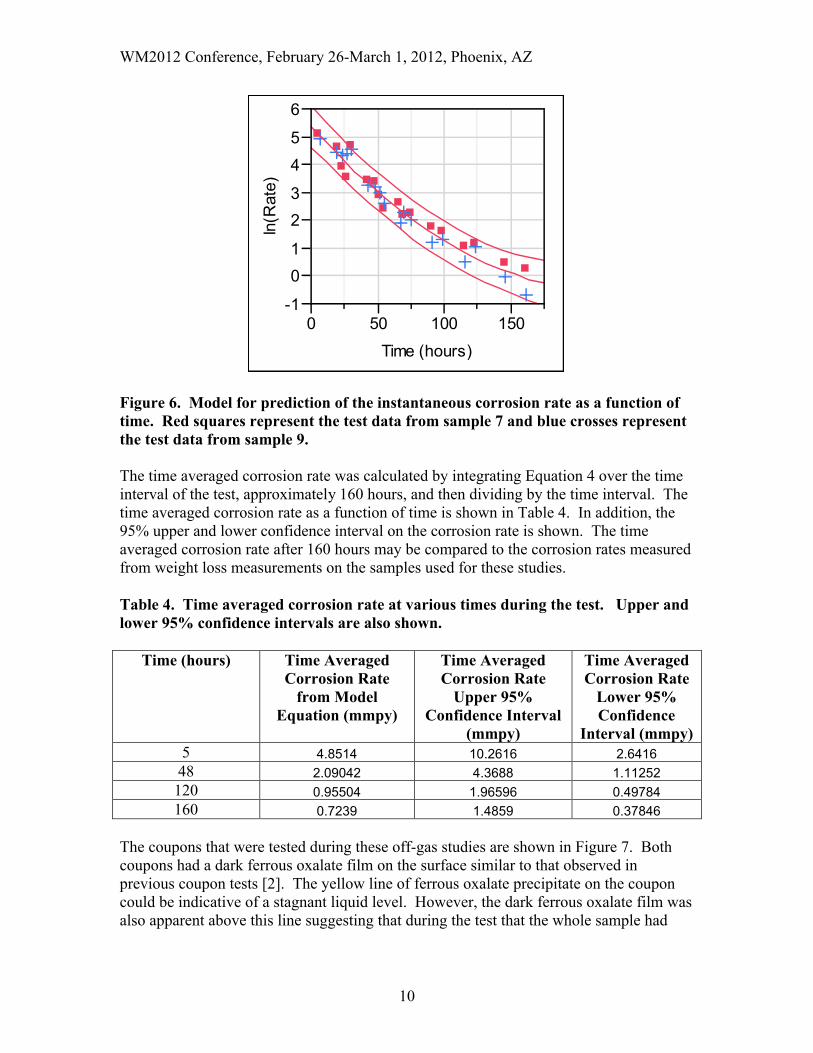
Figure 6. Model for prediction of the instantaneous corrosion rate as a function of time. Red squares represent the test data from sample 7 and blue crosses represent the test data from sample 9.
The time averaged corrosion rate was calculated by integrating Equation 4 over the time interval of the test, approximately 160 hours, and then dividing by the time interval. The time averaged corrosion rate as a function of time is shown in Table 4. In addition, the 95% upper and lower confidence interval on the corrosion rate is shown. The time averaged corrosion rate after 160 hours may be compared to the corrosion rates measured from weight loss measurements on the samples used for these studies.
Table 4. Time averaged corrosion rate at various times during the test. Upper and lower 95% confidence intervals are also shown.
Time (hours) Time Averaged Corrosion Rate
from Model Equation (mmpy)
Time Averaged Corrosion Rate
Upper 95% Confidence Interval
(mmpy)
Time Averaged Corrosion Rate
Lower 95% Confidence
Interval (mmpy)5 4.8514 10.2616 2.641648 2.09042 4.3688 1.11252120 0.95504 1.96596 0.49784160 0.7239 1.4859 0.37846
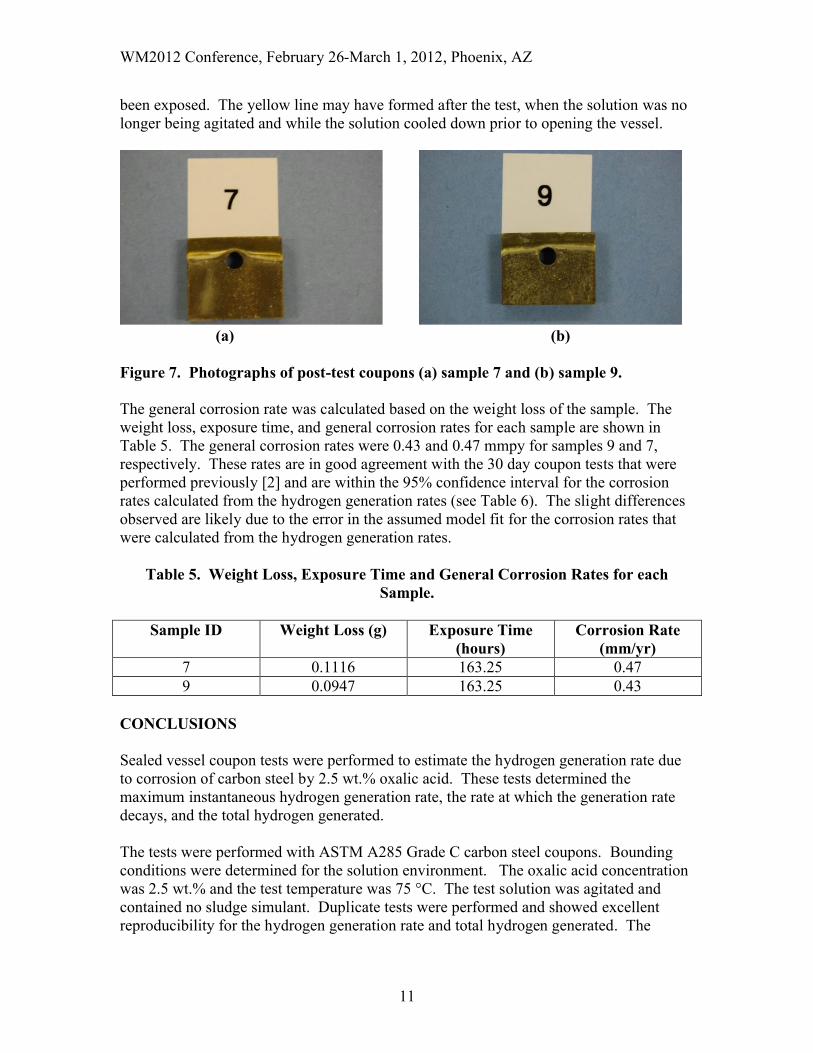
The coupons that were tested during these off-gas studies are shown in Figure 7. Both coupons had a dark ferrous oxalate film on the surface similar to that observed in previous coupon tests [2]. The yellow line of ferrous oxalate precipitate on the coupon could be indicative of a stagnant liquid level. However, the dark ferrous oxalate film was also apparent above this line suggesting that during the test that the whole sample had
-1
0
1
2
3
4
5
6
ln(R
ate)
0 50 100 150
Time (hours)
WM2012 Conference, February 26-March 1, 2012, Phoenix, AZ
11
been exposed. The yellow line may have formed after the test, when the solution was no longer being agitated and while the solution cooled down prior to opening the vessel.
(a) (b)
Figure 7. Photographs of post-test coupons (a) sample 7 and (b) sample 9.
The general corrosion rate was calculated based on the weight loss of the sample. The weight loss, exposure time, and general corrosion rates for each sample are shown in Table 5. The general corrosion rates were 0.43 and 0.47 mmpy for samples 9 and 7, respectively. These rates are in good agreement with the 30 day coupon tests that were performed previously [2] and are within the 95% confidence interval for the corrosion rates calculated from the hydrogen generation rates (see Table 6). The slight differences observed are likely due to the error in the assumed model fit for the corrosion rates that were calculated from the hydrogen generation rates.
Table 5. Weight Loss, Exposure Time and General Corrosion Rates for each Sample.
Sample ID Weight Loss (g) Exposure Time (hours)
Corrosion Rate (mm/yr)
7 0.1116 163.25 0.479 0.0947 163.25 0.43
CONCLUSIONS
Sealed vessel coupon tests were performed to estimate the hydrogen generation rate due to corrosion of carbon steel by 2.5 wt.% oxalic acid. These tests determined the maximum instantaneous hydrogen generation rate, the rate at which the generation rate decays, and the total hydrogen generated.
The tests were performed with ASTM A285 Grade C carbon steel coupons. Bounding conditions were determined for the solution environment. The oxalic acid concentration was 2.5 wt.% and the test temperature was 75 °C. The test solution was agitated and contained no sludge simulant. Duplicate tests were performed and showed excellent reproducibility for the hydrogen generation rate and total hydrogen generated. The
WM2012 Conference, February 26-March 1, 2012, Phoenix, AZ
12
results showed that the hydrogen generation rate was initially high, but decayed rapidly within a couple of days.
A statistical model was developed to predict the instantaneous hydrogen generation rate as a function of exposure time by combining both sets of data. An upper bound on the maximum hydrogen generation rate was determined from the upper 95% confidence limit. The upper bound confidence limit for the hydrogen generation rate is represented by the following equation.
ln (Gv) = -8.22 – 0.0584 t + 0.0002 t 2
This equation should be utilized to estimate the instantaneous hydrogen generation rate per unit surface area, Gv, at a given time, t. The units for Gv and t are ft3/ft2/min and hours, respectively.
The total volume of hydrogen gas generated during the test was calculated from the model equation. An upper bound on the total gas generated was determined from the upper 95% confidence limit. The upper bound limit on the total hydrogen generated during the 163 hour test was 0.101 m3/m2.
The maximum instantaneous hydrogen generation rate for this scenario is greater than that previously measured in the 8 wt.% oxalic acid tests [1] due to both the absence of sludge in the test (i.e., greater than 20:1 ratio of acid to sludge) and the use of polished coupons (vs. mill scale coupons). However, due to passivation of the carbon steel surface, the corrosion rate decays by more than two orders of magnitude within the first three days of exposure such that the instantaneous hydrogen generation rates are less than that previously measure in the 8 wt.% oxalic acid tests. While the results of these tests are bounding, the conditions used in this study may not be representative of the ECC flowsheet, and the applicability of these results to the flowsheet should be evaluated for the following reasons:
The absence of sludge results in higher instantaneous hydrogen generation rates than when the sludge is present.
Polished coupons do not represent the condition of the carbon steel interior of the tank, which are covered with mill scale. Based on lower instantaneous corrosion rates measured on mill scale coupons exposed to oxalic acid, lower instantaneous hydrogen generation rates are expected for the tank interior than measured on the polished coupons.
Corrosion rates were determined from the coupon tests and also calculated from the measured hydrogen generation rates. Excellent agreement was achieved between the time averaged corrosion rate calculated from the hydrogen generation rates and the corrosion rates determined from the coupon tests. The corrosion rates were on the order of 0.45 mmpy. Good agreement was also observed between the maximum instantaneous corrosion rate as calculated from the hydrogen generation rate and the corrosion rate determined by previous electrochemical tests [2].
WM2012 Conference, February 26-March 1, 2012, Phoenix, AZ
13
REFERENCES
1. D. T. Herman et.al., "Investigating Hydrogen Generation and Corrosion in the Treatment Tank and the Potential Formation of a Floating Layer in the Neutralization Tank During Waste Tank Heel Chemical Cleaning", WSRC-STI-2007-00209, April 30, 2007.
2. B. J. Wiersma, “Treatment Tank Corrosion Studies for the Enhanced Chemical Cleaning Process”, SRNL-STI-2010-00535, Rev. 1, August 2011.
3. B. J. Wiersma, “Electrochemical Studies on the Corrosion of Carbon Steel in Oxalic Acid”, WSRC-TR-2007-00210, April, 2007.
4. “Standard Practice for Preparing, Cleaning, and Evaluating Corrosion Test Specimens”, ASTM G 1-03, 2003.
5. B. J. Wiersma, “Hydrogen Generation During the Corrosion of Carbon Steel in Oxalic Acid”, WSRC-TR-2004000441, August, 2004.
6. B. J. Wiersma and H. B. Peacock, “Flammable Gas in Tank 43-H Leak Detection Boxes”, WSRC-TR-2002-00142, March 2002.
ACKNOWLEDGEMENTS
This paper was prepared in conjunction with work accomplished at the Savannah River National Laboratory, Savannah River Nuclear Solutions, LLC, under contract No. DE-AC09-08SR22470 with the U.S. Department of Energy.
The authors also recognize the invaluable assistance provided by G.D. Creech in the set-up and performance of these tests. Special thanks also to H. T. Sessions for providing technical assistance with the gas chromatograph and the laboratory facility in the Center for Hydrogen Research, Aiken, SC. T. K. Williamson and L. T. Smith also provided necessary assistance by preparing the test vessel and solutions. K. R. Hicks and K. J. Kalbaugh were responsible for preparation and cleaning of the carbon steel coupons. The authors also recognize the contributions of Dr. J. I. Mickalonis, who provided insights into the test results, and Dr. S. P. Harris, who provided the statistical analysis of the data.