Ofek Capital
28
Journal of Financial Economics 34 (1993) 3330. North-Holland Capital structure and firm response to poor performance An empirical analysis* Received September 1991. final version received September 1992 This paper tests the relation between capital structure and a firm’s response to short-term financial distress. In a sample of 358 firms that perform poorly for a year, higher predistress leverage increases the probability of operational actions, particularly asset restructuring and employee layoffs. Higher predistress leverage also increases the probability of financial actions such as dividend cuts. These results are consistent with Jensen’s (1989) argument that higher predistress leverage increases the speed with which a firm reacts to poor performance. Interestingly, higher managerial holdings reduce the probability of operational actions. especially those that do not generate cash. 1. Introduction Firms experiencing poor performance respond either operationally, by mak- ing changes in top management [Gilson (1989)] or in organizational strategy and structure [Wruck (1990)], or financially, through debt restructuring and bankruptcy filings [Gilson, John, and Lang (1990)]. Typical responses to a short period of poor performance include asset restructuring, employee layoffs, and management replacement [John, Lang, and Netter (1992)]. Why firms choose certain responses over others, however, is largely unexplored. Analyzing the responses to short-term distress may shed light on how to hasten a firm’s reaction to distress and thus preserve value by triggering earlier changes. Corresportd~nce ro: Eli Ofek. Stern School of Business. New York University, 44 West 4th Street, Suite 9-190. New York. NY 10012-1126, USA. *This paper is based on the second chapter of my dissertation. I appreciate helpful comments from Douglas Diamond (my chairman), Robert Gertner, Steven Kaplan, Larry Lang, Richard Ruback (the editor). Robert Vishny, Lawrence Weiss (the referee), and seminar participants at New York University and the University of Chicago. 0304-405X/93,‘$06.00 c 1993-~Elsevier Science Publishers B.V. All rights reserved
-
Upload
cindy-florentia -
Category
Documents
-
view
18 -
download
0
Transcript of Ofek Capital
Journal of Financial Economics 34 (1993) 3330. North-Holland
Capital structure and firm response to poor performance
An empirical analysis*
Received September 1991. final version received September 1992
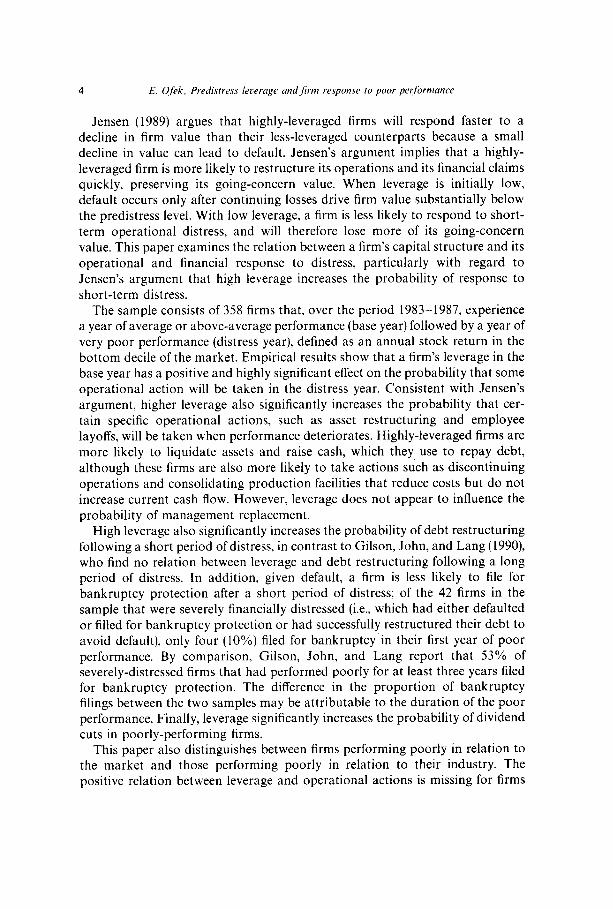
This paper tests the relation between capital structure and a firm’s response to short-term financial distress. In a sample of 358 firms that perform poorly for a year, higher predistress leverage increases the probability of operational actions, particularly asset restructuring and employee layoffs. Higher predistress leverage also increases the probability of financial actions such as dividend cuts. These results are consistent with Jensen’s (1989) argument that higher predistress leverage increases the speed with which a firm reacts to poor performance. Interestingly, higher managerial holdings reduce the probability of operational actions. especially those that do not generate cash.
1. Introduction
Firms experiencing poor performance respond either operationally, by mak- ing changes in top management [Gilson (1989)] or in organizational strategy and structure [Wruck (1990)], or financially, through debt restructuring and bankruptcy filings [Gilson, John, and Lang (1990)]. Typical responses to a short period of poor performance include asset restructuring, employee layoffs, and management replacement [John, Lang, and Netter (1992)]. Why firms choose certain responses over others, however, is largely unexplored. Analyzing the responses to short-term distress may shed light on how to hasten a firm’s reaction to distress and thus preserve value by triggering earlier changes.
Corresportd~nce ro: Eli Ofek. Stern School of Business. New York University, 44 West 4th Street, Suite 9-190. New York. NY 10012-1126, USA.
*This paper is based on the second chapter of my dissertation. I appreciate helpful comments from Douglas Diamond (my chairman), Robert Gertner, Steven Kaplan, Larry Lang, Richard Ruback (the editor). Robert Vishny, Lawrence Weiss (the referee), and seminar participants at New York University and the University of Chicago.
0304-405X/93,‘$06.00 c 1993-~Elsevier Science Publishers B.V. All rights reserved
4 E. Ofek, Predi.wess leoerage and firm response to poor performance
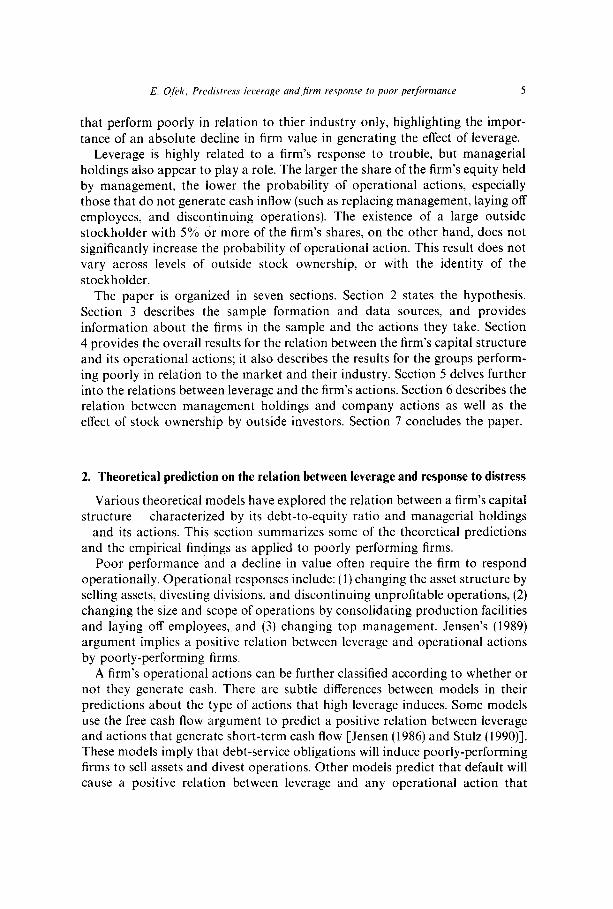
Jensen (1989) argues that highly-leveraged firms will respond faster to a decline in firm value than their less-leveraged counterparts because a small decline in value can lead to default. Jensen’s argument implies that a highly- leveraged firm is more likely to restructure its operations and its financial claims quickly, preserving its going-concern value. When leverage is initially low, default occurs only after continuing losses drive firm value substantially below the predistress level. With low leverage, a firm is less likely to respond to short- term operational distress, and will therefore lose more of its going-concern value. This paper examines the relation between a firm’s capital structure and its operational and financial response to distress, particularly with regard to Jensen’s argument that high leverage increases the probability of response to short-term distress.
The sample consists of 358 firms that, over the period 1983-1987, experience a year of average or above-average performance (base year) followed by a year of very poor performance (distress year), defined as an annual stock return in the bottom decile of the market. Empirical results show that a firm’s leverage in the base year has a positive and highly significant effect on the probability that some operational action will be taken in the distress year. Consistent with Jensen’s argument, higher leverage also significantly increases the probability that cer- tain specific operational actions, such as asset restructuring and employee layoffs, will be taken when performance deteriorates. Highly-leveraged firms are more likely to liquidate assets and raise cash, which they use to repay debt, although these firms are also more likely to take actions such as discontinuing operations and consolidating production facilities that reduce costs but do not increase current cash flow. However, leverage does not appear to influence the probability of management replacement.
High leverage also significantly increases the probability of debt restructuring following a short period of distress, in contrast to Gilson, John, and Lang (1990), who find no relation between leverage and debt restructuring following a long period of distress. In addition, given default, a firm is less likely to file for bankruptcy protection after a short period of distress; of the 42 firms in the sample that were severely financially distressed (i.e., which had either defaulted or filled for bankruptcy protection or had successfully restructured their debt to avoid default), only four (10%) filed for bankruptcy in their first year of poor performance. By comparison, Gilson, John, and Lang report that 53% of severely-distressed firms that had performed poorly for at least three years filed for bankruptcy protection. The difference in the proportion of bankruptcy filings between the two samples may be attributable to the duration of the poor performance. Finally, leverage significantly increases the probability of dividend cuts in poorly-performing firms.
This paper also distinguishes between firms performing poorly in relation to the market and those performing poorly in relation to their industry. The positive relation between leverage and operational actions is missing for firms
E. Ofek, Predistress leverage andfirm response lo poor performance 5
that perform poorly in relation to thier industry only, highlighting the impor-
tance of an absolute decline in firm value in generating the effect of leverage. Leverage is highly related to a firm’s response to trouble, but managerial
holdings also appear to play a role. The larger the share of the firm’s equity held by management, the lower the probability of operational actions, especially those that do not generate cash inflow (such as replacing management, laying off employees, and discontinuing operations). The existence of a large outside stockholder with 5% or more of the firm’s shares, on the other hand, does not significantly increase the probability of operational action. This result does not vary across levels of outside stock ownership, or with the identity of the stockholder.
The paper is organized in seven sections. Section 2 states the hypothesis. Section 3 describes the sample formation and data sources, and provides information about the firms in the sample and the actions they take. Section 4 provides the overall results for the relation between the firm’s capital structure and its operational actions; it also describes the results for the groups perform- ing poorly in relation to the market and their industry. Section 5 delves further into the relations between leverage and the firm’s actions. Section 6 describes the relation between management holdings and company actions as well as the effect of stock ownership by outside investors. Section 7 concludes the paper.
2. Theoretical prediction on the relation between leverage and response to distress
Various theoretical models have explored the relation between a firm’s capital structure ~ characterized by its debt-to-equity ratio and managerial holdings _ and its actions. This section summarizes some of the theoretical predictions and the empirical findings as applied to poorly performing firms.
Poor performance and a decline in value often require the firm to respond operationally. Operational responses include: (1) changing the asset structure by selling assets, divesting divisions, and discontinuing unprofitable operations, (2) changing the size and scope of operations by consolidating production facilities and laying off employees, and (3) changing top management. Jensen’s (1989) argument implies a positive relation between leverage and operational actions by poorly-performing firms.
A firm’s operational actions can be further classified according to whether or not they generate cash. There are subtle differences between models in their predictions about the type of actions that high leverage induces. Some models use the free cash flow argument to predict a positive relation between leverage and actions that generate short-term cash flow [Jensen (1986) and Stulz (1990)]. These models imply that debt-service obligations will induce poorly-performing firms to sell assets and divest operations. Other models predict that default will cause a positive relation between leverage and any operational action that
increases firm value [Harris and Raviv (1990) and Ofek (1991)]. These models imply that debtholders monitor the firm after default and induce it to take value-maximizing actions regardless of the effect on short-term cash flow. In general, high leverage increases the probability of discontinuing unprofitable operations, laying off employees, and replacing inefficient management.
The effect of leverage on the probability of debt restructuring and bankruptcy is positive almost by definition. Only firms with liabilities that they cannot (or will not) pay must restructure their debt or file for bankruptcy protection.’ However, capital structure may affect the choice between debt restructuring and bankruptcy.
Jensen (1989) argues that highly-leveraged firms are more likely to restructure their debt as firm value falls. For these firms, financial restructuring is preferable to a costly bankruptcy, especially when the going-concern value of the firm is vastly greater than its liquidation value. Bankruptcy is, therefore, more likely when firms become leveraged as a result of continuing losses and a steep decline in firm value that brings going-concern value closer to liquidation value. Jensen’s argument would predict a smaller fraction of bankruptcy filings and a higher fraction of debt restructuring in a sample of financially-distressed firms that experience a shorter period of poor performance.
Firms also respond to poor performance with dividend cuts. A financially- distressed firm is more likely than a nondistressed firm to cut its dividend to preserve internal funds for regular operations. In addition, debt covenants may restrict dividend payments, as noted by Smith and Warner (1979). DeAngelo and DeAngelo (1990) report that 67% of firms that suffer a decline in operating performance and profitability over a period of at least three years cut dividends in the first year of distress. This paper extends their work by testing whether a firm’s level of debt before the performance decline is related to its dividend decision.
3. The data
3.1. Sumple colkection
In order to test the relation between leverage and the response to a rapid decline in value, the sample must contain firms with a year of average or superior performance (base year) immediately preceding a year of extreme poor performance (distress year). The sampling procedure first identifies all firms whose stock is publicly traded on either the New York Stock Exchange, the
‘Leverage, defined as the ratio of total debt to total capital, is not always the best measure of a firm’s liabilities. A.H. Robins is an example of a firm with low leverage that filed for bankruptcy protection as a result of pending lawsuits that created contingent liabilities.
E. Ofek, Prrdistresr leoerage and.firm response to poor petfhnance 7
American Stock Exchange, or NASDAQ during the base and distress years. The sample covers the period 198331987, with 1983-1986 as the base year and 198441987 as the distress year. The choice of sample period results from data availability constraints; Lexis provides on-line financial statements starting in 1984, and 1987 was the last year for which financial statements were available when the sample was collected. (Financial statements are required to analyze a firm’s response to distress.) Returns are available on the Center for Research in Security Prices (CRSP) tape. To insure data availability, the market value of each firm’s equity on the last trading day of the base year must be at least $30 million. Finally, financial firms and public utilities are excluded from the sample.
Only firms that experience poor performance and a rapid decline in value are selected for the sample. Such a decline is defined as an annual stock return in the bottom 10% of all returns in the market after having been in the top 67% the year before. Each firm in the sample thus has a minimum drop of 23% in the ranking of all stock returns and a maximum drop of 100%. There are 378 firms that meet the data requirements. However, public data is insufficient for 20 of the firms, leaving a final sample of 358 firms. The total number of firms selected for each year ranges between 73 and 100.
Selecting firms with one year of poor performance ensures identification of responses to short-term distress, making it possible to evaluate the speed with which a firm reacts to a decline in value. Using a short period of poor performance also makes possible a comparison with responses to long-term distress, as documented by, among others, Gilson (1989) and Gilson, John, and Lange (1990). Moreover, using a shorter period of poor performance avoids bringing into the sample firms that became highly leveraged and financially distressed as a result of continuing poor performance to which they did not react.
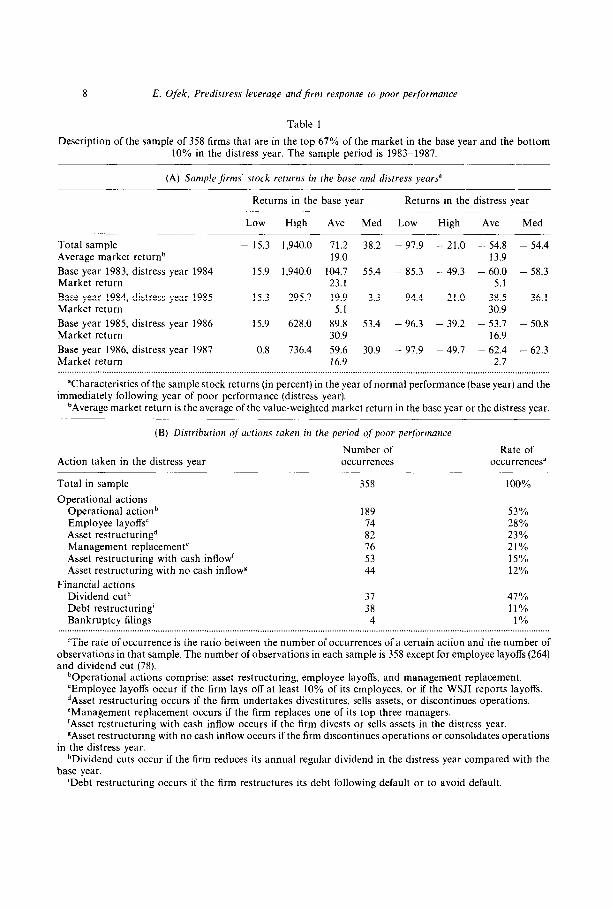
Panel A of table 1 provides information about the market return and the stock returns of the sample firms. The total market return is positive for each of the five years sampled. On three occasions the market return is higher in the base year than in the distress year, and in one instance the distress-year return is higher than the base-year return. But since the sample is based on a firm’s rank in the market, the differences in market returns between the base and distress years are not likely to introduce bias. The median and average base-year returns for the sample firms are always positive. With the exception of the median return in 1984, the base year returns are higher than the average market return. The median return of the full sample in the base year is 38.2%. The sample’s base-year return indicates that the firms selected do not suffer from poor performance during that year.
The sample firms’ stock returns in the distress year indicate very poor performance. The median and average return in any of the four years is significantly negative and substantially lower than the average market return. In each year, both the median and the average return are at least 60% below the
8 E. Qfek, Predistress leverage and firm response to poor performance
Table 1
Description of the sample of 358 firms that are in the top 67% of the market in the base year and the bottom 10% in the distress year. The sample period is 198331987.
(A) Samplefirms’ stock returns in the base and distress years”
Total sample Average market return”
Base year 1983, distress year 1984 Market return
Base year 1984, distress year 1985 Market return
Base year 1985, distress year 1986 Market return
Base year 1986, distress year 1987 Market return
Returns in the base year Returns in the distress year
Low High Ave Med Low High Ave Med
- 15.3 1,940.o 71.2 38.2 19.0
15.9 1,940.o 104.7 55.4 23.1
- 15.3 295.7 19.9 3.3 5.1
15.9 628.0 89.8 53.4 30.9
0.8 736.4 59.6 30.9 16.9
- 97.9 - 21.0 - 54.8 - 54.4 13.9
- 85.3 - 49.3 - 60.0 - 58.3 5.1
- 94.4 - 21.0 - 38.5 - 36.1 30.9
- 96.3 - 39.2 - 53.1 - 50.8 16.9
- 91.9 - 49.7 - 62.4 - 62.3 2.7
“Characteristics of the sample stock returns (in percent) in the year of normal performance (base year) and the immediately following year of poor performance (distress year).
bAverage market return is the average of the value-weighted market return in the base year or the distress year.
(B) Distribution of actions taken in the period of poor performance
Number of Action taken in the distress year occurrences
Rate of occurrencesa
Total in sample
Operational actions Operational actionb Employee layoffs’ Asset restructuringd Management replacement’ Asset restructuring with cash inflow’ Asset restructuring with no cash inflowg
Financial actions Dividend cuth Debt restructuring’ Bankruptcy filings
358 100%
189 53% 14 28% 82 23% 76 21% 53 15% 44 12%
37 38
4
47% 11%
1%
“The rate of occurrence is the ratio between the number of occurrences of a certain action and the number of observations in that sample. The number of observations in each sample is 358 except for employee layoffs (264) and dividend cut (78).
“Operational actions comprise: asset restructuring, employee layoffs, and management replacement. ‘Employee layoffs occur if the firm lays off at least 10% of its employees, or if the WSJI reports layoffs. dAsset restructuring occurs if the firm undertakes divestitures, sells assets, or discontinues operations. ‘Management replacement occurs if the firm replaces one of its top three managers. ‘Asset restructuring with cash inflow occurs if the firm divests or sells assets in the distress year. *Asset restructuring with no cash inflow occurs if the firm discontinues operations or consolidates operations
in the distress year. “Dividend cuts occur if the firm reduces its annual regular dividend in the distress year compared with the
base year. ‘Debt restructuring occurs if the firm restructures its debt following default or to avoid default.
E. Ofek. Predisrress leverage andJirm response to poor performance 9
Table 1 (continued)
(C) Sample’s capital structure characteristics and profitability
Mean Med Low High
Capital structure characteristic Market value of equity in base year (millions) Leverage in base year” Leverage at the end of distress year Current ratio in base yea? Current ratio in distress year Ratio of long-term to total debt’ Ratio of public debt to total debtd Equity holdings - Management Equity holdings - Outsider
Changes in profitability measurese Change in EBITD’ Change in operating marginsg Change in EBITD/total assets”
$211 $85 0.20 0.12 0.35 0.31 3.80 2.31 3.35 2.07 0.71 0.80 0.12 0.00 0.26 0.22 NA 0.06
- 0.99’ - 0.96’ - 1.00’
- 0.33’ - 0.39’ - 0.41’
$30 $6,428 0.00 0.87 0.00 0.98 0.2 1 130.22 0.05 104.34 0.00 1.00 0.00 1.00 0.00 0.88 NA 0.93
- 109.97 14.75 - 59.11 7.92 - 94.25 28.53
“Leverage is defined as the ratio of the book value of debt to the sum of the book value of debt and the market value of equity.
bCurrent ratio is defined as the ratio of current assets to current liabilities. ‘Ratio of book value of debt with maturity of more than one year to total book value of debt. dRatio of book value of public debt to total book value of debt. ‘The change in profitability variable X is calculated as (X, - X,)/Absolute value (X0). ‘EBITD is earnings before interest, taxes, and depreciation. gOperating margins equal the ratio of EBITD in year t to sales in that year. “EBITD/Assets = ratio of EBITD to total book value of assets at year end. ‘Significant at the 5% level. ‘Significant at the 1% level.
(D) Frequency of large nonmanagerial stockholder types in sample firmsa
Number of firms where such stockholder
Identity of nonmanagerial stockholder Exists Is largest investor
Individual 39 29 Corporation 60 56 Corporation friendly to management 14 16 Bank or insurance company 40 29 Mutual fund investment manager 72 56 Employee trust 11 11 Group of investors 14 12
“The distribution of nonmanagerial stockholders with at least 5% of the firm’s common stock by type. The frequency is provided for firms in which a certain type of nonmanagerial stockholder exists and is the largest nonmanagerial investor.
market return. The median return for the full sample in the distress year is - 54%. It appears that the sample successfully captures firms that performed
well in the base year and poorly in the next year. Another indication that sample firms’ performance declined substantially is
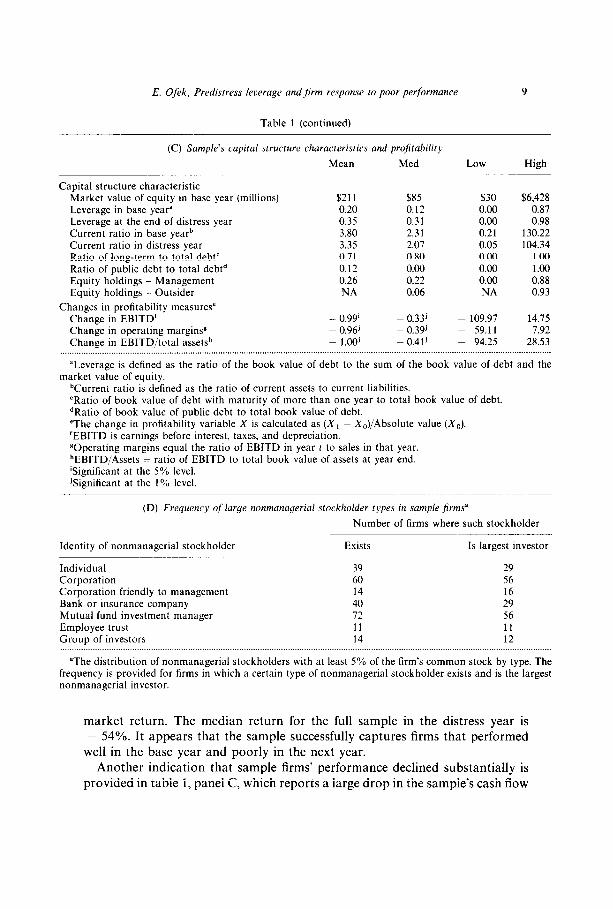
provided in table 1, panel C, which reports a large drop in the sample’s cash flow
10 E. Qfek. Predistress leverage andfirm response to poor performunce
performance during the distress year. There is a - 39% median change in earnings before interest, taxes, and depreciation (EBITD), standardized by sales, from the base year to the distress year. A decline is also observed for the median change in EBITD ( - 33%) and the median change in EBITD standardized with the book value of assets ( - 41%). All of these changes are significant at the 1% level.
3.2. Firm actions
The behavior of the sample firms during the year of poor performance is documented with information on a wide array of actions, including:
(1) Asset restructuring; defined as the divestiture or spin off of a subsidiary or a division, the sale of a substantial part of the firm’s operating or nonoperat- ing assets, the discontinuance of operations in a division, line of business, or geographic region, or the restructuring of operations through closing or consolidating of plants or regional headquarters.
(2) Employee layoffs; defined to occur if the Wall Street Journal Index (WSJI) reports employee layoffs for that year or if the firm lays off at least 10% of its work force during the distress year (without engaging in a divestiture, a substantial sale of assets, or an acquisition). For firms whose fiscal year ends in a month other than December, the 10% reduction in the work force is measured over the two years between the financial statement for the fiscal year ending in the base year and the financial statement for the fiscal year ending in the year following the distress year.
(3) Top management replacement; defined to occur if the firm changes its top management in the distress year, either by appointing a new manager to one of the top three positions (chairman of the board, president, or chief execu- tive officer) or by releasing an incumbent manager.
(4) Debt restructuring; defined to occur if a firm reaches an agreement with its creditors to restructure its debt. A new debt agreement is classified as a debt restructuring only if it comes after either a violation of debt covenants or a default by the firm, or if the firm describes it as a debt restructuring or debt reorganization in its financial statements. This definition underestimates the frequency of debt restructuring agreements because it does not include new debt agreements that are restructuring, in effect, but are not indentified as such by the firm. For example, a new agreement that is signed to prevent a firm from defaulting will often not be included as a debt restructuring because of identification problems.
(5) Bankruptcy filing; defined to occur for firms that file for bankruptcy under Chapter 11 or Chapter 7 of the bankruptcy code.
(6) Dioidend changes; defined as changes in the total annual regular dividend from the base year to the distress year.
The first three actions are operational actions. They affect the investment decisions of the firm as well as its operational strategy. The last three actions are financial actions that affect both the value of various claims and the cash flow distribution to the firm’s owners. There is, of course, an interaction: financial actions such as bankruptcy filings affect the firm’s operations.
Information is also collected about actions such as acquisitions and attempts to change control. Data on asset restructuring, debt restructuring, and bank- ruptcy filings are collected from the firm’s financial statements. In 13 cases, the firm’s financial statements for the distress year are not available and information is collected from the WSJI. The information about management changes comes primarily from the WSJI, and is verified in the listings of Standard & Poor’s Directory of Corporations. The number of employees in each firm and the changes in dividend payout are retrieved from the Industrial Compustat and CRSP data bases, respectively. Information about covenant restrictions on the sample firms for the base year are retrieved from Moody’s Industrial, Transpor- tation, and Utility manuals.
Operational response comes quickly. An operational action (asset restructur- ing, management replacement, or employee layoffs) is taken by 53% of the firms in the sample during the distress year. Panel B of table 1 summarizes the sample firms’ actions during the distress year. The most common operational action is asset restructuring, reported by 82 firms (23% of the sample). Within this group, 23 firms announce a divestiture, 31 announce a major sale of assets, 24 discon- tinue operations, and 23 restructure their operations. Changes in top manage- ment are made by 76 firms (21% of the sample), a significantly higher rate than the 11.5% annual management turnover in a random sample [Warner, Watts, and Wruck (1988)], but lower than the 30% annual turnover rate in a sample of firms performing poorly for three years [Gilson (1989)]. Seventy-four firms lay off a substantial part of their work force (28% of the sample, excluding firms making acquisitions, divestitures, or asset sales, for which layoffs are not measured).
During the distress year, there are attempts to change control in 11 firms. Ten firms receive either a leveraged buyout bid or a takeover bid, but only three of the bids are successful. The sampling method, which requires low returns in the distress year, tends to underestimate the frequency of these events for poorly- performing firms and to overestimate the ratio between unsuccessful and suc- cessful offers. [See Clark and Ofek (1992) for further evidence on acquisitions of distressed firms.]
Only four firms (1% of the sample) filed for bankruptcy protection during the distress year. This number is small, considering that the sample firms suffer a large decline in stock prices and that 42 firms are financially distressed (a firm
12 E. Ofek. Predisrress leaerage and firm response to poor performance
is financially distressed if it defaults or files for bankruptcy protection, or restructures its debt). In contrast, Gilson, John, and Lang (1990), who use a similar definition of financial distress, report that 53% of financially-distressed firms file for bankruptcy protection. The difference may be attributable to differences in the length of the distress period. Firms that have been distressed for only a short time are more successful in negotiating agreements with debtholders which enable them to continue operating outside bankruptcy. Many of these agreements, however, provide only short-term relief from credi- tors, either by refinancing defaulted debt with short-term debt or by waiving covenant restrictions temporarily. If poor performance persists, financial dis- tress continues and the likelihood of bankruptcy increases, as in Gilson, John, and Lang.
Of the sample firms that pay dividends in the base year, 47% cut their annual dividend during the distress year (the average reduction is 48%) and 28% increase their dividend. The proportion of cuts is significantly higher than in a random sample, reported by Aharoni and Swary (1980) to be 2%.* DeAngelo and DeAngelo (1990) report that 67% of firms that perform poorly for at least three years cut their dividends during the first year of poor performance, while 20% increase their dividends. Their higher rate of dividend reduction may be a result of managers in their sample anticipating longer-term distress and reacting with a dividend cut in the first year.
3.3. The capital structure characteristics qf the sample
For each firm in the sample, information on debt, liquidity, and other financial characteristics is retrieved from the Industrial Compustat tape. The information for the base year is taken from financial statements for the fiscal year ending on or before December 31 of the base year. The financial informa- tion for the distress year is taken from financial statements for the fiscal year ending on or after December 31 of the distress year.
Panel C of table 1 summarizes the financial data for the sample firms. The median equity value on the last trading day of the base year (predistress value) is $85 million, and the average value is $211 million. The smallest firm in the sample has an equity value of $30 million, and the largest equity value of the firm is $6,427 million.
For this study, leverage is defined as the total book value of the firm’s long- and short-term debt, divided by the sum of the market value of the equity and the book value of the debt. The average leverage in the base year is 0.20,
‘Aharoni and Swary use a sample of 6,338 quarters of dividend announcements, whereas I use annual changes in dividend. A 2% rate of quarterly dividend cuts implies that the upper bound on the annualized dividend-cut rate in their sample is 8%, which is still significantly lower than the rate in my sample.
E. Ofek, Predistress leverage and,firm response to poor performance 13
increasing to 0.35 in the distress year (the median increases from 0.12 to 0.31).3 When leverage is defined as the ratio of the book value of debt to the book values of debt plus equity, the average leverage is 0.33 in the base year and 0.38 in the distress year. The distress-year leverage is biased downward, however, because 13 observations are missing. Most of these observations are financially- distressed firms for which the relevant data are not available. Leverage varies widely among firms in the sample, ranging between zero and 0.87 in the base year and between zero and 0.98 in the distress year.
The current ratio (current assets divided by current liabilities) is used as a measure of liquidity. The median level of the current ratio in the sample drops from 3.8 in the base year to 3.4 in the distress year. This measure ranges between 0.2 and 130 in the base year, which implies a large variation in liquidity across the sample firms.
Information about the distribution of each firm’s stockholding is collected from proxy statements, usually from the base year. The data taken from the proxy statements include management holdings as well as the holdings and identities of nonmanagement investors who own at least 5% of the firm’s equity (large outside stockholders). The median level of management holdings in the sample is 22% (the average is 26%) and the median ownership by the largest outside stockholder is 6%. Panel D of table 1 shows the frequency distribution of the different types of large outside stockholders. In 72 firms (20% of the sample), a mutual fund or other investment management firm holds more than 5% of the equity, and in 56 of these firms the fund is also the largest outside investor. Large blocks of shares (more than So/,) are held by another corporation in 60 firms, by a bank or an insurance company in 40 firms, and by an individual in 39 firms.
The capital-structure characteristics of the sample in the base year are generally similar to the characteristics reported in other samples, but manage- ment holdings are larger than reported in most studies [Jensen and Warner (1988)]. However, this sample includes a larger fraction of smaller firms, which tend to have larger managerial holdings.
4. Empirical results
The primary focus is to test whether a firm’s predistress capital structure affects the actions likely to be taken in periods of poor performance. Logit regressions are used to estimate the relation between capital structure and the probability that various actions will occur. (The results in this paper continue to
3The results do not change if the book value of equity is used instead of the market value in calculating leverage, or if firm value (the denominator in the leverage ratio) is defined as the market value of common and preferred stock and the book value of debt.
14 E. Qfek, Predisrress leverage and firm response to poor pet@mance
hold if probit analysis is used instead.) The dependent variables are binary variables that take the value of one if a certain action occurs and zero otherwise. The hypotheses tested in this section predict a positive relation between predis- tress leverage and the following: any operational action, asset restructuring, employee layoffs, management replacement, debt restructuring, bankruptcy filing, and dividend cuts.
4.1. Results for the fill sample
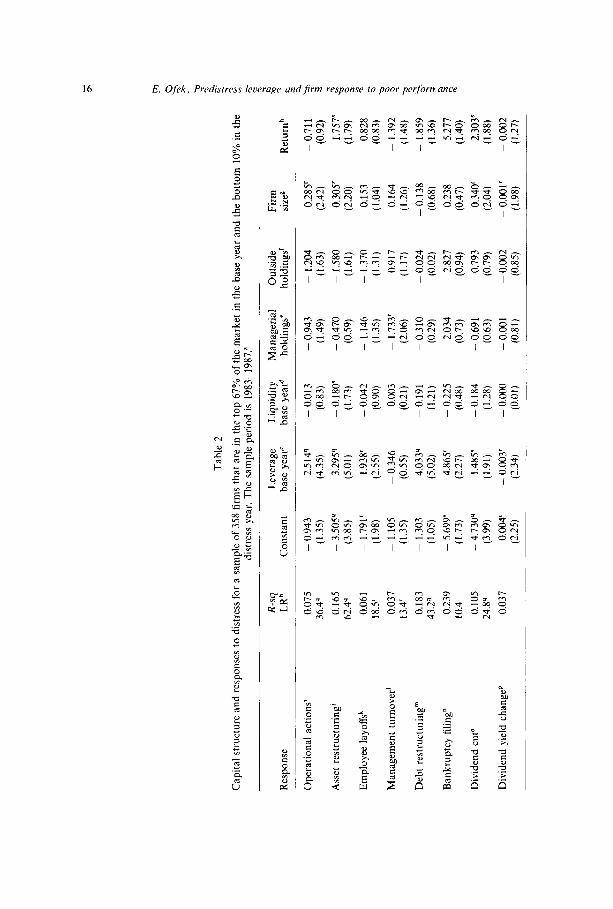
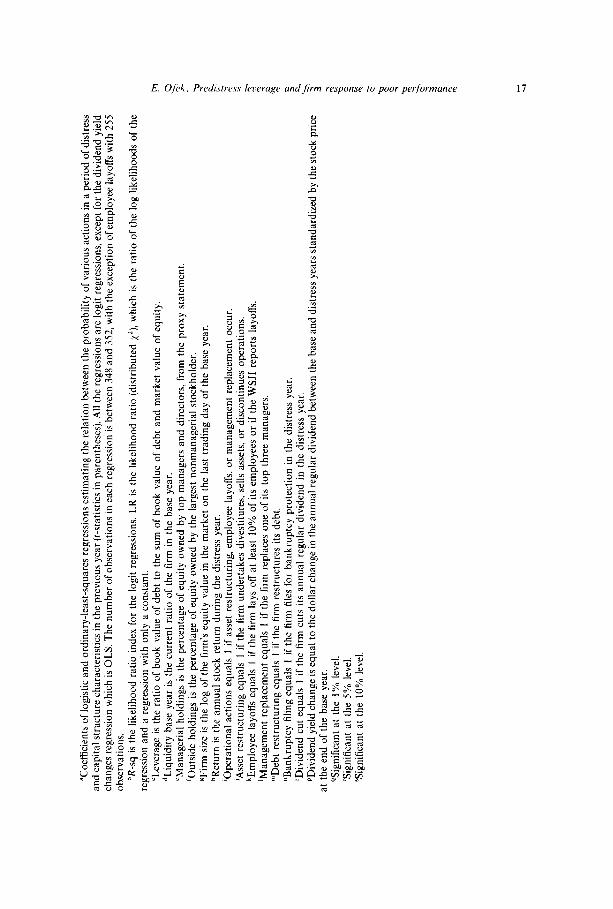
Table 2 reports the relation between the probabilities of the various firm responses and the following capital structure variables: leverage at the end of the base year, the firm’s current ratio, managerial holdings in the firm, and outside holdings. The log of the firm’s equity at the end of the base year and the firm’s stock return during the distress year are used as control variables.
The first regression measures the effect of the capital structure variables on the probability that any operational action will be taken. The most striking result is the positive and highly signijcant relation between thefirm’s leverage in the base
year and the probability that an operational action will be taken in the distress
year. Apparently, firms with more debt in their capital structure when times are good are more likely to respond operationally when bad times arrive. This result is consistent with Jensen’s (1989) prediction that firms with high leverage are more likely to respond quickly to a decline in value.
The remaining regressions in table 2 report the relation between individual operational or financial actions and capital structure. Among specific opera- tional actions, asset restructuring and employee 1ayofSs are both positively related
to higher leverage in the base year (t = 5.01 and t = 2.55, respectively). Highly- leveraged firms that experience short-term distress are more likely to react with asset sales, discontinued operations, and employee layoffs. The only operational action not significantly affected by leverage is management replacement in contrast to Gilson (1989) who finds that higher leverage increases the probabil- ity of management replacement for firms in financial distress. The difference in results may be attributable to differences in the duration of distress: Gilson’s firms have been distressed for at least three years whereas in this paper, firms are in their first year of distress.
The lack of a short-term relation between predistress leverage and manage- ment replacement may lie in a slow transfer of control of the firm to the debtholders. Apparently, debtholders can more easily exert pressure on manage- ment to change the firm’s asset structure or to reduce costs through employee layoffs than to replace management. A longer period of distress is required before debtholders gain enough control to force’ a management change. The results in this paper, combined with Gilson’s findings, emphasize the role of long-term distress in debtholder-initiated management turnover.
E. Qfek. Predistress leueruge andjirm resportse to poor pet-formance 15
Of the financial actions taken by the firm, debt restructuring and bankruptcy filing are more likely in highly-leveraged firms than in those with less debt. Higher leverage creates a tradeoff between a quicker response to distress and the possibility of a costly bankruptcy. As previously discussed, however, the bank- ruptcy rate in the sample remains low (1%).
Leverage is also positively and signljicantly related to the probability of dividend cuts. Firms with more debt are more likely to cut their dividends as firm performance deteriorates. The cut in dividends may be caused by financial covenants that restrict dividend payments, or by the cash-flow shortage and financial distress that debt service obligations create.
The use of a binary variable that takes the value of one if the firm cuts its dividend and zero otherwise results in a loss of some of the information in the firm’s dividend decision; dividend increases are ignored, and the size of the dividend change is not considered. To capture this information, a variable is introduced that equals the dollar change in the annual regular dividend from the base year to the distress year, standardized by the stock price at the end of the base year. An ordinary-least-squares regression measures the relation between the predistress capital structure and the dividend decision in the distress year. The outcome of this regression shows that higher predistress leverage is asso- ciated with larger dividend reductions in poorly-performing firms (significant at the 5% level).
Higher managerial holdings reduce the probability of management turn- over and have a negative but insignificant effect on other operational actions. Weisbach (1988) finds that the CEO’s share of the equity has a negative but insignificant effect on the probability of a CEO change. The presence of a large outside stockholder has a negative but insignificant relation to the probability of an operational action, and a mixed effect on the various individual actions a firm might take.
Except in the case of management replacement, greater liquidity in the base year decreases the probability that an action will be taken. Only the relation between liquidity and asset restructuring, however, is statistically significant. This result suggests that the actions are not taken as a result of liquidity problems. Alternatively, the current ratio at the end of the base year may fail to capture liquidity problems during the distress year. When logit regressions are run using the current ratio at the end of the distress year as an explanatory variable, liquidity has more effect on some of the actions: liquidity is negatively and significantly related (at the 5% level) to the probability of asset and debt restructuring, and negatively but not significantly related to the probability of employee layoffs and management turnover. However, since liquidity at the end of the distress year is also related to the firm’s cash flow, it is hard to determine whether the relation between the current ratio and the various actions stems from real liquidity problems or is the result of a spurious correlation generated by the negative relation between the firm’s performance and the occurrence of
Tab
le
2
Cap
ital
stru
ctur
e an
d re
spon
ses
to
dist
ress
fo
r a
sam
ple
of 3
58 f
irm
s th
at
are
in t
he
top
67%
of
the
m
arke
t in
the
ba
se
year
an
d th
e bo
ttom
10
%
in t
he
dist
ress
ye
ar.
The
sa
mpl
e pe
riod
is
19
83-1
987.
” _
R-s
q L
ever
age
Liq
uidi
ty
Man
ager
ial
Out
side
Fi
rm
Res
pons
e L
Rb
Con
stan
t ba
se
year
’ ba
se
year
d ho
ldin
gs’
hold
ings
’ si
z@
Ret
urn”
Ope
ratio
nal
actio
ns’
0.07
5 -
0.94
3 2.
514q
-
0.01
3 -
0.94
3 -
1.20
4 0.
285’
-
0.71
1 36
.44
(1.3
5)
(4.3
5)
(0.8
3)
(1.4
9)
(1.6
3)
(2.4
2)
(0.9
2)
Ass
et
rest
ruct
urin
g’
0.16
5 -
3.50
54
3.29
54
- 0.
180”
-
0.47
0 -
1.58
0 0.
305’
1.
757”
62
.4q
(3.8
5)
(5.0
1)
(1.7
3)
(0.5
9)
(1.6
1)
(2.2
0)
(1.7
9)
Em
ploy
ee
layo
ff?
0.06
I
- 1.
791’
1.
938’
-
0.04
2 -
1.14
6 -
1.37
0 0.
153
0.82
8 18
.5’
(1.9
8)
(2.5
5)
(0.9
0)
(1.3
5)
(1.3
1)
(1.0
4)
(0.8
3)
Man
agem
ent
turn
over
’ 0.
037
- I.
105
- 0.
346
0.00
3 -
1.73
3’
0.91
7 0.
164
- 1.
392
13.4
(1
.35)
(0
.55)
(0
.21)
(2
.06)
(1
.17)
(1
.26)
(1
.48)
Deb
t re
stru
ctur
ing”
0.
183
- 1.
303
4.03
3q
- 0.
191
- 0.
310
- 0.
024
- 0.
138
- 1.
859
43.2
q (1
.05)
(5
.02)
(1
.21)
(0
.29)
(0
.02)
(0
.68)
(1
.36)
Ban
krup
tcy
filin
g”
0.23
9 -
5.69
9”
4.86
5’
- 0.
225
2.03
4 2.
827
0.23
8 ~
5.27
7 10
.4
(1.7
3)
(2.2
7)
(0.4
8)
(0.7
3)
(0.9
4)
(0.4
7)
(1.4
0)
Div
iden
d cu
t0
0.10
5 -
4.73
09
1.48
5’
- 0.
184
- 0.
691
0.79
3 0.
340’
2.
303”
24
.8“
(3.9
9)
(1.9
1)
(1.2
8)
(0.6
3)
(0.7
9)
(2.0
4)
(1.8
8)
Div
iden
d yi
eld
chan
geP
0.03
7 0.
004
- 0.
003’
-
0.00
0 -
0.00
1 -
0.00
2 -
0.00
1’
- 0.
002
(2.2
5)
(2.3
4)
(0.0
1)
(0.8
1)
(0.8
5)
(1.9
8)
(1.2
7)
“Coe
ffic
ient
s of
log
istic
an
d or
dina
ry-l
east
-squ
ares
re
gres
sion
s es
timat
ing
the
rela
tion
betw
een
the
prob
abili
ty
of v
ario
us
actio
ns
in a
per
iod
of d
istr
ess
and
capi
tal
stru
ctur
e ch
arac
teri
stic
s in
the
pr
evio
us
year
(r
-sta
tistic
s in
par
enth
eses
).
All
the
regr
essi
ons
are
logi
t re
gres
sion
s,
exce
pt
for
the
divi
dend
yi
eld
chan
ges
regr
essi
on
whi
ch
is O
LS.
T
he
num
ber
of o
bser
vatio
ns
in e
ach
regr
essi
on
is b
etw
een
348
and
352,
with
th
e ex
cept
ion
of e
mpl
oyee
la
yoff
s w
ith
255
obse
rvat
ions
. ‘R
-sq
is t
he
likel
ihoo
d ra
tio
inde
x fo
r th
e lo
git
regr
essi
ons.
L
R
is t
he
likel
ihoo
d ra
tio
(dis
trib
uted
x2
), w
hich
is
the
ra
tio
of t
he
log
likel
ihoo
ds
of t
he
regr
essi
on
and
a re
gres
sion
w
ith
only
a
cons
tant
, ‘L
ever
age
is t
he
ratio
of
boo
k va
lue
of d
ebt
to
the
sum
of
boo
k va
lue
of d
ebt
and
mar
ket
valu
e of
equ
ity.
dLiq
uidi
ty
base
ye
ar
is t
he
curr
ent
ratio
of
the
fi
rm
in t
he
base
ye
ar.
‘Man
ager
ial
hold
ings
is
the
pe
rcen
tage
of
equ
ity
owne
d by
to
p m
anag
ers
and
dire
ctor
s,
from
th
e pr
oxy
stat
emen
t. ‘O
utsi
de
hold
ings
is
the
pe
rcen
tage
of
equ
ity
owne
d by
th
e la
rges
t no
nman
ager
ial
stoc
khol
der.
gFir
m
sire
is
the
lo
g of
the
fi
rm’s
eq
uity
va
lue
in t
he
mar
ket
on
the
last
tr
adin
g da
y of
the
ba
se
year
. “R
etur
n is
the
an
nual
st
ock
retu
rn
duri
ng
the
dist
ress
ye
ar.
‘Ope
ratio
nal
actio
ns
equa
ls
I if
ass
et
rest
ruct
urin
g,
empl
oyee
la
yoff
s,
or
man
agem
ent
repl
acem
ent
occu
r. ‘A
sset
re
stru
ctur
ing
equa
ls
I if
the
fi
rm
unde
rtak
es
dive
stitu
res,
se
lls
asse
ts,
or
disc
ontin
ues
oper
atio
ns.
‘Em
ploy
ee
layo
ffs
equa
ls
I if
the
fi
rm
lays
of
f at
le
ast
10%
of
its
em
ploy
ees
or
if t
he
WSJ
I re
port
s la
yoff
s.
‘Man
agem
ent
repl
acem
ent
equa
ls
1 if
the
fi
rm
repl
aces
on
e of
its
to
p th
ree
man
ager
s.
“Deb
t re
stru
ctur
ing
equa
ls
I if
the
fi
rm
rest
ruct
ures
its
deb
t. “B
ankr
uptc
y fi
ling
equa
ls
1 if
the
fi
rm
file
s fo
r ba
nkru
ptcy
pr
otec
tion
in t
he
dist
ress
ye
ar.
“Div
iden
d cu
t eq
uals
1
if t
he
firm
cu
ts
its a
nnua
l re
gula
r di
vide
nd
in
the
dist
ress
ye
ar.
PDiv
iden
d yi
eld
chan
ge
is e
qual
to
the
dol
lar
chan
ge
in t
he a
nnua
l re
gula
r di
vide
nd
betw
een
the
base
an
d di
stre
ss
year
s st
anda
rdiz
ed
by t
he s
tock
pr
ice
at
the
end
of t
he
base
ye
ar.
4Sig
nitic
ant
at
the
1%
leve
l. Si
gnif
ican
t at
th
e 5%
le
vel.
‘Sig
nifi
cant
at
th
e 10
%
leve
l.
18 E. tlfek, Predistress lewrage andJirm response to poor performance
these actions, Using flow variables such as the interest coverage ratio in the distress year or the ratio of funds from operations to sales to measure liquidity does not change the results; none of the actions is significantly related to these flow measures of liquidity. (Results with the distress-year liquidity variables are not reported in the tables.)
Firm size, measured as the log of equity value at the end of the base year, is positively and significantly related to the probability of operational actions and to the specific step of asset restructuring. This relation may reflect a bias against small firms in the availability of public information. It may also be influenced by the fact that larger firms often operate in several lines of business and different geographic regions, so that they may be better able to restructure at the onset of distress, whereas the possibility of asset restructuring in smaller firms is more limited.
The logit regressions are repeated with additional industry dummy variables that equal one if a firm has a certain three-digit SIC code and zero otherwise; to control for the possibility that industry effects cause a spurious correlation between the actions tested and the capital-structure characteristics of the firm. All the relations described in table 2 continue to hold after controlling for industry effects.
4.2. The t$ect of industry distress
A sample of firms with poor performance relative to their industry (industry distress) is also collected, using a procedure analogous to that used to collect the sample firms with poor performance relative to the market (market distress). This new sample is used to test the relation between capital structure and a firm’s response to industry distress, and to contrast that relation with the response to market distress. Only firms with returns available on CRSP and with equity values of at least $30 million at the end of the base year are considered and, as before, financial firms and public utilities are excluded. A firm is defined as being in industry distress if its stock return falls to the bottom 10% in its industry after having been in the top 67%. Firms are considered to be in the same industry if they have the same three-digit SIC code, and there are at least 20 firms in the initial sample with the same code.
The industry-distress sample is collected over the same period as the market- distress sample. Of the 144 firms in industry distress, 88 are also in the market- distress sample. To sharpen the contrast, these firms are excluded from the industry-distress analysis. The final sample consists of the 56 firms that suffer from industry distress but not market distress. Information about base-year capital structure and distress-year actions is collected for these firms.
The stock return in the distress year of firms in industry distress only is significantly higher than that of firms in market distress; for example, the difference in the median return for these samples is 17% (return characteristics
E. Qfek. Predistress leceruge and firm response to poor performance 19
of firms with industry distress are not reported in the tables). This pattern arises because firms performing poorly in relation to an industry that has unexpectedly good performance enter the sample even though their market value does not decline substantially.
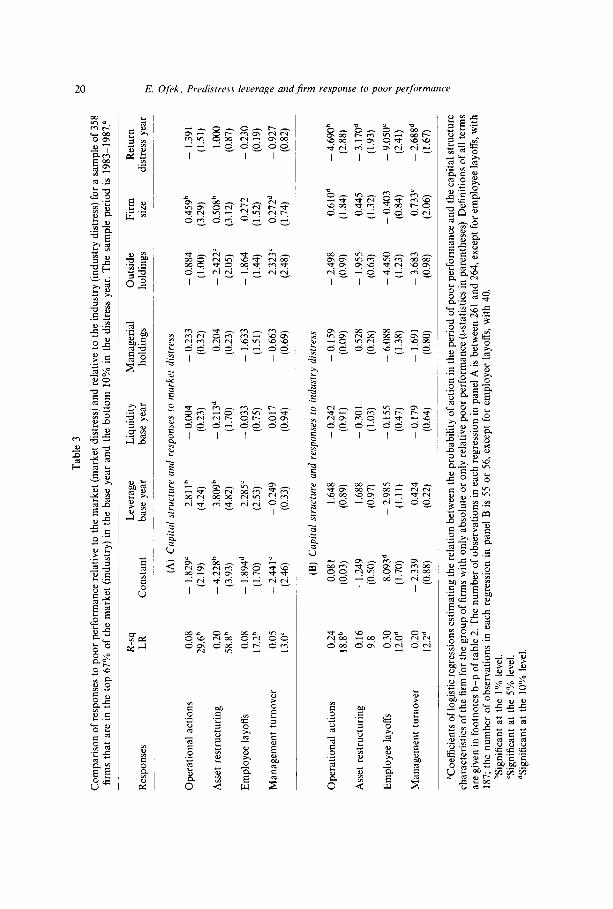
Panel A of table 3 reports the results from the logit regressions for the sample of firms with market distress only. Here, the effect of leverage on the probability of an operational action is positive and significant (at the 1% level). Leverage also has a positive and significant effect on the probabilities of asset restructur- ing and employee layoffs. The effects of management holdings and holdings by outside investors are similar to those for the full sample, although in several cases they lose their significance.
The results for firms with only industry distress are different. For these firms, panel B shows that leverage is not related to the probability of an operational action, nor is it related to the probabilities of the individual actions. The effects of other variables, such as liquidity, management holdings, and outside hold- ings, are generally similar for the two groups.
The industry-distress and market-distress samples also differ in the relation between the distress-year stock returns and the probability of operational actions. For firms in industry distress only, higher returns are significantly associated with lower probabilities of any operational action as well as asset restructuring, employee layoffs, and management turnover specifically. For firms in market distress, the relation is negative in most cases but has smaller coefficients and is not statistically significant. This result implies that the level of market distress influences whether firms in industry distress are disciplined. Yet for firms already in market distress, the gradations in distress are not related to any of the actions they take while in distress.
The main difference in the effect of capital structure on industry and market distress is the absence of a significant relation between leverage and operational actions among firms in industry distress only. A possible explanation is that the value of the debt declines if firm value declines, but not if the firm’s performance relative to its industry is poor, so that debtholders exert significant pressure only on firms in market distress. The covenants held by the sample firms support this explanation. Violations of these covenants are contingent on absolute perform- ance measures but not on relative measures.
The importance of some form of market distress in triggering the effect of leverage is evident when the industry-distress sample is expanded to include the 88 firms in both industry and market distress. The effect of leverage on the probability of operational actions becomes positive and statistically significant. A similar result is found in a sample of firms in industry distress and with negative EBITD in the year of distress (these results are not reported).
The sample selection criteria could also explain the lack of a relation between leverage and operational actions in response to industry distress. Industry distress is judged on the basis of the three-digit SIC code in the CRSP files,
Tab
le
3
Com
pari
son
of r
espo
nses
to
poo
r pe
rfor
man
ce
rela
tive
to t
he
mar
ket
(mar
ket
dist
ress
) an
d re
lativ
e to
the
in
dust
ry
(ind
ustr
y di
stre
ss)
for
a sa
mpl
e of
358
fi
rms
that
ar
c in
the
to
p 67
%
of t
he
mar
ket
(ind
ustr
y)
in
the
base
ye
ar
and
the
botto
m
10%
in
the
di
stre
ss
year
. T
he
sam
ple
peri
od
is
1983
-198
7.”
Res
pons
es
Ope
ratio
nal
actio
ns
Ass
et
rest
ruct
urin
g
Em
ploy
ee
layo
ffs
Man
agem
ent
turn
over
R-s
q L
R
Con
stan
t L
ever
age
base
ye
ar
Liq
uidi
ty
base
ye
ar
Man
ager
ial
hold
ings
O
utsi
de
hold
ings
0.08
-
1.82
9’
2.81
1b
~ 0.
004
- 0.
233
29.6
b (2
.19)
(4
.24)
(0
.23)
(0
.32)
0.20
-
4.22
gb
3.80
9”
- 0.
213d
0.
204
58.g
b (3
.93)
(4
.82)
(1
.70)
(0
.23)
0.08
-
1.89
4d
2.28
5’
- 0.
033
- 1.
633
17.2
b (1
.70)
(2
.53)
(0
.75)
(1
.51)
0.05
-
2.44
1’
- 0.
249
0.01
7 -
0.66
3 13
.0’
(2.4
6)
(0.3
3)
(0.9
4)
(0.6
9)
(A)
Cap
ital
stru
ctur
e an
d re
spon
ses
to m
arke
t di
stre
ss
- 0.
884
(1.0
0)
- 2.
422’
(2
.05)
- 1.
864
(1.4
4)
2.32
3’
(2.4
8)
Ope
ratio
nal
actio
ns
Ass
et
rest
ruct
urin
g
Em
ploy
ee
layo
ffs
Man
agem
ent
turn
over
0.24
0.
08 1
1.
648
18.8
b (0
.03)
(0
.89)
0.16
-
1.24
9 1.
688
9.8
(0.5
0)
(0.9
7)
0.30
8.
093d
-
2.98
5 12
.0*
(1.7
0)
(1.1
1)
0.20
-
2.33
9 0.
424
12.2
d (0
.88)
(0
.22)
(B)
Cap
ital
stru
ctur
e an
d re
spon
ses
to i
ndus
try
dist
ress
- 0.
242
(0.9
1)
- 0.
301
(1.0
3)
- 0.
155
(0.4
7)
~ 0.
179
(0.6
4)
- 0.
159
(0.0
9)
0.52
8 (0
.28)
- 6.
088
(1.3
8)
~ 1.
691
(0.8
0)
- 2.
498
(0.9
9)
- 1.
955
(0.6
3)
- 4.
450
(1.2
3)
- 3.
683
(0.9
8)
Firm
si
ze
Ret
urn
dist
ress
ye
ar
0.45
9b
(3.2
9)
0.50
gb
(3.1
2)
0.27
2 (1
.52)
0.27
2*
(1.7
4)
- 1.
391
(1.5
1)
1.00
0 (0
.87)
- 0.
230
(0.1
9)
- 0.
927
(0.8
2)
0.61
0d
(1.8
4)
0.44
5 (1
.32)
- 0.
403
(0.8
4)
0.73
3’
(2.0
6)
- 4.
690b
(2
.88)
- 3.
170d
(1
.93)
- 9.
050’
(2
.41)
- 2.
68gd
(1
.67)
“Coe
ffic
ient
s of
log
istic
re
gres
sion
s es
timat
ing
the
rela
tion
betw
een
the
prob
abili
ty
of a
ctio
n in
the
per
iod
of p
oor
perf
orm
ance
an
d th
e ca
pita
l st
ruct
ure
char
acte
rist
ics
of t
he
firm
for
the
gr
oup
of f
irm
s w
ith
only
ab
solu
te
or o
nly
rela
tive
poor
pe
rfor
man
ce
(t-s
tatis
tics
in p
aren
thes
es).
D
efin
ition
s of
all
term
s ar
e gi
ven
in f
ootn
otes
b-
p of
tab
le
2. T
he
num
ber
of o
bser
vatio
ns
in e
ach
regr
essi
on
in p
anel
A
is
betw
een
261
and
264,
exc
ept
for
empl
oyee
la
yoff
s,
with
18
7; t
he
num
ber
of o
bser
vatio
ns
in e
ach
regr
essi
on
in p
anel
B
is
55 o
r 56
, ex
cept
fo
r em
ploy
ee
layo
ffs,
w
ith
40.
“Sig
nifi
cant
at
th
e 1%
le
vel.
‘Sig
nifi
cant
at
th
e 5%
le
vel.
‘?3i
gnif
ican
t at
th
e 10
%
leve
l.
E. Qfek, Predistress leverage andJim response to poor peyformance 21
without considering that some firms may operate in more than one industry. Some firms, if results in their other businesses were bad enough, might end up in the industry-distress sample even if they operated well in their primary industry. These firms are not likely to take actions in the year of distress; their inclusion adds noise to the sample and could cloud the evidence.
Merck, Shleifer, and Vishny (1989) report that top management turnover, which they associate with successful monitoring by the board, is more likely to occur in firms that underperform their industry. They find no more management turnover in troubled industries than in others, however, and interpret the results to mean that the board of directors is an ineffective monitor in troubled industries (firms with market distress only would fall in this category). The findings in this paper indicate that debtholder monitoring may supplement board monitoring: debt disciplines firms in market distress but not firms that underperform their industry.
5. Leverage characteristics and short-term cash flow
This section further investigates the relation between a firm’s actions and the characteristics of its debt, such as maturity and ownership. It also investigates whether the relation between the firm’s operational actions and leverage stems from a need to raise cash to service the debt in the year of distress.
5.1. Debt maturity, debt ownership, and the3rm’s actions
The relation between a firm’s leverage and its operational actions is signifi- cantly positive. Total debt, however, is an aggregation of long- and short-term debt as well as public and private debt, each of which may have a different effect on the firm’s actions. The importance of debt ownership is documented by Gilson, John, and Lang (1990), who report that firms with a high ratio of bank debt are more likely to successfully restructure their debt, and by Hoshi, Kashyap, and Scharfstein (1990) who report that, in Japan, financially-dis- tressed firms with a bank affiliation perform better than those with no such affiliation at the onset of distress. Baldwin, Mason, and Hughes (1983) show that high levels of short-term debt forced Massey Ferguson to quickly sell assets, discontinue operations, lay off employees, and negotiate debt restructuring agreements with creditors.
The results of selected regressions that measure the effect on various actions of debt maturity and ownership are reported in table 4. Debt with a maturity of more than one year is considered long-term debt, and debt with a maturity of less than one year is short-term debt. The first regression tests the relation between long- and short-term leverage and the probability of operational actions, and finds a positive and significant result in both cases (although the
Tab
le
4
Deb
t ch
arac
teri
stic
s an
d th
e fi
rm’s
act
ions
fo
r a
sam
ule
of 3
58 f
irm
s th
at
are
in t
he t
oo
67%
of
the
mar
ket
in t
he b
ase
vear
an
d th
e bo
ttom
10
%
in t
he d
istr
ess
year
. T
he
sam
ple
peri
od
is
1983
-198
7.”
Res
pons
es
R-s
q L
iqui
dity
Fi
rm
LR
C
onst
ant
base
ye
ar
size
Ope
ratio
nal
actio
ns
Ope
ratio
nal
actio
ns
Ope
ratio
nal
actio
ns
Deb
t re
stru
ctur
ing
Ope
ratio
nal
actio
ns
Deb
t re
stru
ctur
ing
Man
agem
ent
turn
over
Lev
erag
e M
atur
ity
Ow
ners
hip
Lon
g-te
rm
Shor
t-te
rm
Priv
ate
Publ
ic
base
ye
ar
ratio
b ra
tio’
leve
rage
d le
vera
ged
leve
rage
’ le
vera
ge’
2.29
4’
3.32
8”
(3.6
1)
(1.9
3)
0.06
7 -
1.78
8’
~ 0.
013
0.31
4’
33.1
’ (3
.18)
(0
.79)
(2
.77)
0.08
1
- 1.
976’
2.
365’
0.
454
- 0.
034
0.29
8g
36.4
’ (3
.10)
(3
.65)
(1
.02)
(0
.53)
(2
.50)
0.07
5 ~
2.06
7’
3.25
8’
1.04
1 0.
001
0.34
8’
33.5
’ (3
.21)
(4
.06)
(0
.88)
(0
.01)
(2
.90)
0.18
2 -
2.64
5g
5.11
9’
- 0.
009
- 0.
093
- 0.
091
41.4
’ (2
.50)
(5
.15)
(0
.01)
(0
.57)
(0
.46)
0.07
3 -
1.99
3’
2.86
0’
- 0.
554
- 0.
007
0.34
7’
32.5
’ (3
.13)
(4
.18)
(1
.06)
(0
.12)
(2
.89)
0.19
3 -
2.77
0’
4.97
0’
- 3.
260g
-
0.07
6 -
0.05
0 43
.8’
(2.6
2)
(5.2
5)
(2.5
7)
(0.4
8)
(0.2
5)
0.02
8 -
2.76
3’
1.06
5 -
2.23
6g
0.08
1
0.24
4h
9.1h
(3
.81)
(1
.48)
(2
.51)
(1
.21)
(1
.82)
__
__~
“Coe
ffic
ient
s of
lo
gist
ic
regr
essi
ons
estim
atin
g th
e re
latio
n be
twee
n ca
pita
l-st
ruct
ure
char
acte
rist
ics
and
the
prob
abili
ty
of
actio
ns
in
the
peri
od
of
poor
pe
rfor
man
ce
for
a sa
mpl
e of
fir
ms
expe
rien
cing
on
e ye
ar
of d
istr
ess.
T
hese
re
gres
sion
s es
timat
e th
e ef
fect
of
var
ious
de
bt
char
acte
rist
ics
on
the
actio
ns
(t-s
tatis
tics
in p
aren
thes
es).
D
efin
ition
s of
all
term
s ar
e gi
ven
in f
ootn
otes
bb
p of
tab
le
2. T
he
num
ber
of o
bser
vatio
ns
in e
ach
regr
essi
on
is b
etw
een
318
and
355.
“M
atur
ity
ratio
is
the
ra
tio
of t
he
book
va
lue
of l
ong-
term
de
bt
to
tota
l de
bt,
for
firm
s w
ith
posi
tive
debt
in
th
e ba
se
year
. ‘O
wne
rshi
p ra
tio
is t
he
ratio
of
the
bo
ok
valu
e of
pub
lic
debt
to
to
tal
debt
, fo
r fi
rms
with
po
sitiv
e de
bt
in
the
base
ye
ar.
“Lon
g(sh
ort)
-ter
m
leve
rage
is
the
ra
tio
of t
he
book
va
lue
of l
ong(
shor
t)-t
erm
de
bt
to
the
book
va
lue
of t
otal
de
bt
plus
th
e m
arke
t va
lue
of e
quity
, in
the
ba
se
year
. ‘Pri
vate
(p
ublic
) le
vera
ge
is t
he r
atio
of
the
bo
ok
valu
e of
non
publ
ic
(pub
lic)
debt
to
the
bo
ok
valu
e of
tot
al
debt
pl
us
mar
ket
valu
e of
equ
ity,
in t
he
base
ye
ar.
‘Sig
nifi
cant
at
th
e 1%
le
vel.
‘Sig
nifi
cant
at
th
e 5%
le
vel.
$ign
ific
ant
at
the
10%
le
vel.
E. Ofek. Predistress Ieoeruge and firnl response to poor performance 23
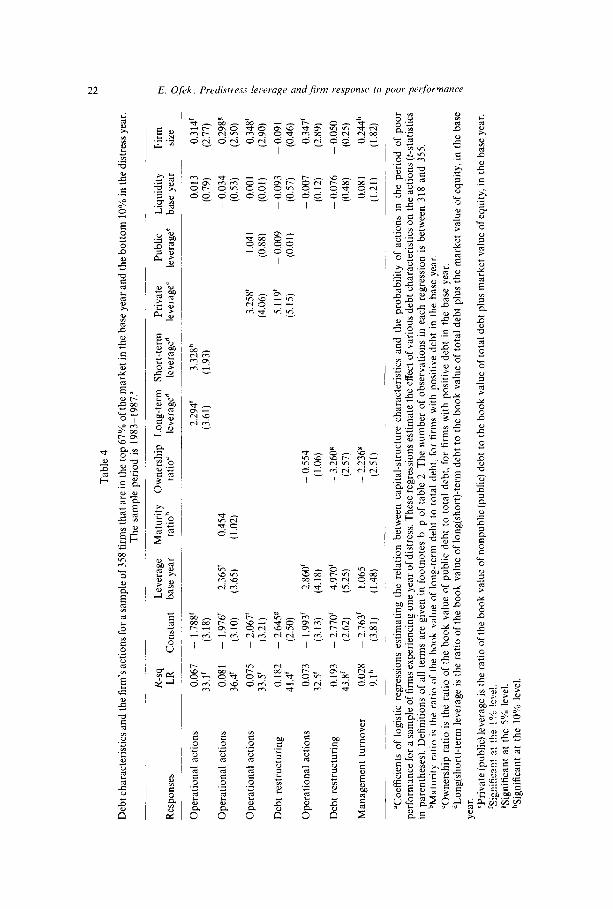
regression does not measure whether one maturity plays a greater role than the other). The second regression uses the ratio of long-term debt to total debt to test whether the maturity structure is related to operational actions. The results are positive but not significant, indicating that the relation between operational actions and leverage arises from all maturities. Although not re- ported in this table, the same pattern holds for the results of the individual actions.
Private debt is associated with intermediaries that monitor the firm, especially as it gets into trouble. Public debt is often held by many small investors who do not monitor the firm’s actions. Ninety-six firms in the sample have some public debt outstanding at the end of the base year, three have only public debt, and 322 have some private debt. Panel C in table 1 shows that, on average, 12% of the sample’s outstanding debt is public. The ratio of public debt to total debt ranges from 0% to 100%. The third regression in table 4 estimates the effect of public and private leverage on operational actions. The effect of private leverage is positive and significant at the 1% level whereas public leverage has a positive but insignificant relation to operational actions. This finding may indicate that private debt has a stronger effect on the firm’s actions than public debt, but may also reflect the low proportion of public debt in the sample firms’ obligations.
To further estimate the effect of debt ownership on the probability of opera- tional actions, the fourth regression in table 4 uses the ratio of public debt to total debt (ownership ratio) as an explanatory variable. A negative coefficient for this ratio implies that the probability of an operational action is reduced when a firm relies more heavily on public debt in its debt structure. Although the coefficient is indeed negative, it is not significantly different from zero, making the evidence inconclusive. This result may be caused by the heterogeneity of the private debt, which includes bank debt, privately-placed debt, capital leases, mortgages, industrial bonds, and other forms of debt.
The effect of debt ownership on most of the individual actions is similar to its effect on operational actions, although in some cases there appears to be a significant ownership effect. The probability of debt restructuring is positively and significantly related to private leverage, but is not related to public leverage; in addition, firms with higher ratio of public debt to total debt are less likely to restructure their debt. This result supports the argument that public debt is harder to negotiate, consistent with the results reported by Gilson, John, and Lang (1990).
Management replacement is also significantly related to the debt ownership ratio. The lower the proportion of public debt, the higher is the probability of management replacement. This finding is consistent with the argument that a management change results from active monitoring by debtholders, since private debtholders are likely to be more vigilant than holders of public debt.
24 E. Qfek. Predislress leverage and,firm response to poor performance
5.2. Leverage and cash generation
The probability of asset restructuring in a poorly-performing firm increases with the firm’s leverage. One explanation is that firms are forced to sell assets or divest businesses to raise cash to meet debt payments. Such actions increase cash flow in the short term but may not be consistent with a long-term value- maximizing strategy because of possible liquidity costs associated with dis- tressed-assets sales. There are several types of asset restructuring, however, that cannot be used to immediately retire debt. Such actions include discontinuing or consolidating operations and closing plants or headquarters. These actions are often associated with large charges to earnings and may require a large cash outflow in the year in which they are taken. In the long run, however, such actions reduce costs and the outflow of funds, and thus increase the cash available to repay debt. A positive relation between leverage and actions that increase only long-term cash flow indicates a long-run value-maximizing strat- egy induced by the existence of debt.
To test whether capital structure is related differently to the different types of
asset restructuring, two binary variables are introduced. The first equals one if
the restructuring generates immediate cash inflow; the second equals one if the
restructuring does not generate immediate cash flow. Logit regressions incor- porating the new dependent variables (the first two regressions in table 5) show
that leverage has a positive efSect on both types of restructuring, significant at the
1% level.
The positive relation between predistress leverage and cash-generating ac- tions is consistent with free cash flow models that use debt-service obligations to reduce overinvestment. But the positive relation between predistress leverage and operational actions that do not generate immediate cash implies that short-term debt service is not the only motive behind the firm’s actions. Both types of actions, those that generate cash and those that do not, are consistent with models that highlight debtholder monitoring triggered by default.
The third regression in table 5 delves further into the relation between
capital structure and operational actions that do not generate immediate cash. It uses a binary variable that equals one if the firm takes any operational
action that does not generate short-term cash inflow. Such actions, which include laying off employees and making management changes as well as discontinuing or restructuring operations, are not subject to the liquidity cost associated with a distressed-asset sale. The regression results reinforce the claim that the relation between leverage and operational actions is not solely the result of pressure to sell assets and immediately repay debt, and that debt obligations encourage firms to take actions that reduce cost and increase long-term cash flow. Leverage is positively and significantly related to the probability of operational actions that do not generate current cash inflow.
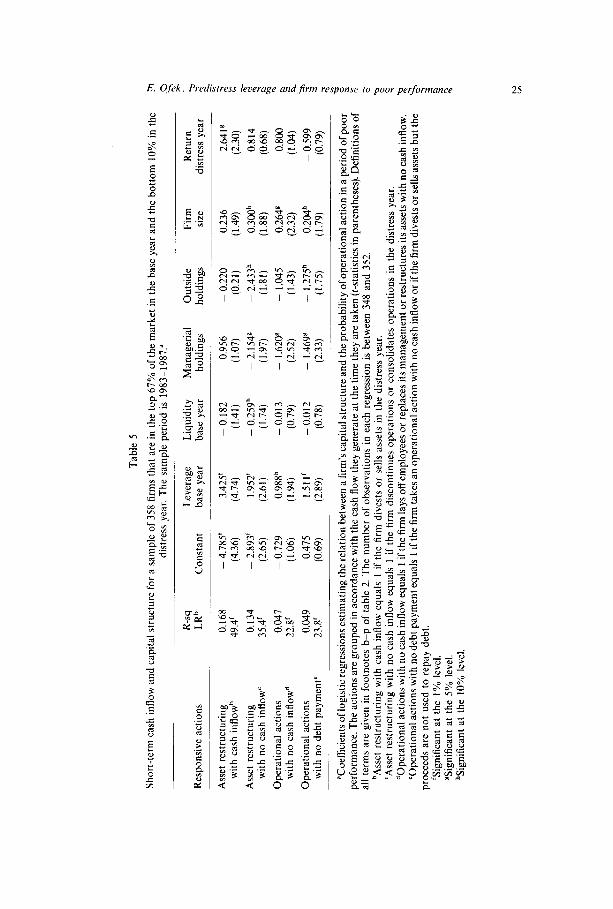
Tab
le
5
Shor
t-te
rm
cash
in
flow
an
d ca
pita
l st
ruct
ure
for
a sa
mpl
e of
358
fir
ms
that
ar
e in
the
to
p 67
%
of t
he
mar
ket
in t
he
base
ye
ar
and
the
botto
m
10%
in
the
h
dist
ress
ye
ar.
The
sa
mpl
e pe
riod
is
19
83-1
987.
” .o
2 R
-sq
Lev
erag
e L
iqui
dity
M
anag
eria
l O
utsi
de
Firm
R
espo
nsiv
e ac
tions
R
etur
n -%
L
Rb
Con
stan
t ba
se
year
ba
se
year
ho
ldin
gs
hold
ings
si
ze
dist
ress
ye
ar
Z
B
Ass
et
rest
ruct
urin
g 0.
168
- 4.
785’
3.
425’
-
0.18
2 0.
956
- 0.
220
0.23
6 :
2.64
1g
with
ca
sh
infl
owb
49.4
’ (4
.36)
(4
.74)
(1
.41)
(1
.07)
(0
.21)
(1
.49)
(2
.30)
2
Ass
et
rest
ruct
urin
g 0.
134
- 2.
893’
1.
952’
-
0.25
9”
- 2.
1548
-
2.43
3”
0.30
0h
0.81
4 6
with
no
ca
sh
infl
ow’
35.4
’ (2
.65)
(2
.61)
(1
.74)
(1
.97)
(1
.81)
(1
.88)
(0
.68)
2
Ope
ratio
nal
actio
ns
0.04
7 -
0.72
9 0.
988”
-
0.01
3 -
1.62
0g
- 1.
045
0.26
48
- 0.
800
; w
ith
no
cash
in
flow
d 22
.8’
(1.0
6)
(1.9
4)
(0.7
9)
(2.5
2)
(1.4
3)
(2.3
2)
(1.0
4)
2
Ope
ratio
nal
actio
ns
0.04
9 ~
0.47
5 1.
511’
-
0.01
2 -
1.46
9g
- 1.
275”
0.
204”
-
0.59
9 w
ith
no
debt
pa
ymen
t’
23.8
’ (0
.69)
(2
.89)
(0
.78)
(2
.33)
(1
.75)
(1
.79)
$
(0.7
9)
2
“Coe
ffic
ient
s of
log
istic
re
gres
sion
s es
timat
ing
the
rela
tion
betw
een
a fi
rm’s
cap
ital
stru
ctur
e an
d th
e pr
obab
ility
of
ope
ratio
nal
actio
n in
a p
erio
d of
poo
r 8 B
perf
orm
ance
. T
he
actio
ns
are
grou
ped
in a
ccor
danc
e w
ith
the
cash
fl
ow
they
ge
nera
te
at t
he t
ime
they
ar
e ta
ken
(r-s
tatis
tics
in p
aren
thes
es).
D
efin
ition
s of
P
all
term
s ar
e gi
ven
in f
ootn
otes
bb
p of
tab
le
2. T
he
num
ber
of o
bser
vatio
ns
in e
ach
regr
essi
on
is b
etw
een
348
and
352.
‘A
sset
re
stru
ctur
ing
with
ca
sh
infl
ow
equa
ls
1 if
the
fi
rm
dive
sts
or
sells
ass
ets
in t
he
dist
ress
ye
ar.
&.
B
‘Ass
et
rest
ruct
urin
g w
ith
no
cash
in
flow
eq
uals
1
if t
he
firm
di
scon
tinue
s op
erat
ions
or
co
nsol
idat
es
oper
atio
ns
in t
he
dist
ress
ye
ar.
9 dO
pera
tiona
l ac
tions
w
ith
no c
ash
infl
ow
equa
ls
1 if
the
firm
la
ys
off
empl
oyee
s or
rep
lace
s its
man
agem
ent
or r
estr
uctu
res
its a
sset
s w
ith
no c
ash
infl
ow.
$
‘Ope
ratio
nal
actio
ns
with
no
deb
t pa
ymen
t eq
uals
1
if t
he f
irm
ta
kes
an o
pera
tiona
l ac
tion
with
no
cas
h in
flow
or
if
the
firm
div
ests
or
sel
ls a
sset
s bu
t th
e 3
proc
eeds
ar
e no
t us
ed
to
repa
y de
bt.
‘Sig
nifi
cant
at
th
e 1%
le
vel.
2 $ gS
igni
fica
nt
at
the
5%
leve
l. “S
igni
fica
nt
at
the
10%
le
vel.
a
26 E. Ofek, Predisrress leverage andji’rm response IO poor performance
6. Management holdings, equity holdings, and firm actions
6.1. The eflect of management holdings
Fama and Jensen (1983) argue that the market for corporate control, which disciplines and replaces inferior managers, has less effect on firms with large management holdings. It is harder to dislodge poorly-performing managers in these firms and to discipline them when they grant themselves high salaries and other personal benefits that reduce the value of the firm. This entrenchment hypothesis predicts that managers with large holdings in the firm are less likely to be replaced. Managerial entrenchment may come in other forms, however. Jensen (1986) argues that free cash flow may lead managers to negative NPV investments, and Stulz (1990) assumes that man- agers value investments because their perquisites increase with investments, even in negative-NPV projects. These arguments imply that entrenched man- agement is likely to avoid actions that reduce the firm’s investment, i.e., changes that reduce the assets, employees, or market share under managerial control.
The negative relation (signi$cant at the 5% level) between managerial holdings and operational actions with no immediate cash pow, presented in table 5, supports the entrenchment hypothesis. It implies that managers avoid taking actions such as closing plants, discontinuing operations, laying off employees, and replacing executives. It is possible, however, that this relation results mostly from the negative relation between managerial holdings and managerial turnover. The second regression in table 5 shows that the significantly negative relation between managerial holdings and restructuring that does not generate immediate cash holds even when managerial turnover is excluded. Managerial holdings have no effect on cash-generating restructuring, perhaps because such restructuring does not reduce free cash flow, and the cash received could be available for future investments.
6.2. Equity holdings and the.firm’s actions
The size of outside stockholding does not significantly increase the probabil- ity of any of the actions shown in table 2. In fact, the presence of a large nonmanagerial investor reduces the probability that an operational action will be taken. This result is surprising because large equityholders are expected to play an important role in monitoring the firm’s actions. Conceivably, different types of outside stockholders differ in their willingness to monitor the firm when bad news about the firm’s performance emerges. To test this possibility, vari- ables are created representing seven types of investors: an individual, a corpora- tion that is not controlled by the firm’s management, a corporation friendly to
E. Qfek. Predistresr Iecerqe ond,firm response to poor pe(formunce 21
management,4 a mutual fund, pension fund, or other investment management firm, a bank or an insurance company, an employee trust, and a group of related investors. A variable takes the value of zero if no outside stockholder of that type holds 5% or more of the firm’s equity. If such an investor exists, the variable equals the holdings (in percent) of the largest investor of that type.
Table 6 reports the results of the logit regressions for the different types of stockholders. No type except an investment management firm has a significant effect on the probability of an operational action in general or any of the individual actions, indicating that the firm’s actions while in distress are unre- lated to the type of outside stockholder. The only significant relations are negative relations between ownership by investment management firms and the probability of operational actions and of management turnover, consistent with Pound’s (1988) finding that institutional investors tend to support management in proxy contests.
Another possible explanation for the lack of evidence of stockholder monitor- ing is that it is not monotonic in the percentage of the stock held by investors; rather, the effect of stockholding varies across different ranges. However, a piecewise logit regression that tests for this nonmonotonic effect finds no significant relation between the size of the largest nonmanagerial stockholder and any of the responsive actions at all ranges of outside stock ownership. (These results are not reported in this paper.)
One reason for the apparent lack of monitoring may be that even large nonmanagerial stockholders cannot control the firm’s actions. In the sample, the median share of firm equity held by an outside investor is 6%, whereas the median share held by management is 22%. Outside stockholders may simply be too small to dictate to the incumbent management.
7. Conclusion
This paper examines the relation between a firm’s capital structure and its response to short-term financial distress. A sample of 358 firms with one year of normal performance followed by a year of extreme poor performance is used to conduct the tests. The results show that highly-leveraged firms are more likely than their less-leveraged counterparts to respond operationally to short-term distress. Such firms are also more likely to take individual actions such as restructuring assets and laying off employees when performance deteriorates. In
4A friendly corporation is one in which the management of the sample firm holds a substantial part of the equity, or a corporation in which one of the top managers is a top manager in the sample firm. Since sample firms do not report the stockholding of such corporations as part of the management holdings in their proxy statements. they are not so identified in this paper. However, holdings by corporations in which the firm’s management holds more than 50% of the equity are always considered management holdings.
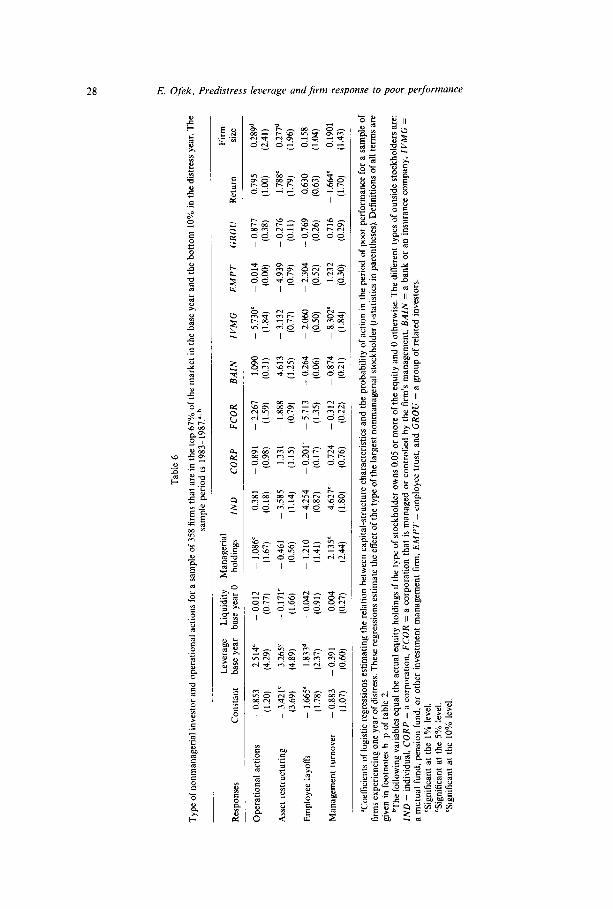
Tab
le
6
Typ
e of
non
man
ager
ial
inve
stor
an
d op
erat
iona
l ac
tions
fo
r a
sam
ple
of 3
58 f
irm
s th
at
are
in t
he t
op
67%
of
the
mar
ket
in t
he b
ase
year
an
d th
e bo
ttom
10
% i
n th
e di
stre
ss
year
. T
he
sam
ple
peri
od
is
1983
- 19
87.“
. b
LE
!VeK
tge
Liq
uidi
ty
Man
ager
ial
Res
pons
es
cons
tant
ba
se
year
ba
se
year
0
hold
ings
Ope
ratio
nal
actio
ns
- 0.
853
2.51
4 -
0.01
2 -
1.08
6’
( 1.2
0)
(4.2
9)
(0.7
7)
(1.6
7)
Ass
et
rest
ruct
urin
g -
3.42
1’
3.26
5’
- 0.
171’
-
0.46
1 (3
.69)
(4
.89)
(1
.66)
(0
.56)
Em
ploy
ee
layo
ffs
- 1.
665’
1.
833d
-
0.04
2 ~
1.21
0 (1
.78)
(2
.37)
(0
.91)
(1
.41)
Man
agem
ent
turn
over
-
0.88
3 -
0.39
1 O
X04
2.
135*
(1
.07)
(0
.60)
(0
.27)
(2
.44)
IND
0.38
1 (0
.18)
- 3.
585
(1.1
4)
- 4.
254
(0.8
2)
4.62
7’
(1.8
0)
CO
RP
- 0.
891
(0.9
8)
- 1.
331
(1.1
5)
- 0.
201’
(0
.17)
0.72
4 (0
.76)
FCO
R
- 2.
267
(1.5
9)
- 1.
888
(0.7
9)
- 5.
713
(1.3
5)
- 0.
312
(0.2
2)
BA
IN
1.09
0 (0
.3 I)
4.61
3 (1
.25)
- 0.
264
(0.0
6)
~ 0.
874
(0.2
1)
IVM
G
- 5.
730’
(1
.84)
- 3.
132
(0.7
7)
- 2.
060
(0.5
0)
- 8.
302’
(1
.84)
EM
PT
- 0.
014
(0.0
0)
- 4.
939
(0.7
9)
~ 2.
304
(0.5
2)
1.23
2 (0
.30)
CROCI
- 0.
877
(0.3
8)
- 0.
276
(0.1
I)
- 0.
769
(0.2
6)
0.71
6 (0
.29)
Ret
urn
~ 0.
795
(1.0
0)
1.78
8’
(1.7
9)
0.63
0 (0
.63)
- 1.
664’
(1
.70)
Firm
si
ze
0.28
9d
(2.4
1)
0.27
7d
(1.9
6)
0.15
8
(1.0
4)
0.19
01
(1.4
3)
“Coe
ffic
ient
s of
log
istic
re
gres
sion
s es
timat
ing
the
rela
tion
betw
een
capi
tal-
stru
ctur
e ch
arac
teri
stic
s an
d th
e pr
obab
ility
of
act
ion
in t
he p
erio
d of
poo
r pe
rfor
man
ce
for
a sa
mpl
e of
fi
rms
expe
rien
cing
on
e ye
ar o
f di
stre
ss.
The
se
regr
essi
ons
estim
ate
the
effe
ct o
f th
e ty
pe o
f th
e la
rges
t no
nman
ager
ial
stoc
khol
der
(t-s
tatis
tics
in p
aren
thes
es).
D
efin
ition
s of
all
term
s ar
e gi
ven
in
foot
note
s b
p of
tab
le
2.
bThe
fol
low
ing
vari
able
s eq
ual
the
actu
al
equi
ty
hold
ings
if
the
type
of
sto
ckho
lder
ow
ns
0.05
or
mor
e of
the
equ
ity
and
0 ot
herw
ise.
T
he
diff
eren
t ty
pes
of o
utsi
de
stoc
khol
ders
ar
e:
IND
=
ind
ivid
ual,
CO
RP
=
a c
orpo
rati
on,
FCO
R
= a
cor
pora
tion
that
is
man
aged
or
con
trol
led
by t
he
firm
’s
man
agem
ent,
BA
IN
= a
ban
k or
an
insu
ranc
e co
mpa
ny,
IVM
G
=
a m
utua
l fu
nd,
pens
ion
fund
, or
oth
er
inve
stm
ent
man
agem
ent
firm
, E
MP
T
= e
mpl
oyee
tr
ust,
and
GR
OU
=
a g
roup
of
rel
ated
in
vest
ors.
‘S
igni
fica
nt
at t
he
1%
leve
l. “S
igni
fica
nt
at t
he
5%
leve
l. ‘S
igni
fica
nt
at t
he
10%
le
vel.

E. Qfek. Predisrress leverage andfirm response to poor performance 29
addition to responding quickly operationally, highly-leveraged firms are more likely to respond financially, through dividend cuts, debt restructuring, and bankruptcy.
There are several differences in a firm’s response to short-term and long-term distress. Higher leverage significantly increases the probability of debt restruc- turing following a short period of distress, whereas Gilson, John, and Lang (1990) find no relation between leverage and debt restructuring following a long period of distress. Of the sample firms in financial distress, only 10% file for bankruptcy in their first year of poor performance. By comparison, other studies report that 53% of firms that perform poorly for at least three years file for bankruptcy protection. Another difference in a firm’s response to short- and long-term distress is the effect of leverage on management turnover; in the first year of distress, leverage has no effect on management turnover, whereas Gilson (1989) reports a significant increase in the probability of management turnover in financially distressed firms following a long period of distress.
The larger the share of firm equity held by management, the lower is the probability that an operational action will be taken (especially when the action does not generate cash inflow). This result is consistent with the management entrenchment arguments of Jensen (1986) and Stulz (1990), and highlights situations in which larger management holdings can actually discourage value- maximizing behavior. Overall, the paper’s finding that highly-leveraged firms react faster to a decline in performance than do less-leveraged companies is consistent with Jensen (1989), and suggests that a choice of high leverage during normal operations subjects the firm to the discipline that debt provides. High leverage appears to induce a firm to respond operationally and financially to adversity after a short period of poor performance, helping to avoid lengthy periods of losses with no response. The existence of debt in the capital structure may thus help to preserve the firm’s going-concern value.
References
Aharoni, Joseph and Itzhak Swary, 1980, Quarterly dividend and earnings announcements and stockholders’ return: An empirical analysis, Journal of Finance 35, l-12.
Baldwin, Carliss, Scott Mason, and JH Hughes, 1983, The case of Massey Ferguson - 1980, Case study (Harvard Business School, Cambridge, MA).
Clark, Kent and Eli Ofek, 1992, Mergers as a means of restructuring troubled firms: An empirical investigation, Working paper (New York University, New York, NY).
DeAngelo, Harry and Linda DeAngelo, 1990, Dividend policy and financial distress: An empirical investigation of troubled NYSE firms, Journal of Finance 45, 141551431.
Fama, Eugene and Michael Jensen, 1983, Separation of ownership and control, Journal of Law and Economics 26, 301-349.
Gilson, Stuart, 1989, Management turnover and financial distress, Journal of Financial Economics 25, 241-262.
Gilson, Stuart, Kose John, and Larry Lang, 1990, Troubled debt restructuring: An empirical study of private reorganization of firms in default, Journal of Financial Economics 27, 315-354.
J.F.E.-B
30 E. Ofek, Predistress leverage and,firm response to poor performance
Harris, Milton and Artur Raviv, 1990, Capital structure and the informational role of debt, Journal of Finance 45, 2977356.
Hoshi, Takeo, Anil Kashyap, and David Scharfstein, 1990, The role of banks in reducing the cost of financial distress in Japan, Journal of Financial Economics 27, 67788.
Jensen, Michael, 1986, Agency costs of free cash flow, corporate finance, and takeovers, American Economics Review 76, 323-329.
Jensen, Michael and Jerold Warner, 1988, Power and governance in corporations, Journal of Financial Economics 20, 3-24.
Jensen, Michael, 1989, Active investors, LBO’s and privatization of bankruptcy, Journal of Applied Corporate Finance 2, 35544.
John, Kose, Larry Lang, and Jeff Netter, 1992, Voluntary restructuring of large firms in response to performance decline, Journal of Finance 47, 891-918.
Merck, Randall. Andrei Shleifer, and Robert Vishny, 1989, Alternative mechanisms for corporate control, American Economic Review 79, 8422852.
Ofek, Eli, 1991, Monitoring and the firm’s capital structure: A theoretical and empirical investiga- tion, Unpublished dissertation (University of Chicago, Chicago, IL).
Pound, John, 1988, Proxy contests and the efficiency of shareholder oversight, Journal of Financial Economics 20, 237-265.
Smith. Clifford and Jerold Warner, 1979, On financial contracting: An analysis of bond covenants, Journal of Financial Economics 7, 117-161.
Stulz, Rene, 1990, Managerial discretion and optimal financing policies, Journal of Financial Economics 26, 3-27.
Warner, Jerold, Ross Watts, and Karen Wruck, 1988, Stock prices and top management changes, Journal of Financial Economics 20, 461-492.
Weisbach, Michael, 1988, Outside directors and CEO turnover. Journal of Financial Economics 20, 43 l-460.
Wruck, Karen, 1990. Financial distress, reorganization, and organizational efficiency, Journal of Financial Economics 27. 419-446.