of Vertical Lift Lock Gatesdtic.mil/dtic/tr/fulltext/u2/a281491.pdf · of Vertical Lift Lock Gates...
83
Technical Report REMR-CS-44 June 1994 US Army Corps of Engieers AD-A281 491 Waterways Experiment Station Repair, Evaluation, Maintenance, and Rehabilitation Research Program Field Testing and Structural Analysis of Vertical Lift Lock Gates by Brett C. Commander, Jeff X. Schulz, George G. Goble Bridge Diagnostics, Inc. Cameron P. Chasten DTIC ELECTE '•:'•.• JUL 12 19941 •': - - - - Approved For Public Release; Distribution Is Unlimited v.... 94-2 1151 iii"jill 94 7 11 '165 1 Propad" for Headquarters, U.S. Army Corps of Engineers
Transcript of of Vertical Lift Lock Gatesdtic.mil/dtic/tr/fulltext/u2/a281491.pdf · of Vertical Lift Lock Gates...
Technical Report REMR-CS-44June 1994
US Army Corpsof Engieers AD-A281 491Waterways ExperimentStation
Repair, Evaluation, Maintenance, and Rehabilitation Research Program
Field Testing and Structural Analysisof Vertical Lift Lock Gates
by Brett C. Commander, Jeff X. Schulz, George G. GobleBridge Diagnostics, Inc.
Cameron P. Chasten
DTICELECTE'•:'•.• JUL 12 19941
•': - - - -
Approved For Public Release; Distribution Is Unlimited
v.... 94-2 1151 iii"jill
94 7 11 '165 1Propad" for Headquarters, U.S. Army Corps of Engineers
The following two letters used as part of the number designating technical reports of research publishedunder the Repair, Evaluation, Maintenance, and rehabilitation (REMR) Research Program identify theproblem area under which the report was prepared:
Problem Area Problem Area
CS Concrete and Steel Structures EM Electrical and MechanicalGT Geotechnical El Environmental ImpactsHY Hydraulics OM Operations ManagementCO Coastal
The contents of this report are not to be used for advertising,publication, or promotional purposes. Citation of tradenames does not constitute an official endorsement or approval ofthe use of such commercial products.
. * PRINTED ON RECYCLED PAPER
Repair, Evaluation, Maintenance, and Technical Report REMR-CS-44Rehabilitation Research Program June 1994
Field Testing and Structural Analysisof Vertical Lift Lock Gates
by Brett C. Commander, Jeff X. Schulz, George G. Goble
Bridge Diagnostics, Inc.5398 Manhattan Circle, Suite 280Boulder, CO 80303
Cameron P. Chasten Accesion FOR
U.S. Army Corps of Engineers NTIS CRA&M
Waterways Experiment Station U TannouBced 03909 Halls Ferry Road justafiticon ..............Vicksburg, MS 39180-6199
Dist. ibution I
Availability CodesAvail and I or
Dist Special
Final report
Approved for public release; distribution is unlimited
Prepared for U.S. Army Corps of Engineers
Washington, DC 20314-1000
Under Work Unit 32641

US Army Corpsof Engn.•oer
Waterways E xperiment Sa" DatN
Fta iela l
e f AmyI
StatesArmay. Corpseofmengtaionees iltl.oU..nAmyingPbiionee Wateray
Reaielitastiong Rsarch Ptrogtram. V.alTitle Vof Serie:Tehical report gte /b
(U.S.nArmy.nierWtrasEprmetSain ERC-
TA7p.:i; Wm nR -- (;REMR
swams ilorahcrfeecs
1.~ ~ ~~' Sliegae - etng .Hdrui gts--Eauti~fon.3. Stuctual aalyss (Eginering I. ommader, Bret C. I. Unite
Staes Army &op AMY BOHMr.I.US rm nier aewy
(..AyEnierWaterways Experiment Station ) ;aaoigi-ulcto REM-CSa
TA7 W34 :nol;28c.-Tcnclrpr;REMR-CS-44)
Contents
Preface ........................................... ix
l-Introduction ................................ I
2- Field Testing ............................... 3
Loading and Instrumentation ...................... 3Locks 27 Lift Gate Test Procedures ..................... 4
Set I tests (SETI-27) ........................ 5Set 2 tests (SET2-27) ........................ I IField notes .............................. 14Lock 27 field test conclusions ..................... 17
Locks and Dam 26 Lift Gate Test Procedures .............. 17Set I test (SETI -26): Test 261A chamber drop .......... 19Set 2 tests (SET2-26) ........................ 20Field notes .............................. 21
3-Structural Analysis and Data Comparison ................. 29
General Modeling Considerations ..................... 29Analytical models .......................... 30Structural models .......................... 31
Data Comparison ............................. 31Absolute error ............................ 32Percent error ............................. 32Correlation factor .......................... 33
Locks 27 Lift Gate Modeling and Analysis ................ 33Model discretizaton ......................... 34Loading and boundary conditions ...... ............ 35Analysis and data comparison ..................... 36Conclusions and recommendations .................. 38
Locks and Dam 26 Lift Gate Modeling and Analysis ......... 39FE model ................................. 39Loading and boundary conditions ................... 40Analysis and data comparison ..................... 40Conclusions ............................. 43
4--General Conclusions ........................... 46
III

Experimental Studies .......................... 47Setup ................................. 47Additional test position and instrumentation ............. 47
Analysis ....................................... 48
References ........................................ 49
Appendix A-Vertical Load Test Experimental Data ........... Al
Appendix B-Head Differential Test Data ................... B I
Locks 27 Strain Data (Test 272B; SET2-27) ............... B2Locks 27 Strain Data (Test 271C; SETI-27) ............... B6Locks and Dam 26 Strain Data (Test 262B; SET2-26) ....... B 16
List of Figures
Figure 1. Two waterproof strain transducers mounted on downstreamgirder flange ................ .......... 4
Figure 2. Locks 27 vertical lift gate - downstream face of upstream
gate leaf ............................. 5
Figure 3. Locks 27 gate leaf configuration (elevations) ......... 6
Figure 4. Transducer locations: Locks 27 - SETI-27 ........... 7
Figure 5. Transducer locations: Locks 27 SET1-27 - enlarged view 8
Figure 6. Transducer placement - SETI -27 (Transducers 22, 24, 27) 8
Figure 7. Transducer placement - SETI -27 (Transducrs It, 14, 19) 8
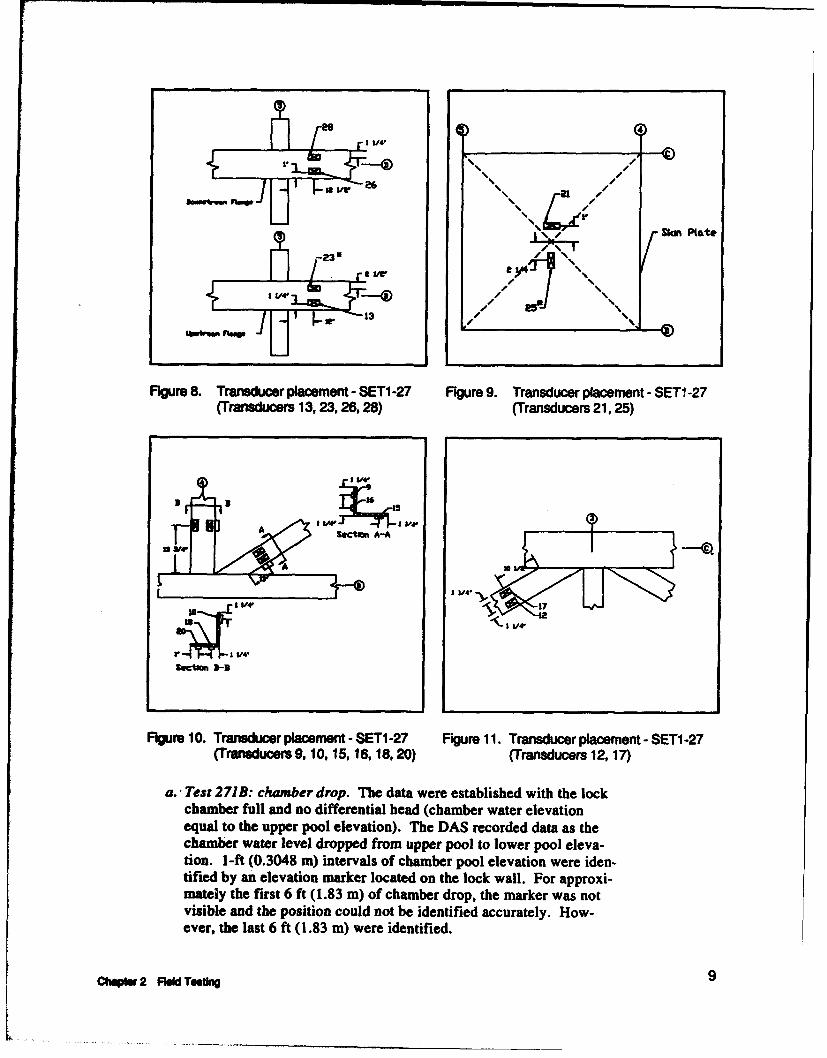
Figure 8. Transducer placement - SETI-27 (Transducers 13, 23,26,28) ............................. 9
Figure 9. Transducer placement - SETI-27 (Transducers 21, 25) . 9
Figure 10. Transducer placement - SETI-27 (Transducers 9, 10, 15,16,18,20) ........................... 9
Figure 11. Transducer placement - SETI -27 (Transducers 12, 17) 9
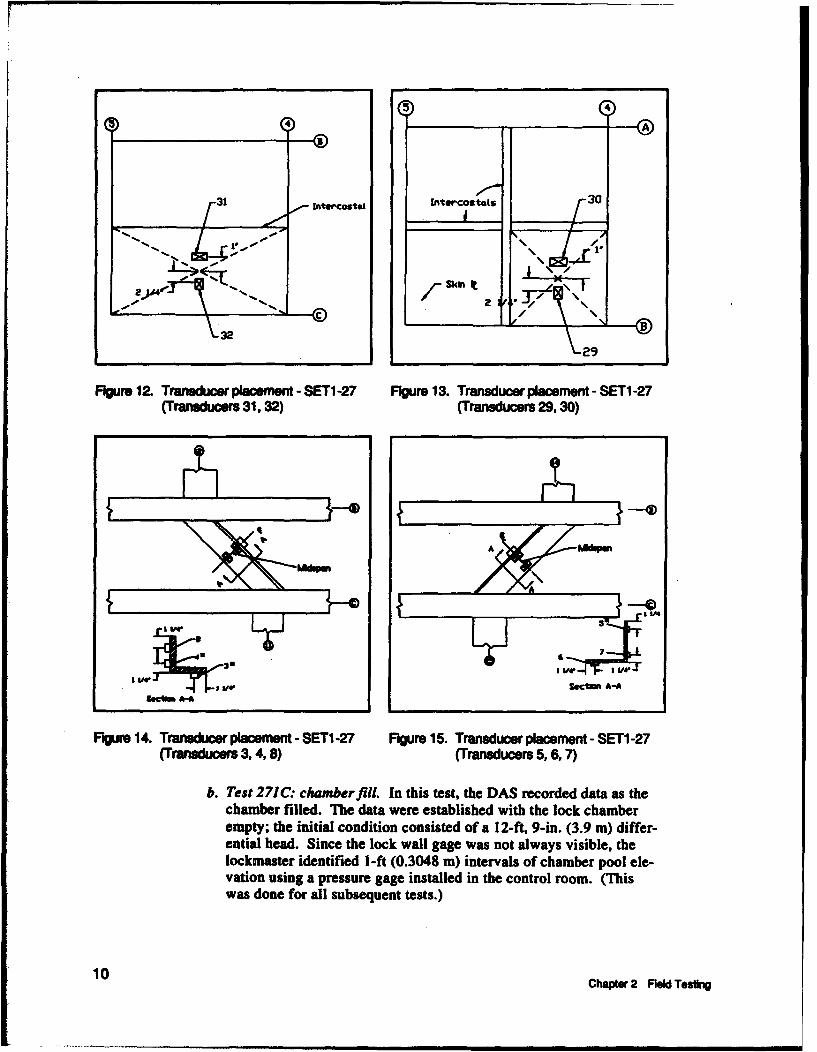
Figure 12. Transducer placement - SETI-27 (Transducers 31, 32) 10
Figure 13. Transducer placement - SET1-27 (Transducers 29, 30) 10
Figure 14. Transducer placement - SET1-27 (Transducers 3, 4, 8) 10
Figure 15. Transducer placement - SETI-27 (Transducers 5, 6, 7) 10
Figure 16. Transducer locations: Locks 27 SET2-27 ........... 11
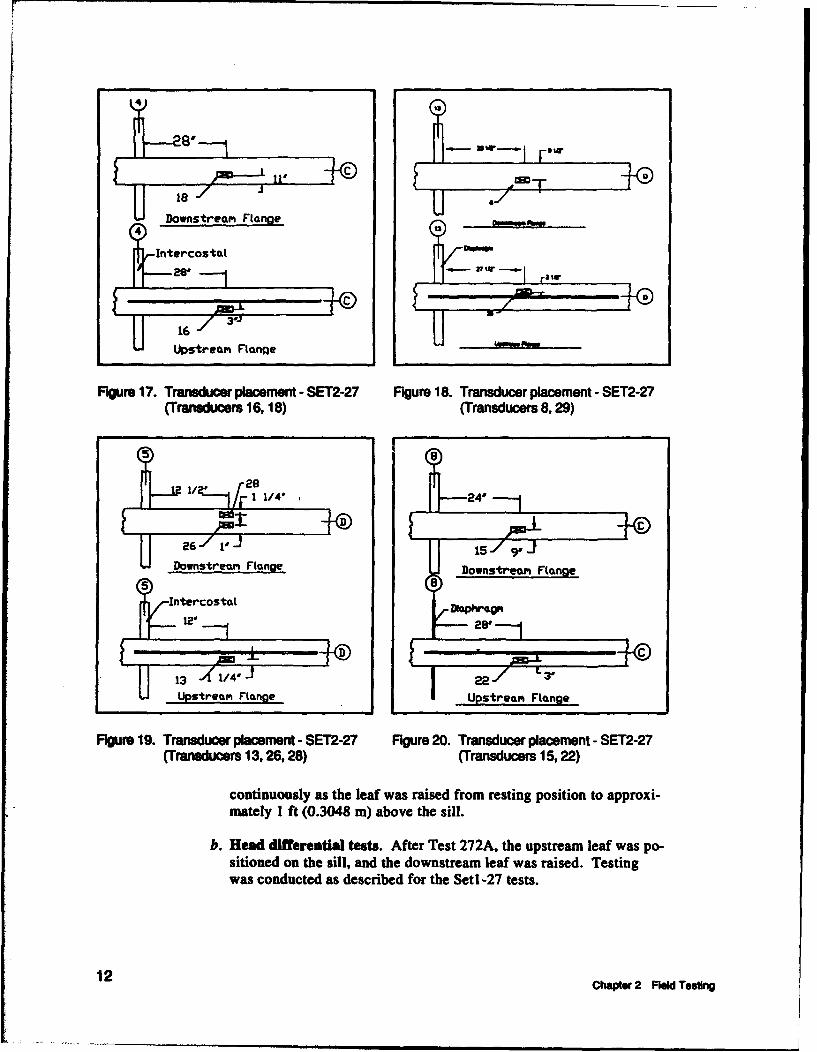
Figure 17. Transducer placement - SET2-27 (Transducers 16, 18) 12
Figure 18. Transducer placement - SET2-27 (Transducers 8, 29) . 12
IVI
Figure 19. Transducer placement - SET2-27 (Transducers 13, 26, 28) 12
Figure 20. Transducer placement - SET2-27 (Transducers 15, 22) . 12
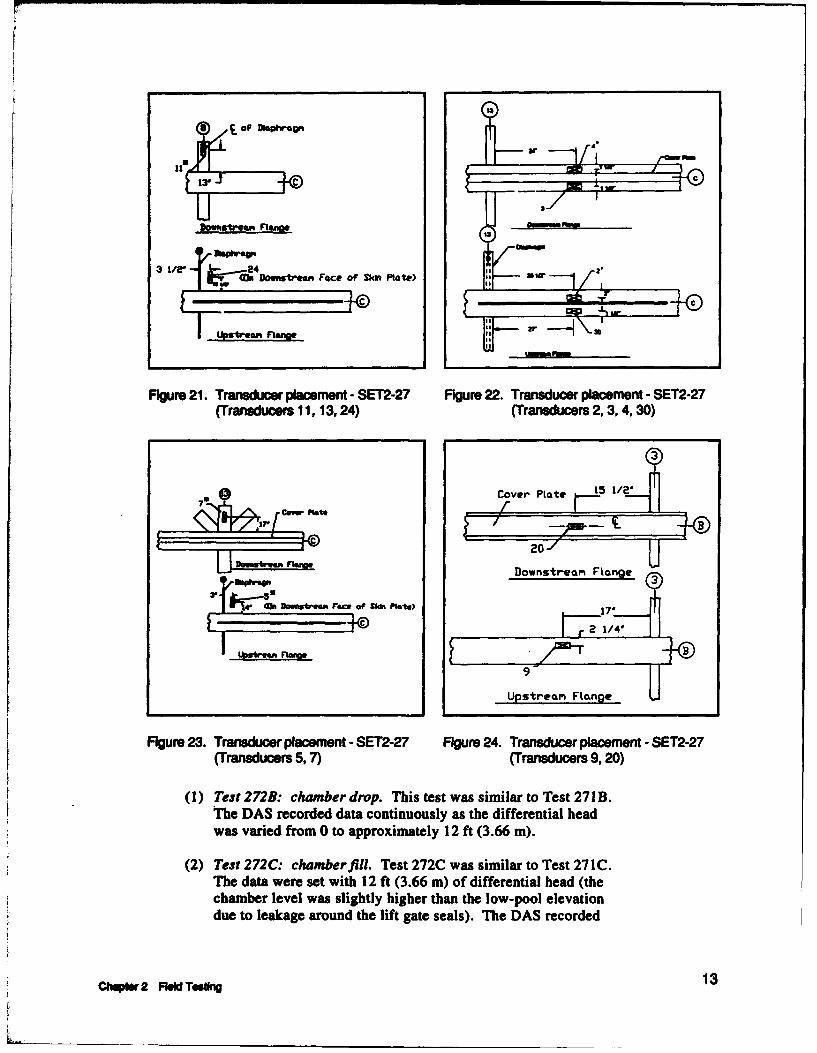
Figure 21. Transducer placement - SET2-27 (Transducers 11, 13, 24) 13
Figure 22. Transducer placement - SET2-27 (Transducers 2, 3, 4, 30) 13
Figure 23. Transducer placement - SET2-27 (Transducers 5, 7) . . . 13
Figure 24. Transducer placement - SET2-27 (Transducers 9, 20)... 13
Figure 25. Transducer placement - SET2-27 (Transducers 14, 19,21,27) ..................... ......... 14
Figure 26. Transducer placement - SET2-27 (Transducers 12, 17,25,31) .............................. 14
Figure 27. Transducer placement - SET2-27 (Transducers 23, 32) . . 14
Figure 28. Locks and Dam 26 vertical lift gate - downstream face ofmiddle leaf ........................... 18
Figure 29. Crack at girder flange-to-diaphragm flange connection . . 18
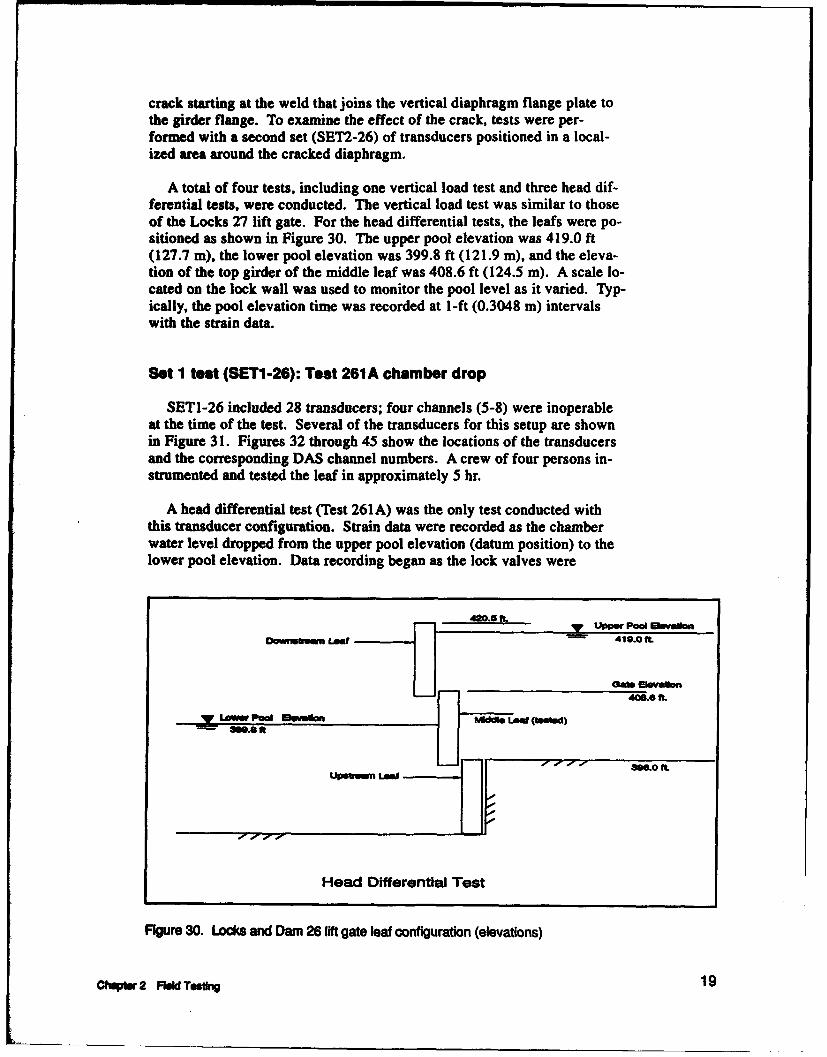
Figure 30. Locks and Dam 26 lift gate leaf configuration (elevations) 19
Figure 31. Transducers on Locks and Dam 26 lift gate .......... 20
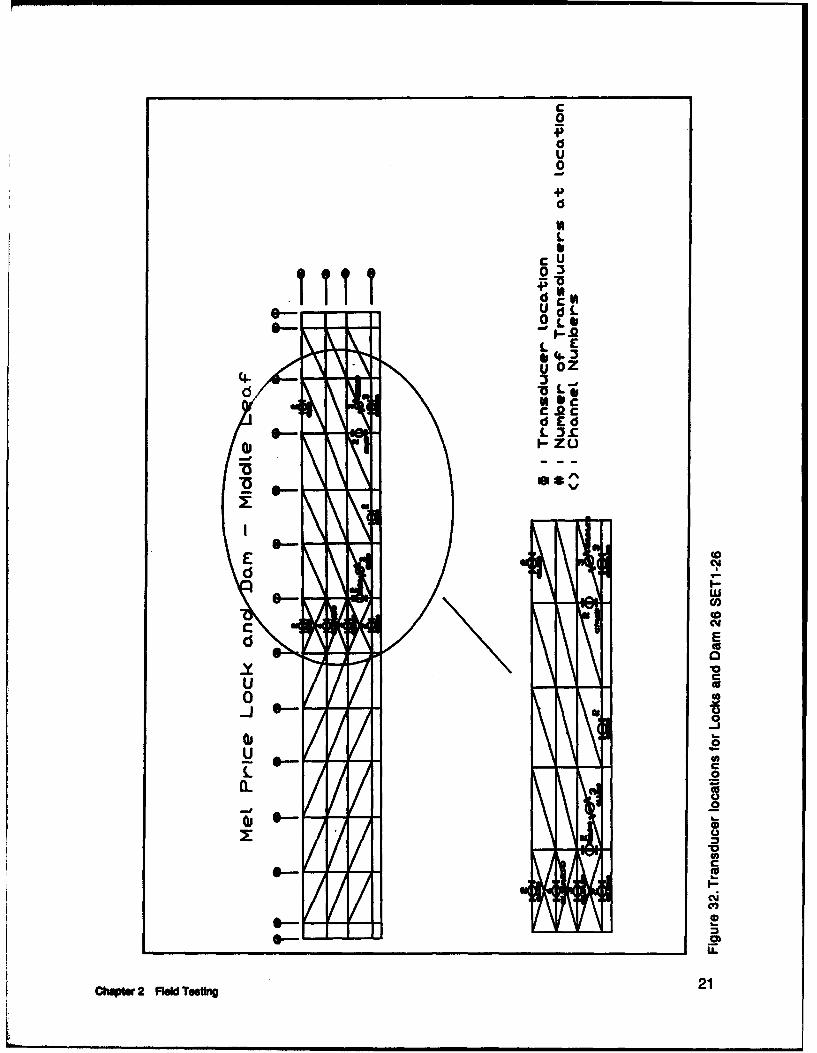
Figure 32. Transducer locations for Locks and Dam 26 SETI-26... 21
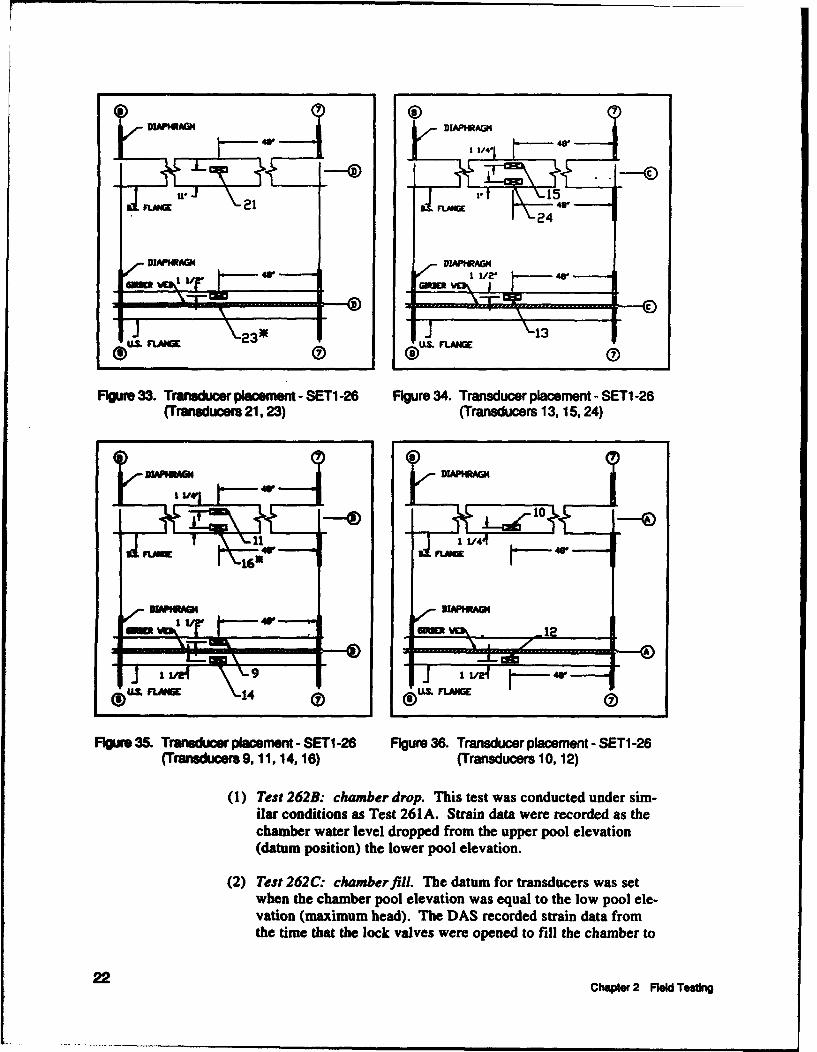
Figure 33. Transducer placement - SETI-26 (Transducers 21, 23) . . 22
Figure 34. Transducer placement - SETI-26 (Transducers 13, 15, 24) 22
Figure 35. Transducer placement - SETI -26 (Transducers 9, 11,14, 16) .............................. 22
Figure 36. Transducer placement - SETI-26 (Transducers 10, 12) . . 22
Figure 37. Transducer placement - SET1-26 (Transducers 1, 2) ... 23
Figure 38. Transducer placement - SETI-26 (Transducer 22) ..... 23
Figure 39. Transducer placement - SETI-26 (Transducer 3) ..... 23
Figure 40. Transducer placement - SETI-26 (Transducers 19, 20) . . 23
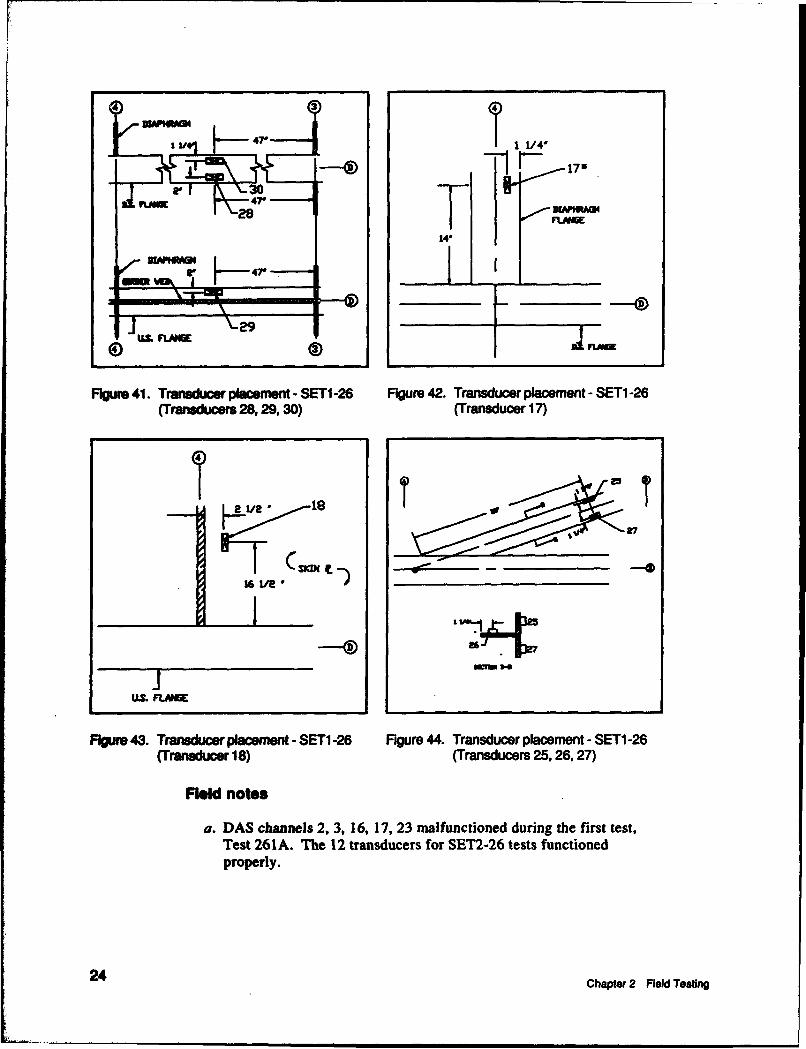
Figure 41. Transducer placement - SETI-26 (Transducers 28, 29, 30 24
Figure 42. Transducer placement - SETI -26 (Transducer 17) ..... 24
Figure 43. Transducer placement - SETI-26 (Transducer 18) ..... 24
Figure 44. Transducer placement - SETI -26 (Transducers 25, 26, 27) 24
Figure 45. Transducer placement - SETI-26 (Transducers 31, 32) . . 25
Figure 46. Transducer locations for Locks and Dam 26 SET2-26... 26
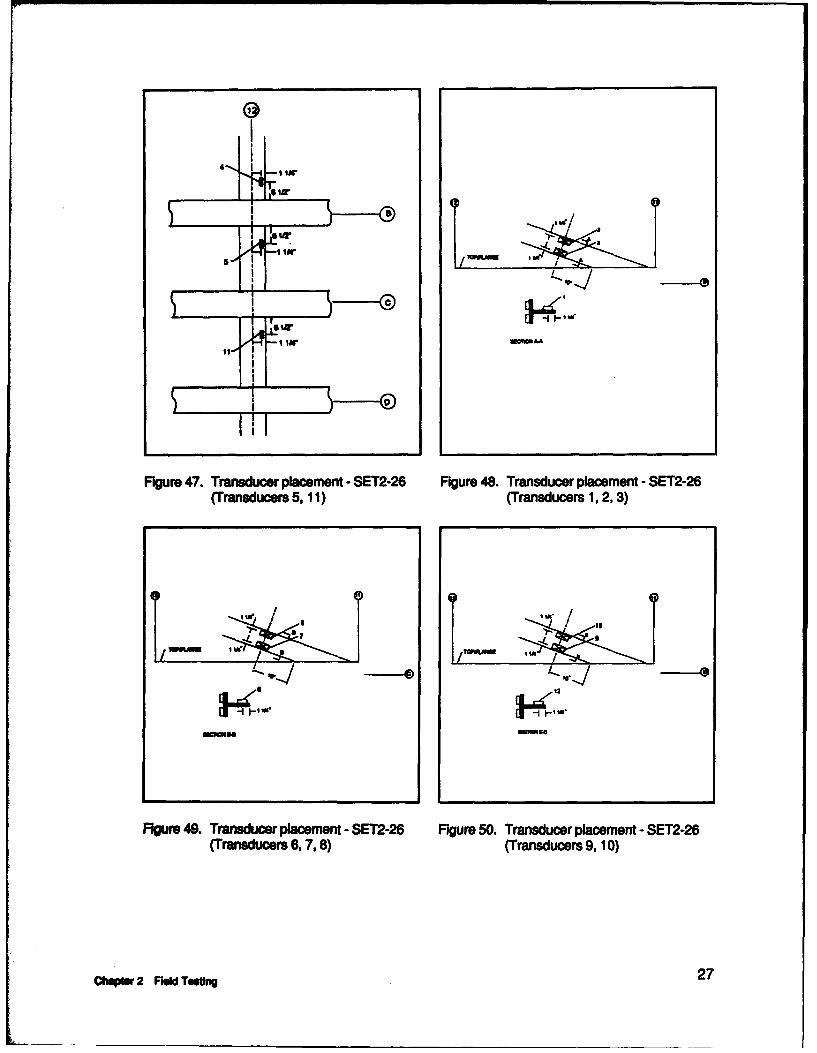
Figure 47. Transducer placement - SET2-26 (Transducers 5, 11)... 27
V
Figure 48. Transducer placement - SET2-26 (Transducers 1, 2, 3) 27
Figure 49. Transducer placement - SET2-26 (Transducers 6, 7, 8) 27
Figure 50. Transducer placement - SET2-26 (Transducers 9, 10) . 27
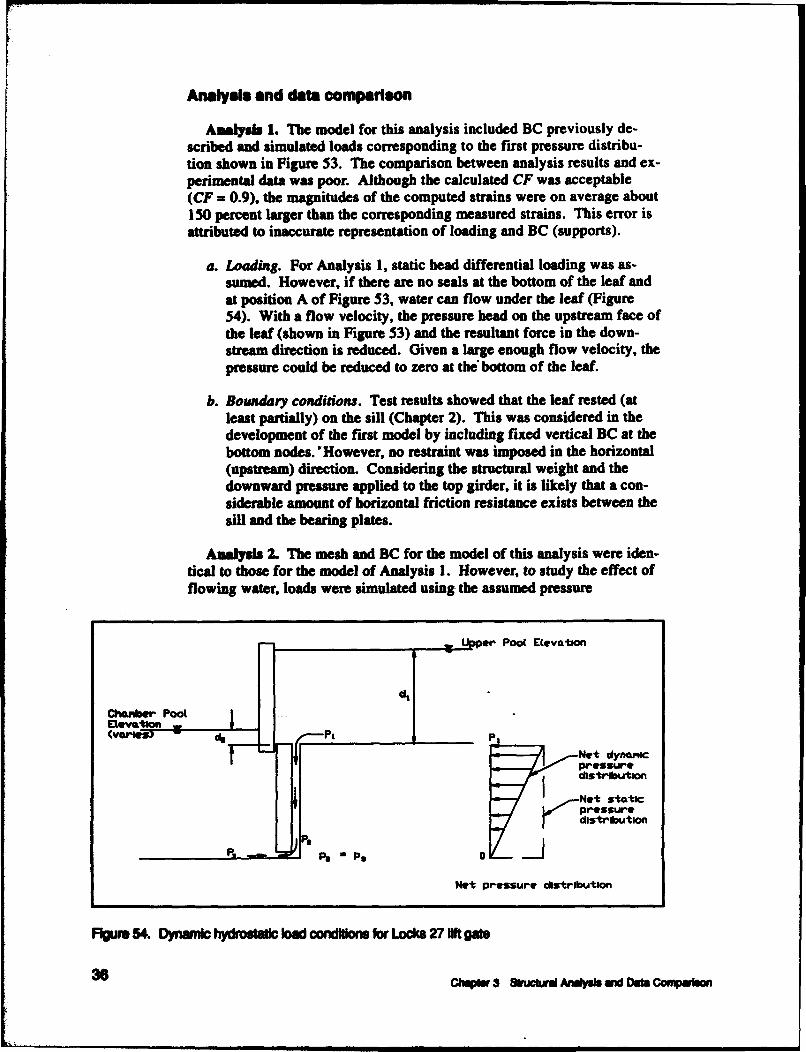
Figure 5 1. Plan view of finite element mesh for a horizontal girder -Locks 27 ............................ 34
Figure 52. Finite element mesh of Locks 27 lift gate (hidden linesremoved) ............................ 34
Figure 53. Static hydrostatic load conditions for Locks 27 lift gate 35
Figure 54. Dynamic hydrostatic load conditions for Locks 27 liftgate ............................... 36
Figure 55. Finite element mesh for Locks and Dam 26 lift gate -middle leaf ........................... 40
Figure 56. Hydrostatic loading applied for Locks and Dam 26analysis ............................. 41
Figure 57. Vertical load pressure as a function of head differential . 43
Figure 58. Locks and Dam 26 leaf shear deformation and diaphragmdeformation .......................... 45
Figure AI. Vertical load strain histories (SETI-27),Channels 22 and 27 ...................... A2
Figure A2. Vertical Load Strain Histories (SETl-27),Channels 11 and 19 ...................... A2
Figure A3. Vertical Load Strain Histories (SETI-27),Channels 13, 26, and 28 ................... A3
Figure A4. Vertical Load Strain Histories (SETI-27),Channels 10, 18, and 20 ................... A3
Figure AS. Vertical Load Strain Histories (SETl-27),Channels 9, 15, and 16 .................... A4
Figure A6. Vertical Load Strain Histories (SET 1-27),Channels 12 and 17 ...................... A4
Figure A7. Vertical Load Strain Histories (SETI-27),Channels 29, 30, 31, and 32 ................... A5
Figure B 1. Locks 27 Strain Histories - Test 272B (SET2-27),Channels 18 and 16 ...................... B2
Figure B2. Locks 27 strain histories - Test 272B (SET2-27),Channels 8 and 29 ....................... B2
Figure B3. Locks 27 strain histories - Test 272B (SET2-27),Channels 28, 26, and 13 ................... B3
vi
Figure B4. Locks 27 strain histories - Test 272B (SET2-27),Channels 15 and 22 ...................... B3
Figure BS. Locks 27 strain histories - Test 272B (SET2-27),Channels 3 and 30 ....................... B4
Figure B6. Locks 27 strain histories - Test 272B (SET2-27),Channels 20 and 9 ....................... B4
Figure B7. Locks 27 strain histories - Test 272B (SET2-27),Channels 19, 27, 14, and 21 .................. B5
Figure B8. Locks 27 strain histories - Test 272B (SET2-27),Channels 12, 17, 31, and 25 .................. B5
Figure B9. Locks 27 strain histories - Test 271C (SETI-27),Channels 22 and 27 ...................... B6
Figure Bl0.Locks 27 strain histories - Test 271C (SET1-27),Channels I Iand 19 ...................... B7
Figure B 11.Locks 27 strain histories - Test 271C (SETI-27),Channels 28, 26, and 13 ...................... B7
Figure B12.Locks 27 strain histories - Test 271C (SETI-27),Channels 20, 18, and 10 .................... B8
Figure B13.Locks 27 strain histories - Test 271C (SET1-27),Channels 9, 16, and 15 ..................... B8
Figure B 14.Locks 27 strain histories - Test 27 1 C (SET 1-27),Channels 12 and 17 ...................... B9
Figure B15.Locks 27 strain histories - Test 271C (SET1-27),Channel t ............................ B9
Figure B 16.Locks 27 strain histories - Test 271C (SET1-27).Channels 6 and 7 ........................ BIO
Figure B17.Locks and Dam 26 strain histories - Test 261A(SETI-26), Channel 21 .................... Bl1
Figure BIS.Locks and Dam 26 strain histories - Test 261A(SETI-26), Channels 15, 24, and 13 .............. BEI
Figure B19.Locks and Dam 26 strain histories - Test 261A(SETI-26), Channels 11, 9, and 14 ............... B12
Figure B20.Locks and Dam 26 strain histories - Test 261A(SETI-26), Channels 10 and 12 ................ B12
Figure B21.Locks and Dam 26 strain histories - Test 261A(SETI-26), Channels 19 and 20 ................ B13
Figure B22.Locks and Dam 26 strain histories - Test 261A(SETI-26), Channels 30, 28, and 29 .............. B13
vii

Figure B23.Locks and Dam 26 strain histories - Test 261A(SETI-26), Channels 31 and 32 ............... B14
Figure B24.Locks and Dam 26 strain histories - Test 261A(SETI-26), Channels I and 4 .................. B14
Figure B25.Locks and Dam 26 strain histories - Test 261A(SETI-26), Channels 25, 27, and 26 ............. B15
Figure B26.Locks and Dam 26 strain histories - Test 261A(SETI-26), Channel 17 .................... B15
Figure B27.Locks and Dam 26 strain histories - Test 262B(SET2-26), Channels 4, 5, and I I................. B 16
Figure B28.Locks and Dam 26 strain histories - Test 262B(SET2-26), Channels 1, 2, and 3 ................ B16
Figure B29.Locks and Dam 26 strain histories - Test 262B (SET2-26)(gage slippage on channel 7), Channels 6, 7, and 8 .... B17
Figure B30.Locks and Dam 26 strain histories - Test 262B(SET2-26), Channels 9, 10, and 12 .............. B17
' ~viii

Preface
The work described in this report was sponsored by the U.S. Army En-gineer District (USAED), St. Louis, and Headquarters, U.S. Army Corpsof Engineers (HQUSACE), as part of the Concrete and Steel StructuresProblem Area of the Repair, Evaluation, Maintenance, and Rehabilitation(REMR) Research Program. The work was performed under the REMRWork Unit 32641, "Evaluation and Repair of Hydraulic Steel Structures(HSS)," for which Mr. Cameron P. Chasten, Information Technology Labo-ratory (ITL), U.S. Army Engineer Waterways Experiment Station (WES),was Principal Investigator. Mr. Don Dressier was the HQUSACE Techni-cal Monitor.
Mr. William N. Rushing (CERD-C) was the REMR Coordinator at theDirectorate of Research and Development, HQUSACE; Mr. James E.Crews (CECW-O) and Dr. Tony C. Liu (CECW-EG) served as the REMROverview Committee; Mr. William F. McCleese, Structures Laboratory(SL), WES, was the REMR Program Manager; and Mr. James E.McDonald, SL, WES, was the Problem Area Leader.
The work was performed by Bridge Diagnostics Incorporated (BDI)under U.S. Army Corps of Engineers Contract Number DACW39-92-C-0064. The report was prepared by Messrs. Brett C. Commander and JeffX. Schulz, and Dr. George G. Goble, BDI; and Mr. Chasten, under the gen-eral supervision of Mr. H. Wayne Jones, Chief, Scientific and EngineeringApplications Center (S&EAC), Computer-Aided Engineering Division,ITL, WES, and Dr. N. Radhakrishnan, Director, ITL. Acknowledgment isexpressed to Messrs. Thomas Ruf, Engineering Division, and RobertKelsey, Operations Division, USAED, St. Louis, for organizing and assist-ing in field testing performed at the Mississippi River Locks 27 and Locksand Dam 26.
At the time of publication of this report, Director of WES was Dr. Rob-ert W. Whalin. Commander was COL Bruce K. Howard, EN.
Ix

1 Introduction
There are over 160 commercially active locks (including over 200 lockchambers) on the United States inland and intracoastal waterway systems.The age of these locks ranges from I to over 150 years. Approximately40 percent of the locks are over 50 years old and the median age of alllock chambers is approximately 35 years (Headquarters, U.S. Army Corpsof Engineers (HQUSACE) 1988). There is a need for development ofstructural evaluation tools that can provide assessment of the strength andsafety of these aging structures.
A primary goal of the Repair, Evaluation, Maintenance, and Rehabilita-tion (REMR) project "Evaluation and Repair of Hydraulic Steel Structures(HSS)" is to develop structural evaluation guidance for assessment ofaging steel lock gates. Lock gates include miter gates, lift gates, sectorgates, and tainter gates. This report describes experimental and analyticalstudies that were conducted for two vertical-lift lock gates. EM 1110-2-2703 and EM 1110-2-2701 (HQUSACE 1962, 1984) describe the use, de-sign, and layout of vertical lift gates.
Due to complex geometry and loading conditions, analysis and designof vertical lift gates include many simplifying assumptions. Althoughgood approximations can be made in the development of analytical mod-els, it is not possible to make exact simulations of the loading, structuralgeometry, and boundary (support) conditions of a structure. Therefore, itis difficult to develop an exact model of even a new structure. For exist-ing structures, construction tolerances, deterioration of seals, and wear atsupport points are factors that further alter loading and structural condi-tions. To ensure that a safe structural design is produced, assumptions onloading and structural characteristics can generally be conservative. How-ever, for a structural evaluation, the primary goal is to assess the currentcondition of a structure. So that a reliable assessment can be made, it isdesirable to identify the unknown quantities (loading, boundary condi-tions, etc.) with sufficient accuracy.
Experimental systems can measure the actual response of a structuresubjected to various loading. However, with most systems only a few se-lected points on a structure can be monitored. An optimum evaluation sys-tem would incorporate both analytical and experimental techniques. An
Chpw 1 h*~dudo

analytical model of such a system can be systematically modified until itsimulates structural behavior observed under experimental conditions.This type of evaluation system is currently under development in thisstudy. A similar study for miter lock gates has been conducted (Com-mander et al. 1992a, 1992b).
The objectives of this study are to measure the behavior of vertical liftlock gates experimentally and to develop modeling and analysis proce-dures that may provide a basis for the evaluation of existing gates and de-sign of new gates. In this study, lift gates at Mississippi River Locks 27near Granite City, IL, and Locks and Dam 26 (Melvin Price) near Alton,IL, were investigated. The upstream lock gate of the auxiliary lock atLocks 27 and the upstream lock gate of the main lock at Locks and Dam26 were instrumented and tested under various loading conditions in June1992. Analytical models were developed and analyses were performed foreach.
The lift gate of the auxiliary lock at Locks 27 was selected for study onthe following basis. This gate is identical in construction to the lift gatein the main lock chamber. The gate of the main lock will be replacedsince several of its structural members have cracked. Since the auxiliarylock lift gate is in good condition, the experimental data may provide in-sight on the development of improved modeling and analysis procedureswhich will benefit the design of a replacement gate in the main lock. Fur-thermore, the acquired data may suggest possible causes of cracking inthe main lock gate. The lift gate at Locks and Dam 26 is ideal for the veri-fication of the testing and analysis procedures since it is a new structurein good condition.
This report describes the testing, analytical modeling, and analysis pro-cedures of each lift gate. Chapter 2 describes the instrumentation and test-ing for the experimental studies. The analytical studies and comparisonsof analytical and experimental data are discussed in Chapter 3. Chapter 4gives a summary of the study and provides recommendations on future ex-perimental and analytical studies for vertical lift gates. Appendices A andB include graphical comparisons of the analytical predictions and the ex-perimental responses.
Chapter 1 Introduction
2 Field Testing
Loading and Instrumentation
One leaf of each vertical lift gate was monitored during field testing tomeasure the in-service structural behavior. A data acquisition system(DAS) recorded strain measurements as various loads were applied to thestructure. For each test, two general loading conditions were applied.
a. Vertical load. Vertical load due to self-weight was applied by liftingthe gate from the bottom sill.
b. Hydrostatic head'differential load. Filling or emptying the lockchamber produced varying head differential (difference in upperpool elevation and lock chamber water elevation). This conditionimposed both lateral and vertical pressure loads to the gate leaves.
Instrumentation consisted of a DAS, electronic cables, and submergiblesteel strain transducers. The transducers measure strain over an effectivegage length of 3 in. (7.62 cm). Each test included approximately 30 trans-ducers that were mounted on various structural members (girder flanges,skin plate, bracing, etc.). Where transducers were to be attached, hand-held grinders were used to remove the paint. C-clamps conneced trans-ducers to the edges of member flanges, and small steel tabs with bolts con-nected the transducers to locations not accessible for C-clamps. The steeltabs were glued to structural steel with cyanoacrylate glue. For each trans-ducer, approximately 100 ft (30.48 m) of cable connected the transducerto the DAS. Transducer cables were routed along the girders and throughgirder drain holes from the transducers to the DAS. Figure I shows twoof the waterproof strain transducers C-clamped to a girder flange. Duringinstallation and removal of the instrumentation, the locks were closed andthe gates were raised clear of the water.
Strain transducers are mounted much faster and easier than conven-tional foil strain gages. Generally, two persons can mount a set of over 30transducers in less than 1 day (Commander et al. 1992b). For these tests,significant time was lost as the gates were raised and lowered for instru-mentation setup and tow lockage. The upstream leaf of the Locks 27 lift
Chapter 2 Field Testing 3

Figure 1. Two waterproof strain transducers mounted on downstream girder flange
gate operates at approximately 1 ft (0.3048 m)/min and must be raised ap-proximately 50 ft (15.24 m) to clear the upper pool elevation. Althoughnot all experimental data were compared to analytical data (Chapter 3),the following sections describe each test in detail. Data for all tests areavailable through CEWES-IM-DS.
Locks 27 Lift Gate Test Procedures
The vertical lift gate of the auxiliary lock at Locks 27 has two leaves.The upstream (lower) leaf was tested since it is subject to larger serviceloads and its counterpart in the main lock chamber has exhibited consider-able cracking (U.S. Army Engineer District, St. Louis (USACE) 1990).Each leaf is composed of six horizontal girders, three vertical diaphragms,and many downstream bracing members. Figure 2 shows the downstreamface of the upstream leaf.
Two sets of tests were performed. In the first set (SETI-27), the gatewas instrumented extensively in a localized area. The transducers were at-tached at locations similar to where cracking had occurred in the mainlock chamber gate. The second set (SET2-27) consisted of a more generallayout of transducers to observe the structural response of the main struc-tural members. Instrumentation and testing of the leaf required
4 Chapter 2 Field Testing

Figure 2. Locks 27 vertical lift gate - downstream face of upstream gate leaf
approximately 30 hours. A work flat provided access to the gate forinstrumentation.
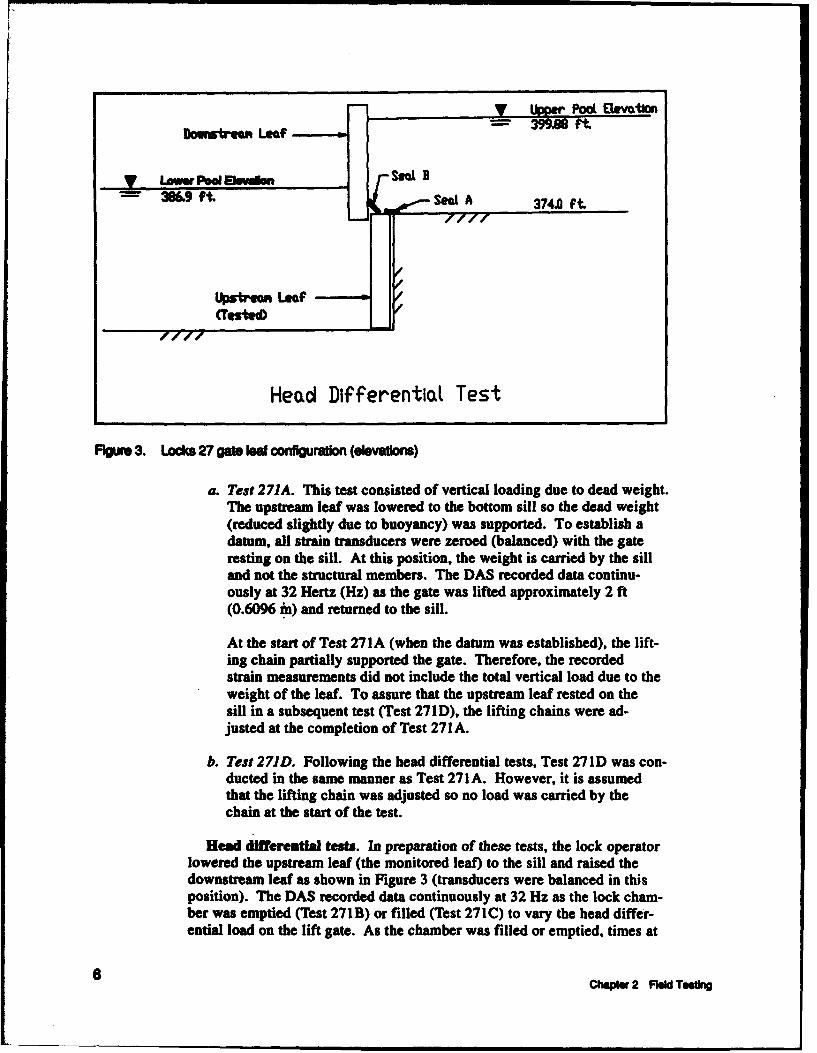
Vertical load and head differential load were applied during each set oftests. For the vertical load tests, the instrumented leaf was positioned onthe bottom sill (so that all dead load was transferred to the sill) and thenlifted a distance of approximately 2 ft (0.61 in). The DAS recordedstrains as the leaf was lifted from the bottom sill. For the head differen-tial tests, the instrumented leaf was positioned to form a damming surfacefor the lock chamber. Monitoring of strain data started as the lock cham-ber culvert valves were opened and continued as the chamber was filled oremptied. Figure 3 illustrates the pool and gate leaf elevations for the headdifferential tests.
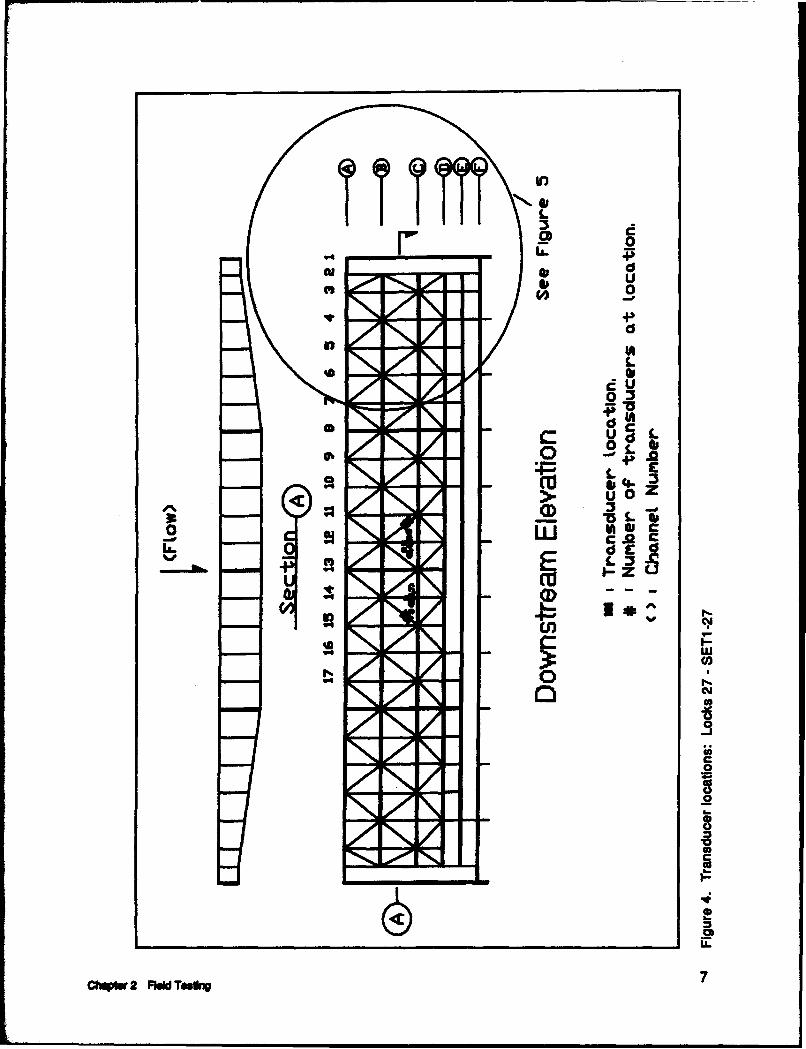
Set I tests (SETI-27)
Vertical load tests. Figures 4 through 15 illustrate the location of the30 strain transducers mounted on the structure. The corresponding DASchannel number identifies each transducer for convenience of reporting re-sults. Four tests (described in following paragraphs) were conducted inI day. The upper pool elevation (el) was 399.88 ft (121.9 m) and thelower pool elevation was 386.9 ft (117.93 m).
ChIter 2 FWeld Tt$ng 5
V LkperPool ai.vmtawDwt~ Leaf - 399M ft
Y Laawa P" EWvdmn sEow B
aesiui30&,9 f t,. Se nt A 374 .0 f t,
va M Lft/
Head Differentiat Test
Figu 3. Locks 27 gW lW confguration (elevatons)
a. Test 271A. This test consisted of vertical loading due to dead weight.The upstream leaf was lowered to the bottom sill so the dead weight(reduced slightly due to buoyancy) was supported. To establish adatum, all strain transducers were zeroed (balanced) with the gateresting on the sill. At this position, the weight is carried by the silland not the structural members. The DAS recorded data continu-ously at 32 Hertz (Hz) as the gate was lifted approximately 2 ft(0.6096 m) and returned to the sill.
At the start of Test 271A (when the datum was established), the lift-ing chain partially supported the gate. Therefore, the recordedstrain measurements did not include the total vertical load due to theweight of the leaf. To assure that the upstream leaf rested on thesill in a subsequent test (Test 271D), the lifting chains were ad-justed at the completion of Test 271 A.
b. Test 271D. Following the head differential tests, Test 27 ID was con-ducted in the same manner as Test 271 A. However, it is assumedthat the lifting chain was adjusted so no load was carried by thechain at the start of the test.
Head differential tests. In preparation of these tests, the lock operatorlowered the upstream leaf (the monitored leaf) to the sill and raised thedownstream leaf as shown in Figure 3 (transducers were balanced in thisposition). The DAS recorded data continuously at 32 Hz as the lock cham-ber was emptied (Test 271B) or filled (Test 27 1C) to vary the head differ-ential load on the lift gate. As the chamber was filled or emptied, times at
6 ChaptrW 2 FWlWd TesUng
in
0U.U
0 05
dc
UL
uz
UdE
ca opM 6
0 PA W
I zI
Cý
00
0C
V
U.
ChWgg 2 Phid Testbn 7
7 6 5 4 3 21
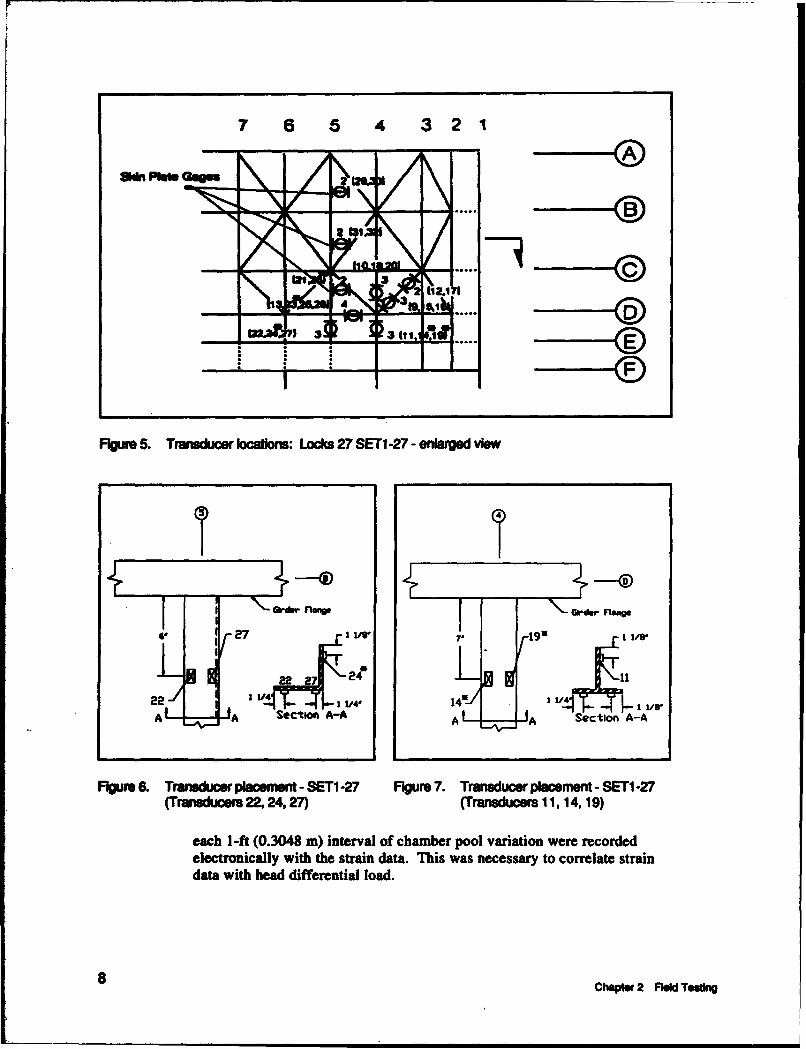
Figure 5. Transducer locations: Locks 27 SETI -27- enlarged view
T
6' I27 119M
22 1 T- 1/-11/4-
A A Section A-A A A Section A-A
Figure 6. Transducer placement - SETI -27 Figure 7. Transducer placement - SET1 -27(Transducer 22,24,27) (Transducers 11, 14, 19)
each I-ft (0.3048 m) interval of chamber pool variation were recordedelectronically with the strain data. This was necessary to correlate straindata with head differential load.
8 Chapter 2 Field Testing
i i ~ I Jim i
a e6 N Skin Rtate
NI
Figure 8. Transducer placement - SETi -27 Figure 9. Transducer placement - SETI -27(Transducers 13,23,26,28) (Transducers 21, 25)
is ,-I Is--4o...ý
SeCtIM~ 3-3
Figure 10. Transducer placement - SET1 -27 Figure 11. Transducer placement - SET1 -27(Transducers 9, 10, 15, 16, 18, 20) (Transducers 12, 17)
a. Test 271B: chamber drop. The data were established with the lockchamber full and no differential head (chamber water elevationequal to the upper pool elevation). The DAS recorded data as thechamber water level dropped from upper pool to lower pool eleva-tion. 1-ft (0.3048 m) intervals of chamber pool elevation were iden-tified by an elevation marker located on the lock wall. For approxi-mately the first 6 ft (1.83 m) of chamber drop, the marker was notvisible and the position could not be identified accurately. How-ever, the last 6 ft (1.83 m) were identified.
ChqO s 2 F2eld eting 9
5 A
4 -
31 IntetotInurcostals 30
-- e
V32V29
FIgure 12. Transducer pcMeI -- SET -27 Figure 13. Transducer piaceMent - SETI -27(Transducers 31, 32) (Transducers 29, 30)
bctmm A-
FIgure 14. Transducer placement - SETI -27 FIgure 15. Transducer placement - SETi -27(Transducers3, 4,8) (Transducers 5, 6, 7)
b. Test 271C: chamberfil. In this test, the DAS recorded data as thechamber filled. The data were established with the lock chamberempty; the initial condition consisted of a 12-ft, 9-in. (3.9 m) differ-ential head. Since the lock wall gage was not always visible, thelockmaster identified 1-ft (0.3048 m) intervals of chamber pool ele-vation using a pressure gage installed in the control room. (Thiswas done for all subsequent tests.)
10 Chapter 2 Field Testing

Set 2 teSts (SET2-27)
At the completion of the SETI-27 series of tests, the upstream gate leafwas prepared for the second series of tests (SET2-27) in which three testswere performed. Figures 16 through 27 show the locations of the 28strain transducers mounted on the leaf. (Two of the original 30 transduc-ers malfunctioned.) Each transducer is identified by the DAS channelnumber. Upper pool and lower pool elevations were 400.25 (122 m) and387.26 ft (118 m), respectively.
a. Vertical load test: Test 272A. This test was similar to Test 271 Aand Test 271D. The data for the strain measurements were estab-lished with the leaf resting on the sill. The DAS recorded data
S(FLow)
ILEILLLLLLI½WL
SI I I I I
sec am Eleva t
17 6 5 4 3 2 11 W 9 8 7 6 5 4 3 21
A .0
Downstream. Elevation
* 1 Transducer tocoation.# 1 Number of transducers 't Location.
( ) ' Channet numbers.
Figure 16. Transducer locations: Locks 27 SET2-27
Chapler 2 Fe Tng 11
U Downstream Flange 13 Downs~ flang
U Upstream Ftange Usr
Figure 19. Transducer placement - SET2-27 Figure 20. Transducer placement - SET2-27(Transducers 136,218) (Transducers 15,22)
niaeL 1 ft(.34/m4bvete il
,Dwsitioedm oangte silawntesowstea reaf wsRaisedTetn
12erosa chate 2Fred esi
upus13 ' _/44)mste FaeoFSn tt) or
U
Downstunnao13
3 1/2 (Trad 1, 13, 2nu er7U Cove,' Face of Pl t Plate)
'I
Figure 21. Transducer placement - SET2-27 Figure 22. Transducer placement - SET2-27(Transducers 1,13,24) (Transducers 2, 3,4,30)
( Ts27B c aCbero.r Pte Te 271B
CoveC
w v e r tastreaLy F2onge
(2) Test 2728: chamber dro. Thi est 22 was similar to Test 271B.
The data were set with 12 fl (3.66 m) of differential head (the
chamber level was slightly higher than the low-pool elevationdue to leakage around the lift gate seals). The DAS recorded
ch~esr 2 Fkl T2ti 13

H1.
fCover Rt 6Pf
27- 30j : 1 r
Dowstreami~ Range 13 ,~
(Trasducrs 14 19/2 1,7-Tasuer 2 72,1
Upsream Rlang
Figure 27. Transducer placmentf - SMT-27 Fiue2.Taw cr emn-SE -7(Transducers 23,392) ,2)(rndces1,72,1
Up tr e se tran sdcr eentcmae ihteaayiaWaa
14 ~ Fil Note"2Fil Ten

Transducers that malfunctioned for tests in SETI-27 correspond toDAS channel numbers 3, 4, 5, 14, 19, 23, 24, and 25 (Channel 19malfunctioned during Test 271D only). Transducers numbered 1, 2,4, 5, 7, 10, and 11 were questionable for tests of SET2-27. Each un-reliable transducer is identified with an asterisk in Figures 4 through27.
b. Due to the submergence and vertical movement of the leaf, it was re-quired that the transducer cables be attached to the leaf and groupedtogether. To save time in future testing of lift gates, several trans-ducers should be grouped together before installation.
c. The clamping and gluing methods (used for attaching the strain trans-ducers to the structural members) worked quite well for making un-derwater measurements.
d. The following summaries provide field data file names (DAS channelnumbering/ strain data), the data for each test, and a description ofthe data record.
(1) Test 271A Summary.
Data File: SET1-27.CHN / TEST271A.DATBalance: Leaf assumed on sill.Data Record: Start with leaf assumed on sill; record as leaf
raised approximately 2 ft (0.6096 m) andlowered; stop at time leaf 'was lowered to sill.
Notes: Channels 3 and 4 obtained erratic values (thetransducers may have malfunctioned).
(2) Test 271D Summary.
Data File: SET1-27.CHN / TEST271D.DATBalance: Leaf on sill.Data Record: Start with leaf on sill; record as leaf raised
approximately 2 ft (0.6096 m) and lowered; stopat time leaf was lowered to sill.
Notes: On observation of strain records during testing,Channel 23 was not responding correctly.Channels 14 and 19 malfunctioned as the gatewas being lowered.
(3) Test 271B Summary.
Data File: SETI-27.CHN / TEST271B.DATBalance: Zero head, leaf on sill.Data Record: Start at zero head; random position indicator
marks exist in the data file for approximately thefirst 6 ft (1.83 m) of chamber drop; the last sixmarks are accurate and correspond to head
ChMpr 2 Field Teoing 15
differentials of 7-, 8-, 9-, 10-, II-, and 12-ft(3.66 m) head. The last mark was recorded at ahead of 12 ft (3.66 m); the final head differentialwas approximately 12.5 ft (3.81 m); stop recording.
Notes: The differential between upper and lower poolsdoes not equal 12.5 ft. The chamber level wasslightly higher than lower pool due to leakagearound the lift gate. The final head differentialwas measured using instruments used by the lockoperator.
(4) Test 271C Summary.
Data File: SETI-27.CHN / TEST271C.DATBalance: 12-ft 9-in. (3.9 m) head, leaf on sill.Data Record: Start at 12-ft 9-in. (3.9 m) head; indicator marks
at 12-, 11-, 10-, 9-, 8-, 7-, 6-, 5-, 4-, 3-, 2-, 1-,and 0-ft (3.66-, 3.35-, 3.048-, 2.74-, 2.44-, 2.13-,1.83-, 1.52-, 1.22-, 0.914-, 0.6096-, 0.3048-, andO-m) head; stop recording.
(5) Test 272A Summary.
Data File: SET2-27.CHN / TEST272A.DATBalance: Leaf on sill.Data Record: Start with leaf on sill, stop at the time the leaf
was raised approximately 1 ft (0.3048 m).
(6) Test 272B Summary.
Data File: SET2-27.CHN / TEST272B.DATBalance: Zero head; leaf on sill.Data Record: Start at zero head; indicator marks at 1-, 2-, 3-,
4-, 5-, 6-, 7-, 8-, 9-, 10-, and 11-ft (0.3048-,0.6096-, 0.914-, 1.22-, 1.52-, 1.83-, 2.13-, 2.44-,2.74-, 3.048-, and 3.35-m) head; stop (headdifferential at approximately 12 ft (3.66 m) atstop time).
(7) Test 272C Summary.
Data File: SET2-27.CHN / TEST272C.DATBalance: 12-ft (3.66-m) head; leaf on sill.Data Record: Start at 12-ft (3.66-m) head; indicator marks at
11-, 10-, 9-, 8-, 7-, 6-, 5-, 4-, 3-, 2-, and 1-ft(3.35-, 3.048-, 2.74-, 2.44-, 2.13-, 1.83-, 1.52-,1.22-, 0.914-, 0.6096-, and 0.3048-m) head; stopat approximately zero head.
16 Chapter 2 Field Testing
Lock 27 Field Test Conclusions0V
Based on the experimental data, various conclusions can be made con-cerning the position of the gate leaf and the effectiveness of the gate seals.This information is extremely important in the development of an analyti-cal model.
a. The strain data indicated that the leaf was at least partially resting onthe bottom sill at the beginning of the vertical load tests. AppendixA (Figures Al through A7) provides strain history plots for Test271A. The plots show abrupt changes in strain initially (as the gateleaf was lifted from the sill), constant strain levels as the gate con-tinued to be lifted and lowered, and a sudden return to near-zerostrain levels as the gate leaf was returned to the sill. It is a fair as-sumption that the gate leaf was resting on the sill during the headdifferential tests as well.
b. Bending behavior of the horizontal girders was determined from thestrain data taken during the head differential tests. Strain values forlocations on upstream girder flanges were in compression. The di-rection of bending (or displacements) is such that the hydraulic pres-sure must have been greater on the upstream face of the gate than onthe downstream face. This observation shows that the seal betweenthe leaf and the upstream sill (Seal A in Figure 3) was not function-ing properly. It was found later that Seal A had been removed anumber of years ago to alleviate vibration problems (privatecommunication).
Locks and Dam 26 Lift Gate Test Procedures
The upstream lift gate at Locks and Dam 26 consists of three leaves.The middle leaf was tested since it is subject to the largest service loads.Additionally, a crack had previously occurred on a girder flange (the crackhad been repaired prior to the test). The middle leaf consists of 4 horizon-tal girders braced on the downstream side with diagonal members, and 12vertical diaphragms as shown in Figure 28. The gate is new and the con-struction is much simpler than that of the Locks 27 lift gates. Instrumenta-tion and testing of the Locks and Dam 26 lift gate leaf was completedover a 2-day time span. The lock could be closed for only 4 hours at atime, however, instrumentation and testing were completed within theseconstraints. The nappe of the downstream leaf provided access to the mid-die leaf.
Similar to Locks 27 studies, testing included two sets of transducers.In the first set (SETI-26), transducers were located to obtain the generalstructural response characteristics (bending in the girders and diaphragmsand axial forces in the diagonal members). After the SET 1-26 tests werecompleted, a crack was discovered in a girder flange. Figure 29 shows the
ChM tsr 2 Fied Teefn 17

Figure 28. Lcsand Dam 28 vertical lIft gate - downistream face of middle leaf
Figure 29. Crack at girder flange-to-diaphragm flange connection
18 Chapter 2 Field Testin
crack starting at the weld that joins the vertical diaphragm flange plate tothe girder flange. To examine the effect of the crack, tests were per-formed with a second set (SET2-26) of transducers positioned in a local-ized area around the cracked diaphragm.
A total of four tests, including one vertical load test and three head dif-ferential tests, were conducted. The vertical load test was similar to thoseof the Locks 27 lift gate. For the head differential tests, the leafs were po-sitioned as shown in Figure 30. The upper pool elevation was 419.0 ft(127.7 m), the lower pool elevation was 399.8 ft (121.9 m), and the eleva-tion of the top girder of the middle leaf was 408.6 ft (124.5 m). A scale lo-cated on the lock wall was used to monitor the pool level as it varied. Typ-ically, the pool elevation time was recorded at 1-ft (0.3048 m) intervalswith the strain data.
Set I test (SETI-26): Test 261A chamber drop
SETI-26 included 28 transducers; four channels (5-8) were inoperableat the time of the test. Several of the transducers for this setup are shownin Figure 31. Figures 32 through 45 show the locations of the transducersand the corresponding DAS channel numbers. A crew of four persons in-strumented and tested the leaf in approximately 5 hr.
A head differential test (Test 261A) was the only test conducted withthis transducer configuration. Strain data were recorded as the chamberwater level dropped from the upper pool elevation (datum position) to thelower pool elevation. Data recording began as the lock valves were
DoWM60M's~lr Li~t 419.0 f
408.6 ft.
a __Lffwv•P ooW~ --Vft Mk • ( --ft )
Head Differential Test
Figure 30. Locks and Dam 26 lift gate leaf configuration (elevations)
ChMP r2 Fid Teot 19
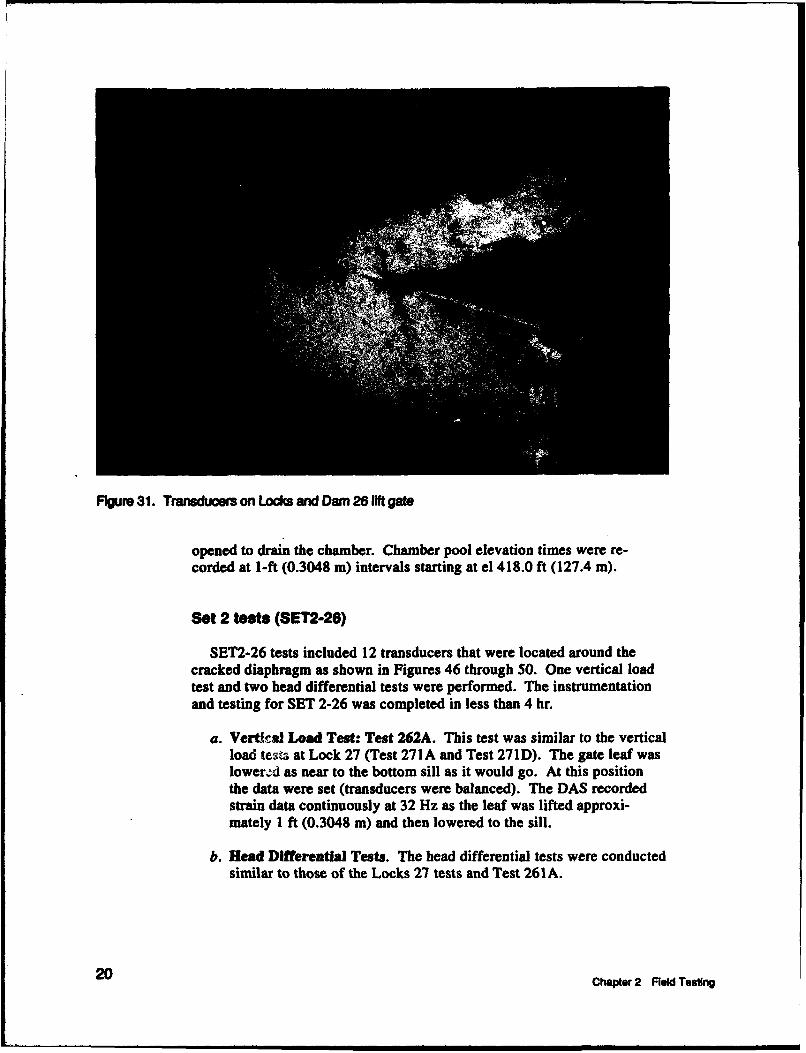
Figure 31. Transduoers on Locks and Dam 26 lIft gate
opened to drain the chamber. Chamber pool elevation times were re-corded at 1-ft (0.3048 m) intervals starting at el 418.0 ft (127.4 m).
Set 2 teto (SET2-26)
SET2-26 tests included 12 transducers that were located around thecracked diaphragm as shown in Figures 46 through 50. One vertical loadtest and two head differential tests were performed. The instrumentationand testing for SET 2-26 was completed in less than 4 hr.
a. Vertical Load Test: Test 262A. This test was similar to the verticalload test at Lock 27 (Test 271A and Test 271D). The gate leaf waslower.ed as near to the bottom sill as it would go. At this positionthe data were set (transducers were balanced). The DAS recordedstrain data continuously at 32 Hz as the leaf was lifted approxi-mately 1 ft (0.3048 m) and then lowered to the sill.
b. Head Differential Tests. The head differential tests were conductedsimilar to those of the Locks 27 tests and Test 261A.
20 Chapter 2 Field Testing
0
dU0
4)
Lv
P 03
U rd-Lo L*
L E
*u oz
d EdL 3.C
c~
C$,
0(JC"
0)0u6
Ta0-0.- fJ
(00)
vi I
zzz0
LL
CWW Fl~ Toot 2
4W
U. 1
WTasdcr 21, 23)(Tansues13 54
214
DIAPHRAGM DIAPHRAGM4 r .0E'1 1/2,4
------- ------ ___t2313
__ __ __.____ ,oFigure 33. Transducer placement - SETI -26 Figure 34. Transducer placement - SETI -28
(Transducers 2, 23) (Transducers 13,15,24)
1 U41
9 11/4
rt~LANK
(1) Test 262B: chamber drop. This test was conducted under sim-ilar conditions as Test 261A. Strain data were recorded as thechamber water level dropped from the upper pool elevation(datum position) the lower pool elevation.
(2) Test 262C: chamber filL The datum for transducers was setwhen the chamber pool elevation was equal to the low pool ele-vation (maximum bead). The DAS recorded strain data fromthe time that the lock valves were opened to fill the chamber to
SChapter 2 Field Tesing

/-2
IM~ j:~IJ1W#41AN
flJW
Figure 37. Transducer placement -SETI -26 Figure 38. Transducer placement -SETI -26(Transducers 1, 2) (Transducer 22)
Figure 39. Transducer placement - SET1 -26 Figure 40. Transducer placement - SET1 -26(Tlransduce 3) (Transducers 19, 20)
the time when the chamber pool level reached the upper pool el-evation. Pool elevation times were recorded at 1-ft (0.3048 m)intervals.
Ctlmpes' 2 Fied Testlng 23
144
mWAPH
--- M 1 _
"") T FL ,
Figure 41. Transducer placement - SETI -26 Figure 42. Transducer placement - SETI -26(Transducers28,29,30) (Transducer 17)
U&L FLMM
Figure 43. Transducer placement -SETI -26 Figure 44. Transducer placement -SET1 -26(Transducer 18) (Transducers 25, 26, 27)
Field notes
a. DAS channels 2, 3, 16, 17, 23 malfunctioned during the first test,Test 261A. The 12 transducers for SET2-26 tests functionedproperly.
24 Chapter 2 Field Testing

N--- r32
® J
Figure 45. Transducer Placement - SETi -26(Transducer 31,2)
b. The results of the vertical load test (Test 262A) were inconclusivesince the leaf could not be lowered completely to the sill. No straindifferential occurred during the vertical load test, indicating that theleaf was not resting on the sill initially.
c. The following test summaries are provided similar to those for the
Locks 27 Lift Gate.
(1) Test 261A Swwnary.
Data File: SETI-26.CHN I TEST261A.DATBalance: Zero haData Record: Start at zero head; elevation marks at 1-ft
(0.3048-rn) intervals.
(2) Test 262A Swmmary.
Data File: SET2-26.CHNq I TEST262A.DATBalance: Leaf on bottom sill.Data Record: Start with leaf on sill; record as leaf raised
approximately 1 ft (0.3048 m) and lowered; stopat time leaf was lowered to sill.
NOTES: Due to binding or debris, the gate leaf was likelynot resting on the sill at the start of the test.
(3) Test 262B Summary.
File Name: SET2-26.CHN / TEST262B.DATBalance: Zero headData Record: Zero head to maximum head. Pool elevations
:hq•u 2 Fld Teg 25
• i• ........ . .. . iI III'A

cocm
0
co.1,1
0
I•..2
Vgo0ci
U.
26 Chpter2 Fild Tstin
I O
61WWIA
"T"
I~iii
Figure 47. Transducer placement - SET2-26 Figure 48. Transducer placement - SET2-26(Transducers 5, 11) (Transducers 1, 2, 3)
Figure 49. Transducer placement - SET2-26 Figure 50. Transducer placement - SET2-26(Transducers 6, 7, 8) (Transducers 9, 10)
Chapter 2 Fed Teeing 27
times recorded at 1-ft (0.3048 m) intervals
beginning at 418.0 ft (127.4 m).
(4) Test 262C Summary.
File Name: SET2-26.CHN / TEST262C.DATBalance: Maximum headData Record: Maximum head to zero head. Pool elevations
times recorded at 1-ft (0.3048 m) intervalsbeginning at 401.0 ft (122.2 m).
28Chapter 2 Field Teo*
3 Structural Analysis andData Comparison
General Modeling Considerations
The lift gates of this study (Figures 2 and 28) are complex stiffened-plate structures that are subjected to significant vertical and horizontalloads. Head differential pressure produces vertical forces on the topgirder and retainer plate and horizontal forces on the skin plate. Verticalforces due to structural weight are applied to the structure when gateleaves are lifted. A skin plate, located on the upstream face of the struc-ture, forms the damming surface and provides resistance to horizontalloads. The skin plate is stiffened by horizontal girders and vertical dia-phragms. Bracing members, located on the downstream side of the liftgate, provide lateral stability to girders for horizontal loading and providea framing system to resist vertical loads.
To simulate structural behavior, a two-dimensional (2-D) model in theplane of the leaf might be considered. However, uniform behavior of thestructure through its depth (distance from upstream to downstream faces)would be assumed. The depth of a gate leaf significantly affects the struc-tural loads and load transfer characteristics. Resistance to vertical load ofthe upstream (skin plate) and downstream (bracing) faces is not equal.Therefore, under vertical loads, out-of-plane behavior exists due to the oc-currence of uneven vertical deflections through the depth. The magnitudeof this effect is highly dependent on the depth of the leaf. Furthermore,horizontal and vertical forces act concurrently. The depth of the gate mustbe represented if these effects are to be realistically modeled.
Primary goals of this study include: 1) to develop modeling proceduresthat may be used in evaluation and design of lift gates, and 2) to studylocal behavior of downstream bracing members (these members are proneto cracking). Due to the structural complexity and desired results (studyof bracing behavior), a three-dimensional (3-D) finite element model ofthe gate leaves was considered necessary. Loading and boundary condi-tions (BC) representative of test conditions were simulated in develop-ment of each model.
ChWi 3 S3 AimIs adDat C somni n 29
Analytical models
Techniques and assumptions regarding development of the analyticalmodels are outlined.
a. The geometry of the finite element mesh is defined by a 3-D (X, Y, Z)coordinate system. The Z coordinates define the position in the up-stream/downstream direction, and the X and Y coordinates define thehorizontal and vertical location, respectively. The Z coordinate fornodes on the upstream face are located at the center of the skin platethickness. For nodes on the downstream face, the Z coordinates are lo-cated at the girder web-to-flange (downstream) interface. X and Y co-ordinates for nodal points on both the upstream and downstream facesof the leaf are located: 1) at the girder web-to-diaphragm web inter.ec-tions, and 2) at the intersection between center lines of downstreamvertical bracing members and girder webs.
b. Hybrid plate-membrane elements simulate the skin plate and thewebs of girders and diaphragms. The elements are four-node quadri-laterals composed of two triangles. Each element is a combinationof a membrane element and a plate element, and is capable of resist-ing in-plane forces and bending about both in-plane axes.
c. Eccentric s'-ce frame elements (Commander et al. 1992b) modelgirder flanges, diaphragm flanges, and bracing members. These ele-ments include 6 degrees of freedom per node (three displacementsand three rotations). The frame elements have only a length dimen-sion but include stiffness terms for each degree of freedom. An ec-centricity term offsets the element neutral axis from its node points(a value of zero eccentricity is acceptable).
d. Eccentricity terms are used to define the distance between the nodalpoints and the flange and brace element neutral axes. Eccentricityterms for the upstream girder flange elements equal one-half thethickness of the skin plate plus one-half the thickness of the flangeplate (the upstream nodes are located at the center of the skin plate).Therefore, each flange element neutral axis is placed at a realistic lo-cation without defining additional nodal points. The eccentricity ofthe neutral axis (in the through depth direction of the leaf) for eachbracing element is defined with respect to the web-flange interfacesof the girders.
e. Boundary conditions are applied to the structural model by fixing(eliminating) degrees of freedom at specified nodal points. The BCcan be applied to any of the global degrees of freedom (three dis-placements and three rotations) at any node. Boundary conditionsvary depending on the position of the gate leaf. During the head dif-ferential tests, the Locks 27 lift gate leaf presumably rested on thesill and the Locks and Dam 26 lift gate middle leaf was ruspendedby the lifting cables. For either case, BC are applied in the
30 Chapter 3 sctural Analysis and Data Comparisn

upstream direction to the nodes along the vertical end girders on thedownstream face of the model only. Vertical BC are applied atnodes nearest the hoist locations (for the Locks and Dam 26 case)and along the bottom of the gate when it was assumed that the leafwas resting on the bottom sill (for the Locks 27 case).
f. Since both gates are welded structures, all connections (includingflange-to-web interfaces, girder and diaphragm flange intersections,and bracing-to-flange attachments) are assumed to be rigid.
Structural models
Structural models were developed and analyses were performed to sim-ulate the head differential tests only. (For the vertical load tests, it wasnot certain if the gate leaves were resting on the sill.) Loading conditionsthat were assumed to represent those in the field were applied to themodel. The general-purpose finite element program Structural Analysisand Correlation (SAC) performed the analyses. SAC has been used inbridge studies (Goble, Schulz, and Commander 1990) and is currentlyunder development for the analysis and evaluation of miter lock gates(Commander et al. 1992a, 1992b). In the current study, the followingmodifications have been made to improve SAC:
a. The quadrilateral plate-membrane element has been modified to simu-late rectangular and nonrectangular shapes. For the miter gate stud-ies, this element could represent only rectangular shapes.
b. The algorithm that calculates nodal loads for plate elements subjectto pressure loading was improved. The modified algorithm calcu-lates nodal load distribution for the new nonrectangular shapes ofthe plate elements.
c. SAC now includes vertical hydrostatic loading that is not present inmiter gates.
Data Comparison
Subsequent to analysis, the analytical and experimental strain datawere compared to evaluate the accuracy of the computer models. Usingthe structural models, strain magnitudes were computed at locations repre-senting those where the transducers were attached during the field tests.SAC computes strain in frame elements considering axial deformationsand flexure about the two cross-sectional axes. To perform these calcula-tions, SAC requires input data to define the position of the transducer.This data includes the distance along length of the element and the loca-tion of the transducer with respect to the two principal axes of the elementcross section. Strains that are computed for quadrilateral elements
C,@PW 3 Struc tura DatealyW, w 31

include effects of membrane (in-plane) displacements and flexure aboutthe two in-plane axes. Quantities that are used for data comparisons in-clude absolute error, percent error, and a correlation factor. Each of thesecomparisons is discussed.
Absolute error
The absolute error E,,,. provides a simple measure of model accuracythat is most useful in comparing one model to another. The difference inanalytical and experimental strain is computed at each transducer locationfor every load-case considered. The absolute error is the sum of the abso-lute values of the differences.
n (1)
where
eft = Field strain measurement of a single transducer for a given
head differential load
sc= = Computed strain corresponding to Eft
n = The number of transducers times the number of applied loadcases (total number of different strain readings)
Percent error
The percent error Eper provides a better conceptual evaluation of amodel than the absolute error. The summation of the differences (betweenanalytical and experimental results) squared is divided by the summationof the field strains squared. The percentage error is computed by the fol-lowing equation:
, 2 (2)
Eper=- xlOOper RI
The terms of Equation 2 are squared so they are always positive and strainvalues with the larger magnitudes have a larger effect on the error term.
Chapter 3 tructural Analysis and Data Comparison
Correlation factor
The correlation factor (CF) is a measure of how strongly two variablesare linearly related. The CF can range from -1.0 to 1.0. A CF of 1.0 indi-cates that there is a perfect linear correlation between the two variables ina positive sense (as one variable increases, the other increases). A per-fectly opposite correlation (as one variable increases, the other decreases)would result in a CF of -1.0. If the variables are uncorrelated (there is nolinear relationship between the two sets of data), a CF of 0.0 is obtained.The CF is useful in comparing analytical and experimental (field) data.The CF provides a measure of how closely the shape of the experimentaland analytical strain-versus-head differential curves match. For a goodmodel, the analtyical and experimental data should be linearly related in apositive sense (the CF should be approximately equal to 1.0). The CF iscomputed using the following equation:
n (3)
CF = i=1
where
eft, ei and n are as described above,
'if =Mean value of the measured strains
ic = Mean value of the computed strains
Coef-= Sample standard deviation of the measured strains
Yec = Sample standard deviation of the computed strains
Locks 27 Lift Gate Modeling and Analysis
The Locks 27 lift gate is a large and very complex structure that is diffi-cult to model. This structure includes a significant number of connections(requires assumptions on fixity) and many bracing elements that have dif-ferent orientations and cross-sectional shapes (each must be uniquely de-fined). Hydrostatic loads are unknown since the existing seals on the up-stream leaf (the tested leaf) are old and the top seal has been removed.Several analyses with different assumptions on loading and model BCwere developed for the Locks 27 lift gate. To determine the most appropri-ate analyses, analytical results were compared to SET2-27 (most generaltransducer layout) head differential test data of Test 272B. Modeling andresults for each analysis are described in the following sections.
ChOWq S3rfuctW a•ny and Data Compaion 33
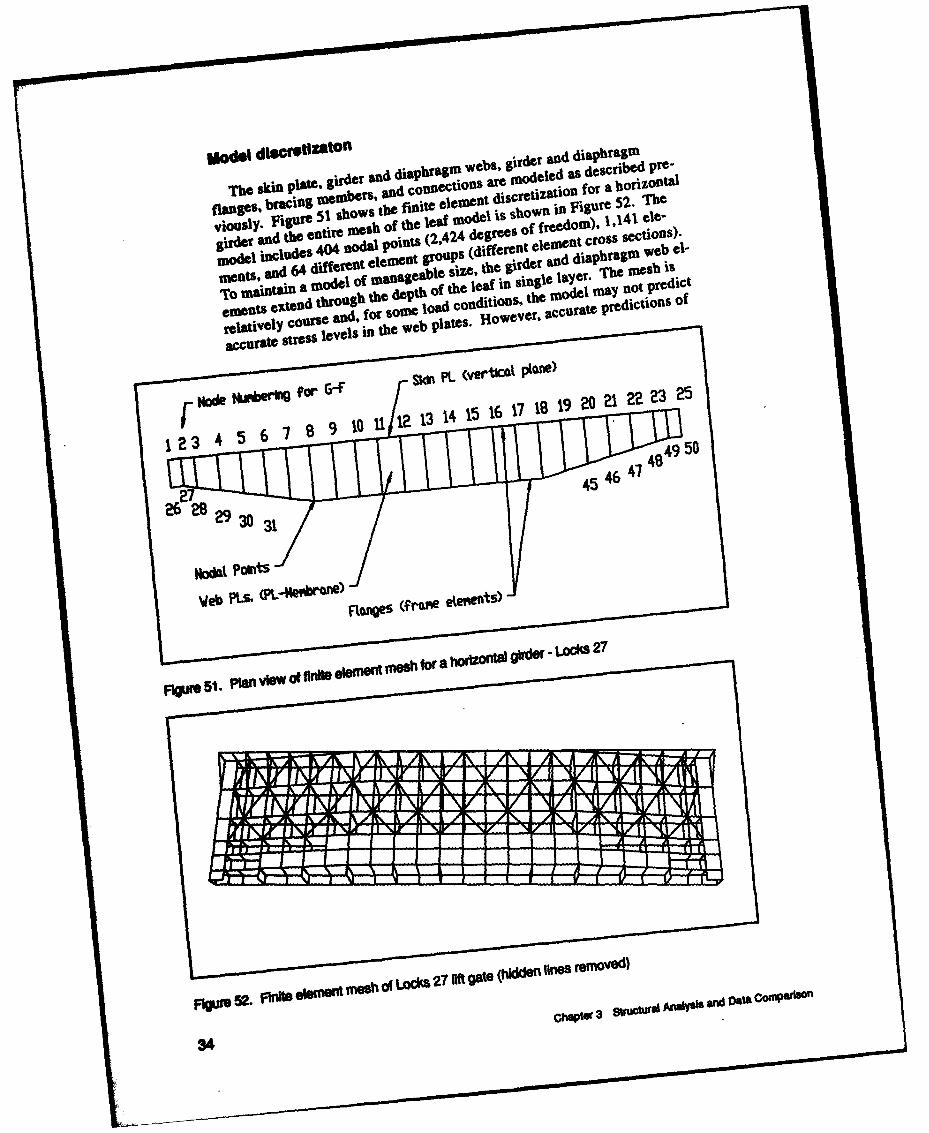
Modeljlgo~lZSt
The skin Plate- grder and diaphr agm webs, as descriaed Prehag
flanges , b racing Un m b~ ind t e~l l emetj~ ae g o ee a i ur 52s b The-
Viou~~lY FigUar 51 shows the finie ee1C i~eiafrahrzn
girder and the entire mesh of thelea (2,24del csson nFgros 52sTein)
model includes 4 04 nodal Point (2,424 fegrenteeS f dment 1 m web ele-
m e n tS , ~, , , a n 4 d f~ e l e m en~K ~ f t g ro u p S b ( d if f e reant diame "a m eS 5 C i~ l
Ito m an an amodel of m anageable size th g lrer and er 4 ~ pT hesgis
*~~t ezesdthrughthe depth Of the leaf in sin mdle laye.Telehi
~e m etiv l ,,te~ n d fh o ru s o m lo a d c o fld itioI n9 th eeod ilm a yio t n sed ic
accurate stress levels in the, web PlateS. However' accuraepditosf
1 2 3t' 4v c 5~i 6n 7a
Co4m49 5
4564

the displacement and overall load transfer behavior should be obtained. Apersonal computer would likely not have the memory capacity required toanalyze a more refined model. With the chosen discretization, the analy-sis for the Locks 27 model required approximately eight megabytes (Mb)of random access memory. The models for each analysis included thesame finite element mesh.
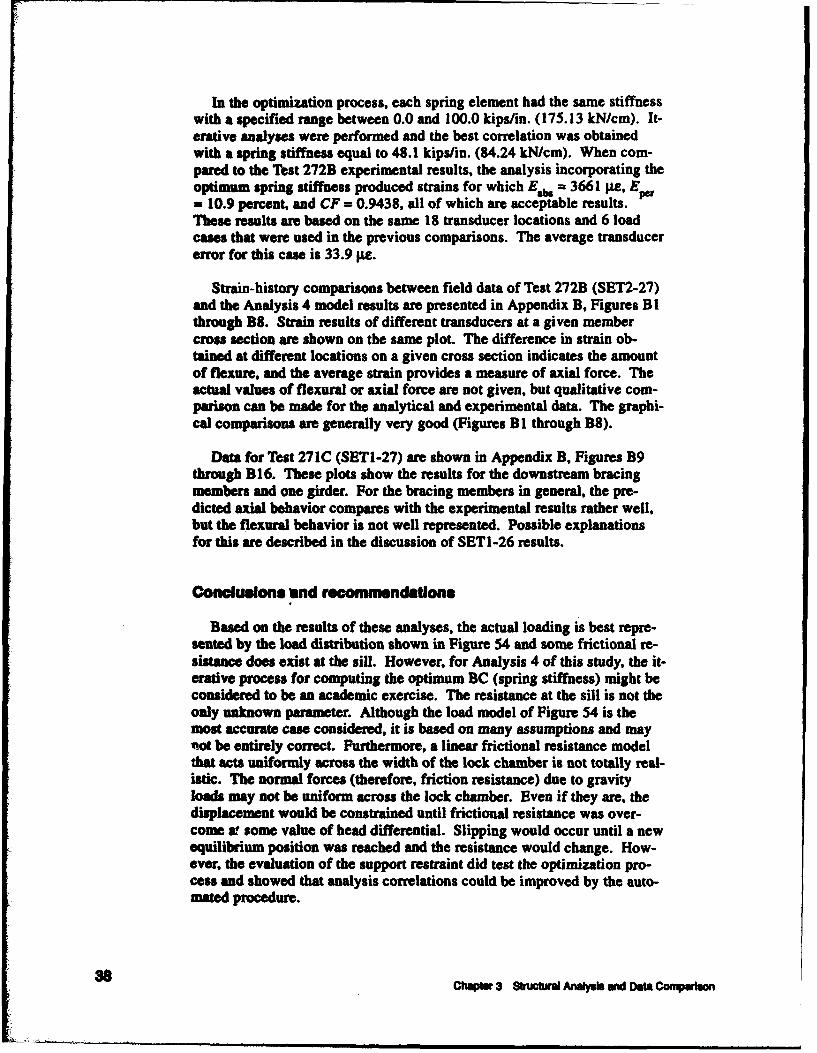
Loading and boundary conditions
Figure 53 illustrates two cases of horizontal pressure distributions for alift gate subject to static head differential loading. The first case applieswhen Seal A (the seal between the upstream sill and the upstream leaf) isdisfunctional or does not exist, and the second case is applicable whenSeal A is perfect. (Vertical loading exists but is not relevant since the leafis on the bottom sill.) For this study the first case applies, since the Locks27 lift gate (auxiliary lock) does not have a seal between the upstream silland the upstream leaf. A different (dynamic) pressure distribution mayexist if the water is flowing under the leaf (Analysis 2 discussion).
To simulate the support of the lock wall, the nodal degrees of freedomin the upstream (through depth) direction for the nodel along the verticalend girders were fixed (i.e. nodes 26 and 50 of Figure 51). BC were ap-plied only on the downstream nodes where the end girders bear against thelock wall slot. Field measurements indicated that the leaf rested on thebottom sill (Chapter 2). Therefore, vertical degrees of freedom at the bot-tom nodes of elements that represent the bearing plates were fixed. BCwere applied at only the downstream nodes of these elements. With bothupstream and downstream nodes fixed, the analysis would show uplift re-actions if the bottom girder twisted slightly.
UPPKr Pod
Figuro 53. Static hydrostatic load conditions for locks 27 lift gate
ChqSr S Strucurl Anlyi an DaaCm pa• o 35
Analysis and data comparison
AEIlyais 1. The model for this analysis included BC previously de-scribed and simulated loads corresponding to the first pressure distribu-tion shown in Figure 53. The comparison between analysis results and ex-perimental data was poor. Although the calculated CF was acceptable(CF = 0.9), the magnitudes of the computed strains were on average about150 percent larger than the corresponding measured strains. This error isattributed to inaccurate representation of loading and BC (supports).
a. Loading. For Analysis 1, static head differential loading was as-sumed. However, if there are no seals at the bottom of the leaf andat position A of Figure 53, water can flow under the leaf (Figure54). With a flow velocity, the pressure head on the upstream face ofthe leaf (shown in Figure 53) and the resultant force in the down-stream direction is reduced. Given a large enough flow velocity, thepressure could be reduced to zero at the" bottom of the leaf.
b. Boundary conditions. Test results showed that the leaf rested (atleast partially) on the sill (Chapter 2). This was considered in thedevelopment of the first model by including fixed vertical BC at thebottom nodes. However, no restraint was imposed in the horizontal(upstream) direction. Considering the structural weight and thedownward pressure applied to the top girder, it is likely that a con-siderable amount of horizontal friction resistance exists between thesill and the bearing plates.
Aalysis 2. The mesh and BC for the model of this analysis were iden-tical to those for the model of Analysis 1. However, to study the effect offlowing water, loads were simulated using the assumed pressure
_____UperPoo( Elevation
Elevation~o
cCie~ Poo, I
. •Neot dynas
ucpressureds•hstribution
Net static
Net pressure dlistribution
Rpm 54. Dnac hydrostat o condtm s for Locks 27 lift 90t
36 C-qr s t•tn•UW ANWYS ard Data CWoWphon

distribution shown in Figure 54. This distribution was developed by as-suming that the pressure varies linearly from the hydrostatic head pressureat the top P = 7(d - d2), to zero at the bottom, where y is the unit weightof water and d and d2 are defined by Figure 54. The total horizontalforce for this distribution is less than one-half of that for the static distri-bution.
The comparison of analytical and experimental data for this case ismuch better than that for Analysis 1. Analysis including the new loadmodel resulted in the following comparison quantities: E = 4829microstrain (iE), EPr = 19.2 percent, and CF = 0.9357. Ile1se results arebased on the comparisons of 18 strain channels and 6 different load cases(chamber pool elevations). The average transducer error is equal to E,divided by the number of strain channels used in the comparison and thenumber of load cases applied in the analysis. The average transducererror for this case is 44.7 ps. The strain magnitudes improved signifi-candy compared to those computed for Analysis 1. However, the amountgirder flexure computed from the analysis was consistently greater (by ap-proximately 50 percent) than that computed from the field measurements.The greatest difference was in the lower girders (girders C and D of Fig-ure 4). Since the flexure in the girders was still overestimated, the fric-tional resistance along the bottom sill was assumed to have a significanteffect on the behavior.
Analysls 3. Analysis 3 was conducted to examine the effects of thefrictional resistance at the bottom sill. The model of Analysis 2 was modi-fied by fixing the horizontal (upstream direction) degrees of freedom forthe bottom downstream nodes. All other loading and BC were identical tothose included in Analysis 2. Analysis 3 predicted strain magnitudes thatwere significantly reduced from those predicted in previous analyses. Infact, the analytical strains were considerably less than the measuredstrains.
Analysls 4. Extreme cases for horizontal BC along the sill were ap-plied in Analysis 2 (free) and Analysis 3 (fixed). The computed resultsfrom these cases enveloped the measured strain magnitudes. Apparently,the actual support conditions (in the upstream direction) along the bottomsill are not fixed or free. To simulate the actual support conditions, elasticspring elements of unknown stiffness were connected between the bottomnodes of the gate leaf and fixed nodes located in the plane of the sill. Thespring elements replaced the fixed horizontal BC and were oriented to sim-ulate elastic restraint in the horizontal (upstream) direction. An optimiza-tion procedure in SAC (Commander et al. 1992a) was employed to com-pute the unknown stiffness. The optimization procedure is simply an itera-tive process in which unknown terms can be varied within a specifiedrange of values until results are of acceptable accuracy. The accuracy ofthe model (optimization objective function) is based on the E,b. value ofEquation 1.
OM~ler 3 ftndmr, .Myh WW• Data Cwwlo 37
In the optimization process, each spring element had the same stiffnesswith a specified range between 0.0 and 100.0 kips/in. (175.13 kN/cm). It-erative analyses were performed and the best correlation was obtainedwith a spring stiffness equal to 48.1 kips/in. (84.24 kNlcm). When com-pared to the Test 272B experimental results, the analysis incorporating theoptimum spring stiffness produced strains for which E£, -- 3661 pe, E P"- 10.9 percent. and CF = 0.9438, all of which are acceptable results.These results are based on the same 18 transducer locations and 6 loadcases that were used in the previous comparisons. The average transducererror for this case is 33.9 ge.
Strain-history comparisons between field data of Test 272B (SET2-27)and the Analysis 4 model results are presented in Appendix B, Figures B 1through B8. Strain results of different transducers at a given membercross section are shown on the same plot. The difference in strain ob-tained at different locations on a given cross section indicates the amountof flexure, and the average strain provides a measure of axial force. Theactual values of flexural or axial force are not given, but qualitative com-parison can be made for the analytical and experimental data. The graphi-cal comparisons are generally very good (Figures B 1 through 88).
Data for Test 271C (SETI-27) are shown in Appendix B, Figures B9through B16. These plots show the results for the downstream bracingmembers and one girder. For the bracing members in general, the pre-dicted axial behavior compares with the experimental results rather well,but the flexural behavior is not well represented. Possible explanationsfor this are described in the discussion of SET 1-26 results.
Conclusions and recommndatlons
Based on the results of these analyses, the actual loading is best repre-sented by the load distribution shown in Figure 54 and some frictional re-sistance does exist at the sill. However, for Analysis 4 of this study, the it-erative process for computing the optimum BC (spring stiffness) might beconsidered to be an academic exercise. The resistance at the sill is not theonly unknown parameter. Although the load model of Figure 54 is themost accurate case considered, it is based on many assumptions and maynot be entirely correct. Furthermore, a linear frictional resistance modelthat acts uniformly across the width of the lock chamber is not totally real-istic. The normal forces (therefore, friction resistance) due to gravityloads may not be uniform across the lock chamber. Even if they are, thedisplacement would be constrained until frictional resistance was over-come a& some value of head differential. Slipping would occur until a newequilibrium position was reached and the resistance would change. How-ever, the evaluation of the support restraint did test the optimization pro-cess and showed that analysis correlations could be improved by the auto-mated procedure.
38 Chqrw 3 twwua kayi WW Data Coqwlm
Since neither the load model or BC can be defined with a high degreeof certainty, any further speculation concerning the accuracy of the analyti-cal model would be somewhat trivial. However, results from these studiescan be used in planning of future studies. When obtaining test data, it isdesired to eliminate as many unknowns as possible. The following are rec-ommendations for future experimental studies:
a. The use of pressure transducers should be considered. Pressure trans-ducers could be attached to the upstream face of the skin plate to ob-taining data for development of a realistic load model.
b. The uncertainty in the BC along the bottom sill could be eliminatedsimply by testing the leaf when it is raised a short distance from thesill. To determine the effect of the frictional resistance, the leafshould also be tested in its lowest position (resting on the sill). Acomparison of data obtained with the gate in the two positionswould provide significant information. The data would showwhether or not the sill was providing significant horizontal resis-tance. If horizontal resistance is significant, the data would pro-vide information that could be used to develop an appropriate resis-tance model.
Locks and Dam 26 Uft Gate Modeling andAnalysis
The general configuration of girders, diaphragms, and bracing mem-bers for the Locks and Dam 26 lift gate leaf is similar to that of the Locks27 leaf. However, the Locks and Dam 26 lift gate leaf is considerablysmaller, the construction is simpler, and there are significantly fewerunique cross sections (there is more repetition in member section types).Based on field observations, the seals between the leafs and lock walls donot leak significantly, so hydrostatic loading is well known. At the bottomof the leaf, frictional resistance does not exist because the leaf is sus-pended. Due to these conditions, the modeling and analysis for the Locksand Dam 26 lift gate leaf was much simpler compared to the Locks 27case. The following sections describe the development of the analyticalmodel, analyses, and comparison of analytical and experimental data.
FE model
The model for the middle leaf was developed using the same generalmodeling considerations used for the Locks 27 models. The general con-figuration of the mesh and representation of various members were thesame. However, compared to the Locks 27 case, model development tooka fraction of the time and the size of the model was smaller. Figure 55shows the finite element model of the middle leaf. The model consists of
Chapler 3 Skuord AnmW mid Dsaa comprison 39
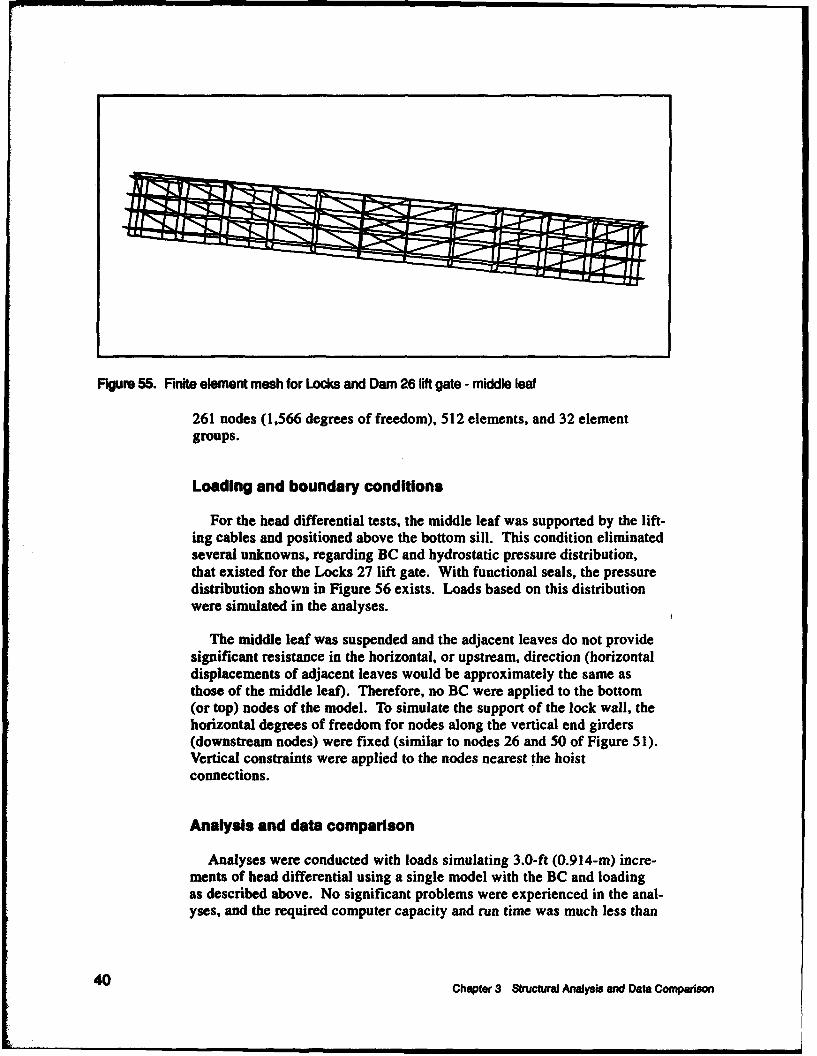
Figure 55. Finite element mesh for Locks and Dam 26 lift gate - middle leaf
261 nodes (1,566 degrees of freedom), 512 elements, and 32 elementgroups.
Loading and boundary conditions
For the head differential tests, the middle leaf was supported by the lift-ing cables and positioned above the bottom sill. This condition eliminatedseveral unknowns, regarding BC and hydrostatic pressure distribution,that existed for the Locks 27 lift gate. With functional seals, the pressuredistribution shown in Figure 56 exists. Loads based on this distributionwere simulated in the analyses.
The middle leaf was suspended and the adjacent leaves do not providesignificant resistance in the horizontal, or upstream, direction (horizontaldisplacements of adjacent leaves would be approximately the same asthose of the middle leaf). Therefore, no BC were applied to the bottom(or top) nodes of the model. To simulate the support of the lock wall, thehorizontal degrees of freedom for nodes along the vertical end girders(downstream nodes) were fixed (similar to nodes 26 and 50 of Figure 51).Vertical constraints were applied to the nodes nearest the hoistconnections.
Analysis and data comparison
Analyses were conducted with loads simulating 3.0-ft (0.914-m) incre-ments of head differential using a single model with the BC and loadingas described above. No significant problems were experienced in the anal-yses, and the required computer capacity and run time was much less than
40 Chapter 3 Structural Analysis and Data Comparson

H~~lNydwsta RI
Hj,&dmdtic Pnmam
Figure 56. Hydrostatic loading applied for Locks and Dam 26 analysis
that of the Locks 27 models. To verify the analyses, analytical data werecompared to head differential test data of both SETI-26 and SET2-26.
SET1-26. For the initial data comparisons, computed strains were com-pared with the experimental data of Test 261 A (chamber drop test). TheSETI-26 data were used to evaluate the overall behavior of the modelsince the transducer configuration was the more general layout. The com-parisons resulted in E = 6.6 percent, CF = 0.9715, and an average errorof 40.3 pe. The measured strains reached levels of 500 microstrain, there-fore, an average error of only 40 pz is acceptable. Strain-history plotscomparing the analysis and SETI-26 data are presented in Appendix B,Figures B 17 through B26. Each plot includes data for a number of loca-tions at a given member cross section.
Figures B 17 through B23 show the analytical (COMP) and experimen-tal (FIELD) girder strains at various girder cross sections. Each one ofthese comparisons is quite good. The flexural response (indicated by thedifference in upstream and downstream flange strain) of the girders wasgenerally over predicted by the analysis. However, the differences areslight and the computed strain values are acceptably accurate. FiguresB24 and B25 show strain comparisons for two of the bracing members.The results show that the predicted axial behavior (indicated by the aver-age of cross-sectional strains) in the bracing elements is reasonably accu-rate. However, the flexural response of the bracing members determinedusing the field strains are not well represented by the analysis results.(Figure B26 shows the erratic readings obtained with the channel 17 trans-ducer where slippage of the transducer occurred.)
With a model of this scale, it is not possible to capture the flexural be-havior of the bracing members due to the following considerations:
OMW 3 -hM*SM an Da o 41

a. The connection details are represented by a single point at member in-tersections. The intersection between members in the actual struc-ture consists of a finite dimension (relatively large compared to thecross-sectional dimensions and lengths of the members).
b. The bracing members are typically welded to the girder flanges alongthe flange of the angle or tee section, and the web is free. There-fore, it is likely that a substantial amount of shear lag is present atthe ends of the bracing members. It is not possible to model shearlag without a significantly more detailed analysis.
c. The presence of member warping or out-of-straightness due to fabri-cation tolerances or residual stresses can significantly affect thestrain readings when an axial force is applied. For example, if ten-sion is applied to a bent bracing member, strain readings will indi-cate flexural behavior as the member is straightened, even if no endmoments are present. (No visible out-of-straightness was observedduring field testing.)
SET2-26. To study the effect of the cracked diaphragm, the analyticalstrains were compared to the measured strains of the SET2-26 (Figures 46through 50) chamber drop test (Test 262B). Strain-history comparisonsfor Test 262B are provided in Appendix B, Figures B27 through B30. Sim-ilar to SETI-26 results, the comparisons for axial behavior of the bracingelements are acceptable, while the comparisons for flexural behavior arepoor. Review of the diaphragm flange strain data yields some interestinginsight regarding head differential vertical loading. The structural re-sponse due to vertical loading provides an explanation for the occurrenceof cracking in the flange plate.
a. Vertical loading. The top girder web of a submerged lift gate leafforms a horizontal damming surface. The magnitude of the head dif-ferential vertical load is dependent on the difference between thepressures acting on the upper and lower surfaces of the girder web.Pressure due to the hydrostatic head of the upper pool acts on theupper surface and when the chamber pool elevation is above the topgirder, pressure due to the hydrostatic head of the chamber pool actson the lower surface. When the chamber pool level is below the topgirder, the pressure on the lower surface is zero. As the chamberpool is dropped from the upper pool elevation to the top girder eleva-tion, the vertical load increases proportionally with the head differ-ential. As the chamber pool continues to drop, the vertical load isdependent only on the upper pool elevation. A graph of the verticalload pressure with respect to head differential for this test is shownin Figure 57. The loading consists of a linearly increasing force upto a head differential of approximately I I ft (3.35 m) (difference be-tween upper pool and top girder elevations) and is then constant forthe remaining chamber drop.
42Chapter 3 Sotructra Analysis and Data Compariso

14
12
100~8:
0
0
0, 2 4 6 ,8 10 12 14 16 18 20Head differential (ft)
Figure 67. Vertical load pressure as a function of head differential
b. Structural response. All of the strain histories obtained from the dia-phragms and diagonal braces have the same shape as the verticalloading shown in Figure 57. Although the head differential horizon-tal load continues to increase as the chamber pool drops below thetop girder (approximately 11-ft (3.35-m) head differential), thestrains remain relatively constant for head differential greater than11 ft (3.35 m). This indicates that these elements are primarily af-fected by the vertical loading only. Therefore, it is reasonable to as-sume that the crack at the girder and diaphragm flange interfacemay be caused by deflections induced by the vertical loading.
Conclusions
The SETI-26 results show that the model of this analysis provides areasonable representation of the leaf. The general behavior was well rep-resented as indicated by the girder responses and the overall error compari-sons. However, with a model of this scale it was not possible to simulatethe flexural behavior of the bracing members. The Test 262B results pro-vide significant information on vertical load response of lift gates. Thefollowing paragraphs discuss the structural behavior and provide an expla-nation on the occurrence of diaphragm flange cracking.
Chater 3 Strucural Analysis and Data Comparison 43

Under vertical loading, deflection induced stresses may have contrib-uted to the formation of the crack at the girder and diaphragm flange inter-face. If sufficient horizontal shear resistance were present between eachgirder, the entire leaf would act as a large beam under distributed verticalload. The gate leaf would bend in the plane of the leaf about its neutralaxis with the upper girders subject to compression and the lower girderssubject to tension. This type of response is described by the Euler-Ber-noulli beam response in which plane sections remain plane and perpendic-ular to the neutral axis. Given this type of response, the diaphragm mem-bers would remain straight and would rotate to remain perpendicular tothe girders. However, as indicated by recorded strains data, the deforma-tion of the gate leaf was more representative of shear deformation inwhich vertical planes tend to remain vertical.
Strains recorded at the edges of the diaphragm flange varied in sign(compression and tension) depending on the position of the transduceralong the length of the diaphragm. The signs of the measured strains (aswell as the position of the crack) indicated that a considerable amount oflateral bending was induced in the flange plate and that each diaphragmwas forced to deflect in an S-shape. This type of deflection is consistentwith shear deformation as indicated by Figure 58. The figure shows trans-ducer locations and the respective strain directions (C = compression andT = tension). Based on the measured strains, it is apparent that the crackin the flange was at least partially caused by high tension and shearstresses at the diaphragm flange-girder flange interface. This is a result ofthe diaphragm displacement resulting from the shear deformation of thegate leaf. The high depth-to-length ratio of the gate leaf and insufficientshear resistance provided by the diagonal braces allow significant sheardeformation to occur as opposed to normal flexure deformation. Underdistributed vertical load:
a. Horizontal girders deflect vertically and bend in the plane of the leafabout their weak axes, much like a simply supported beam subjectto uniform load. Under vertical distributed loading, the slope(change in vertical deflection per unit length) of the girder flangevaries from maximum at the ends to zero at midspan since the verti-cal shear in the leaf is greatest near the ends.
b. The welded connections between the girders and diaphragms do notallow any relative rotation between the diaphragm flange and thegirder flange. The diaphragm flanges are considerably smaller andmore flexible than the girder flanges. Therefore, the ends of the dia-phragms are forced to rotate with the slope of the girder flange.
c. The diaphragms are forced to deflect in double curvature (S-shape) tomaintain continuity with the girder flanges at each end of the dia-phragm. This deformation results in large tensile (and compressive)stresses at the ends of the of the diaphragm flanges (Figure 58) andlarge shear stresses along the length.
44 Chapter 3 Structural Analysis and Data Comparson
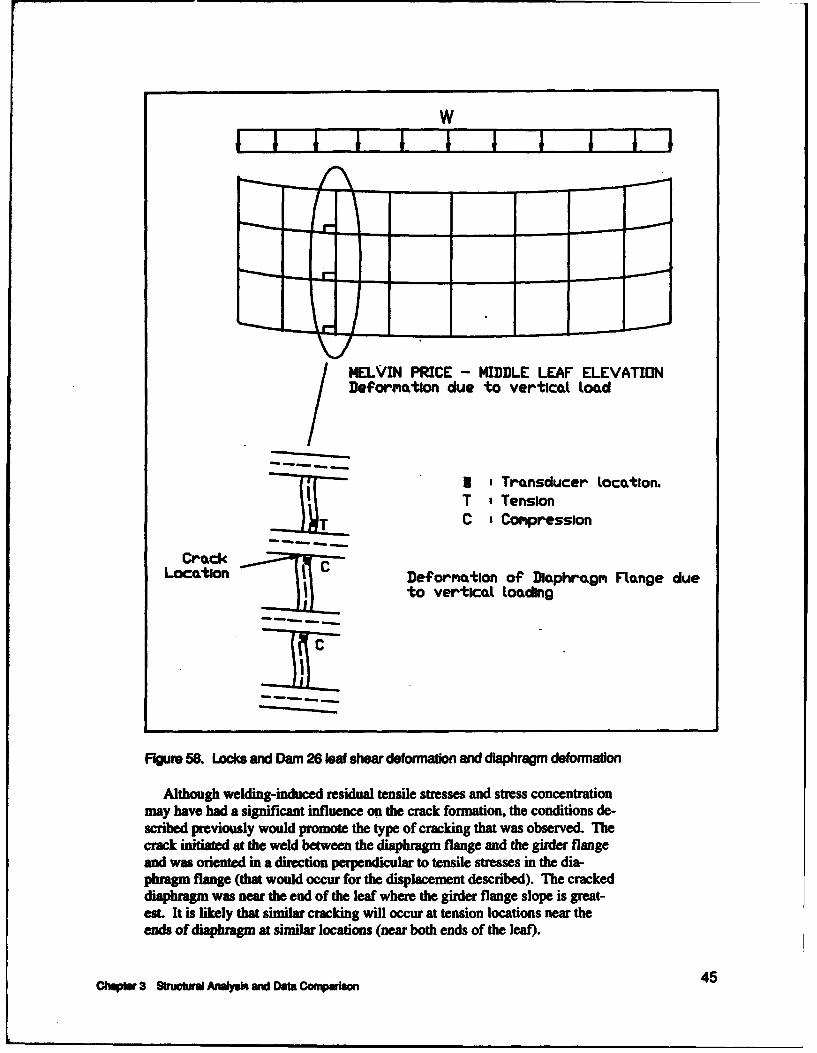
w
r-- -
MELVIN PRICE - MIDDLE LEAF ELEVATIONDeformutlon due to verticat Load
I a Transducer LocatIon.T , TensionC , Compression
CrockLcmatlon 1 CDeformation of Diaphrugm Flange due
to verticat loading
Figure 58. Locks and Dam 26 leaf shear deformation and diaphragm deformation
Although welding-induced residual tensile stresses and stress concentrationmay have had a significant influence on the crack formation, the conditions de-scribed previously would promote the type of cracking that was observed. Thecrack initiated at the weld between the diaphragm flange and the girder flangeand was oriented in a direction perpendicular to tensile stresses in the dia-phragm flange (that would occur for the displacement described). The crackeddiaphragm was near the end of the leaf where the girder flange slope is great-est. It is likely that similar cracking will occur at tension locations near theends of diaphragm at similar locations (near both ends of the leaf).
Chaplr 3 Swl•u Analys and Data Comison 45
4 General Conclusions
The objectives of this study were to measure the behavior of verticallift lock gates experimentally and to develop modeling and analysis proce-dures for design and evaluation of vertical lift gates. An evaluation sys-tem that incorporates a realistic analytical approach and experimental dataprovides a considerable amount of information that is not generally avail-able. Experimentally measured strain data provide direct information onthe structural response and a means of determining the accuracy of theanalysis. A representative analysis can then provide the information re-quired for design and evaluation. The ability to obtain a substantialamount of structural response data from a vertical lift gate with minimalimpact on lock traffic was demonstrated with good success at both locksites. Based on experimental strain data obtained during the field tests, itwas determined that the finite element models of the vertical lift gates pro-vided reasonably accurate predictions of the general behavior. The combi-nation of experimental and analytical data provided quantitative informa-tion on lift gate behavior and loading conditions.
Data comparisons performed for the Lock 27 lift gate leaf were used toestablish appropriate load conditions and BC. Based on comparison of an-alytical and experimental data, it was concluded that the dynamic loadmodel (Figure 54) is most appropriate. In an attempt to evaluate the ef-fect of the horizontal friction determined to be present along the bottomsill of Locks 27, a parameter optimization algorithm was utilized. Un-known BC were simulated with elastic supports and a stiffness constantwas computed automatically by the optimization process. The model opti-mization technique resulted in approximately a 10-percent improvement inE comparing measured and computed strains. Through the Locks and& 26 study, it was verified that the downstream bracing members areprimarily affected by vertical loading, and a probable cause for the crack-ing of a diaphragm flange was obtained. The following sections providerecommendations for future experimental and analytical studies.
46 Chapr 4 Gweral Coclusiomn
Experimental Studies
During instrumentation of each structure, the primary concerns werehow to efficiently place cables through the structure so that gate leaf oper-ation would not be inhibited, and whether or not the method of attachingthe transducers with tabs and cyanoacrylate glue would be suitable for un-derwater use. A considerable amount of experience that will aid in im-proving field procedures for future testing was gained during the fieldtests at Locks 27 and Locks and Dam 26.
Setup
a. As opposed to installing each transducer cable separately (as wasdone in the Locks 27 tests), groups of cables that connect to trans-ducers in the same area on the structure should be wrapped togetherin groups (as was done during the Locks and Dam 26 test). Thisgreatly reduces the time required for instrumentation setup andremoval.
b. Prior to running these tests, there was significant concern on the useof underwater strain transducers and their method of attachment.The waterproof strain transducers performed properly with the ex-ception of a few that became inoperative during testing. Consider-ing the cost of the waterproof transducers, it may be beneficial toimprove the durability of the transducers. The tests proved that themethod of attaching the submergible transducers with tabs and cya-noacrylate glue works quite well. The tabs remained intact underrelatively extreme conditions (all transducers were submerged andsome of the transducers and the cables were subject to water rushingthrough leaking seals and drain holes).
Additional test position and Instrumentation
Many uncertainties in loading and support conditions of vertical liftgates exist, and these uncertainties could be quantified through additionaltesting and analytical procedures. When ambiguous loading or BC exist,testing procedures should be designed to determine as many unknowns aspossible. For example, the Locks 27 data comparisons confirmed that asignificant amount of horizontal resistance (upstream direction) existed atthe bottom sill and that the initial load assumptions were incorrect. Theeffects at the bottom sill could have been evaluated more efficiently byconducting additional head differential tests with the leaf lifted above thesill. The comparison of field data (for the leaf on the sill and above thesill) would indicate the amount of frictional resistance at the bearing loca-tions. In future tests, pressure. transducers could be attached to the skinplate at various elevations to provide accurate data on the actual pressure
Chqi• 4 Gsru Condudons 47
distribution. A realistic load model could then be developed, based onmeasured pressures at various depths along the skin plate.
Analysis
For the models of this study, the flexure of the main structural mem-bers and the axial behavior of the smaller bracing elements were well rep-resented. However, the models did not have sufficient detail to accuratelyreproduce the observed flexural response of the bracing members. Flex-ure does occur due to various secondary effects such as eccentricity of theconnection details, shear lag, and any existing out-of-straightness in thebracing members. If a more realistic representation of the bending in thesmaller members is necessary, the analysis program should be modified toinclude the effect of connection size and geometry. In cases where theconnection details are relatively large compared to the member length,such as the diaphragm flanges of the Locks and Dam 26 lift gate, connec-tion modeling may be beneficial.
A significant goal of this project is to develop a testing and analysissystem for vertical lift gates that can be used for evaluation purposes on aroutine basis. The information obtained during this study will aid in im-proving the efficiency of future studies. The following are considerationsfor future analytical work.
a. The analyses of this study provided reasonable comparisons with thefield data, but the time required to generate the models and the anal-ysis time for each were rather extensive. An automated model gen-eration program (preprocessor) tailored for vertical lift gates wouldbe beneficial to perform this type of analysis on a routine basis.Such a program would automatically develop the finite elementmesh given the basic geometry of a gate leaf. Due to the variety oflift gate configurations, it would be difficult to develop a generalprogram. However, development of software that simplifies themesh generation process is feasible.
b. If only general behavior (flexure of girders and diaphragms) is to bemodeled, then a grid analysis approach may be appropriate for rou-tine analysis. The Locks 27 analysis requirements exceeded the lim-its of the typical personal computer. With a 3-D analysis procedure,personal computer limitations are likely to be a constraint for theanalysis of large structures. It may be beneficial to investigate theuse of simpler analysis procedures using the existing field data ac-quired during this study. The 3-D approach will likely be requiredfor detailed cases such as representation of strains in bracingmembers.
48 Chapter 4 General Conduslons
References
Commander, B. C., Schulz, J. X., Goble, G. G., and Chasten, C. C.(1992a). "Computer-aided, field-verified structural evaluation; Report1, Development of computer modeling techniques for miter lockgates," Technical Report ITL-92-12, U. S. Army Engineer WaterwaysExperiment Station, Vicksburg, MS.
(1992b). "Computer-aided, field-verified structuralevaluation; Report 2, Field test and analysis correlation at John HollisBankhead Lock and Dam," Technical Report ITL-92-12, U. S. ArmyEngineer Waterways Experiment Station, Vicksburg, MS.
Goble, G. G., Schulz, J. X., Commander, B. C. (1990). "Simple loadcapacity tests for bridges to determine safe posting levels: Finalreport," submitted to the Pennsylvania Department of Transportationby the Department of Civil and Architectural Engineering, Universityof Colorado, Boulder, CO.
Headquarters, U.S. Army Corps of Engineers. (1962). "Engineering anddesign, vertical lift crest gates," Engineer Manual 1110-2-2701,Washington, D.C.
(1984). "Engineering and design, lock gates and operatingequipment," Engineer Manual 1110-2-2703, Washington, D.C.
(1988). "The 1988 Inland Waterway Review," Institute forWater Resources, Ft. Belvoir, VA.
U.S. Army Engineer District, St. Louis. (1990). "Locks No. 27Mississippi River, report on: lift gate study," St. Louis, MO.
Riskues 49

Appendix AVertical Load Test ExperimentalData
This appendix includes graphical plots of the experimental data ob-tained at Locks 27 for Test 271A (vertical load test). Strain values for var-ious transducers (identified by the DAS channel number in the plot leg-ends) are presented as a function of testing time. The transducer locationsare shown in Figures 4 through 15 in the main text. Each strain historyshows the same characteristics. An abrubt change in strain occurs at thebeginning of the test (as the gate leaf was lifted from the sill), a constantstrain level is maintained for most of the testing time (as the gate contin-ued to be lifted and lowered), and at the end of the test the plots show asudden return to near-zero strain (as the gate leaf was returned to the sill).The occurrence of strain at each location is attributed to the effect of struc-tural weight being transferred from the sill to the lifting chains. Whileresting on the sill, member strains due to structural weight should be nearzero. Since each strain value returns to near zero, this indicates that thegate was at least partially resting on the bottom sill at the beginning of thevertical load test.
Appenix A Veilca Load Tom EiperimenW Daam Al

5IW IN NOWS AF KORMNS 22 27Dead LOaW Ubuka at Jekt 05
ML
ta
a 1
amFO o~ F1T(k"
-46a.L 3.a . 4. 5
MME FRau OECOsHMs OF TES (imhuto)FOLD _ 11
Figure AlZ Vertical load strain histories (SETi -27), Channels 22I andl 27
A2 ~ ~ ~ ~ Da Leadid Abhi atrW Loadt Tet04enlDt
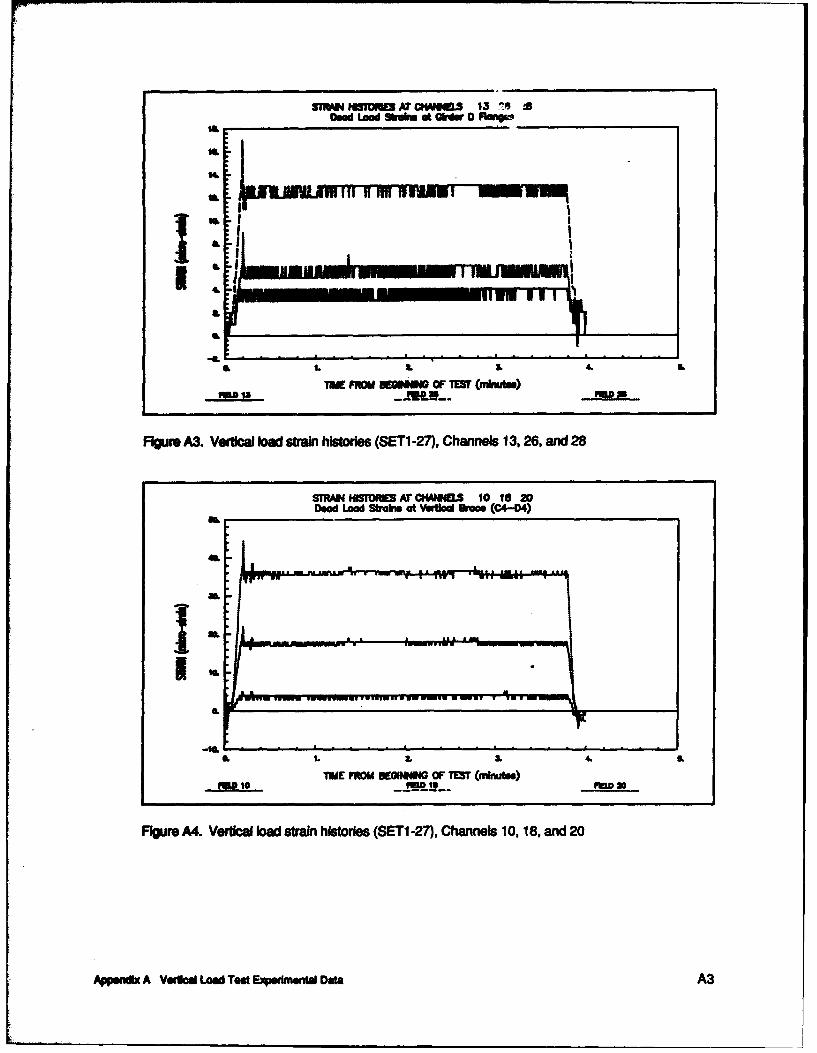
STIV4d iaiOW A7 CHUMSZ 13 !S±kad Load gtuk. at Okrdw D F~mi_____________
IL
4.
.. . .2 . .
'TWM FROM SEWINMW OF 151' (kNjuAN)
Flpre A3. Vertical load strain histories (SETI -27), Channels 13, 26, and 28
sTRmNNISTORS Ar CHAMOS 10 IS WDead Lad Sbabia at V"WtWon uc ("4-DM)
1 0. L&4
11ME FROM SENUM4 OF TEST (minutas)
Figre A4. Vertical loa strain histories (SET1 -27), Channels 10, 18, and 20
Appeflix A Vwilcd Load Too Expautmonta Data A3

SIWNNIOUA NOWMLS 9 15 16DOd Lood Sbrdm at Mvond Om. (04-CS)
UL"IM
Lm L • 4
5.1. 3. & S.
lEM FRM EWUWM OF 1TM (mnutes).me s o e m is o. -r myr,
Figure AS. Vertical load strain histories (SETI -27), Channels 9, 15, and 16
SIMN Hsi AT CKWNVEL 12 17Dead Lod Strak at Mug" buss (04-4C3)
145.;
4aL
SL
31. 2 3. 4. L
"UK FROM -EMM OF TE' (mkntes).m 12 FL 17
Figure A6. Vertical load strain histories (SET1 -27), Channels 12 and 17
A4 Appenh A Vertical Load Test Experimental Data
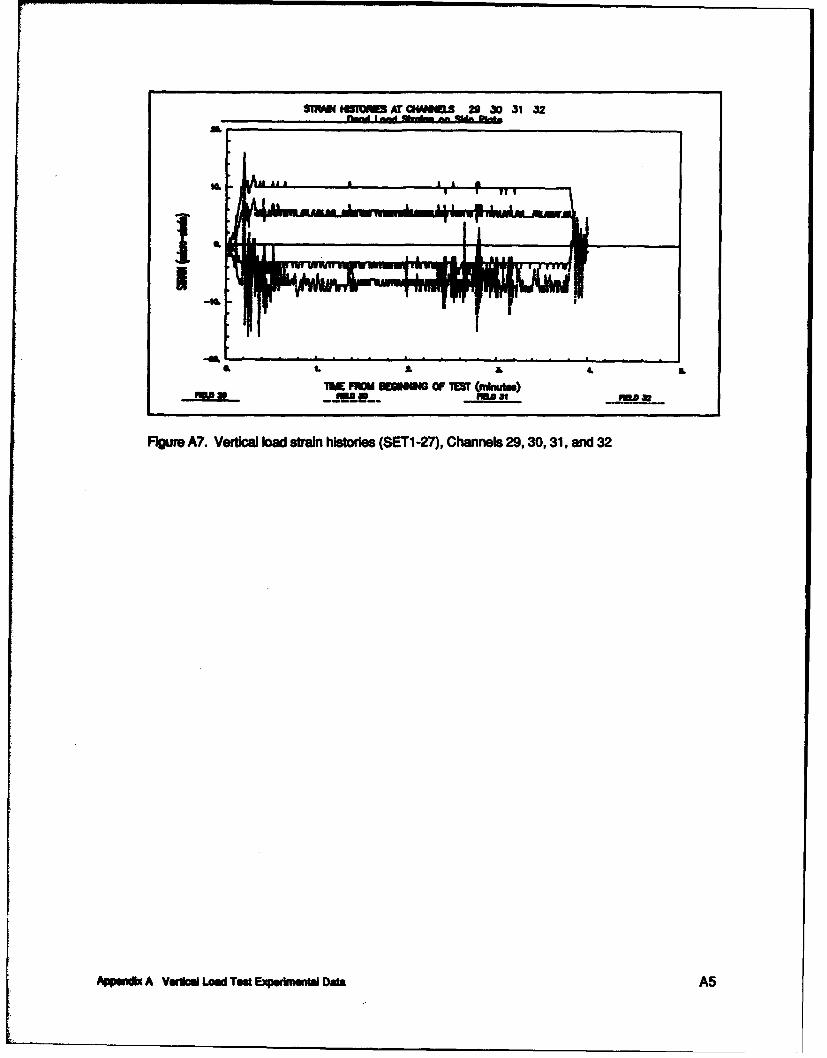
I I
STRIN H1 fCATN•.S 29 30 31 32
1. I. a. 4. A
MI FROM OM1MO OF TT (n*Ms)
Figure A7. Vertical oad strain histories (SET1-27), Channels 29, 30, 31, and 32
App-ndix A Vedkal Load Teto Eqmtl Data A5

Appendix BHead Differential Test Data
This appendix includes graphical plots of experimental and analyticaldata for head differential Tests 272B, 271C, 261A, and 262B. The graphi-cal representations of the strain data provide a visual means of examiningthe structural response of the lift gates that is useful in evaluating thestructural behavior and quality of the analyses. Strain measurements andthe analytical data for various DAS channel numbers are plotted as a func-tion of head differential. Channel numbers correspond to the transducerlocations shown in the main text in Figures 4 through 15 for SET1-27, Fig-ures 16 through 27 for SET2-27, Figures 31 through 44 for SETI-26, andFigures 45 through 49 for SET2-26. Experimental data for each channelare plotted using different types of continuous lines, and computed strainscorresponding to each channel are plotted by different marks. The plotlegends show which line type and marker type is associated with a particu-lar data channel. The experimental and computed data is referred to in thelegend by the terms FIELD and COMP, respectively, followed by the asso-ciated data channel numbers.
Appenix BS HwWOhrW Test 0a BI
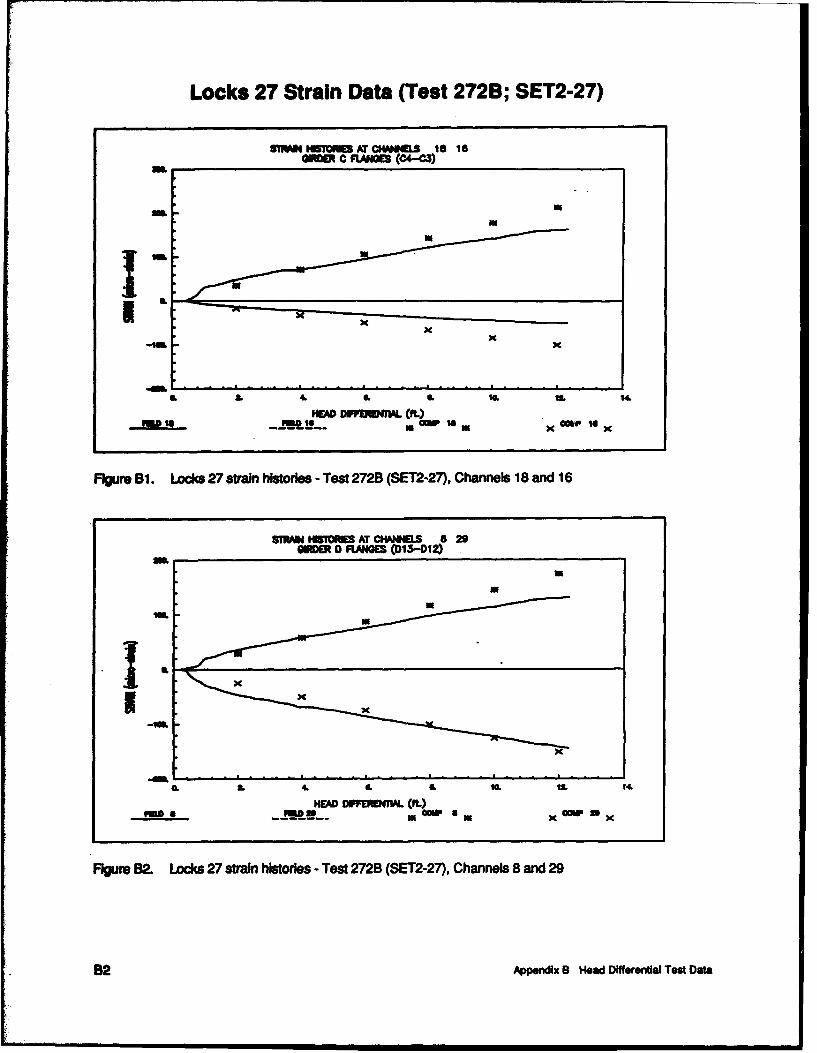
Locks 27 Strain Data (Test 2729; SET2-27)
SIWD4 IMIUTCaTOMELtS 18 16UL MMn C RANOM (04-03)
Lm
Isx
xK
S. I.4. IL L.1. 9 14
HEAD DUP!fNnAL (Mt)
Figure 81. Locks 27 strain histories, - Test 272B (SET2-27), Channels 18 and 16
STRWN HISOIES aT CKV4AELS 8 29GDM D FLAMM~ (01-3-012)
MU
xU
L* K
2.A 4. FRDfL (L)I M1
PUD No an~i xI x n
Figure B2. Locks 27 strain histories - Test 272B (SET2-27), Channels 8 and 29
82 AppendIx B3 Head Diffmen~aI Test Data
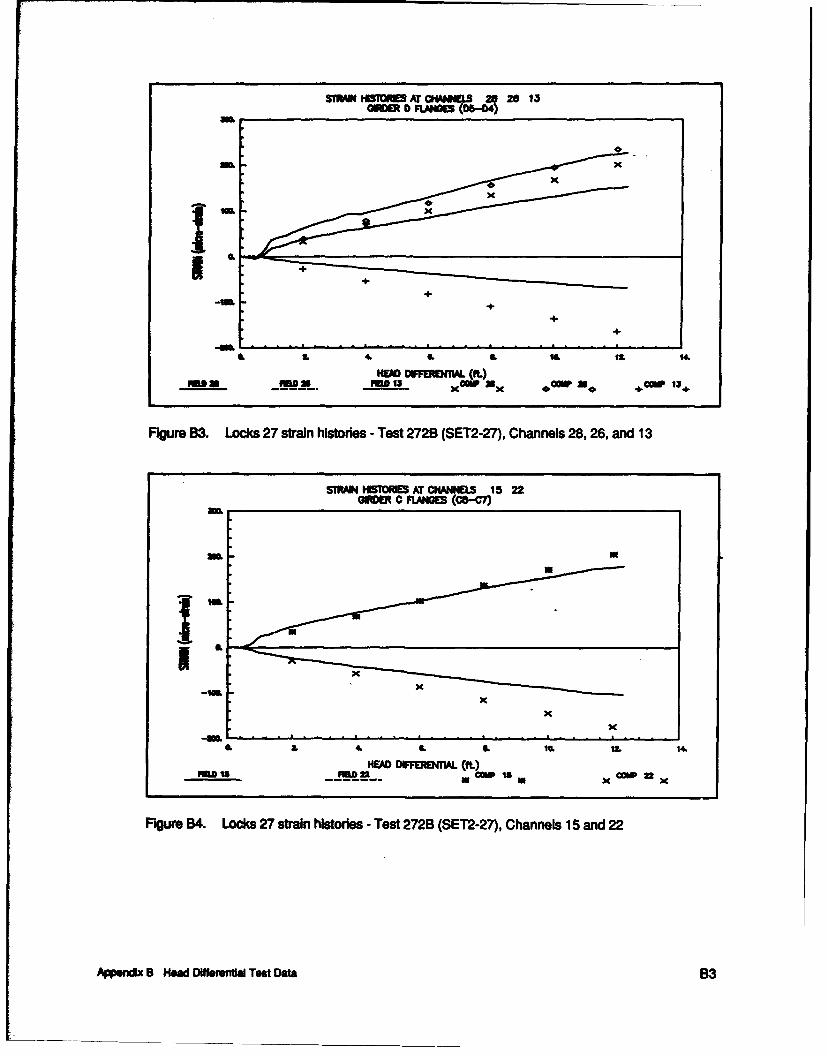
STRAIN H410M Ar CHANNELS 26 28 13ID RANGES (05-04)
UL x
xx
x
a+
0. 3. I. L. SL IL.* 14.
HEMf OUFERWOKn Cf L35U -urn UDIM 9 CW X x 0O .290 + 134.
Figure 63. Locks 27 strain histories - Test 272B (SET2-27), Channels 28,26, and 13
STRPN HlSTOUS AT CUW4IMIS 15 220RC PLANGES (s-c7)
UL
IL
-1W00.WM Q
FEL 15 FMnaw Is xcw2
Figure 64. Locks 27 strain histories - Test 272B (SET2-27), Channels 15 and 22
Apendix B Heed Differeni Test Data B3
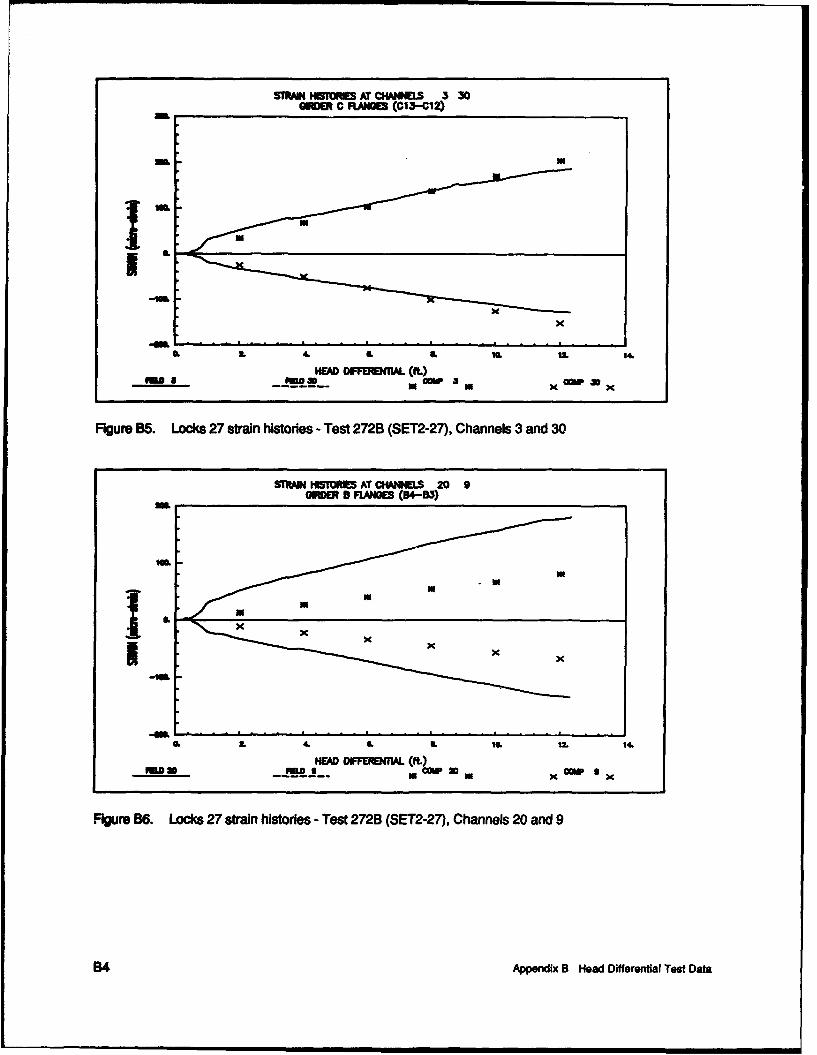
STRAIN Me1~ AT CK41SELS 3 30URC FLANOU (013-C12)
I'L
m-- a - o --am :;
Figure B5. Locks 27 strain histories - Test 272B (SET2-27), Channels 3 and 30
STRAIN HISI AT CHANNELS 20 9OMM 0B FLANGIES (0+-93)
LSxm
x-U
a2. 4. L. L. 10 IL 14.
HEAD DIFFERENTIAL (Mt)__________0 -m 20 co0i x.~.L am 0 x
Figure B6. Locks 27 strain histories - Test 272B (SET2-27), Channels 20 and 9
164 Appendix B Head Differential Test Data

SnV WW firC14McM.Es 19 27 14 21
mas
HEA DFfL Lf ILI)1
Figure 67. Locks 27 strain histories - Test 272B (SET2-27), Channels 19,27, 14, and 21
STRAI HI5TRIES ATC*W4ELS 12 17 31 25GIER 8 FANGM (B13-612)
+
-' .. ... ..
WL*
IL4, L. L. I6. I 14.
FEDI U M17 WEAD DIFOMRM&A (ft)maE !M W % W 17+ CSW 33 ~OPr 2L
Figure 68. Locks 27 strain histories - Test 272B (SET2-27), Channels 12, 17,21, and 25
ApendIX B Head Differntia TeOt Data B5

Locks 27 Strain Data (Test 271C; SET1-27)
For the chamber drop Test 27 1B, chamber level position indicatormarks were not reliable (main text, Chapter 2, Field Notes), and it was notpossible to accurately correlate the data with the level of head differential.Therefore, the experimental data based on the results of the chamber fillTest 271C are presented here. The data for the chamber fill test were es-tablished at the maximum head differential. Therefore, to compare resultsbased on increasing values of head differential, the data shown in FiguresB9 through B16 were adjusted to reflect a datum position of zero headdifferential.
snTR4w rO AT CHA"WI 22 27VVm=X &VAE[ (05.-M
0.2. 4. IL IL1.13 4 14L
WEAD DUPTWMHTW (fL
S- mx
Figure 8. Loct 27 sr/ n histor - Test 271 C (SETi -27), Channels 22 and 27
Be Appendix B Head Dferential Test Data

STWM HIPPIS AT CHANNELS 11 19VERfLOJ WOM (D4-E4)
L 4. m
WAD ffM~AL QNo 1w m
Fiur 1 .Loks2 srinhitris- es 71C(ST1-7) hanesI nd1
xL
0& L 4. L. L IS. IL 14. IL.
HEMD OFUMMn~AL (ft._______ mole -B FM1OW ýIt CW2 3
Figure BlO. Locks 27 strain histories - Test 271C (SETI-27), Channels 2826 and 19
Appwdxoin 0 FWU (05-4)MDat B
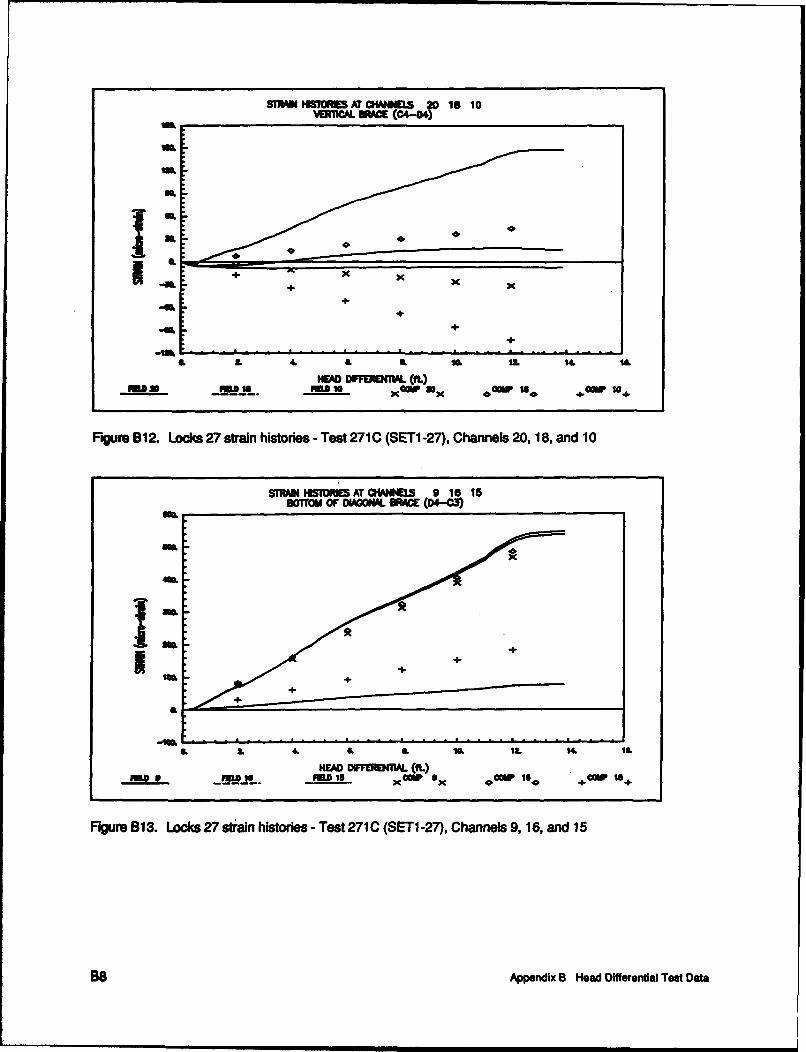
STwIMMslD.MAN CHNMs 20 18 10VB W. ME (C4-04)
US.L
+ +
4, IL 4. L S. I. . IL.
HMA UUFUD4UAL (ft.)-to-w . _F 0 X a IsX 4. ca I 4. Ow 4Q.
Figure B12. Locks 27 strain histories - Test 271C (SETI -27), Channels 20, 18, and 10
STRA IN Mism AT CIWXNELS 9 16 15SO~rOM OF M401M. URQE. 04-"3
NA 4.
++4
"a ++
L. 4. L. S. 10 IL 14. IS.
HIMD DUFRDFOMM (ft.RED 9 _FWD is FED 15 X Ow 9 X 0car IfS 4 COM Is+
Figure 613. Locks 27 strain histories - Test 2710 (SET1-27), Channels 9, 16, and 15
B8 Appendix B Head Differential Test Data

STRAI4NN TOIISAT cN S 12 1770P OF CIANML BRAE (04-03
x
1:"L
L. 2. 4 6. L 1. IL 14 IL
HEWD MaFEI1L (ft.
i2EM w aw Ul am x dw
Figure B14. Locks 27 strain histories -Test 271C (SET1-27), Channels 12 and 17
STRMN tlSOIDU AT CHANNE.S 80PflONAL BRACE (812-Cu1)
-10.
HEAD DffE O .AL (ft.)
Figure B135. Locks 27 strain histories - Test 271 C (SET1 -27), Channel 8
Appendi B HowdO Drentia Test Data B9

SMTN UITORK AT CRwiELS 6 7DW MmlCE (01"-14)
MLU
1: xIUL
x
IL 2. 4. 4L I.12 14. 6
WEAD DFU*WKT~ (ft.P.S aw 7 0 S COW 7
Figure BiB. Locks 27 strain histories - Test 271C (SET1-27), Channels 6 and 7
BlO AppendIx B Head Diferental Teoo Data
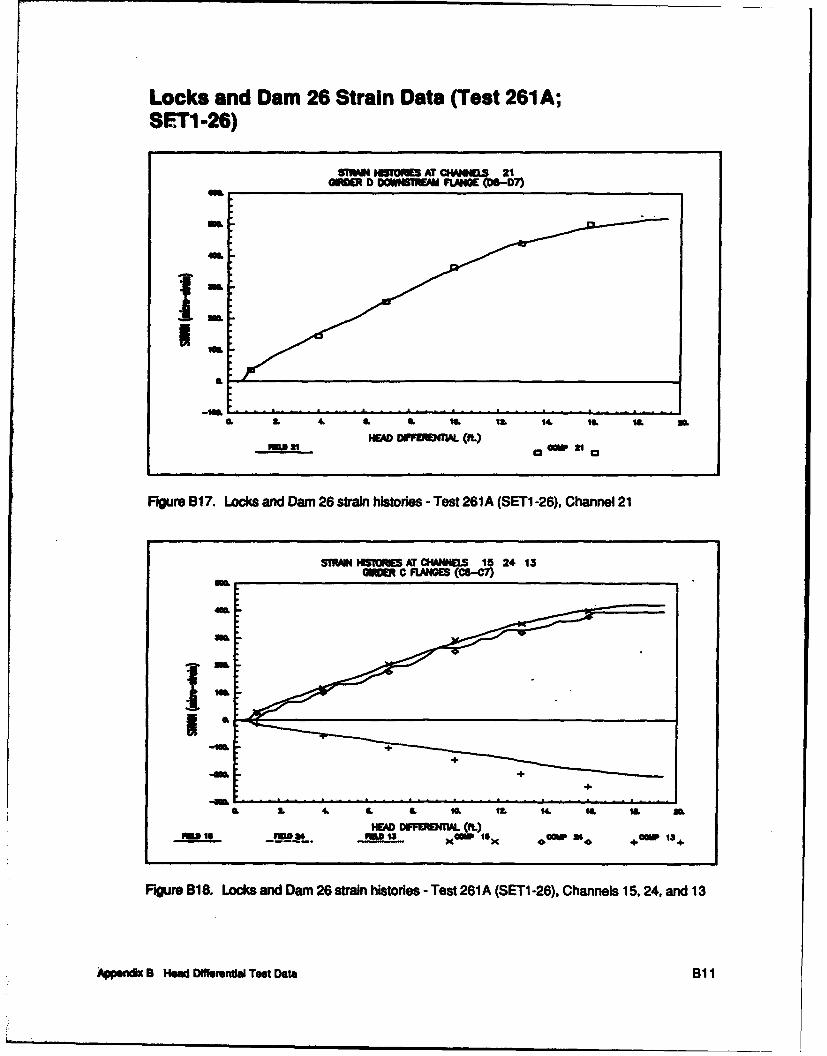
Locks and Dam 26 Strain Data (Test 261 A;SETi -26)
S1WI HISTOM AT QWIMS 21o0 MIb DiWNUTR.M FLANKE (DS-D7)
a U
L. S 4. IL L. 1. I. 14 1. IL I. 2
MMM MHED DFFOMMW. (Mt) co M
Flgure 617. Locks and Damn 26 strain histories - Test 261A (SETI -26), Channel 21
SAIVM HWOM AT CHANWL 15 24 13GiGRC RLANGES (CS-C?
4M.
UL
++
-A-. . 4. IL a. t. 14, 1& tO. A
MEAD OUFERD(NA (ft.)If81S2 F 13D xat ~ OIW Is xI co sM O2UP 13+
Figure BiB. Locks and Dam 26 strain histories - Test 261A (SET1-26), Channels 15,24, and 13
Appendx B Heed Dlftr*nta Test Data 6311
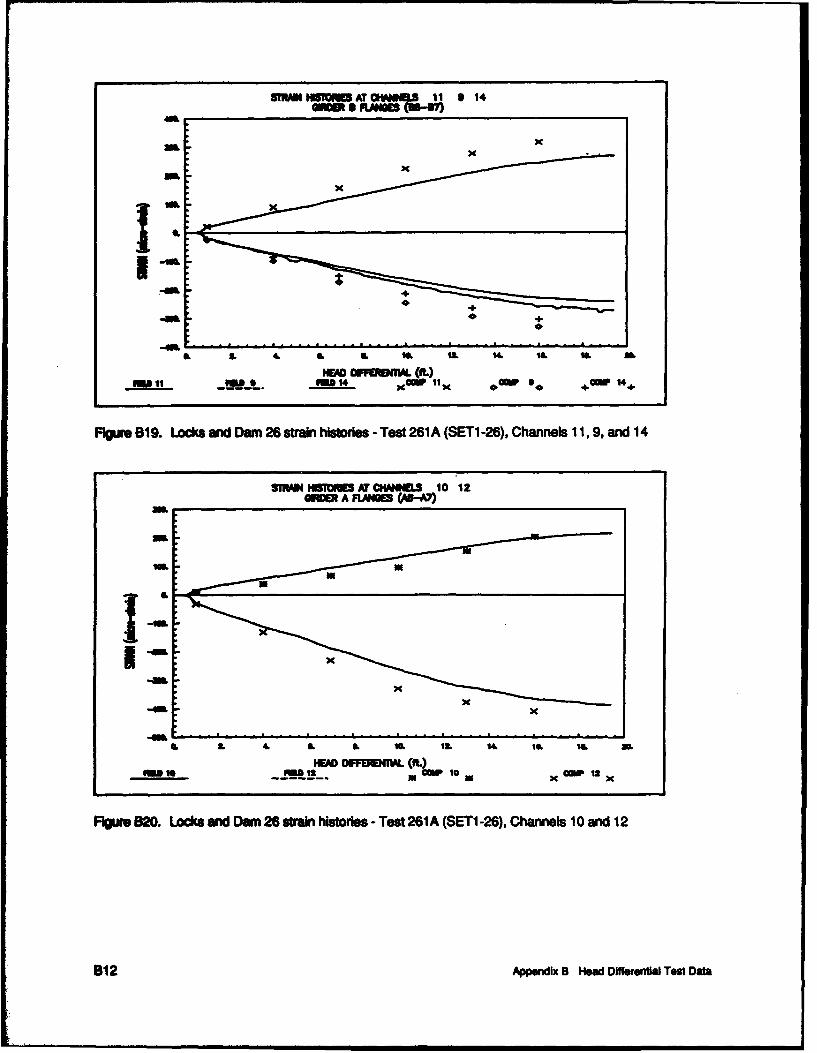
5WM 1 ý N %AT OWIIU1 9 14a.. S RAN= (90-"7)
X
S. S 4 , S S. U L 1. 14 , IS. IS. U.S11 3Fi14 21 €OOI P 1x
UCI~ 04 U +~ 4 +Figure 819. Locks and Dam 26 strain histories - Test 261A (SET1 -26), Channels 11,9, and 14
S m ~IUMrH I nTI A T CHW 4I D, 10 12
S. 1. 4 S. S. 1. 12. 14. U. 1U. U. _100 D•flU~fl. (ft.)U
U X
B12
Appendix B Head Differen tai l Test Data
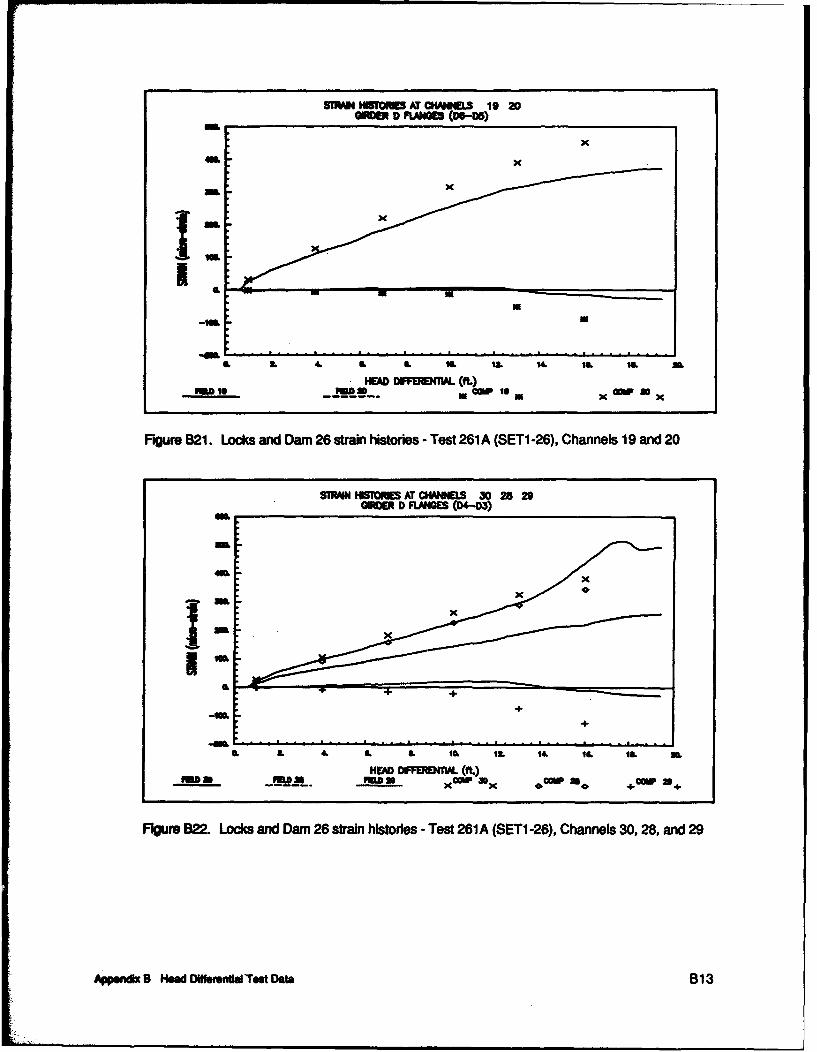
STRW4 HOMME AT CHANNELS 19 20OMER D PLAIGE (DO-M)
14m
-UL
a. L. 4. L .L 6 I I& W6 Ia. 2L
HEWD DIFVEIUM. (ft)iasMass mcw " s
Figure B21. Locks and Danm 26 strain histories - Test 261 A (SETI -26), Channels 19 and 20
bl"J HISTOME AT CHANNELS 30 25 29GIRDE D FLANGE (D4-D3)
m
3m
++
maim ~HEAD DIFFE!IML .) QQc
Figure 822. Locks and Dam 26 strain histories - Test 261 A (SETi -26). Channels 30,28, and 29
AppndiX B Heed Dlfrntia -rest Dfta B1 3

5SOM iurOMi AT QVfJAM.S 31 32eM.t A FnMM (M4A3
-in. x
lEAD DWOTMOM (ft)wma COM 31 xCM
Figure B23. Locks and Dam 26 stain histories - Test 261 A (SETI -26), Channels 31 and 32
STIM HISIMM AT CRtMSMS 1 4
OVXW Ofi W -05
415 x
Px
!-15 ML -
L4 L I. & 12. 14 1L I. 2-
PUSI ~ ~ HO DUF4ETIAL (ft.) aIK15 4
Figure 824. Locks and Dam 26 strain histories -Test 261A (SET1 -26), Channels 1 and 4
014 Appedix 8 Head Dienta Tet Daft
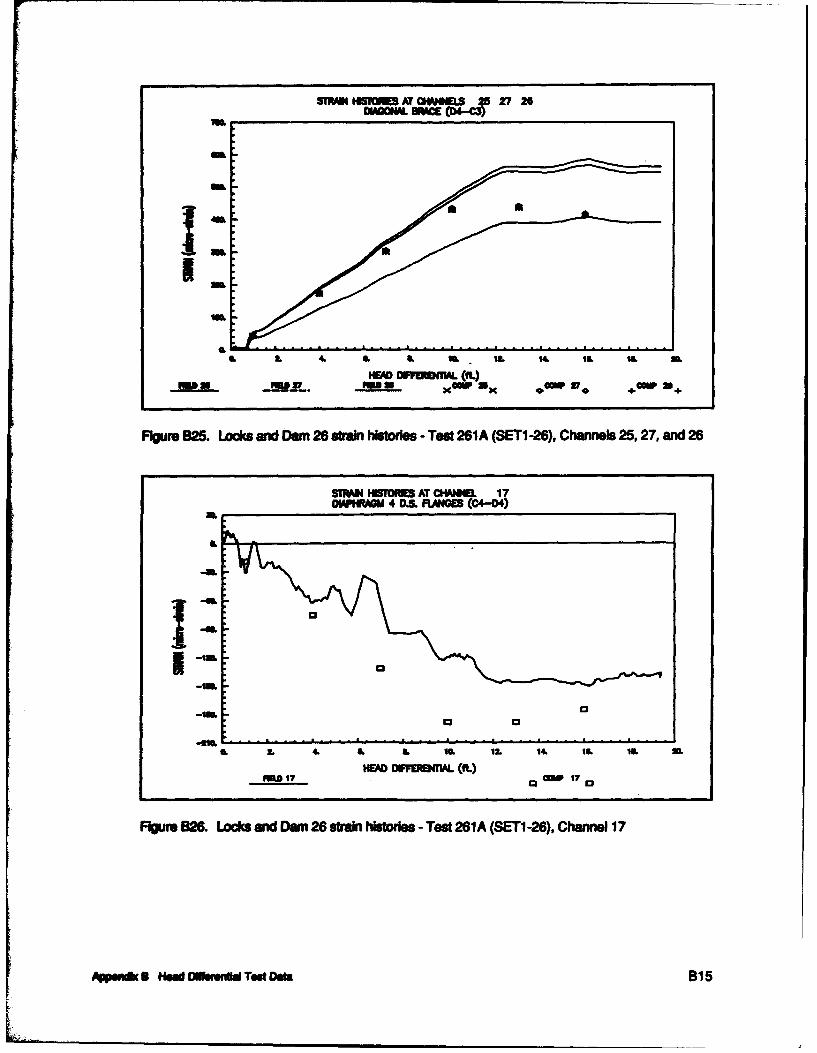
STRAIN HISrcin M CHANNELS 25 27 26
IL
ML
0M
I L 4. L L IL I- . 14, IL 1. 2L
HEAD Oa~tM#i. (ft""m -MUM PUB wi I wUx 0ow U •GW ÷ 1+
Figure 925. Locks and Dam 26 strain hisde - Test 261A (SETI-26), Channels 25,27, and 26
STRIRN HISTORM AT CHIANN.L 17OMPHAMU 4 0&5 FLMdG (C4-D4)
J"V-0.
00
* 0
-IL -- -0m- - -- JZ - - - -
. 2. 4 L • 12, 1. 14. IL 1.L UL
ADD17 WD DFFoNALa 17 0
Figure B2. Locks and Dam 26 strain histoies -Test 261A (SETI -26), Channel 17
A•mnc S Hadiwbronbd Taut Dt B15
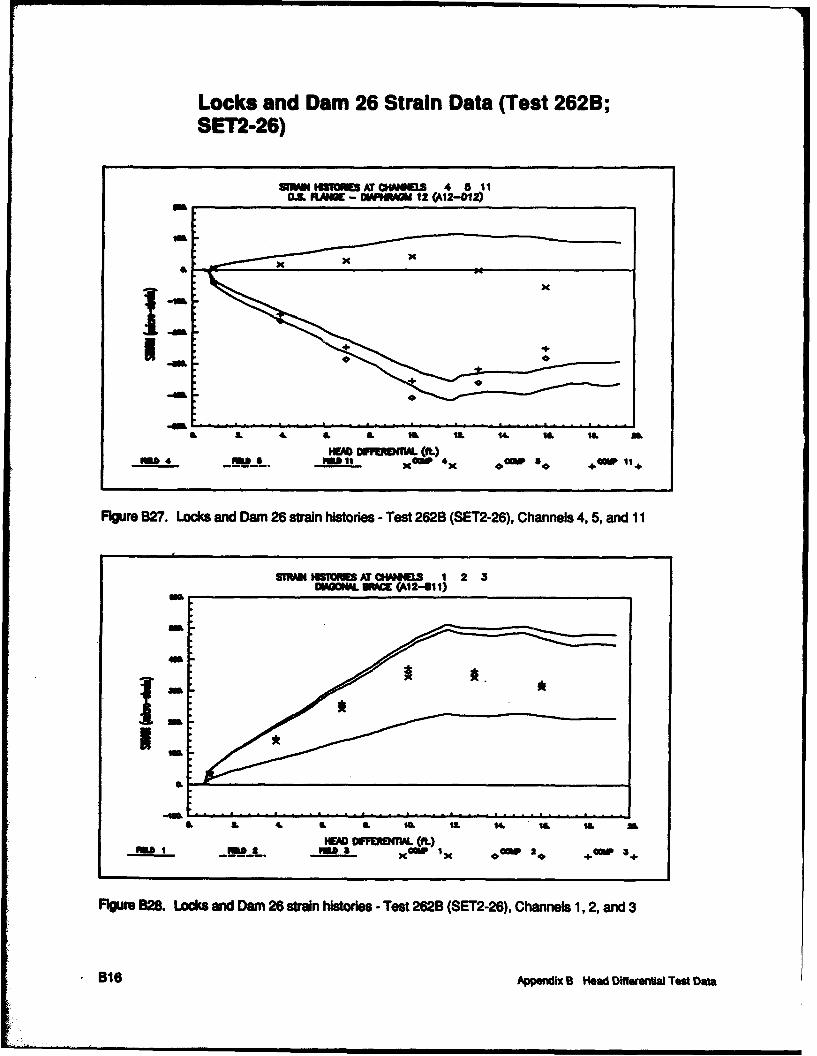
Locks and Dam 26 Strain Data (Test 262B;SET2-26)
SInM INISHATr4 NWSMS 4 5 11o.L FLANK - WNPAGM 12 (Al2-Ol2)
wa
!-4
4 aL • L I 10, 1• IL .L ML
"M DUIFMMW. 1(M)RM 4 11 x GN 4 x OwI +S 4w 1 +
Figure B27. Locks and Dam 26 strain histories - Test 262B (SET2-26), Channels 4, 5, and 11
SWMI MTO CHATNWEILS 1 2 3MOe. 3CE (A12.-9I)
1:M
**
--- - ---- - - * - -
L. L ........ L,. . . .. . ...msa HEAD OW!RIFUMA (Mt) UPI
M I u 2 Mx IP Ix aw 2> + OW 3 +
Figre 828. Locks and Dam 26 strain histories - Test 262B (SET2-26), Channels 1, 2, and 3
B16 N*Gndix B Head OWlerenU Test Data

STRIN iWIsRmm AT CHNELS 8 7 0DIMOWAL BRAC (312-CuI)
40L-M
"IIS.M
-UL
a. L 4L aL & I&1 ,1 14. IL S1 XL.
HEWO MO M&EIW (owIII 6 IIIISI? ______ UW • wx x 0 a*
Figure B29. Locks and Dam 26 strain histories -Test 262B (SET2-26) (gage slippage onchannel 7), Channels 6, 7, and 8
STIWA WISYORIEATC HANNIS 9 10 12WO0L BAE (012-011)
I:l
I m
-Ia---------------------------L. L 4. IL 16 I . ILU 14 IL. IS. SD
HEDO OWPRDM1AL (it.)FED . ,loBw ex *oaWP so +OW 12+
Figure B30. Locks and Dam 26 strain histories -Test 2628 (SET2-26), Channels 9, 10, and 12
Appudmx B HOWd Ofow TOt Data B17
REPORT DOCUMENTATION PAGE 0O01 No. 070"-188
Pu d •6mdamOl0 h Il Wd 'kieem tomd h emt SeOW pmunonw .reudngUq bn *OnWo o ' myor & pe@ of• e i4 "Mk mn W Wwkaig mftaqgnmbrui0M~Uieha, Wmpne tHeedlpwf SeIaee- OIm01 - f rorf Opemlw0 fet*rePW. .1215 Jeafemn Dow HWiW. Su*N o1204 VA 22-43. e0 n WIDme
iml 0 M U.dkiSoo atpmwli Rema, PmWe@4 p?04-0O.).WWm•, DC 20M.
1. AGENCY USE ONLY (Ledve n) 2. REPORT DATE 3. REPORT TYPE AND DATES COVEREDJune 1994 Final report
4. TITLE AND U8I1TLE 5. FUNDING NUMBERSField Testing and Structural Analysis of Vertical Lift Lock Gates WU32641
6. AUTHORS)Brett C. Commander, Jeff X. Schulz, George G. Goble, Cameron P. Chasten
7. POWORING ORGANIATION NAME(S) AND ADDRESS(ES) S. PEFrORMING ORGANIZATIONBridge Diagnostics, Inc., 5398 Manhattan Circle, Suite 280, Boulder, CO 80303; REPOIrT NUMBERU.S. Army Engineer Waterways Experiment Station, 3909 Halls Ferry Road, Technical Report REMR-CS-44Vicksburg, MS 39180-6199
L. ..o 3:TORIN AGENCY NAME(S) AND ADDRESS(ES) 10. SPoN SI MOnORNU.S. Army Corps of Engineers AGENCY REPORT NUMBERWashington, DC 20314-1000
11l. SUPPLEMEN'TARY NOTES
Available from National Technical Information Service, 5285 Port Royal Road, Springfield, VA 22161.
12L. DISRIB•UTI•NIAVAILABILITY STATEMENT 12b. DISTRIBUTION CODEApproved for public release; distribution is unlimited.
I& ABTRC (MAknm. 2W0 words)
The objective of this study was to measure the behavior of vertical lift lock gates experimentally and to develop modelingand analysis procedures for the evaluation of existing gates and design of new gates. In this study, lift gates at MississippiRiver Locks 27 and Locks and Dam 26 were investigated. The gates were instrumented and tested under various loading con-ditions and analytical models were developed to simulate structural response of each:
Substantial structural response data were obtained with minimal impact on normal lock operation. Based on experimentalstrain data obtained during the field tests, it was determined that the analytical (finite element) models provided reasonablyaccurate predictions of the general behavior. Experimental and analytical data comparisons provided quantitative inforina-tion on lift gate behavior and loading conditions. Through data comparisons for the Locks 27 lift gate, it was concluded that:1) one of the seals did not exist, 2) an unknown amount of frictional resistance exists between the bottom sill and bottom ofthe leaf; and 3) for this case, a dynamic load model (Figure 54) is most iropriate for simulation of hydrostatic head differ-ential loading. Through the Locks and Dam 26 study, it was verified tha& Aie downstream bracing members are primarily af-fected by vertical loading, and a probable cause for cracking of downstream bracing members was obtained.
14. SUBJECTTERMS 15. NUMBER OF PAGESAnalysis Design Loading condition 81Boundary condition Evaluation Modeling 1 CODEData comparison Head differential Strain
17. SECURITY TION SECURITYC ASFICATION 19& SECURITY CLASSIFICATO 20. UMITATION OF ABSTRACTOF REPORT OF THS PAGE OF ABSTRACT
UNCLASSIFID UNCLASSIFIED
N1N7G-N"0-I406 SlMadad Form 296 (Rev. 2-89)PWembedby AWS hd.ZWS1S