of the ,Niobium Alloy C-103 - NASA · niobium alloy C-103 is examined in this paper. The original...
12
NASA Technical Paper, 1727 Long-Time Creep Behavior I of the ,Niobium Alloy '. C-103 -- ' . / , I . Robert H. Titran and William D. OCTOBER 1980 -, . . , https://ntrs.nasa.gov/search.jsp?R=19800025047 2020-01-07T19:39:57+00:00Z
Transcript of of the ,Niobium Alloy C-103 - NASA · niobium alloy C-103 is examined in this paper. The original...

NASA Technical Paper, 1727
Long-Time Creep Behavior I of the ,Niobium Alloy '. C-103 - -
' . /
, I . Robert H. Titran and William D.
OCTOBER 1980 -,
. . ,
https://ntrs.nasa.gov/search.jsp?R=19800025047 2020-01-07T19:39:57+00:00Z

TECH LIBRARY KAFB. NM
NASA Technical Paper 1727
Long-Time Creep Behavior of the Niobium Alloy C-103
Robert H. Titran and William D. Klopp Lewis Research Center Cleueland, Ohio
National Aeronautics and Space Administration
Scientific and Technical Information Branch
1980

Summary The creep behavior of the niobium alloy C-103
(Nb-1OHf-1Ti-0.7Zr) has been studied as a function of stress, temperature, and grain size for test times to 19 OOO hr. Over the temperature range 827" to 1204" C and the stress range 6.89 to 138 MPa, only tertiary (accelerating) creep was observed. The creep strain can be related to time by an exponential relation recently developed by the authors:
E = E O + K(eS' - 1)
where E O is the initial creep strain, K is the tertiary creep strain parameter, and s is the tertiary creep rate parameter. The initial tertiary creep rate Ks (the zero- time intercept of the differential of the strain-time relation) can be related to stress, temperature, and grain size by a modified power-law relation:
where A is the proportionality constant, a is stress, E is Young's modulus, f is the grain-size factor, d is grain size, Q is the activation energy, R is the gas constant, and T i s temperature. The observed stress exponent 2.87 is similar to the three-power law generally observed for secondary (linear) creep of Class I solid solutions. The apparent activation energy 374 kJ/g mol is close to that observed for self- diffusion of pure niobium. The initial tertiary creep rate was slightly faster for fine-grained than for coarse-grained material. The strain parameter K can be expressed as a combination of power functions of stress and grain size and an exponential function of temperature. Strain-time curves generated by using calculated values for K and s showed reasonable agreement with observed curves to strains of at least 4 percent. The time to 1 percent strain was related to stress, temperature, and grain size in a similar manner as the initial tertiary creep rate.
Introduction Expressions relating creep strain to time during
tertiary creep have been proposed for several alloys, for example, Nimonic 80 (ref. l), iron (ref. 2), alpha- brass (ref. 3), and stainless steel (ref. 4). Although
these expressions appear capable of mathematically describing tertiary creep curves, they all require as input the time to initiation of tertiary creep. This requirement limits the usefulness of these expressions in predicting tertiary creep curves as functions of the usual inputs of stress, temperature, and grain size.
Power terms of time have also been used to represent creep curves containing segments of tertiary (accelerating) creep (ref. 1). For refractory ailoys we previously proposed relations of one or more power terms of the total creep time to represent tertiary creep in tantalum and niobium alloys, such as (refs. 5 and 6) and (At)312 (ref. 7). This type of relation does not require knowledge of the time to the initiation of tertiary creep, but the requirement for multiple power terms to model extensive portions of tertiary creep makes this approach cumbersome.
More recently we proposed an exponential term for tertiary creep that overcomes at least some of the objections to previous approaches. This tertiary creep term is similar to the Garofalo exponential term proposed for primary creep (ref. 8) and can be combined with that primary creep term to express curves exhibiting both primary and tertiary creep:
This relation is capable of describing well the creep curves for the tantalum alloy Astar 81 1C to creep strains of 3 percent (ref. 9).
The usefulness of the new exponential tertiary creep term in describing the creep behavior of the niobium alloy C-103 is examined in this paper. The original purpose for conducting this creep study was to provide design data to facilitate use of C-103 in the heat exchanger and related components of a small, 2-kW, electric, isotope-fueled Brayton cycle space power system (ref. 10). An analysis of the time to 1 percent strain for C-103 alloy is included, since it was the design criterion for this system.
The nonlinear regression programs used in this study were designed by Steven M. Sidik and Raymond W. Palmer of the Lewis Research Center.
Symbols A proportionality constant, various
dimensions a stress exponent, dimensionless

B
b C
d E f K
n nl n2 Q R r S
T t t lpc/
f P
€0
c
E
u
proportionality constant, various
grain-size exponent, dimensionless temperature factor, dimensionless grain diameter, pm Young's modulus, MPa grain-size factor, cm2 tertiary creep strain parameter,
stress exponent, dimensionless grain-size-independent stress exponent grain-size-dependent stress exponent activation energy, kJ/g mol gas constant, kJ(g mol)(deg) primary creep rate parameter, sec" tertiary creep rate parameter, set" temperature, K time, sec time to 1 percent strain, sec creep strain, dimensionless total primary creep strain,
initial creep strain, dimensionless creep rate, sec stress, MPa
dimensions
dimensionless
dimensionless
Experimental Procedure The niobium C-103 alloy was commercially
procured as 0.076-cm-thick sheet. The principal constituents of the alloy were determined to be:
Hafnium, wt 070 .......................................... .9.75 Titanium, wt To.. ........................................ .1.11 Zirconium, wt 070 ........................................ .0.45 Tantalum, wt% .......................................... 0.31 Tungsten, wt Yo.. ........................................ .0.25 Oxygen, wt ppm ......................................... .2 14 Nitrogen, wt ppm ......................................... .62 Carbon, wt ppm ........................................... .37 Hydrogen, wt ppm ....................................... .0.8 Niobium ............................................. .Balance
Creep specimens having a 0.635-cm-wide by 2.54-cm-long gage section were machined from the 0.076-cm-thick sheet. These specimens were degreased, rinsed in distilled water and alcohol, wrapped in tantalum foil, and annealed in a vacuum
of 1O-Io Pa at 120.1" to 1760" C for 1 to 5 hr before creep testing. Average grain diameters (measured by the intercept method) ranged from 15 pm after annealing for 1 hr at 1204" C to 83 prn after annealing for 1 hr at 1760" C. Weight changes associated with annealing generally amounted to only a few milligrams, equivalent to changes in interstitial content of a few tens of ppm.
Constant-load creep tests were conducted in the internally loaded, high-vacuum creep units described in reference 11. A tantalum split-sleeve resistance heater was used for heating the specimens. The pressure was generally about 10"O Pa at the start of a creep test and decreased into the 10-I2-Pa range after several hundred hours. Strains were measured by frequent optical readings of fiducial marks in the reduced gage section during creep. Strains on loading were of the order of 0.05 percent and are not included in the creep strain data.
Test temperatures ranged from 827" to 1204" C, and stresses from 6.89 to 138 MPa. Tests were generally terminated after 1 percent strain, although a few were continued to strains as high as 4 percent.
Grain sizes measured after creep are included in table I; these values are essentially the same as those measured on annealed and uncrept specimens, an indication that the grain sizes were stable under the creep conditions studied.
Results and Discussion Shapes of Creep Curves
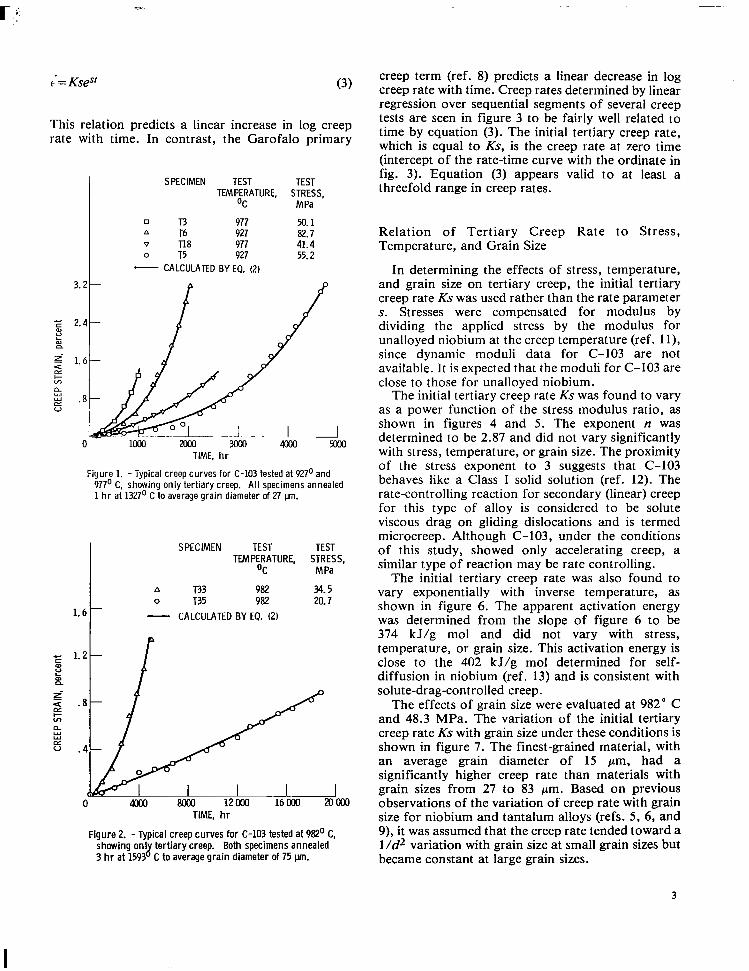
Typical long-time creep curves for C-103 are shown in figures 1 and 2. These curves consist entirely of tertiary (accelerating) creep, with no apparent period of primary (decelerating) or secondary (linear) creep. All strain-time data were computer fitted by using nonlinear regression techniques based on the exponential relation recently developed by the authors to described tertiary creep in the tantalum alloy Astar 81 1C (ref. 9):
E = ~0 +K(eS' - 1) (2)
The good fits of the data to this relation seen in figures 1 and 2 are representative of those obtained in the 35 tests included i n this analysis. Table I presents the creep curve parameters derived from regression fitting of the individual curves and other pertinent creep data from this study.
Differentiating equation (2) gives the creep rate as a function of time:
2
= Ksesi (3)
This relation predicts a linear increase in log creep rate with time. In contrast, the Garofalo primary
SPECIMEN TEST TEST TEMPERATURE, STRESS,
OC M Pa
U T 3 977 L, T6 927
50.1
v T18 977 82.7 41.4
o T5 927 55.2 - CALCULATED BY EQ. (2)
L c m L V m CL
a W W Dz V
TIME, h r
Figure 1. - Typical creep curves for C-103 tested at 927O and 977' C, showing only tertiary creep. All specimens annealed 1 h r at 1327O C to average grain diameter of 27 pm.
1.6
SPECIMEN TEST TEST TEMPERATURE, STRESS,
OC M Pa
A T33 982 34.5 0 T35 982 20.7 - CALCULATED BY EQ. (21
-
0 4oMl 8ooo 12000 1 6 W 20000 TIME, hr
Figure 2. - Typical creep curves for C-103 tested at 982' C. showing on1 tertiary creep. Both specimens annealed 3 h r at 1593 LY C to average grain diameter of 75 pin.
creep term (ref. 8) predicts a linear decrease in log creep rate with time. Creep rates determined by linear regression over sequential segments of several creep tests are seen in figure 3 to be fairly well related to time by equation (3). The initial tertiary creep rate, which is equal to Ks, is the creep rate at zero time (intercept of the rate-time curve with the ordinate in fig. 3). Equation (3) appears valid to at least a threefold range in creep rates.
Relation of Tertiary Creep Rate to Stress, Temperature, and Grain Size
In determining the effects of stress, temperature, and grain size on tertiary creep, the initial tertiary creep rate Ks was used rather than the rate parameter s. Stresses were compensated for modulus by dividing the applied stress by the modulus for unalloyed niobium at the creep temperature (ref. 1 l), since dynamic moduli data for C-103 are not available. It is expected that the moduli for C-103 are close to those for unalloyed niobium.
The initial tertiary creep rate Ks was found to vary as a power function of the stress modulus ratio, as shown in figures 4 and 5 . The exponent n was determined to be 2.87 and did not vary significantly with stress, temperature, or grain size. The proximity of the stress exponent to 3 suggests that C-103 behaves like a Class I solid solution (ref. 12). The rate-controlling reaction for secondary (linear) creep for this type of alloy is considered to be solute viscous drag on gliding dislocations and is termed microcreep. Although C-103, under the conditions of this study, showed only accelerating creep, a similar type of reaction may be rate controlling.
The initial tertiary creep rate was also found to vary exponentially with inverse temperature, as shown in figure 6. The apparent activation energy was determined from the slope of figure 6 to be 374 kJ/g mol and did not vary with stress, temperature, or grain size. This activation energy is close to the 402 kJ/g mol determined for self- diffusion in niobium (ref. 13) and is consistent with solute-drag-controlled creep.
The effects of grain size were evaluated at 982" C and 48.3 MPa. The variation of the initial tertiary creep rate Ks with grain size under these conditions is shown in figure 7. The finest-grained material, with an average grain diameter of 15 pm, had a significantly higher creep rate than materials with grain sizes from 27 to 83 pm. Based on previous observations of the variation of creep rate with grain size for niobium and tantalum alloys (refs. 5 , 6, and 9), it was assumed that the creep rate tended toward a l /d2 variation with grain size at small grain sizes but became constant at large grain sizes.
3

ll1111ll1 11111lll111111111111IIlll1l111111 I I I I I - 1
TABLE I. - CREEP DATA FOR NIOBIUM ALLOY C-103
- Tee
- 11
7 5 6
18 3 4
17 23
9
1 3
14
38 30 35 33 61 36 50 37 32 51 39 34 52 49 40 45 44
29 28 27 26
16
- 15
'7 Annealing condition -
Time hr
1
1
1
5
1
3
1
i 1
1 -
Tempera. ature,
O C
1204
1327
1
1427
1538
1
1649
1760
1649
3
Test temper. ature, OC
98 2
827 927 927 977 977 977
1027 1027 1027
98 2
98 2
927 954 98 2 98 2 98 2
1002 1002 1052 1093 1093 1093 1149
I 1204 1204
87 1 927 982
1093
98 2
98 2
- Stress MPa
48.3
138 55.2 82.7 41.4 50.1 60.1 20.7 41.4 55.2
48.3
48.3
68.9 34.5 20.7 34.5 48.3 27.6 34.5 17.2 13.8 17.2 34.5 10.3 13.8 20.7 34.5 6.89
10.3
89.6 62.1 41.4 20.7
48.3
48.3
Stress- modulus
ratio, o/E
4.61X10d
13.41 5.30 7.94 3.96 4.79 5.75 1.97 3.95 5.26
4.61
4.61
6.62 3.31 1.98 3.30 4.61 2.63 3.29 1.64 1.32 1.64 3.29
.984 1.32 1.98 3.30
.661
.998
8.65 5.97 3.95 1.97
4.61
4.61
Initial tertiary creep rate, Ks 9
sec-1
17.9X10⁻¹ ." "
1.67 3.68 8.47 6.34 8.04 5.66 2.68
31.5 66.4
11.2
11.2
1.64 1.39 1.07 2.83 9.68 3.91
11.9 2.10 3.92
14.6 91.2 7.85
20.9 43.6 62 4.76
L5.0
1.38 6.54 8.38
15.8
11.4
14.8
~~
Tertialy creep strain
parameter K
~~
0.299X10-'
". .
. l o 1
.230
.224
.396
.112
.063
.134
.884
.481
.354
.531
.075
.177 1.89
.283
.410
.983 1.51 .733 .847
2.42 ,812
5.89 L.73 1. 38 1.06 1.83 .665
.305
.873
.755 ,.04
.a 57
.467 -~
~~ ~
Tertiary creep rate
parameter 5,
sec-l
6 0 . 0 ~ l 0 - ~ - - ."
16.5 16.0 37.8 16.0 71.8 89.9 20.0 35.6
138
31.5
21 .o 21.8 7.88
.565 10.0 23.6
3.98 7.89 2.86 4.63 6.05
LOO 1.14
12.1 31.6
127 2.60
22.6
4.51 7.49
11.1 15.2
13.3
31.6 ~~
Time to 1 percen
strain, hr
... __ 670
3 960 2 980 1 260 2 210
876 867
2 930 545 229
1 1 3 5
1 330
3 370 6 467
a20 800 4 125 1 440 5 200 1.820 8 215 4 630 1 524
228 3 245 1 052
510 89
4 630 1 200
8 975 2 790 2 030 1 170
1 600
1 060 -~
~
G r ~ d i m eter,
d, pm
~
15
22 26 24 27 31 29 24 30 27
42
49
80 73 77 65 70 62 85 74 71 86 70 69 85 83 80 80 72
71 77 85 92
83
63 ~
Test duration 1 -
Time, h r
~
818
4 867 4 897 2 034 2 498
98 2 960
3 016 1 294
433
1 387
2 a53
3 931 6 575
18 873 5 041 1 717 5 230 2 013 9 237 4 748 1 790
295 3 715 1 827 1 030
240 5 066 1 415
9 023 3 861 2 275 1 676
2 541
1 153 .. ~
~ "
To strain percent
1.36
1.81 3.37 3.17 1.24 1.28 1.30 1.10 3.35 3.55
1.42
2.59
1.44 1.01
.96 1.39 1.30 1.06 1.18 1.14 1.07 1.25 1.62 1.27 2.10 3.04 4.11 1.10 1.32
1.02 1.67 1.18 1.57
2.12
1.19
Based on these observations of C-103 and prior Values for the constants in equation (4) are given in observations of other refractory alloys (refs. 5 , 6 , table 11. The plot of temperature- and grain-size- and 9), the relations for initial tertiary creep rate as a compensated initial tertiary creep rate as a function function of stress, temperature, and grain size is of stress-modulus ratio in figure 8 shows a reasonable expressed as fit to equation (4).
The strain parameter K was also studied and was Ks=A(a/E)"( l+ f/d2)e-QIRT (4) determined to vary as a power function of stress and
grain size and an exponential function of inverse
4

. . . ..
I SPECIMEN TEST TEST TEMPERATURE, STRESS,
4 ~ 1 0 - ~ OC M Pa
T39 1039 34.5 L" 0 T49 1149 20.7
T52 1149 13.8 R 7 982 133 982
41.4 34.5
CALCULATED BY EO. (3)
0 800 1600 2400 3200 4ooo 4800 TIME, h r
Fiqure 3. - Crew rates as a function of time. Soecimen 7-27 annealed'3 h r at 1649' C; others preannealed 3 hr at 1593O C.
A
0 0
0
TEST TEMPERATURE,
OC 1027 977 927 827
2.87
1
10-10 10-4 I, 10-3 4 ~ 1 0 - ~
STRESS-MODULUS RATIO, olE
Figure 4. - Initial tertiary creep rate as a function of stress- modulus ratio for material annealed 1 hr at 1327O C to average grain diameter of 27 pm.
temperature. The relation for K is expressed as
K=A(a/E)= dbeClT ( 5 )
4 ~ 1 0 - ~ r
TEST TEMPERATURE,
OC 12c4 1149 1093 1052 1002 982 927
STRESS-MODULUS RATIO, o/E
Figure 5. - Initial tertiary creep rate as a func- tion of stress-modulus ratio for material an- nealed 3 hr at 1593O C to average grain diam- eter of 75 vm.
with the proportionality constant A determined by regression fitting to be 17.9 cm-b; the exponents a and b to be -0.23 and 0.717, respectively; and c to be -7960 K". Figure 9 compares calculated and observed values of K .
The variation of K with stress and temperature for C-103 is different from that observed previously for Astar 811C (ref. 9), although for both materials K increased with increasing grain size.
Comparison of Calculated and Experimental Creep Curves
It is of interest to compare calculated creep curves with experimental data. The strain parameter K can be calculated from equation (5) ; the rate parameter s can be obtained by dividing Ks from equation (4) by K . The creep curve can then be generated by inserting these calculated parameters into equation (2) and
I I I I I 1111 I1 1 1 1 1 I I 1 1 1 1 I I I I I I111111 IIIIIII I 1 1 1 1 I I I I I 11111 I I II I I I I I I I I

TABLE II. - CREEP CONSTANTS FOR C-103
Constant
Proportionality constant, A, s e c - l
Stress exponents:
n n1 (grain-size independent) n2 (grain-size dependent)
Grain-size factor, f, cm
Activation energy, Q. kJ/g mol
Correlation coefficient, R
2
2
W W
E V
Equation
1. 31xlOl6
2 .87
. . 1 7 ~ l O ~ ~
. - - - - - - - - 2.95 2 .52
..27x10m7
336
0.988
0 /
1 Id
4 PI a w" PI
AVERAGE GRAIN DIAMETER, : 102
PI d, 5 w
Figure 8. -Temperature- and grain-size-compensated initial tertiary creep rate as a function of stress- modulus ratio.
assuming E O to be zero. Figure 10 and 11 compare calculated curves with experimental data points. The agreement is reasonable, especially considering the probable error in calculation of the strain parameter K as indicated by the scatter in figure 9.
Relation of Time to 1 Percent Strain to Stress, Temperature, and Grain Size
The time-to-1 -percent-strain data were analyzed in
L2 c E vr
Figure 6. - Stress-compensated initial tertiary creep rate as a function of inverse temperature for C-103 of two different average grain diameters.
10-8- A o SINGLE DATA POINTS u 0) v)
- - A INTERPOLATED DATA POINTS
v)- T W RANGE OF GRAIN SIZES Y
W'
-\ "-" LIMITS SOLID CURVE APPROACHES ASYMPTOTICALLY AT SMALL (A) - \ +
d \ AND LARGE (B) GRAIN DIAMETERS a - \ - W \
V - A A a TESTS 4-
\
\
CALCULATED BY EP. (4) Y a
>
\
NUMBER OF
W
+ ar 5 10-9- - a t z 17
- - l-44
- - -
4 ~ 1 0 - l ~ I I I I I I I I I I I I I I I
40 Id 103 AVERAGE GRAIN DIAMETER, d,
Figure 7. - Initial tertiary creep rate as a function of grain diameter for C-103 creep tested at 48.3 MPa at 982O C.
a manner similar to that used for analyzing the initial tertiary creep rate Ks. The time to 1 percent strain varied as a power function of the applied stress; however, unlike for Ks, the stress exponent n for the time to 1 percent strain decreased from 2.97 to 2.75 as the grain diameter decreased from 75 to 27 pm. A decrease in n with decreasing grain size had been observed previously for Ta-1OW (ref. 5 ) , tantalum T-222 (ref. 6), and stainless steel (ref. 14). Matlock
6

l0-k 0
I I I I I I l l1 I I I I I I l l 1 10-2
CALCULATED K 10-1
Figure 9. - Observed strain parameter K as a function of K as calculated from equation (51.
1.6
- 5 1.2 u L W CL
2 . 8 + v)
W n w . 4 V
0
SPECIMEN TEST TEST TEMPERATURE. STRESS,
OC M Pa
O D 977 50.1 v T18 977 41.4 - CALCULATED BY EQ. (2)
TIME, hr
Figure 10. - Strain-time curves for C-103 annealed for 1 hr at 1327' C.
and Nix (ref. 15) also have suggested that the n for grain-boundary sliding, which predominates at small grain sizes, is about 1 less than the n for intragranular creep.
The apparent activation energy for time to 1 percent strain was determined to be 336 kJ/g mol, less than the 402 kJ/g mol for self-diffusion of niobium (ref. 13). The apparent activation energy did not vary significantly with stress, temperature, or grain size.
SPECIMEN TEST TEST TEMPERATURE, STRESS,
OC M Pa
* T33 982 34.5 0 T35 982 20.1
CALCULATED BY EQ. 12)
1.2 - 5 2
f W n
v, n Y W m V
2
TIME, hr
Figure 11. - Strain-time curves for C-103 annealed for 3 hr at 1593' C.
The time to 1 percent strain varied with grain size in a similar manner as observed for Ks. The inverse time (proportional to a linear creep rate to 1 percent strain) increased with decreasing grain size. The data were analyzed as done previously for Ks by assuming that the inverse time to 1 percent strain was proportional to l/d2 at fine grain sizes but invariant at large grain sizes. The variation of inverse time to 1 percent strain with grain size is shown in figure 12.
A relation expressing time to 1 percent strain as a function of stress, temperature, and grain size was developed as
Values for the constants in equation (6) are given in table 11. Here, two stress exponents are required since the stress dependency varies with grain size. Figure 13 shows the good correlation between ternperature- compensated inverse time to 1 percent strain and stress for C-103 with average grain diameters of 27 and 75 pm.
The calculated stress for 1 percent creep strain in 10 OOO hr for C-103 is shown in figure 14. This stress ranges from about 50 MPa a 900" C to about 6 MPa at 1100" C and is about 15 percent greater for coarse- grained than for fine-grained material. C-103 is about one-fourth as strong as the commonly used niobium alloy FS-85 (ref. 16).
7

0 SINGLE DATA POINTS A INTERPOLATED DATA POINTS
t"-l RANGE OF GRAIN SIZES \ ""- LIMITS SOLID CURVE APPROACHES
AND LARGE (B) GRAIN DIAMETERS
\ \ ASYMPTOTICALLY AT SMALL (A) \ \ \ -CALCULATED BY EQ. (6) \
\\ \
1 0 - 7 k l I I I , I I , , , , , , I Y
+ 8 ~ 1 0 - ~
40 102 103 AVERAGE GRAIN DIAMETER, d, Dm
Figure 12. - Time to 1 percent strain as a funct ion of grain diameter for C-103 creep tested at 48.3 MPa and 982' C.
AVERAGE GRAIN DIAMETER,
d, I.lm
o 27 a 75
d
104 6 ~ 1 0 - ~ 10-3 2x10⁻³
Figure 13. - Temperature-compensated time to 1 percent s t ra in as a funct ion of stress-modulus ratio for C-103 of two different average grain diameters.
STRESS-MODULUS RATIO, O / E
B m
VI- VI W CT + VI
lo2 r \\ . 1 \ \\ FS-85
L t I \\ - CALCULATED BY EP. (6) \
2 800 900 loo0 1 loo 1200
TEMPERATURE, OC
Figure 14. - Calculated stresses for 1 percent creep s t ra in in 10 oo0 h r as a f u n t t i o n of temperature for C-103 and FS-85.
Conclusions From a study of the creep behavior of C-103 as a
function of stress, temperature, and grain size the following conclusions were drawn:
1 . The exponential relation for tertiary creep strain as a function of time can well describe creep curves for C-103, which shows only tertiary creep at 827" to 1204" C at stresses of 6.89 to 138 MPa. This relation is
where c is creep strain, E O is initial creep strain, K is the tertiary creep strain parameter, s is the tertiary creep rate parameter, and t is time.
2. The initial tertiary creep rate Ks can be related to stress through the well-known power law. The rate Ks can be expressed by a single activation energy (over the range of this study) that is slightly less than the self-diffusion activation energy for niobium. Fine-grained C-103 creeps slightly faster than does coarse-grained C-103.
3. The strain parameter K can be expressed as a function of grain size, stress, and temperature.
4. Strain-time curves calculated from predicted values of K and s agree fairly well with observed strain-time curves.
Lewis Research Center, National Aeronautics and Space Administration,
Cleveland, Ohio, May 15, 1980, 506-53.
8

References
1. Davies. P.W.; and Evans, H.E.: Some Features of Tertiary- Creep Behavior with Particular Reference to Nimonic 8OA at 750' C. J . Inst. Met. (London). vol. %, 1968. pp. 245-248.
2. Davies, P.W.; and Williams. K.R.: Recovery Measurements
no. 7, 1969, pp. 897-903. During Tertiary Creep of Alpha-Iron. Acta Met., vol. 17,
3. Evans, W.J.; and Wilshire, B.: The High Temperature Creep and Fracture Behavior of 70-30 Alpha Brass. Metall. Trans., vol. 1, no. 8, Aug. 1970, pp. 2133-2139.
4. Kawasaki, T.; and Horiguchi, M.: Analysis of Accelerated Creep Under Constant Sustaining Load for Austenitic Stainless Steels. Metall. Trans. A. vol. 10A. no. 6. June 1979, pp. 749-757.
5 . Titran, Robert H.; and Klopp, William D.: Long Time Creep Behavior of Tantalum-10 Tungsten in High Vacuum. NASA
6. Titran, Robert H.: Creep Behavior of Tantalum Alloy T-222 at 1365 to 1700 K. NASA T N D-7673, 1974.
7. Klopp. William D.; and Titran, Robert H.: Interim Analysis of Long-Time Creep Behavior of Columbium C-103 Alloy.
8. Garofalo, F.: Fundamentals of Creep and Creep-Rupture in Metals. Macmillan Co.. 1965, pp. 19-65.
9. Klopp, William D.; Titran, Robert H.; and Sheffler, Keith D: Long-Time Creep Behavior of the Tantalum Alloy Astar
TN D-6044. 1970.
NASA TM X-71895. 1976.
81 IC. NASA TP-1691, 1980.
10. Wein, D.; and Zimmerman. W.F.: Mini-Brapon Heat Source Assembly Development. (DOC 78SDS4252, General Electric Co.; NASA Contract NAS 3-18541.) NASA CR-159447, 1978.
11. Armstrong, P.E.; and Brown, H.L.: Anomalous Temperature Dependence of Elastic Moduli of Niobium Metal. Am. Soc. Met. Trans. Q, vol. 58, Mar. 1965, pp. 30-37.
12. Sherby, O.D.; and Burke, P.M.: Mechanical Behavior of Crystalline Solids a1 Elevated Temperature. Progress in Materials Science, Vol. 13. No. 7, B. Chalmers and W. Hume-Rothery, eds., Pergammon Press, Ltd., (Oxford),
13. Lundy, T.S.; et al.: Diffusion of Nb-95 and Ta-182 in Niobium (Columbium). Trans. AIME, vol. 233, no. 8. Aug.
1967, pp. 325-390.
1965, pp. 1533-1539.
14. Garofalo, F.; Domis, W.F.; and von Gemmingen, F.: Effect of Grain Size on the Creep Behavior of an Austenitic Iron- Base Alloy. Trans. AIME, vol. 230, Oct. 1964, pp. 1460-1467.
IS. Matlock, D.K.; and Nix, W.D.: the Effect of Sample Size on the Steady State Creep Characteristics of Ni-6pct. W . Metall. Trans., vol. 5, no. 6, June 1974, pp. 1401-1412.
16. Titran, Robert H.; and Hall, Robert W.: High Temperature Creep Behavior of a Columbium Alloy, FS-85. NASA TN D-2885, 1965.
9

1. Report No. 3. Recipient’s Catalog No. 2. Government Accession No.
NASA TP- 1727 4. Title and Subtitle
LONG-TIME CREEP BEHAVIOR OF THE NIOBIUM ALLOY C-103 I 6. Performing Organization Code
8. Performing Organization Report No I E-224 7. Author(s)
Robert H. Titran and William D. Klopp 10. Work Unit No.
506- 53 9. Performing Organization Name and Address
National Aeronautics and Space Administration Lewis Research Center Cleveland, Ohio 44135
2. Sponsoring Agency Name and Address
National Aeronautics and Space Administration Washington, D. C. 20546
11. Contract or Grant No.
13. Type of Report and Period Covered
Technical Paper 14. Sponsoring Agency Code
5. Supplementary Notes
6. Abstract
The creep behavior of (2-103 (Nb-1OHf-1Ti-O.7Zr) has been studied as a function of stress, temperature, and grain size for test times to 19 000 hr. Over the temperature range 827’ to 1204’ C and the stress range 6.89 to 138 MPa, only tertiary (accelerating) creep was observed. The creep strain E can be related to time t by an exponential relation recently developed by the authors: E = + K (est - I ) , where is initia creep strain, K is the tertiary creep strain parameter, and s is the tertiary creep rate parameter. The initial tertiary creep rate K s (the zero-time intercept of the differential of the strain-time relation) can be related to stress, temperature, and grain size by a modified power-law relation: K s = A (u/E)” (1 + f/d ) 2
x where A is the proportionality constant, u is stress, E is Young’s modulus, f is the grain- size factor, d is grain size, Q is the activation energy, R is the gas constant, and T is temperature. The observed stress exponent 2.87 is similar to the three-power law generally observed for secondary (linear) creep of Class I solid solutions. The apparent activation energy 374 kJ/g mol is close to that ob- served for self-diffusion of pure niobium. The initial tertiary creep rate was slightly faster for fine- grained than for coarse-grained material. The strain parameter K can be expressed as a combination of power functions of stress and grain size and an exponential function of temperature. Strain-time curves generated by using calculated values for K and s showed reasonable agreement with observed curves to strains of at least 4 percent. The time to 1 percent strain was related to stress, temperature, and grain size in a similar manner as the initial tertiary creep rate.
1. Key Words (Suggested by Author(s))
Creep; Refractory metals; Niobium (columbium); C-103; Primary creep rate; Secondary creep rate; Tertiary creep rate; Grain size; Stress dependency; Activation energy
18. Distribution Statement
Unclassified - unlimited STAR Category 26
I. Security Classif. (of this report) 20. Security Clasrif. (of this page)
Unclassified Unclassified I I I -
* For sale by the National Technical Information Service, Springfield, Virginia 22161 J
NASA-Langl ey, 1980