of the Companies act, 1956 ONGC Group Performance at A ...
47
Statement Pursuant to Section 212 of the Companies act, 1956 ONGC Group Performance at A Glance Auditors’ Report - ONGC Group Consolidated Financial Statement of ONGC Group
Transcript of of the Companies act, 1956 ONGC Group Performance at A ...
Statement Pursuant to Section 212of the Companies act, 1956
ONGC Group Performance at A Glance
Auditors’ Report - ONGC Group
Consolidated Financial Statement of ONGC Group
SI.No.
Name of the Subsidiaries 1. The FinancialYear of theSubsidiary
ends on
2. Date fromwhich itbecame
Subsidiary
3.(a) Number of shares held by Oil andNatural Gas Corporation Ltd. in the
Subsidiary at the end of the financial year of the Subsidiary*
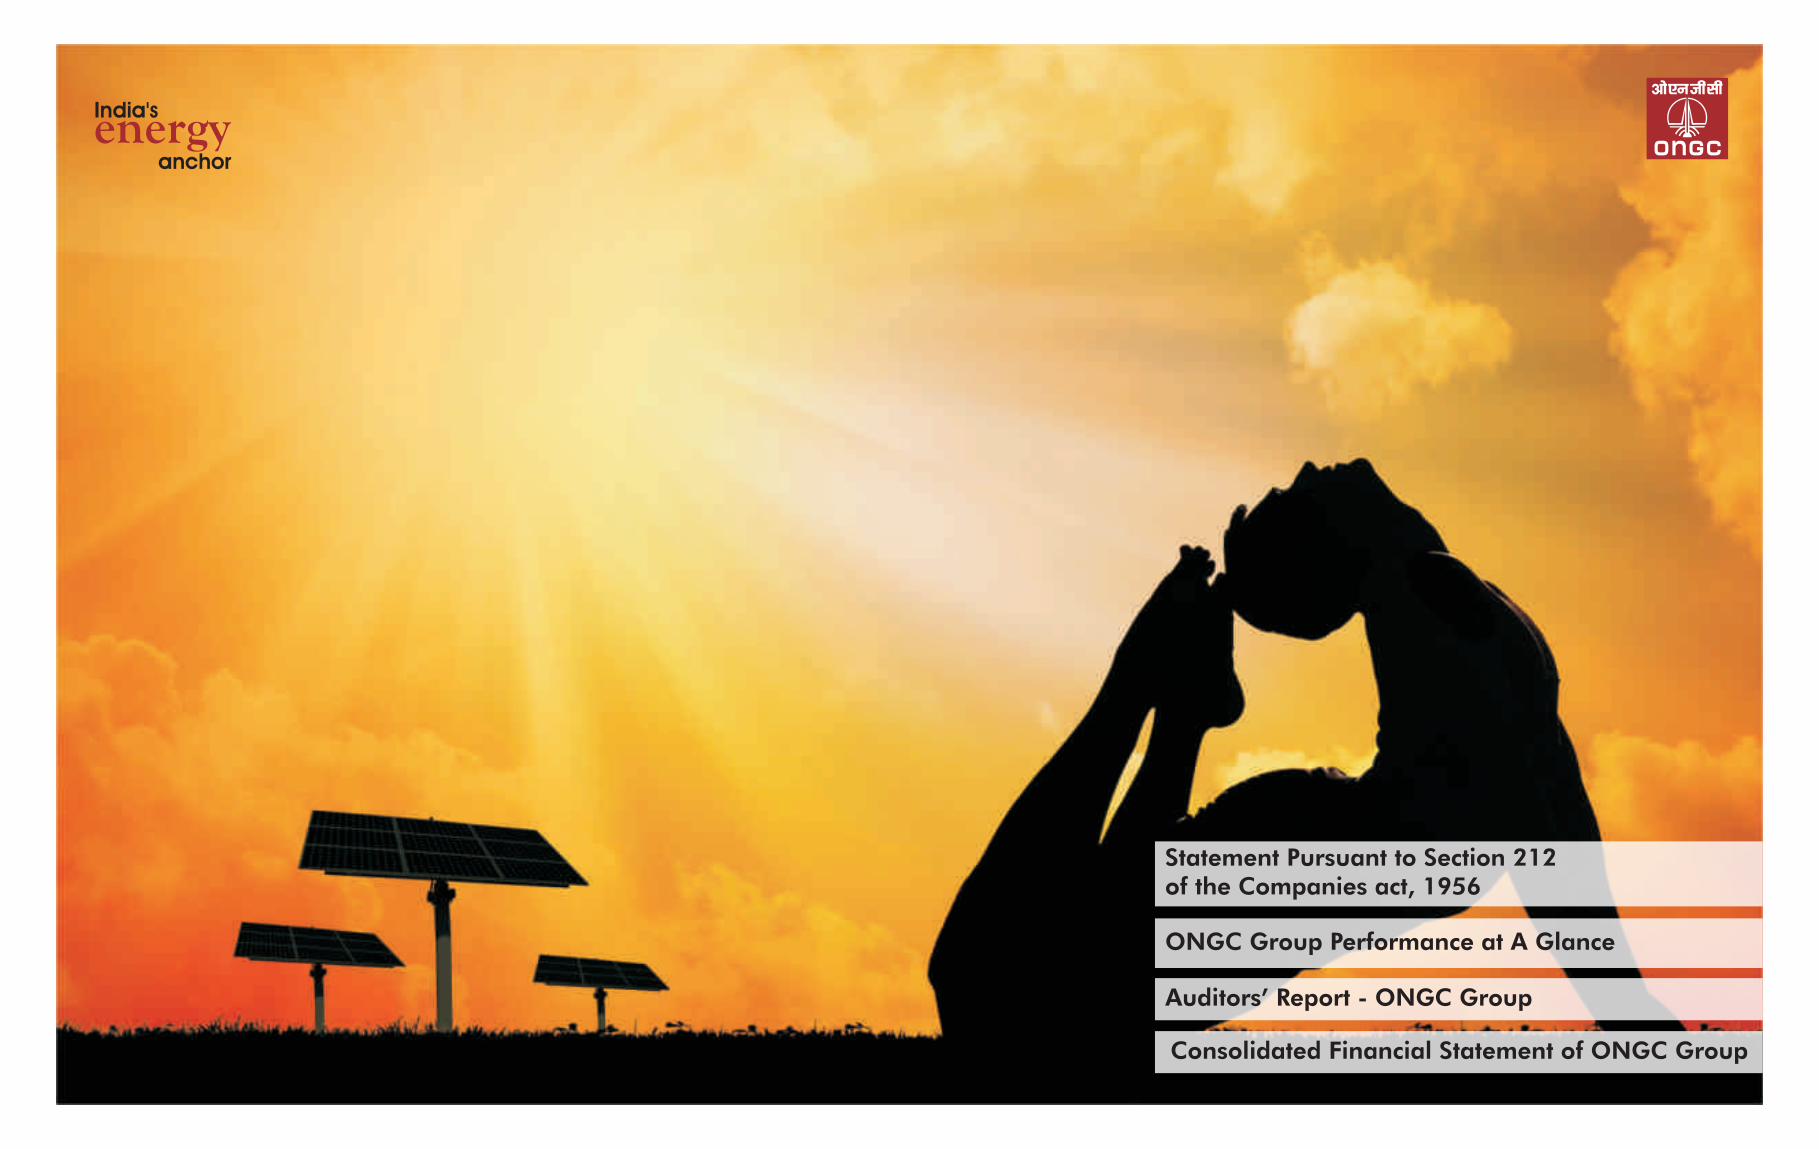
st1 ONGC Videsh Limited 31 March, 2014 1 February,1994 100,000,000 Equity shares of Rs. 100 each
2 Mangalore Refinery andPetrochemicals Limited
3 ONGC Nile Ganga B.V. 12 March, 2003 40 Class “A” & 100 Class "B" shares of Euro453.78 each & 880 Class "C" Shares of Euro 1each directly, rest 720 Class "C" shares are heldby OMEL which is JV Company of OVL & Mit talInvestment Sarl (MIS)
4 ONGC Narmada Limited 7 December, 2005 20 Million shares of one Naira each
5 ONGC Amazon AlaknandaLimited
st6 ONGC Campos Ltda. 31 December, 2013 16 March, 2007 667,644,626 quotas of BRL
7 ONGC Nile Ganga (Cyprus) Ltd. 31 December, 2013 26 November, 2007 242,191 Shares of 0.01
8 ONGC Nile Ganga(San Cristobal) B.V.
9 ONGC Satpayev E & P B.V 31 December, 2013 7 June, 2010 18,000 shares of Euro 1 each
10 ONGC Caspian E & P B.V 31 March, 2014 7 June, 2010 36,000 shares of Euro 1 each
11 Imperial Energy Limited knows as Jarpeno Optionally Conver tible Redeemable Preference
shares of USD 1 each
12 Biancus Holdings Limited 31 March, 2014 13 January, 2009 1,000 shares of 1.71 EUR each
13 San Agio Investments Limited 31 March, 2014 13 January, 2009 1,000 shares of 1.71 EUR each
14 Redclif fe Holdings Limited 31 March, 2014 13 January, 2009 2,620 shares of 1 USD each
15 Imperial Energy Nord Limited 31 March, 2014 13 January, 2009 25,920 shares of 1 USD each
16 Imperial Energy (Cyprus) Limited 31 March, 2014 13 January, 2009 25,720 shares of 1 USD each
17 Imperial Energy Tomsk Limited 31 March, 2014 13 January, 2009 2,411 shares of 1 USD each
18 Imperial Frac Services (Cyprus) 31 March, 2014 13 January, 2009 1,000 shares of 1.71 EUR
19 LLC Nord Imperial 31 December, 2013 13 January, 2009 Full char ter capital 300,000 RUR
20 LLC Alliancenef tegaz 31 December, 2013 13 January, 2009 Full char ter capital 50,000 RUR
21 LLC Sibinternef t 31 December, 2013 13 January, 2009 Char ter capital 55,900 RUR
22 LLC Rus Imperial Group 31 December, 2013 13 January, 2009 Full char ter capital 100,000 RUR
23 Carabobo One AB 31 March, 2014 25 February, 2010 377,678 ordinary shares of SEK 100 each
24 Petro Carabobo Ganga B.V. 31 March, 2014 26 February, 2010 18,000 shares of 1 Euro each 2,000 Cumulative Preference Shares (5.25%) of Euro 1 each
25 ONGC (BTC) Limited 31 March, 2014 28 March, 2013 8,000,001 shares of 1 USD each th 26 BREML 31 March, 2014 7 January, 2014 7,680 shares of No Par value
st
st th 31 March, 2014 30 March, 2003 1,255,354,097 Equity shares of Rs. 10 each
st th 31 March, 2014
st th 31 March, 2014st th 31 March, 2014 8 August, 2006 12,000 Equity & 227,216,319 Preference shares
of one USD each th 1 each
st th USD each st th 31 March, 2014 29 February, 2008 54,000 shares of Euro 1 each
st th
st th
st th 31 March, 2014 12 August, 2008 1,450 Equity shares of 1 USD each & 192,210 (previously Limited)
st th
st th
st th
st th
st th
st th
st th each Limited
st th
st th
st th
st th
st th
st th
st th
st
*At the closing rate of exchange, there is a Foreign Exchange Translation Reserve of ` 22,232.44 million, which has not been adjusted.
(D K Sarraf) Chairman & Managing Director
(N K Sinha) Company Secretary
(A K Banerjee) Director (Finance)
Statement Pursuant to Section 212 of The Companies Act,1956, Relating to Company’s interest in The Subsidiaries
240
3.(b) Ex tent of interest of Holding
Company at the end of the financial year
of the Subsidiary
4. The net aggregate amount of the Subsidiary’s Profit/(Loss) so far itconcerns the members of the Holding Company:
4.(a) Not dealt within the Holding Company’s accounts 4.(b) Dealt within the Holding Company’s accounts:
4.(a)(I) For the periodst1 April, 2013 to
st 31 March, 2014 (` in million)
4.(a)(ii) For the previousperiod(s) of the Subsidiary
since it became the HoldingCompany's Subsidiary
(` in million)
4.(b)(I) For the periodst1 April, 2013 to
st 31 March, 2014 (` in million)
4.(b)(ii) For the previous period(s) of the
Subsidiary since it became the Holding
Company's Subsidiary:(` in million)
100% 25,140.49 108,380.09 - 1,050.00
71.63% 6,011.82 39,424.96 - 9,164.06
" Class A & B 100% 32,253.37 84,556.00 - 15,966.28 Class C 77.491% "
100% (1.81) (1,387.19) - -
100% 7,273.93 27,188.73 - -
100% (1,547.83) (812.12) - -
100% 239.24 632.53 - -
100% 7,576.13 19,662.32 - -
100% (0.25) (0.76) - -
100% 281.25 186.01 - -
100% (209.26) (20,015.88) - -
100% (27.22) 100.13 - -
100% (15.72) 18.67 - -
100% (1.81) (172.95) - -
100% 1.21 (1,325.40) - -
100% (1.81) (1,012.18) - -
100% (1.81) (122.12) - -
100% 22.98 (4.01) - -
100% (648.95) (17,587.96) - -
100% (2,717.97) (6,298.12) - -
55.9% (221.36) (768.16) - -
100% (663.47) (1,724.30) - -
100% (4.72) (155.19) - -
100% (36.17) (19.56) - -
1.00 918.69 - - -
60% 29.03 - - -
241
Annual Report 2013-14

ONGC GroupPerformance at a Glance
(` in million unless otherwise stated) 2013-14 2012-13 2011-12 2010-11
242
# Exploration Costs writ ten of f towards Survey & Dry Wells have been regrouped from Depreciation, Depletion and Amortization since theserepresents cash expenditure and shown as a separate item.
In view of the Notification no. S.O 447(E) dated 28.02.2011, issued by Ministry of Corportae Af fairs, the Balance sheet of the Company isstmandatorily required to be prepared in Revised Schedule VI w.e.f 1 April, 2011 onwrads. Accordingly, the figures of FY 2013-14,
FY 2012-13, 2011-12 and FY 2010-11 are given as per the requirement of Revised Schedule VI and earlier years figures are as per Old Schedule VI.
FINANCIAL FINANCIAL
Income form Operations 1,782,051 1,658,482 1,511,003 1,252,873 Income from Operations (Gross) 1,085,787 1,105,621 1,036,483 898,872 755,854 630,663
Other Non-operating Income 68,937 54,907 47,934 37,180 Statutory Levies 213,391 229,963 240,025 216,411 175,823 155,922
Total Revenue 1,850,988 1,713,389 1,558,937 1,290,053 Operating Expenses 407,693 430,150 374,072 307,502 255,258 186,967
Statutory Levies 299,175 284,369 269,402 247,631 Exchange Loss/(Gain) (10,671) 11,716 1,018 (2,675) (463) 203
Operating Expenses 901,396 824,465 639,629 488,606 Profit Before Interest Depreciation & Tax (PBIDT) 475,374 433,792 421,368 377,634 325,236 287,571
Exchange Loss/(Gain) (650) 4,206 11,925 42 Recouped Costs 187,391 155,705 139,533 124,154 103,549 73,940 #Exploration costs writ ten of f 84,881 110,457 105,136 92,620 Operating Income (PBIT) 287,983 278,087 281,835 253,480 221,687 213,631
Profit Before Interest, Depreciation & Tax (PBIDT) 566,186 489,892 532,845 461,154 Interest (Net) (16,431) (32,950) (27,375) (19,241) (11,715) (10,991)
Depreciation, Depletion, Amortisation and Impairment 165,809 117,633 131,866 113,644 Profit before Tax and Extraordinary Items 304,414 311,037 309,210 272,721 233,402 224,622
Profit Before Interest & Tax (PBIT) 400,377 372,259 400,979 347,510 Extraordinary Items- Excess of Insurance Claims over Book Value - 658 - 4,751 6,405 -
Interest Payment 6,243 4,838 4,349 4,377 Profit before Tax 304,414 311,695 309,210 277,472 239,807 224,622
Profit before Tax and Exceptional Items 394,134 367,421 396,630 343,133 Corporate Tax 107,138 110,094 106,999 98,454 84,932 79,416
Exceptional item - - 31,405 - Profit af ter Tax 197,276 201,601 202,211 179,018 154,875 145,206
Profit before Tax 394,134 367,421 428,035 343,133 Share in Associates for the year 78 99 21 102 107 114
Corporate Tax 127,604 127,519 143,746 114,883 Profit relating to minority 3,319 3,747 3,509 1,424 1,006 1,930
Profit af ter Tax 266,530 239,902 284,289 228,250 Group Profit af ter Tax 194,035 197,953 198,723 177,696 153,976 143,390
Share in Associates for the year 118 38 (11) 30 Dividend 70,583 68,444 68,444 66,305 64,167 57,535
Profit relating to minority 1,583 (2,256) 2,842 3,720 Tax on Dividend 11,992 12,017 12,014 10,383 9,172 8,156
Group Profit af ter Tax 265,065 242,196 281,436 224,560 Share Capital 21,389 21,389 21,535 21,416 14,259 14,259
Dividend 81,277 81,277 83,416 74,859 Net Worth (Equity) 1,005,653 915,729 774,127 661,994 564,017 480,583
Tax on Dividend 13,842 13,053 13,611 12,528 Borrowings 51,769 13,091 9,427 12,964 22,342 23,870
Share Capital 42,778 42,778 42,778 42,778 Working Capital 192,787 172,257 240,202 202,408 173,164 135,348
Net Worth (Equity) 1,710,550 1,510,417 1,352,666 1,145,312 Capital Employed 869,009 752,781 693,329 618,263 513,037 430,333
Long-term Borrowings 316,810 88,428 52,086 39,771
Working Capital (45,799) 63,899 96,213 75,237 FINANCIAL PERFORMANCE RATIOS
Capital Employed 1,447,992 1,183,203 1,003,223 909,267 PBIDT to Turnover (%) 43.78 39.2 40.7 42.0 43.0 45.6
PBDT to Turnover (%) 45.29 42.2 43.3 44.2 44.6 47.3
FINANCIAL PERFORMANCE RATIOS Profit Margin(%)- incl. extraordinary items 17.87 17.9 19.2 19.8 20.4 22.7
PBIDT to Turnover (%) 31.77 29.54 35.26 36.81 ROCE(PBIDT to Capital Employed) (%) 54.70 57.6 60.8 61.1 63.4 66.8
PBDT to Turnover (%) 31.42 29.25 34.98 36.46 Net Profit to Equity (%)- incl. extraordinary items 19.29 21.6 25.7 26.8 27.3 29.8
Profit Margin (%)- incl. exceptional items 14.87 14.60 18.63 17.92
ROCE(PBIDT to Capital Employed) (%) 39.10 41.40 53.11 50.72 BALANCE SHEET RATIOS
Net Profit to Equity (%)- incl. exceptional items 15.50 16.04 20.81 19.61 Current Ratio 1.38:1 1.31:1 1.75:1 1.79:1 1.97:1 1.74:1
Debt Equity Ratio 0.05 0.01 0.01 0.02 0.04 0.05
BALANCE SHEET RATIOS Debtors Turnover Ratio (Days) 24 24 25 20 21 27
Current Ratio 0.93:1 1.13:1 1.21:1 1.21:1
Debt Equity Ratio 0.19 0.06 0.04 0.03 PER SHARE DATA
Debtors Turnover Ratio (Days) 32.83 33.88 28.31 29.05 Earning Per Share (Rs.)- before extraordinary items* 22.68 23.09 23.23 20.40 17.50 16.76
Earning Per Share (Rs.)- af ter extraordinary items* 22.68 23.14 23.23 20.77 18.00 16.76
PER SHARE DATA Dividend (%) 330 320 320 310 450 400
Earning Per Share (`) 30.98 28.31 32.90 26.25 Book Value Per Share(Rs.)* 118 107 90 77 66 56
Dividend (%) 190 190 195 175
Book Value Per Share (`) 200 177 158 134
ONGC GroupPerformance at a Glance
( in million unless otherwise stated) ` 2009-10 2008-09 2007-08 2006-07 2005-06 2004-05
243
*restated Post Bonus & split
Annual Report 2013-14

Statement of Income and Retained Earnings of ONGC Group
( in million) `
REVENUES Sales Crude Oil 654,451 621,576 640,041 558,993 Natural Gas 194,172 174,558 151,320 135,329 LPG 30,145 31,484 23,711 18,368 Naptha 75,743 76,805 72,167 56,342 Ethane/Propane 14,837 13,440 12,741 8,796 Superior Kerosene Oil 2,779 3,686 1,520 679 HSD 522 170 103 134 Motor Spirit - - 30 - Others 797,037 727,355 599,982 447,972 Price Revision Arrears - - - - Sub- Total 1,769,686 1,649,074 1,501,615 1,226,613 Traded Products 44 43 34 172 Other Operating Revenue 12,321 9,365 9,354 26,088 Total Revenue from Operations 1,782,051 1,658,482 1,511,003 1,252,873 Other Non-operating Income 68,937 54,907 47,934 37,180Total Revenues 1,850,988 1,713,389 1,558,937 1,290,053COST & EXPENSES Statutory Levies
(a) Royalties 150,102 137,210 155,316 126,529(b) OIDB Cess 99,734 99,971 57,831 56,963(c) Motor Spirit Cess 3 (d) Excise Duty 37,432 34,732 37,427 51,544(e) Natural Calamity Contingent Duty -Crude Oil 1,097 1,101 1,097 1,114(f) Sales Tax 3,123 3,834 3,339 3,112(g) Service Tax 439 353 8,337 2,018(h) Education Cess 2,348 3,111 1,871 1,828(i) Octroi & Port Trust Charges 4,897 4,057 4,184 4,523
Sub-Total (a to i) 299,175 284,369 269,402 247,631(Accretion)/Decretion in stock (7,193) (11,205) (4,641) (8,917)Production, Transportation, Selling andDistribution Expenditure 900,449 813,428 632,912 487,776 Provisions and Writ-of fs 10,563 22,243 11,599 9,635 Exchange Loss (650) 4,206 11,925 42 Adjustments relating to Prior Period (Net) (2,423) (1) (241) 112 Exploration Costs Writ ten of f - Survey Costs 17,471 18,078 14,947 19,542
- Exploratory Well Costs 67,410 92,379 90,189 73,078Profit Before Depreciation, Interest &Tax 566,186 489,892 532,845 461,154Depreciation, Depletion, Amortisation andImpairment 165,809 117,633 131,866 113,644 Total Cost & Expenses 1,450,611 1,341,130 1,157,958 942,543 Operating Income Before Interest &Tax 400,377 372,259 400,979 347,510 Interest Payment 6,243 4,838 4,349 4,377 Profit before Tax and Exceptional Items 394,134 367,421 396,630 343,133Exceptional item - - 31,405 -Profit before Tax 394,134 367,421 428,035 343,133Corporate Tax ( Net) 127,604 127,519 143,746 114,883Profit af ter Tax 266,530 239,902 284,289 228,250Share in Associates for the year 118 38 (11) 30 Profit relating to minority 1,583 (2,256) 2,842 3,720 Group Profit af ter Tax 265,065 242,196 281,436 224,560 Profit & Loss Account Balance brought forward 205,773 179,959 144,332 116,377 Adjustments due to change in shareholding /other adjustment 36 59 44 (137)Transfer to Capital Redemption Reserve - 46 46 -Dividend 81,277 81,277 83,416 74,859Tax on Dividend 13,842 13,053 13,611 12,528Transfer to general Reserve 132,250 117,757 144,461 104,773Transfer to Debenture Redemption Reserve 10,400 4,308 4,319 4,308Retained Earnings For The Year 233,105 205,773 179,959 144,332
2013-14 2012-13 2011-12 2010-11
244
In view of the Notification no. S.O 447(E) dated 28.02.2011, issued by Ministry of Corporate Af fairs, the Balance sheet of the Company isstmandatorily required to be prepared in Revised Schedule VI w.e.f 1 April, 2011 onwards. Accordingly, the figures of FY 2013-14,
FY 2012-13, 2011-12 and FY 2010-11 are given as per the requirement of Revised Schedule VI and earlier years figures are as per Old Schedule VI.
Statement of Income and Retained Earnings of ONGC Group
(` in million) 2009-10 2008-09 2007-08 2006-07 2005-06 2004-05
245
REVENUES SalesCrude Oil 527,312 491,127 543,631 475,295 382,311 299,765 Natural Gas 81,405 82,835 78,560 80,117 73,383 57,759 LPG 21,924 22,752 20,169 14,867 16,279 12,066 Naptha/Aromatic Rich Naptha 47,137 48,406 43,848 37,907 35,679 29,260 Ethane/Propane 10,249 9,890 9,291 9,095 7,401 5,705 Superior Kerosene Oil 3,255 16,701 10,775 15,754 10,605 16,896 HSD 156 61,910 48,621 42,037 23,403 29,277 Motor Spirit 27 11,062 9,159 4,530 3,797 6,846 Others 370,250 349,257 254,297 183,064 188,892 164,217 Price Revision Arrears - - - 11 156 584 Sub- Total 1,061,715 1,093,940 1,018,351 862,677 741,906 622,375 Write Back of Excess Liability - - - - - - Pipeline Revenue 3,126 5,267 4,644 3,351 3,214 23 Other Receipts 17,217 9,858 12,387 23,029 11,279 6,989 Accretion /(Decretion) in stock 3,729 (3,444) 1,101 9,815 (545) 1,276 Total Revenues 1,085,787 1,105,621 1,036,483 898,872 755,854 630,663 COST & EXPENSESOperating, Selling & General
(a) Royalties 103,561 111,574 121,057 104,558 85,242 65,692 (b) OIDB Cess/ Excise Duty 98,831 103,571 108,838 100,160 76,755 68,556 (c) Natural Calamity Contingent Duty - Crude Oil 1,062 1,081 1,127 1,149 1,080 1,138 (d) Sales Tax 3,734 7,823 2,947 6,009 10,299 17,405 (e) Education Cess * 1,719 1,784 1,861 1,303 (f) Octroi & Port Trust Charges 4,484 4,130 4,195 3,232 2,447 3,131 (g) VAT 816 800 685 1,063 927 410
Sub-total (a to f) 213,391 229,963 240,025 216,411 175,823 155,922 Pipeline Operations (Excluding Depreciation) 11,967 10,725 10,343 9,122 7,732 10,320 Other Operating Costs 395,726 419,425 363,729 298,380 247,526 176,647 Exchange Loss/(Gain) (10,671) 11,716 1,018 (2,675) (463) 203 Recouped Costs
(a) Depletion 62,242 55,883 49,259 46,439 34,318 27,802 (b) Depreciation 20,767 21,822 27,874 29,060 28,556 10,223 (c) Amortisation 104,815 81,110 62,837 46,925 41,001 35,774 (d) Impairment (433) (3,110) (437) 1,730 (326) 141
Sub-Total (a to d) 187,391 155,705 139,533 124,154 103,549 73,940 Total Cost & Expenses 797,804 827,534 754,648 645,392 534,167 417,032 Operating Income Before Interest &Tax 287,983 278,087 281,835 253,480 221,687 213,631 Interest
- Payments 5,564 2,386 1,135 1,906 1,597 1,644 - Receipts 21,995 35,336 28,510 21,147 13,312 12,635
Net Interest (16,431) (32,950) (27,375) (19,241) (11,715) (10,991)Profit before Tax and Extraordinary Items 304,414 311,037 309,210 272,721 233,402 224,622 Extraordinary Items- Excess of Insurance Claims over Book Value - 658 - 4,751 6,405 - Profit before Tax 304,414 311,695 309,210 277,472 239,807 224,622 Corporate Tax ( Net) 107,138 110,094 106,999 98,454 84,932 79,416 Profit af ter Tax 197,276 201,601 202,211 179,018 154,875 145,206 Share in Associates for the year 78 99 21 102 107 114 Profit relating to minority 3,319 3,747 3,509 1,424 1,006 1,930 Group Profit af ter Tax 194,035 197,953 198,723 177,696 153,976 143,390 Profit & Loss Account Balance brought forward 93,335 58,990 28,795 8,848 1 1 Adjustments (21) (107) - - - - Dividend 70,583 68,444 68,444 66,305 64,167 57,535 Tax on Dividend 11,992 12,017 12,014 10,383 9,172 8,156 Retained Earnings For The Year 204,774 176,375 147,060 109,856 80,638 77,700
* upto 2005-06 Education Cess is included in respective heads of levies
Annual Report 2013-14

Statement of Financial Position of ONGC Group
(` in million) 2012-132013-14 2011-12 2010-11
246
In view of the Notification no. S.O 447(E) dated 28.02.2011, issued by Ministry of Corporate Af fairs, the Balance sheet of the Company isst mandatorily required to be prepared in Revised Schedule VI w.e.f 1 April, 2011 onwards. Accordingly, the figures of FY 2012-13, 2011-12 and
FY 2010-11 are given as per the requirement of Revised Schedule VI and earlier years figures are as per Old Schedule VI.
(` in million) 2009-10 2008-09 2007-08 2006-07 2005-06 2004-05
247
# Excluded for Current Ratio.
RESOURCES RESOURCES
A. Own A. Own
Net Worth 1. Net Worth
(a) Equity (a) Equity
i) Share Capital 42,778 42,778 42,778 42,778 i) Share Capital 21,389 21,389 21,535 21,416 14,259 14,259
ii) Reserves & Surplus 1,678,732 1,482,498 1,321,614 1,110,495 ii) Reserves & Surplus 992,677 900,846 759,331 645,719 553,421 471,941
Sub-Total 1,721,510 1,525,276 1,364,392 1,153,273 Sub-Total 1,014,066 922,235 780,866 667,135 567,680 486,200
(b) Less: Miscelaneous Expenditure 10960 14,859 11,726 7,961 (b) Less: Deffered Revenue Expenditure 8,413 6,506 6,739 5,141 3,663 5,617
Net Worth 1,710,550 1,510,417 1,352,666 1,145,312 Net Worth 1,005,653 915,729 774,127 661,994 564,017 480,583
B. Long-term Borrowings 316,810 88,428 52,086 39,771 2. Long Term Liabilities
C. Deferred Tax Liability (Net) 178,635 142,251 121,846 111,526 Net Deferred Tax Liability 102,912 92,231 87,376 81,119 71,633 57,894
D. Minority Interest 29,126 19,466 22,240 19,891 Total Own Funds ( 1 + 2 ) 1,108,565 1,007,960 861,503 743,113 635,650 538,477
TOTAL RESOURCES ( A+B+C+D ) 2,235,121 1,760,562 1,548,838 1,316,500 B. Minority Interest 16,432 14,113 11,448 8,321 7,230 6,204
DISPOSITION OF RESOURCES C. Outside
A. Non-current assets 1. Unsecured Loans
1. Fixed Assets( Net) a) Indian Loans 34,550 6,015 2,079 1,881 1,745 1,643
i) Tangible assets 462,254 406,745 306,080 266,924 b) Foreign Loans 10,260 1,492 1,458 4,526 13,181 11,718
ii) Producing Properties 912,681 705,395 608,004 571,896 Total Unsecured Loans 44,810 7,507 3,537 6,407 14,926 13,361
iii) Intangible assets 754 1,041 1,364 1,735 2. Secured Loans 6,959 5,584 5,890 6,557 7,416 10,509
Total Block Capital 1,375,689 1,113,181 915,448 840,555 Total Outside Resources 51,769 13,091 9,427 12,964 22,342 23,870
2. Goodwill on consolidation 183,545 83,255 77,976 89,928 TOTAL RESOURCES ( A+ B+C ) 1,176,766 1,035,164 882,378 764,398 665,222 568,551
3. Long-term Loans and Advances(Excluding Capital Advance) 82,876 67,002 51,029 58,250
4. Deposit with Bank Under Site Restoration Fund Scheme 120,830 106,349 94,753 81,262 DISPOSITION OF RESOURCES
5. Other non-current Assets (Excluding DRE) 53,474 19,642 20,302 5,619 A. Goodwill on consolidation 95,385 114,039 25,777 30,616 17,103 13,683
6. Sub-Total = (1+2+3+4+5) 1,816,414 1,389,429 1,159,508 1,075,614 B. Block Capital
7. Less: Non-current Liabilities 1. Fixed Assets 243,762 184,956 193,961 185,355 138,806 116,689
a) Other Long Term Liabilities 18,525 17,163 10,758 9,731 2. Producing Properties (Gross) 511,665 452,980 362,714 351,741 312,639 245,554
b) Libility for Abandonment Cost 274,266 207,255 203,982 198,469 Less: Liability for Abandonment Cost 174,590 171,451 129,325 151,857 128,675 80,941
c) Long Term Provisions 29,832 45,707 37,758 33,384 Total Block Capital 580,837 466,485 427,350 385,239 322,770 281,302
Sub-Total (7) 322,623 270,125 252,498 241,584 C. Working Capital
Net Non Current Asset (A)=(6)-(7) 1,493,791 1,119,304 907,010 834,030 a) Current Assets
B. Net Working Capital i) Inventories 82,400 65,424 72,985 58,744 49,432 43,730
1. Current Assets ii) Debtors (Net of Provision) 71,424 71,814 70,469 48,167 44,271 47,091
i) Inventories 148,015 127,726 131,680 85,676 iii) Cash & Bank Balances 149,704 156,331 186,525 150,653 45,721 66,035
ii) Trade Receivables 160,284 153,956 117,181 99,730 iv) Deposit with Bank Under Siteiii) Cash & Cash equivalents 244,801 196,190 278,914 208,158 Restoration Fund Scheme# 74,138 69,624 64,034 56,103 45,336 36,180
iv) Short-term Loans & Advances 68,199 59,766 52,210 40,124 v) Loans & Advances and Others 127,998 143,953 81,332 74,738 120,683 77,192
v) Others Current Assets (Excluding DRE) 6,422 9,082 19,643 5,955 Sub-Total 505,664 507,146 475,345 388,405 305,443 270,228
Sub-Total 627,721 546,720 599,628 439,643 Less:
Less: (b) Current Liabilities and Provisions
2. Current Liabilities and Short Term Loans 312,877 334,889 235,143 185,997 132,279 134,880
i) Short-term borrowings 139,073 115,271 100,538 20,843 Working Capital 192,787 172,257 240,202 202,408 173,164 135,348
ii) Trade payables 306,783 186,148 176,036 155,863 D. CAPITAL EMPLOYED 869,009 752,781 693,329 618,263 513,037 430,333
iii) Other current liabilities 218,194 170,869 202,917 176,615 E. INVESTMENTS 51,593 34,803 44,821 35,832 35,579 26,555
iv) Short-term provisions 9,470 10,533 23,924 11,085 F. CAPITAL WORKS IN PROGRESS 176,039 165,222 86,351 64,055 76,292 87,775
Sub-Total 673,520 482,821 503,415 364,406 G. EXPLORATORY/DEVELOPMENTNet Working Capital (45,799) 63,899 96,213 75,237 WELLS IN PROGRESS 80,125 82,358 57,877 46,248 40,314 23,888
C. Capital Employed 1,447,992 1,183,203 1,003,223 909,267 TOTAL DISPOSITION 1,176,766 1,035,164 882,378 764,398 665,222 568,551
D. Investments
i) Non-current Investments 47,205 20,453 20,412 28,920
ii) Current Investments 254 829 8,795 2,080
E. Capital Works in Progress (Including Capital Advance) 557,603 419,676 399,855 273,854
F. Exploratory/Development Wells in Progress 182,067 136,401 116,553 102,379
TOTAL DISPOSITION (C+D+E+F) 2,235,121 1,760,562 1,548,838 1,316,500
Annual Report 2013-14
Auditors’ Report - ONGC Group
248
To
The Board of Directors
Oil and Natural Gas Corporation Limited
1. Report on the Consolidated Financial Statements
We have audited the accompanying consolidated financial statements of Oil and Natural Gas Corporation Limited (" the Company") and its subsidiaries, joint ventures and associate (hereinaf ter referred to as "Group"), which comprise the consolidated Balance Sheet as at March 31, 2014, and the consolidated Statement of Profit and Loss and the consolidated Cash Flow Statement for the year then ended, and a summary of significant accounting policies and other explanatory information.
2. Management's Responsibility for the Consolidated Financial Statements
Management is responsible for the preparation of these consolidated financial statements that give a true and fair view of the consolidated financial position, consolidated financial performance and consolidated cash flows of the Group in accordance with accounting principles generally accepted in India. This responsibility includes the design, implementation and maintenance of internal control relevant to the preparation and presentation of the consolidated financial statements that give a true and fair view and are free from material misstatement, whether due to fraud or error.
3. Auditors' Responsibility
Our responsibility is to express an opinion on these consolidated financial statements based on our audit. We conducted our audit in accordance with the Standards on Auditing issued by the Institute of Chartered Accountants of India.Those Standards require that we comply with ethical requirements and plan and perform the audit to obtain reasonable assurance about whether the consolidated financial statements are free from material misstatement.
An audit involves performing procedures to obtain audit evidence about the amounts and disclosures in the consolidated financial statements. The procedures selected depend on the auditors' judgement, including the assessment of the risks of material misstatement of the consolidated financial statements, whether due to fraud or error. In making those risk assessments, the auditor considers internal control relevant to the Group's preparation and presentation of the consolidated financial statements that give a true and fair view in order to design audit procedures that are appropriate in the circumstances, but not for the purpose of expressing an opinion on the ef fectiveness of the Group's internal control. An audit also includes evaluating the appropriateness of accounting policies used and the reasonableness of the accounting estimates made by management, as well as evaluating the overall presentation of the consolidated financial statements.
We believe that the audit evidence we have obtained is suf ficient and appropriate to provide a basis for our
audit opinion.
4. Opinion
In our opinion and to the best of our information and according to the explanations given to us and based on the consideration of the audit reports of the other auditors in case of audited financial statements and management certified accounts in case of unaudited financial statements referred to in "Other Matters" below, the consolidated financial statements give a true and fair view in conformity with the accounting principles generally accepted in India:
i. in the case of the consolidated Balance Sheet, ofthe state of af fairs of the Group as at March 31,2014;
ii. in the case of the consolidated Statement of Profitand Loss, of the profit of the Group for the yearended on that date; and
iii. in the case of the consolidated Cash FlowStatement, of the cash flows of the Group for theyear ended on that date.
5. Emphasis of Matter
We draw at tention to Note No. 45.2.4 with regard to the dispute between the company and the Government of Gujarat in respect of payment of Royalty on the crude oil produced in the State. The accrual of the additional liability of ` 1,16,326.96 millions, which also includes an amount of ` 2,092.23 millions paid with ef fect from February 1, 2014 and considered as deposit, would depend on the decision of the Hon'ble Supreme Court of India. The amount of ` 1,16,326.96 millions has been disclosed as contingent liability.
Our opinion is not qualified in respect of this matter.
6. Other Matters
i. The consolidated financial statements include the Company's share in the total value of assets, liabilities, expenditure and income of 135 blocks under New Exploration Licensing Policy (NELPs) / Joint Venture (JVs) accounts for exploration and production out of which 8 NELPs / JVs accounts have been certified by other firms of Chartered Accountants and 11 NELP / JVs have been certified by the management in respect of NELPs / JVs operated by other operators. Our opinion is based solely on the reports of the other auditors and management certified accounts
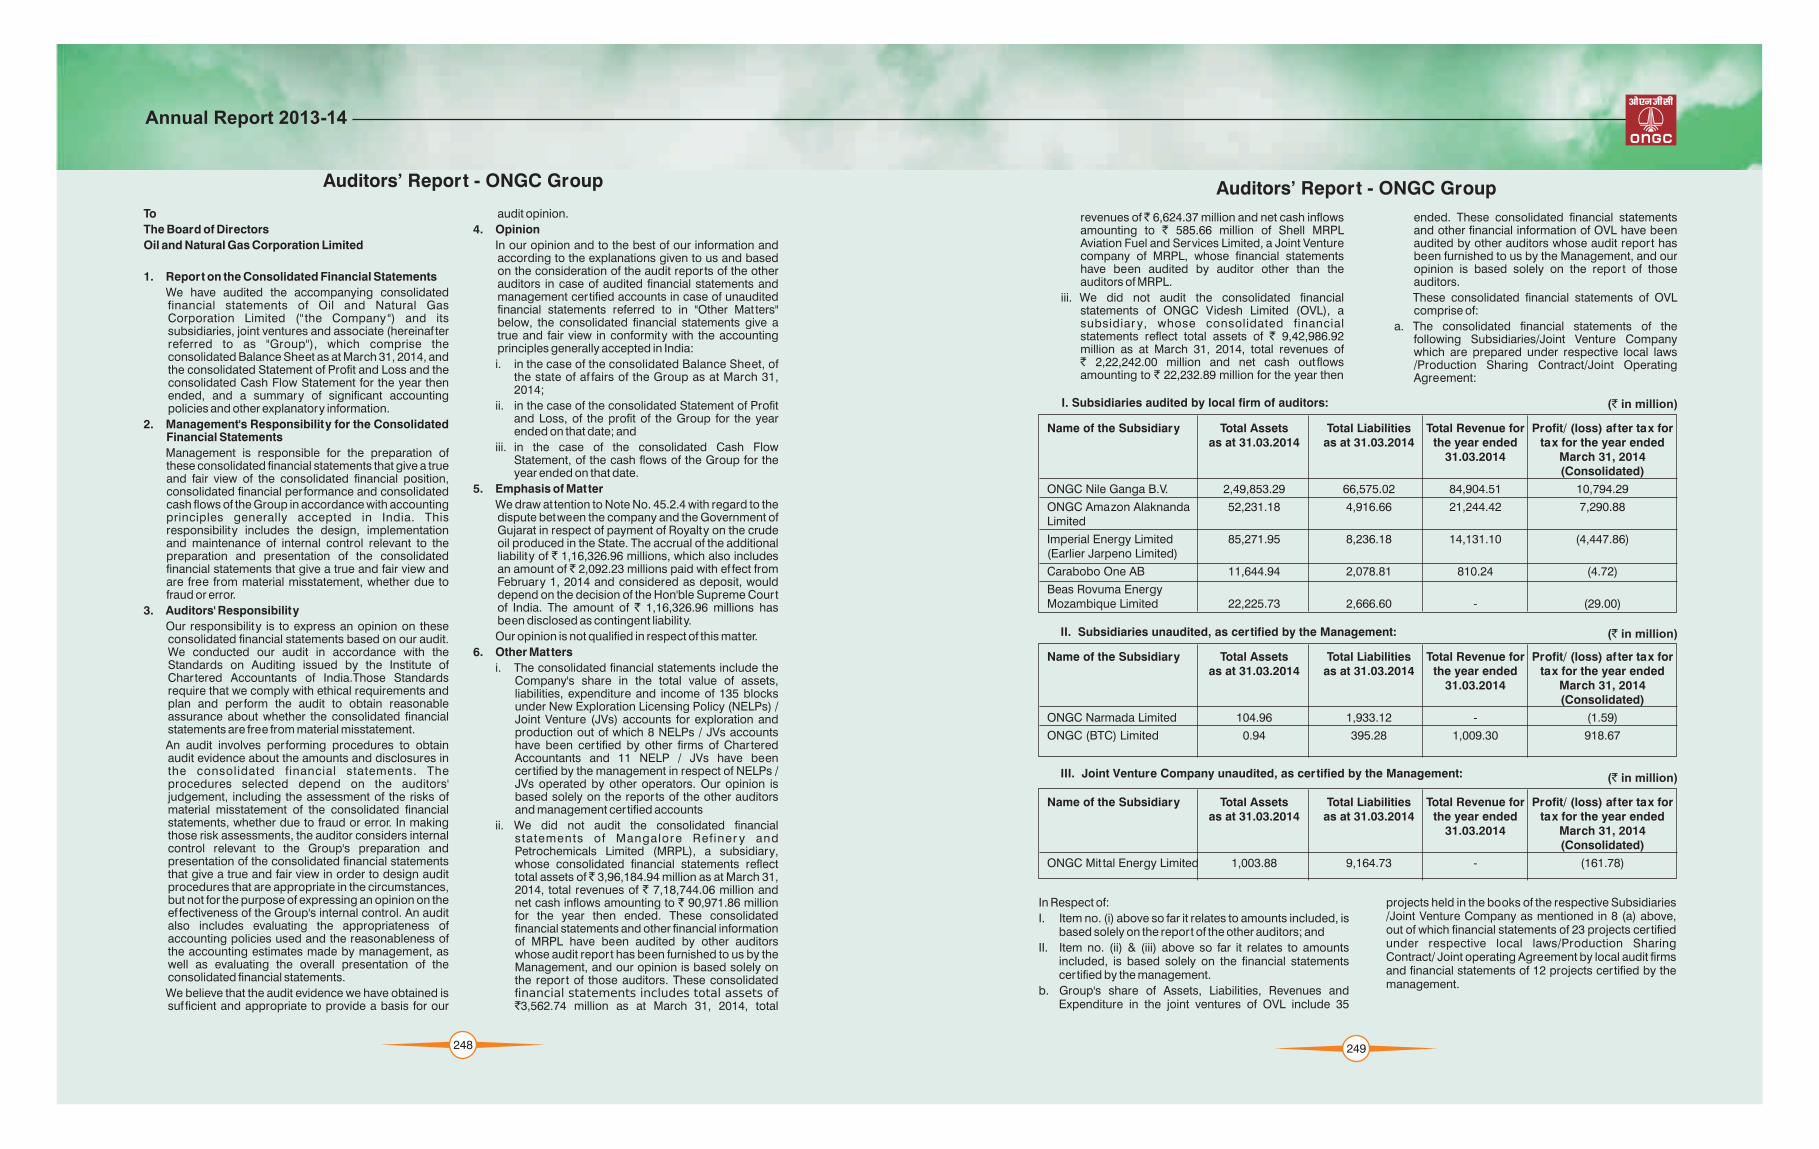
ii. We did not audit the consolidated financial statements of Mangalore Ref iner y and Petrochemicals Limited (MRPL), a subsidiary, whose consolidated financial statements reflect total assets of 3,96,184.94 million as at March 31, 2014, total revenues of ` 7,18,744.06 million and net cash inflows amounting to ` 90,971.86 million for the year then ended. These consolidated financial statements and other financial information of MRPL have been audited by other auditors whose audit report has been furnished to us by the Management, and our opinion is based solely on the report of those auditors. These consolidated financial statements includes total assets of `3,562.74 million as at March 31, 2014, total
Auditors’ Report - ONGC Group
249
revenues of 6,624.37 million and net cash inflows amounting to ` 585.66 million of Shell MRPL Aviation Fuel and Services Limited, a Joint Venture company of MRPL, whose financial statements have been audited by auditor other than the auditors of MRPL.
iii. We did not audit the consolidated financial statements of ONGC Videsh Limited (OVL), a subsidiar y, whose consolidated financial statements reflect total assets of ` 9,42,986.92 million as at March 31, 2014, total revenues of` 2,22,242.00 million and net cash out flows amounting to ` 22,232.89 million for the year then
ended. These consolidated financial statements and other financial information of OVL have been audited by other auditors whose audit report has been furnished to us by the Management, and our opinion is based solely on the report of those auditors.
These consolidated financial statements of OVL comprise of:
a. The consolidated financial statements of the following Subsidiaries/Joint Venture Company which are prepared under respective local laws/Production Sharing Contract/Joint Operating Agreement:
I. Subsidiaries audited by local firm of auditors:
Name of the Subsidiary Total Assets as at 31.03.2014
ONGC Nile Ganga B.V. 2,49,853.29 66,575.02 84,904.51 10,794.29
ONGC Amazon AlaknandaLimited
Imperial Energy Limited(Earlier Jarpeno Limited)
Carabobo One AB 11,644.94 2,078.81 810.24 (4.72)
Beas Rovuma EnergyMozambique Limited 22,225.73 2,666.60 - (29.00)
Total Liabilities Total Revenue for Profit/ (loss) af ter tax foras at 31.03.2014 the year ended tax for the year ended
31.03.2014 March 31, 2014(Consolidated)
52,231.18 4,916.66 21,244.42 7,290.88
85,271.95 8,236.18 14,131.10 (4,447.86)
Name of the Subsidiary Total Assets as at 31.03.2014
Total Liabilities Total Revenue for Profit/ (loss) af ter tax foras at 31.03.2014 the year ended tax for the year ended
31.03.2014 March 31, 2014(Consolidated)
ONGC Narmada Limited 104.96 1,933.12 - (1.59)
ONGC (BTC) Limited 0.94 395.28 1,009.30 918.67
Name of the Subsidiary Total Assets as at 31.03.2014
Total Liabilities Total Revenue for Profit/ (loss) af ter tax foras at 31.03.2014 the year ended tax for the year ended
31.03.2014 March 31, 2014(Consolidated)
ONGC Mit tal Energy Limited 1,003.88 9,164.73 - (161.78)
II. Subsidiaries unaudited, as certified by the Management:
III. Joint Venture Company unaudited, as certified by the Management:
In Respect of:
I. Item no. (i) above so far it relates to amounts included, is based solely on the report of the other auditors; and
II. Item no. (ii) & (iii) above so far it relates to amounts included, is based solely on the financial statements certified by the management.
b. Group's share of Assets, Liabilities, Revenues and Expenditure in the joint ventures of OVL include 35
projects held in the books of the respective Subsidiaries /Joint Venture Company as mentioned in 8 (a) above, out of which financial statements of 23 projects certified under respective local laws/Production Sharing Contract/ Joint operating Agreement by local audit firms and financial statements of 12 projects certified by the management.
(` in million)
(` in million)
(` in million)
Annual Report 2013-14

Auditors’ Report - ONGC Group
250
iv. We did not audit the financial statements of the following Joint Ventures, whose financial statements reflect group's total assets as at March 31, 2014, group's total revenues and group's net cash flows for the year then ended as per the table given below. Financial statements of 5 Joint Ventures have been audited by other auditors whose report has been
furnished to us by the Management and financial statements of 3 Joint Ventures are unaudited and have been certified by the management of the respective Joint Venture, and our opinion, so far as it relates to the amounts included in respect of these Joint Ventures, is based solely on the report of those auditors or management certified accounts.
SI. Name of the Joint Venture Group's share ofTotal Assets
I Petronet LNG Limited 14,890.85 47,289.16 (44.75) Audited
II Petronet MHB Limited 1,461.64 378.02 53.94 Audited
III Mangalore SEZ Limited(Consolidated Financial Statements) 3,402.47 65.98 (125.10) Unaudited
IV ONGC Mangalore PetrochemicalsLimited 28,146.80 0.12 487.62 Audited
V ONGC Petro Additions Limited 96,356.62 - 3,375.61 Audited
VI ONGC Tripura Power Company Limited (Consolidated Financial Statements) 20,322.54 1,123.74 (20.84) Unaudited
VII ONGC Teri Biotech Limited 186.42 77.19 31.75 Audited
VIII Dahej SEZ Limited 4,718.45 279.69 (47.86) Unaudited
Group's share Group's share Audited / No. of Total of Net Unaudited
Revenue Cash Flows
evaluation by the Management in respect of categorization of wells as exploratory, development and producing, allocation of cost incurred on them, depletion of producing properties on the basis of proved developed hydrocarbon reserves, impairment, liability for abandonment costs, liabilities under NELP for under per formance against Minimum Work Programme and allocation of depreciation on process plat forms to transportation and facilities.
Our opinion is not qualified in respect of other matters.
v. For the purpose of considering the investment in Pawan Hans Limited, an associate, in the consolidated financial statements, the share of profit for the year ended March 31, 2014 amounting to 118.15 million, is based on unaudited accounts as certified by the management. We did not audit the financial statements of this associate, and our opinion, so far as it relates to the amounts included in respect of this associate, is based solely on the financial statements certified by the management.
vi. We have placed reliance on technical / commercial
For M/s S Bhandari & Co.Chartered AccountantsFirm Reg No. 000560C
(P. D. Baid)Partner (Mem. No. 072625)
For M/s Varma & VarmaChartered Accountants Firm Reg No. 004532S
(K. M. Sukumaran)Partner (Mem. No. 015707)
For M/s G. D. Apte & Co.Chartered AccountantsFirm Reg No. 100515W
(C. M. Dixit)Partner (Mem. No. 017532)
Date : May 29, 2014Place : New Delhi
For M/s Ray & RayChartered AccountantsFirm Reg No. 301072E
(B. K. Ghosh)Partner (Mem. No. 051028)
For M/s Mehra Goel & Co.Chartered AccountantsFirm Reg No. 000517N
(R. K. Mehra)Partner (Mem. No. 006102)
(` in million)
Annual Report 2013-14

Consolidated Balance Sheet stas at 31 March, 2014
I. EQUITY AND LIABILITIES1 Shareholders’ funds
(a) Share capital 4 42,777.60 42,777.60 (b) Reserves and surplus 5 1,678,732.26 1,482,498.10
2 Minority Interest 29,125.42 19,466.49 3 Non-current liabilities
(a) Long-term borrowings 6 316,808.58 88,427.47 (b) Deferred tax liabilities 7 185,521.07 148,490.07 (c) Other Long term liabilities 8 18,525.31 17,163.11 (d) Long-term provisions 9 304,098.13 252,962.77
4 Current liabilities(a) Short-term borrowings 10 139,072.72 115,270.96 (b) Trade payables 11 306,783.08 186,147.80 (c) Other current liabilities 12 218,193.90 170,869.13 (d) Short-term provisions 13 9,469.90 10,532.92
TOTAL 3,249,107.97 2,534,606.42
II. ASSETS1 Non-current assets
(a) Fixed assets(i) Tangible assets 14 462,253.51 406,744.58 (ii) Producing Properties 15 912,681.47 705,395.44 (iii) Intangible assets 16 754.36 1,041.25 (iv) Capital work-in-progress 17 538,269.85 397,449.18 (v) Exploratory/Development Wells in Progress 18 182,066.98 136,400.94
(b) Goodwill on consolidation 19 183,544.90 83,254.88 (c) Non-current investments 20 47,204.63 20,452.81 (d) Deferred tax Asset 7 6,885.97 6,238.88 (e) Long-term loans and advances 21 102,208.45 89,229.01 (f) Deposit under Site Restoration Fund Scheme 120,829.56 106,349.19 (g) Other non-current assets 22 60,859.14 29,685.30
2 Current assets(a) Current investments 23 254.37 829.02 (b) Inventories 24 148,014.59 127,725.91 (c) Trade receivables 25 160,283.56 153,956.09 (d) Cash and Cash Equivalents 26 244,801.26 196,190.51 (e) Short-term loans and advances 27 68,199.41 59,766.09 (f) Other current assets 28 9,995.96 13,897.34
3,249,107.97 2,534,606.42
Accompanying Notes are an integral part ofthis Financial Statements. 1 to 50
TOTAL
Particulars Note No. As atst31 March, 2014
As atst31 March, 2013
(` in million)
(A K Banerjee)Director (Finance)
(D.K.Sarraf)Chairman & Managing Director
For and on behalf of the Board
(N. K. Sinha)Company Secretary
For G D Apte & Co. Chartered AccountantsFirm Reg. No. 100515W
(C. M. Dixit) Partner (M. No. 017532)
For Ray & RayChartered AccountantsFirm Reg. No. 301072E
(B.K.Ghosh)Partner (M. No. 051028)
New DelhithMay 29 , 2014
For Varma & VarmaChartered AccountantsFirm Reg. No. 004532S
(K.M. Sukumaran)Partner (M. No. 015707)
For Mehra Goel & Co. Chartered AccountantsFirm Reg. No. 000517N
(R.K.Mehra) Partner (M.No. 006102)
For S. Bhandari & Co.Chartered AccountantsFirm Reg. No. 000560C
(P. D. Baid)Partner (M. No. 072625 )
In terms of our report of even date attached
252
Consolidated Statement of Profit and Lossstfor the year ended 31 March, 2014
I REVENUERevenue from Operations (Gross) 29 1,782,051.84 1,658,481.91 Less: Excise Duty 37,281.28 34,456.70 Revenue from Operations (Net) 1,744,770.56 1,624,025.21 Other Income 30 68,937.11 54,906.91 TOTAL REVENUE 1,813,707.67 1,678,932.12
II EXPENSES (Increase)/ Decrease in Inventories 31 (7,192.63) (11,205.01)Purchases of stock-in-trade 0.32 0.42 Production, Transportation, Selling and Distribution Expenditure 32 1,161,692.53 1,067,545.05Exploration Costs writ ten of f- Survey costs 17,471.47 18,077.72 - Exploratory well costs 67,409.85 92,378.82 Depreciation, Depletion, Amortisation and Impairment 33 165,809.04 117,633.04 Finance Costs 34 6,243.35 4,837.97 Provisions and Write-of fs 35 10,563.05 22,243.59 Adjustments relating to Prior Period (Net) 36 (2,423.37) (1.14)
TOTAL EXPENSES 1,419,573.61 1,311,510.46
Profit before Exceptional, Extraordinary items and Tax 394,134.06 367,421.65 Exceptional items - - Profit before Extraordinary items and Tax 394,134.06 367,421.65Extraordinary items - - PROFIT BEFORE TAX 394,134.06 367,421.65
Tax Expenses - Current Tax 90,449.09 112,139.08- Earlier years 2,449.89 (4,849.02)- MAT Credit (2,872.04) 19.34 - Deferred Tax 37,576.92 20,209.62 PROFIT AFTER TAX 266,530.20 239,902.63
Add: Share of Profit/(Loss) in Associate 20.4 118.15 37.94 Less: Share of Profit - Minority Interest 1,583.02 (2,255.87)
GROUP PROFIT AFTER TAX 265,065.33 242,196.44 Earning per Equity Share-Basic and Diluted (`) 37 30.98 28.31 (Face Value ` 5/- per Share)
Accompanying Notes are an integral part of this Financial Statements. 1 to 50
Particulars Note No. 2013-14 2012-13
(` in million)
253
(A K Banerjee)Director (Finance)
(D.K.Sarraf)Chairman & Managing Director
For and on behalf of the Board
(N. K. Sinha)Company Secretary
For G D Apte & Co. Chartered AccountantsFirm Reg. No. 100515W
(C. M. Dixit) Partner (M. No. 017532)
For Ray & RayChartered AccountantsFirm Reg. No. 301072E
(B.K.Ghosh)Partner (M. No. 051028)
New DelhithMay 29 , 2014
For Varma & VarmaChartered AccountantsFirm Reg. No. 004532S
(K.M. Sukumaran)Partner (M. No. 015707)
For Mehra Goel & Co. Chartered AccountantsFirm Reg. No. 000517N
(R.K.Mehra) Partner (M.No. 006102)
For S. Bhandari & Co.Chartered AccountantsFirm Reg. No. 000560C
(P. D. Baid)Partner (M. No. 072625 )
In terms of our report of even date attached
Annual Report 2013-14

A CASH FLOW FROM OPERATING ACTIVITIES:
Profit before tax and extraordinary items 394,134.06 367,421.65
Adjustments For:
- Prior Period Items (2,423.37) (1.14)
- Depreciation, Depletion and Amortisation & Impairment 165,809.04 120,942.32
- Exploration Well Costs Writ ten of f 67,409.85 92,378.82
- Interest on Borrowings 6,243.35 4,837.97
- Foreign Exchange Loss/Translation Adjustment 21,188.73 11,109.43
- Provision for Employee Benefits (14,509.31) 9,508.82
- Provision for Abandonment 243.56 -
- Profit/Loss on sale of fixed assets 15.55 27.97
- Lease Income (Net) - -
- Other Provision and Write of fs 10,563.05 22,243.59
- Excess Provision/Liability writ ten Back (19,216.85) (11,002.81)
- Interest Income (32,434.34) (31,218.82)
- Def fered Government Grant (2.87) (3.28)
- Dividend Received (3,550.25) (3,187.34)
- Miscellaneous Expenditure writ ten of f - 0.03
- Provision for Mark to Market loss on Derivative contracts 2,244.85 -
- Profit on sale of investment (14.50) 201,566.49 - 215,635.56 -
Operating Profit before Working Capital Changes 595,700.55 583,057.21
Adjustments for:-
- Receivables 5,713.05 (44,305.25)
- Loans and Advances (1,371.97) (8,810.72)
- Other Current Assets (148,012.35) (11,757.97)
- Inventories (22,016.15) 2,921.88
- Trade Payable and Other Liabilities 207,718.63 42,031.20 1,886.04 (60,066.02)
Cash generated from Operations 637,731.75 522,991.19
Direct Taxes Paid (Net of tax refund) (105,666.61) (124,162.45)
Cash Flow before prior period and Extra ordinary Items 532,065.14 398,828.74
Prior period items 638.65 (86.96)
NET CASH FLOW FROM OPERATING ACTIVITIES 'A' 532,703.79 398,741.78
B. CASH FLOW FROM INVESTING ACTIVITIES:
Purchase of Fixed Assets (149,385.04) (179,608.84)
Sale of Fixed Assets 29.04 172.44
Acquisition, Exploration and Development Cost (466,269.90) (243,193.21)
Purchase of Investments - (825.50)
Sale of Investments 651.49 8,791.86
Advance/Investment in Joint Controlled Entities/Associates (4,664.61) 263.07
Loans to Public Sector Undertakings and Other Bodies Corporate (26,707.48) 83.03
Gain on Foreign Exchange Forward exchange Contract 797.15 704.76
Deposit in Site Restoration Fund (14,480.37) (11,596.32)
Project Development/ Preoperative expenditure (net of advances) (11,297.24) (26,125.67)
Dividend Received 3,551.30 3,199.07
Interest Received 31,450.08 35,936.50
NET CASH FLOW FROM INVESTING ACTIVITIES 'B' (636,325.59) (412,198.81)
Year Endedst 31 March, 2014
Year Endedst 31 March, 2013
(` in million)
Consolidated Cash Flow Statementstfor the year ended 31 March, 2014
254
(A K Banerjee)Director (Finance)
(D.K.Sarraf)Chairman & Managing Director
For and on behalf of the Board
(N. K. Sinha)Company Secretary
For G D Apte & Co. Chartered AccountantsFirm Reg. No. 100515W
(C. M. Dixit) Partner (M. No. 017532)
For Ray & RayChartered AccountantsFirm Reg. No. 301072E
(B.K.Ghosh)Partner (M. No. 051028)
New DelhithMay 29 , 2014
For Varma & VarmaChartered AccountantsFirm Reg. No. 004532S
(K.M. Sukumaran)Partner (M. No. 015707)
For Mehra Goel & Co. Chartered AccountantsFirm Reg. No. 000517N
(R.K.Mehra) Partner (M. No. 006102)
For S. Bhandari & Co.Chartered AccountantsFirm Reg. No. 000560C
(P. D. Baid)Partner (M. No. 072625 )
In terms of our report of even date attached
255
C. CASH FLOW FROM FINANCING ACTIVITIES:
Proceeds from issue of Share Capital - 574.68
Advance Against Equity 1,781.72 1,462.94
Proceeds from Borrowings 331,987.96 104,318.58
Repayment of Borrowings (84,764.56) (58,640.99)
Dividend Paid (83,453.45) (94,960.30)
Tax on Dividend (14,170.69) (15,060.42
Interest Paid (7,090.21) (6,870.82)
Change in Minority Interest 7,955.45 (93.94)
NET CASH FLOW FROM FINANCING ACTIVITIES 'C' 152,246.22 (69,270.27)
Net increase/(decrease) in Cash and Cash Equivalents (A+B+C) 48,624.42 (82,727.30)
st Cash and Cash Equivalents as at 1 April, 2013 (Opening Balance) 26 196,007.99 278,735.07
Add: Other Adjustments to Cash and Cash Equivalent * - 0.23
196,007.99 278,735.30 st Cash and Cash Equivalents as at 31 March,2014 (Closing Balance) ** 26 244,632.41 196,008.00
48,624.42 (82,727.30
*Adjustment on account of increase in shareholding in OPAL & OTPC
Notes:
1. The above Cash Flow Statement has been prepared under the 'Indirect Method' as set out in the Accounting Standard-3 on Cash
Flow Statements issued by The Institute of Chartered Accountants of India.
2. Cash and Cash equivalent excludes ` 168.85 million (Previous year ` 182.51 million) in current account/deposit account of interest warrant/refund accounts, under lien, pledge with banks/Govt. authorities in respect of MRPL.
3. ** Cash and Cash equivalent includes restricted amount of 389.69 million (Previous year 388.68 million) earmarked for payment of unclaimed dividend.
4. Cash Balance includes 7,769.03 million share of jointly controlled entity. (Previous year 3,389.43 million).
5. Bracket indicates cash out flow.
6. Previous years figures have been regrouped wherever necessary to conform to current year's classification.
Year Endedst 31 March, 2014
Year Endedst 31 March, 2013
(` in million)
Note
Consolidated Cash Flow Statementstfor the year ended 31 March, 2014
Annual Report 2013-14
1. Group information
Oil and Natural Gas Corporation Limited ('ONGC' or 'the Company') is a public limited company domiciled in India and incorporated under the provisions of Companies Act, 1956. Its Shares are listed and traded on Stock exchanges in India. The Consolidated financial statements relate to the Company, its Subsidiaries, Joint Venture Entities and Associate. The Group (comprising of Company and its subsidiaries), Joint Venture Entities and Associate are mainly engaged in Exploration & Production (E&P) of Oil & Gas in India and abroad including Refinery, Power Generation, Petrochemicals, LNG supply, Pipeline Transportation, SEZ development and Helicopter services.
2. Significant Group Accounting Policies
2.1 Principles of Consolidation
The Consolidated Financial Statements havebeen prepared on the following basis: -
i) The financial statements of the Company and its subsidiary companies are combined on a line by-line basis by adding together the book values of like items of assets, liabilities, income and expenses af ter eliminating intra-group balances and intra-group transactions resulting in unrealized profits or losses in accordance with Accounting Standard (AS) 21 - "Consolidated Financial Statements".
ii) The financial statements of Joint Venture entities are combined by applying proportionate consolidation method on aline by line basis on like items of assets, liabilities, income and expenses af ter eliminating propor tionate share of unreal ized prof i ts or losses in accordance with Accounting Standard (AS) 27 - "Financial Reporting of Interests in Joint Ventures".
iii) Investments in Associates are accounted for using equity method in accordance with Accounting Standard (AS) 23 - "Accounting for Investments in Associates in Consolidated Financial Statements".
iv) The consolidated financial statements areprepared using uniform accounting policies for like transactions and other events in similar circumstances and are presented to the extent possible, in the same manner as the Company's separate Financial Statements except as otherwise stated.
v) The dif ference between the cost of investment in the subsid iar ies/ associates/Joint ventures, and the net assets at the time of acquisition of shares
in the subsidiaries/associates/joint ventur es is r ecognized in the Consolidated Financial Statements as Goodwill or Capital Reserve, as the case may be.
vi) Minorities' share in Net Profit/Loss of subsidiaries for the year is identified and adjusted against the income of the group in order to arrive at the Net Pr o f i t /Loss a t t r ibutab le to the shareholders of the Company.
vii) Minorities' share of Net Assets of subsidiaries is identified and presentedin the Consolidated Balance Sheet separately from liabilities and the equity of the Company's shareholders.
viii) In case of foreign subsidiaries and joint ventures, foreign currency transactions are translated as per the provisions of Accounting Standard (AS) 11 - "Accounting for Ef fects of changes in Foreign Exchange Rates" in the Consolidated Financial Statements.
ix) The dif ference between the proceeds from disposal of investments in a subsidiary and the carrying amount of its net assets as on the date of disposal is recognized in the Consolidated Statement of Profit and Loss.
2.2 Other significant Accounting Policies
a. Basis of preparation
The financial statements are prepared under the historical cost convention on accrual basis in accordance with Generally Accepted Accounting Principles (GAAP), applying the Successful Ef forts Method as per the Guidance Note on Accounting for Oil and Gas Producing Activities (Revised) issued by the Institute of Chartered Accountants of India and Accounting Standards notified under the Companies (Accounting Standards) Rules, 2006 and provisions of the Companies Act, 1956.
As the operating cycle cannot be identified in normal course due to the specific nature of industry, the same has been assumed to have duration of 12 months. Accordingly, all assets and liabilities have been classified as current or non-current as per the operating cycle and other criteria set out in the Revised Schedule VI to the Companies Act, 1956.
The financial statements are presented in Indian Rupees and all values are rounded to the nearest million except otherwise stated.
stNotes to Financial Statements for the year ended 31 March, 2014
256
b. Use of Estimates
The preparation of financial statements requires estimates and assumptions, which af fect the reported amount of assets, liabilities, revenues and expenses of the reporting period. The dif ference between the actual results and estimates are recognized in the period in which the results are known or materialized.
c. Government Grants
Government Grant related to acquisition of Fixed Assets is treated as 'Deferred Government Grant' and amount equal to propor tionate depreciation of such assets is credited to Statement of profit and loss.
d. Fixed Assets
d.1 Tangible Assets
d.1.1 Fixed assets are stated at historical costless accumulated depreciation and impairment. Fixed assets received as donations/gif ts are capitalised at assessed values with corresponding credit taken to Capital Reserve.
d.1.2 All costs, net of applicable tax credits, relating to acquisition of fixed assets till the time of bringing the assets to working condit ion for intended use are capitalised.
d.2 Intangible Assets
Intangible assets are stated at cost of acquisition, net of applicable tax credits, less accumulated amor tization and impairment.
e. Explorat ion, Development and Production Costs
e.1 Pre-acquisition cost
Expenditure incurred before obtaining the right(s) to explore, develop and produce oil and gas are expensed as and when incurred.
e.2 Acquisition Cost
Acquisition costs of an oil and gas property are the costs related to right to acquire mineral interest and are accounted/ treated as follows:-
Exploration and Development stage: Acquisition cost relating to projects under exploration or developments are initially accounted as capital work in progress. Such costs are capitalized by transferring to Producing Property when a well is ready to commence commercial production. In case of abandonment/ relinquishment, such costs are writ ten of f.
Production stage: Acquisition costs of a producing oil and gas property is capital ized as proved proper t y acquisition cost under producing properties and amortized over the production profile of the underlying asset using the unit of production method over proved reserves.
e.3 Survey Cost
Cost of Survey and prospecting activities conducted in the search of oil and gas are expensed as exploration cost in the year in which these are incurred.
e.4 Exploratory/Development Wells in Progress
e.4.1 All exploration costs incurred in drilling and equipping exploratory and appraisal wells, cost of drilling exploratory type stratigraphic test wells are initially capitalized as Exploratory Wells in Progress till the time these are either transferred to Producing Properties on completion as per Note no. 2.2.f.1 or expensed as exploration cost (including allocated depreciation) as and when determined to be dry or of no further use, as the case may be.
e.4.2 Costs of exploratory wells are not carried unless there are indications of suf ficient quantity of reserves; suf ficient progress is made in assessing the reserves and the economic & operating viability of the project. All such carried costs are subject to review for impairment as per Note no. 2.2.j.
e.4.3 All costs relating to Development Wells are initially capitalized as 'Development Wells in Progress' and transferred to 'Producing Properties' on completion as per Note no 2.2.f.1 and 2.2.f.2.
f. Producing Properties
f.1 Producing Properties are created in respect of an area/field having proved developed oil and gas reserves when the well in the area/field is ready to commence commercial production.
f.2 Cost of temporary occupation of land, successful explorator y wells, all development wells, depreciation on related equipment, facilities and estimated future abandonment costs are capitalised and reflected as Producing Properties.
g. Depletion of Producing Properties
Producing Properties are depleted using the "Unit of Production Method". The rate
257
Annual Report 2013-14
of depletion is computed with reference to an area covered by individual lease/ license/asset/amor tization base by considering the proved developed reserves and related capital costs incurred including estimated future abandonment costs net of salvage value. In case of acquisition cost, Producing Properties is depleted by considering the proved reserves. These reserves are estimated annually by the Reserve Estimates Commit tee of the Company, which follows the International Reservoir Engineering Procedures.
h. Production Costs
Production costs include pre-well head and post-well head expenses including depreciation and applicable operating costs of support equipment and facilities.
i. Side tracking
i.1 The cost of abandoned portion of side tracked exploratory wells is expensed as 'Exploratory Well Cost'.
i.2 The cost of abandoned portion of side tracked development wells is considered as part of cost of development wells.
i.3 The cost of sidetracking in respect of existing producing wells is capitalised if it results in additional proved developed oil & gas reserves or increases the future economic benefits therefrom beyond previously assessed standard of per formance, otherwise expensed as 'Workover Expenditure'.
j. Impairment
j.1 Producing Proper ties, Development Wells in Progress (DWIP) and Fixed Assets (including Capital Works in Progress) of a "Cash Generating Unit" (CGU) are reviewed for impairment at each Balance Sheet date. In case, events and circumstances indicate any impairment, recoverable amount of these assets is determined. An impairment loss is recognized, whenever the carrying amount of such assets exceeds the recoverable amount. The recoverable amount is higher of its 'value in use' or 'net selling price' (if determinable). In assessing value in use, the estimated future cash flows from the use of assets and from its disposal at the end of its useful life are discounted to their present value at appropriate rate.
An impairment loss is reversed if there is increase in the recoverable amount and
such loss either no longer exists or has decreased. Impairment loss / reversal thereof is adjusted to the carrying value of the respective assets, which in case of CGU, is allocated to its assets on a pro-rata basis. Subsequent to impairment, depreciation is provided on the revised carrying value of the assets over the remaining useful life.
j.2 Impairment testing during exploratory phase is carried out at area level when further exploration activities are not planned in near future or when suf ficient data exists to indicate that although a development in the specific area is likely to proceed, the carrying amount of the exploration asset is unlikely to be recovered in full from successful development or by sale. Impairment is reversed subsequently, to the extent that conditions for impairment are no longer present.
k. Abandonment Cost
k.1 The full eventual estimated liability towards costs relating to dismantling, abandoning and restoring well sites and allied facilitiesare recognized in respective assets when the well is completed / facilities are installed. The abandonment cost on dry well is expensed as exploratory well cost.
k.2 Provision for abandonment cost is updated based on the technical assessment at current costs. The ef fects of changes resulting from revisions to estimated liability are adjusted to the carrying amount of the related Asset and considered for deplet ion on a prospective basis.
l. Jointly Controlled Assets
Unincorporated Joint Ventures in the nature of Production Sharing Contracts (PSC) has been entered with the Government of India/other countries and various bodies corporate for exploration, development and production and other activities. These unincorporated joint ventures have been classified as Jointly controlled Asset.
l.1 The share in the assets and liabilities along with at tributable income, and expenditure, of the Jointly Controlled Assets is merged on line by line basis with the similar items in the Consolidated Financial Statements and adjusted for depreciation, depletion, survey, dry wells, abandonment, impairment and
258
sidetracking in accordance with the accounting policies.
l.2 Disposal of Interest
Gain or loss on sale of interest in a cost centre, is recognized in the statement of profit and loss, except that no gain is recognized at the time of such sale if substantial uncertainty exists about the recovery of the costs applicable to the retained interest or if the company has substantial obligation for future performance. The gain in such situation is treated as recovery of cost related to that cost centre
l.3 The hydrocarbon reserves in such areas are taken in propor t ion to the participating interest.
m. Investments
Long-term investments are valued at cost. Provision is made for any diminution, other than temporary, in the value of such investments.
Current Investments are valued at lower of cost and fair value.
n. Inventories
n.1 Finished goods (other than Sulphur) and stock in pipelines/tanks and carbon credits are valued at Cost or net realizable value whichever is lower. Cost of Finished goods is determined on absorption costing method. Sulphur is valued at net realizable value. The value of inventories includes excise duty, royalt y (wherever applicable) but excludes Cess.
n.2 Crude oil in unfinished condition in flow lines up to Group Gathering Stations/ plat form and Natural Gas in Pipelines is not valued.
n.3 Inventory of stores and spare parts is valued at Weighted Average Cost or net realizable value, whichever is lower. Provisions are made for obsolete and non-moving inventories.
n.4 Raw material and Stock in Process is valued at lower of cost or net realizable value. Crude oil as raw material is valued based on First in First Out (FIFO) cost, Condensate & LNG as raw material is valued on weighted average cost. Cost of Stock in Process comprise of raw material cost and propor tionate Conversion cost.
n.5 Unserviceable and scrap items, when determined, are valued at estimated net realizable value.
o. Revenue Recognition
o.1 Revenue from sale of products is recognized on transfer of custody to customers.
o.2 Any dif ference as of the reporting date between the entitlement quantity minus the quantities sold in respect of crude oil (including condensate), if positive (i.e. under lif t quantity) the proportionate production expenditure is treated as prepaid expenses and, if negative (i.e. over lif t quantity), a liability for the best estimate of the group's proportionate share of production expenses as per the Joint Operating Agreement / Production Sharing Agreement is created in respect of the quantity of crude oil to be foregone in future period towards set tlement of the over-lif t quantity of crude oil with corresponding charge to the Statement of Profit & Loss.
o.3 Any payment received in respect of short lif ted gas quantit y for which an obligation exists to supply such gas in subsequent periods is recognized as Deferred Revenue in the year of receipt. The same is recognized as revenue in the year in which such gas is actually supplied for the quantity supplied or in the year in which the obligation to supply such gas ceases, whichever is earlier.
o.4 Sale of crude oil and gas (net of levies) produced from Wells in Progress is deducted from expenditure on such wells.
o.5 Sales are inclusive of all statutory levies except Value Added Tax (VAT). Any retrospective revision in prices is accounted for in the year of such revision.
o.6 Revenue in respect of fixed price contracts is recognized for the quantum of work done on the basis of percentage of completion method. The quantum of work done is measured in proportion of cost incurred to date to the estimated total cost of the contract or based on reports of physical work done.
o.7 Finance income in respect of assets given on finance lease is recognized based on a pattern reflecting a constant periodic rate of return on the net investment outstanding in respect of the finance lease.
o.8 Dividend income is recognized when right to receive is established. Interest income is recognized on time proportion basis taking into account the amount outstanding and rate applicable.
259
Annual Report 2013-14

o.9 Lease Premium from the lease of land is recognized over primary lease period as per the agreement. Lease rental income is accounted for on the time proportion basis as per the terms agreed with lessees.
o.10 Revenue in respect of the following is recognized when there is reasonable certainty regarding ultimate collection:
a. Gas pipeline transportation charges
b.Reimbursable subsidies and grants
c. Surplus from Gas Pool Account
d. Interest on delayed realization fromcustomers
e. Liquidated damages from contractors/suppliers
p. Depreciation and Amortization
p.1 Depreciation on fixed assets is providedfor under the writ ten down value method in accordance with the rates specified inSchedule XIV to the Companies Act, 1956.
p.2 Depreciation on additions/deletionsduring the year is provided on pro rata basis with reference to the date of additions/deletions except items of Plant and Machinery used in wells with 100% rate of depreciation and low value items not exceeding ` 5,000/- which are fully depreciated at the time of addition.
p.3 Depreciation on subsequent expenditure on fixed assets arising on account of capital improvement or other factors is provided for prospectively.
Depreciation on refurbished/revamped assets which are capitalized separately is provided for over the reassessed useful life at rates which are not less than the rates specified in Schedule XIV to the Companies Act, 1956.
p.4 Depreciation on fixed assets (including support equipment, facilities and those taken on lease) used for exploratory/ development drilling and on production facilitiesis initially capitalised as part of drilling cost or producing properties and expensed/ depleted as stated in note no 2.2.f & 2.2.g above. Depreciation on equipment/ assets deployed for survey activities is charged to Statement of Profit and Loss.
p.5 Leasehold land is amortized over the lease period except perpetual leases.
p.6 Right of way/Right of use of land are amortized on Straight Line Method (SLM) over the estimated life of associated Asset.
p.7 Other Intangible Assets ( sof tware, copy right, patents etc.)are amortized on Straight Line Method (SLM) over the useful life not exceeding ten years from the date of capitalization
q. Foreign Exchange Transactions
q.1 Foreign currency transactions on initial recognition in the reporting currency are accounted for at the exchange rates prevailing on the date of transaction.
q.2 At each Balance Sheet date, foreign currency monetary items are translated using the mean exchange rates prevailing on the balance sheet date and non-monetary items are translated using the exchange rate prevailing on the date of transaction or on the date when the fair value of such item was determined.
q.3 The loss or gain thereon and also the exchange dif ferences on set tlement of the foreign currency transactions during the year are recognized as income or expense and adjusted to the statement of profit & loss except where such liabilities and /or transactions relate to fixed assets/ projects and these were incurred/ entered into before 1.4.2004; in which case, these are adjusted to the cost of respective fixed assets.
q.4 In respect of integral foreign operations:
q.4.1 The foreign currency transactions on initial recognition in the repor ting currency are recorded following the note no2.2.q.1. For practical reasons, the average exchange rate of the relevant month is taken for the transactions of the month in respect of joint venture operations, where actual date of transaction is not available.
q.4.2 At each Balance Sheet date, monetary and non-monetary items are translated following the policy stated in note no. 2.2.q.2.
q.4.3 All exchange dif ferences are treated following the policy stated in note no.2.2.q.3.
q.5 The financial statements of the non-integral foreign operations are incorporated in the financial statements using the following principles:
q.5.1 The assets and liabilities, both monetary and non-monetary, of the non-integral foreign operation are translated at the average of the exchange rate prevailing on the date of the balance sheet;
q.5.2 Income and expense items of the non-integral foreign operation are translated
260
at the average exchange rates for the period to which the financial statements relate.
q.5.3 The resulting exchange dif ferences are accumulated in a foreign currency translation reserve until the disposal of the net investment in the non-integral foreign operation.
q.5.4 Exchange dif ferences arising on net investment in a non-integral foreign operation are accumulated in a foreign currency translation reserve until the disposal of such investment, at which time they are recognized as income or as expenses.
q.6 In the case of forward exchange contracts, the premium or discount arising at the inception of such contracts, is amortized as income or expense over the life of the contract as well as exchange difference on such contracts, i.e. dif ference between the exchange rate at the reporting/settlement date and the exchange rate on the date of inception/the last repor ting date, is recognized as income/expense for the period.
r. Employee Benefits
r.1 All short term employee benefits are recognized at their undiscounted amount in the accounting period in which they are incurred.
r.2 Employee Benefit under defined contribution plans comprising provident fund etc. is recognized based on the undiscounted amount of obligations of the group to contribute to the plan. The same is paid to a fund administered through a separate trust.
r.3 Employee benefits under defined benefit plans comprising of gratuity, leave encashment, compensated absences, post-retirement medical benefits and other terminal benefits are recognized based on the present value of defined benefit obligation, which is computed on the basis of actuarial valuation using the Projected Unit Credit Method. Actuarial Liability in excess of respective plan assets is recognized during the year. Actuarial gains and losses in respect of post-employment and other long-term benefits are recognized in the statement of profit & loss.
s. Voluntary Retirement Scheme
Expenditure on Voluntary Retirement Scheme (VRS) is charged to statement of profit & loss when incurred.
t. General Administrative Expenses
General administrative expenses which are directly or specifically at tributable are allocated to activities and the balance is charged to Statement of Profit & Loss.
u. Insurance claims
The insurance claims are accounted for as under :-
u.1 In case of total loss of asset, by transferring either the carrying cost of the relevant asset or insurance value (subject to deductibles), whichever is lower under the head "Cla ims Recoverable-Insurance" on intimation to Insurer. In case insurance claim is less than carrying cost, the dif ference is charged to statement of profit & loss.
u.2 In case of partial or other losses, expenditure incurred/payments made to put such assets back into use, to meet third party or other liabilities (less policy deductibles) if any, are accounted for as "Cla ims Recoverable- Insurance". Insurance Policy deductibles are expensed in the year the corresponding expenditure is incurred.
u.3 As and when claims are finally received from insurer, the dif ference, if any, between Claims Recoverable-Insurance and claims received is adjusted to statement of profit & loss.
v. Research Expenditure
Revenue expenses on Research are charged to statement of profit & loss, when incurred.
w. Taxes on Income
Provision for current tax is made as per the provisions of the Income Tax Act, 1961/other applicable tax laws. Deferred Tax Liability / Asset resulting from 'timing dif ference' between book profit and ta xable profit is accounted for considering the tax rate and laws that have been enacted or substantively enacted as on the Balance Sheet date. Deferred Tax Asset is recognized and carried forward only to the extent that there is reasonable certainty that the asset will be realized in future.
x. Borrowing Costs
Borrowing Cost specifically identified to the acquisition or construction of qualifying assets is capitalized as part of such assets. A qualifying asset is one
261
Annual Report 2013-14
that necessarily takes substantial period of time to get ready for intended use. All other borrowing costs are charged to statement of profit & loss.
y. Rig Days Costs
Rig movement costs are booked to the next location drilled/planned for drilling. Abnormal Rig days' costs are considered as un-allocable and charged to statement of profit & loss.
z. Unamortized Expenditure
z.1 Dr y dock ing char ges o f R igs / Multipurpose Supply Vessels (MSVs), Geo Technical Vessels (GTVs), Well Stimulation Vessels, Of fshore Supply Vessels (OSVs), Rig/ equipment mobilization expenses and other related expenditure are amortized over the period of use not exceeding five years and balance is carried under head "Unamor tized Expenditure" in the balance sheet.
za. Transportation Costs
Transportation Costs in respect of the quantity of gas short transported, for which the right exists to transport such gas in subsequent periods at no charge, is treated as Deferred Expenditure in the year of payment. The same is treated as cost in the year in which the gas is actually transported for the quantity transported or in the year in which the right to transport such gas ceases, whichever is earlier.
zb. Lease
zb.1 Assets given on Lease:
zb.1.1 Assets given on finance lease are accounted for as per Accounting Standard (AS) 19 "Leases". Such assets are included as a receivable at an amount equal to the net investment in the lease.
zb.1.2 Initial direct costs incurred in respect of finance leases are recognized in the statement of profit and loss in the year in which such costs are incurred.
zb.2 Assets taken on Lease
zb.2.1 Assets taken on finance lease are capitalized and recognized at the lower of the fair value of the asset and the discounted value of the minimum lease installments. The lease payments are bifurcated into repayment and interest
components, based on a fixed interest rate and installment as derived from the underlying agreement. The lease commitments are carried under liabilities exclusive of interest. The interest component is recognized in the statement of profit & loss in accordance with the lease installments.
zb.2.2 Assets acquired on lease where a significant portion of the risks and rewards of ownership are retained by the lessor are classified as operating leases. Lease rentals are charged to the statement of profit & loss on accrual basis.
zc. Claims
Claims/Surrenders on/to Petroleum Planning and Analysis Cell, Government of India are booked on 'in principle acceptance' thereof on the basis of available instructions/ clarifications subject to final adjustments, as stipulated. All other claims and provisions are booked on the merits of each case.
zd. Provisions, Contingent Liabilities and Contingent Assets
Provisions involving substantial degree of estimation in measurement are recognized when there is a present obligation as a result of past events and it is probable that there will be an out flow of resources embodying economic benefits. Contingent Assets are neither recognized nor disclosed in the financial statements. Contingent liabilities are disclosed by way of notes to accounts.
ze. Accounting for derivatives
Accounting for Derivatives, other than those covered under Accounting Standard (AS) 11, is done on mark to market basis and the losses are charged to statement of Profit & Loss. Unrealized gains are ignored.
zf. Goodwill on Consolidation
Goodwill arising on Consolidation of Companies having Hydrocarbon reserves are amortized based on "Unit of Production Method" considering the related Proved Reserves. Other goodwill on consolidation is not amortized
262
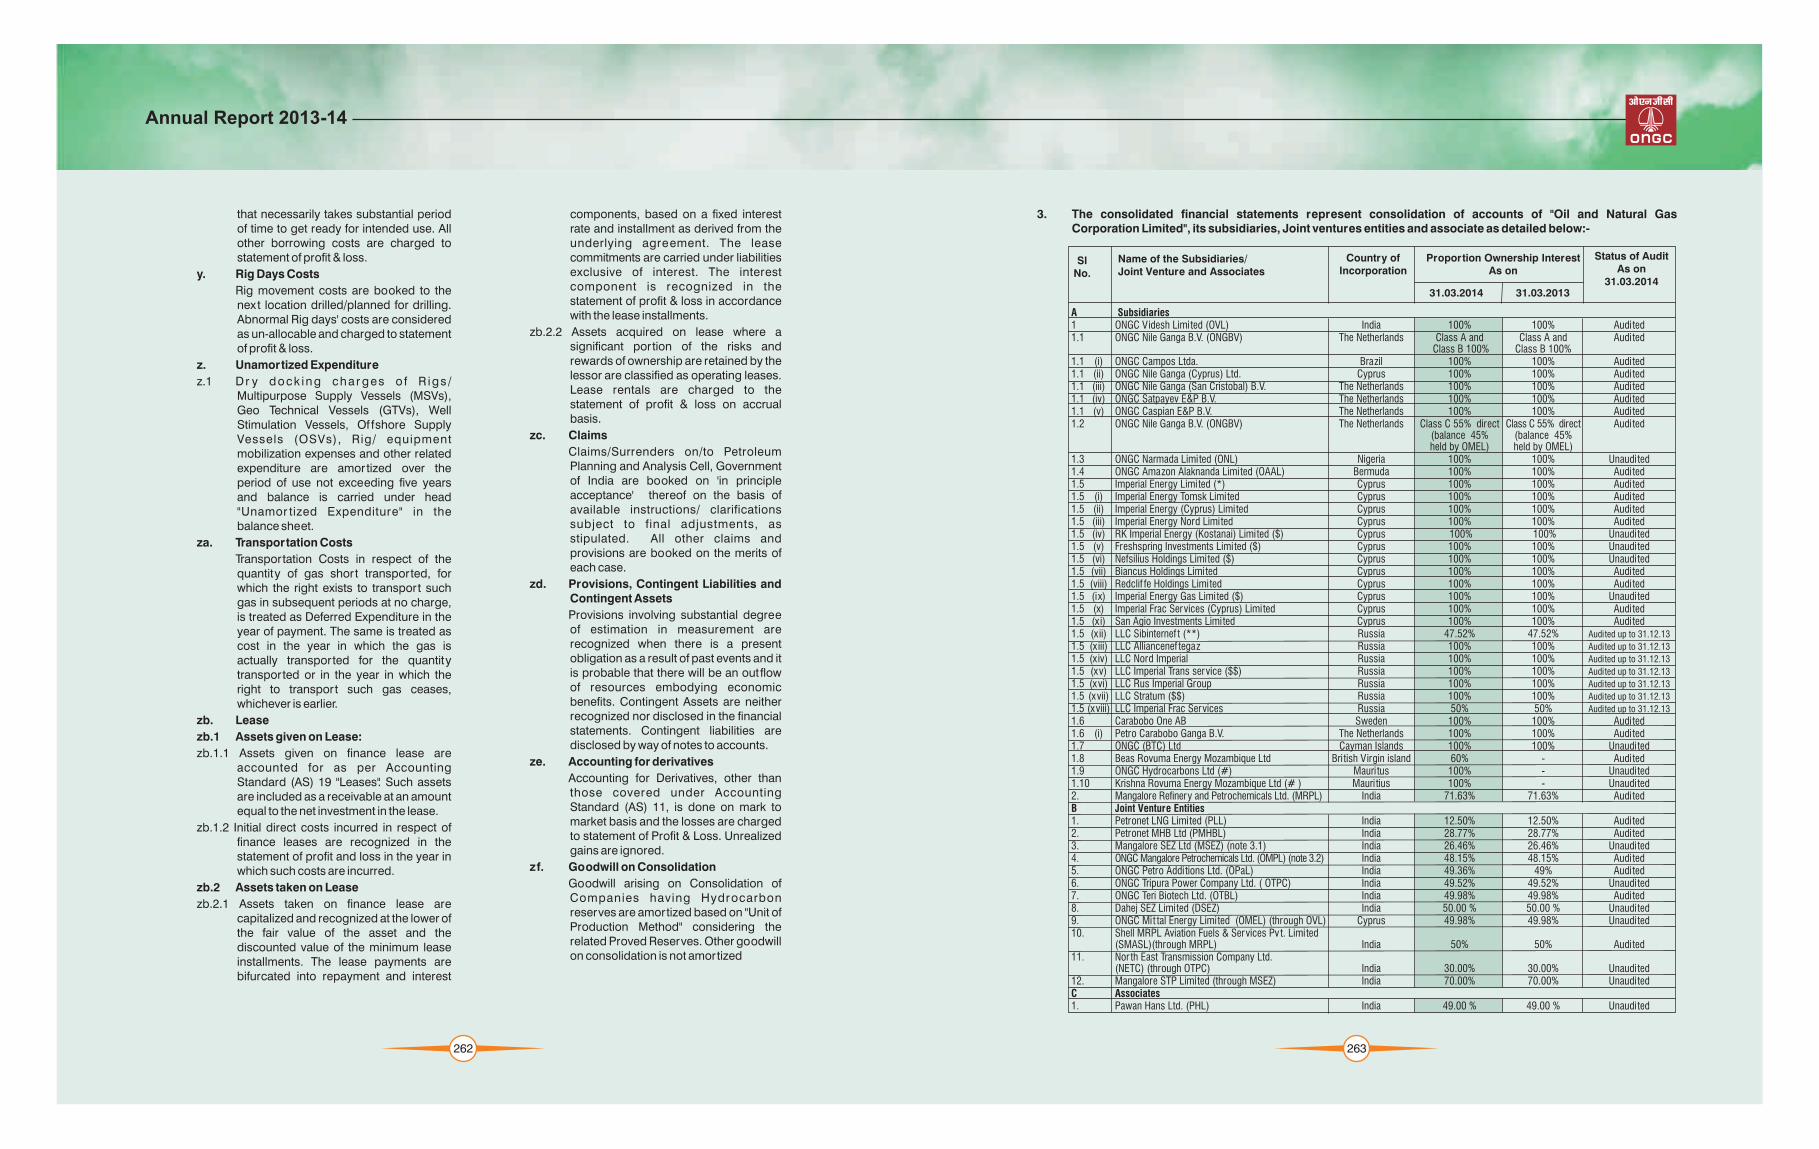
3. The consolidated financial statements represent consolidation of accounts of "Oil and Natural GasCorporation Limited", its subsidiaries, Joint ventures entities and associate as detailed below:-
A Subsidiaries1 ONGC Videsh Limited (OVL) India 100% 100% Audited1.1 ONGC Nile Ganga B.V. (ONGBV) The Netherlands Class A and
Class B 100%1.1 (i) ONGC Campos Ltda. Brazil 100% 100% Audited1.1 (ii) ONGC Nile Ganga (Cyprus) Ltd. Cyprus 100% 100% Audited1.1 (iii) ONGC Nile Ganga (San Cristobal) B.V. The Netherlands 100% 100% Audited1.1 (iv) ONGC Satpayev E&P B.V. The Netherlands 100% 100% Audited1.1 (v) ONGC Caspian E&P B.V. The Netherlands 100% 100% Audited1.2 ONGC Nile Ganga B.V. (ONGBV) The Netherlands Class C 55% direct
(balance 45%
1.3 ONGC Narmada Limited (ONL) Nigeria 100% 100% Unaudited1.4 ONGC Amazon Alaknanda Limited (OAAL) Bermuda 100% 100% Audited1.5 Imperial Energy Limited (*) Cyprus 100% 100% Audited1.5 (i) Imperial Energy Tomsk Limited Cyprus 100% 100% Audited1.5 (ii) Imperial Energy (Cyprus) Limited Cyprus 100% 100% Audited1.5 (iii) Imperial Energy Nord Limited Cyprus 100% 100% Audited1.5 (iv) RK Imperial Energy (Kostanai) Limited ($) Cyprus 100% 100%1.5 (v) Freshspring Investments Limited ($) Cyprus 100% 100%1.5 (vi) Nefsilius Holdings Limited ($) Cyprus 100% 100%1.5 (vii) Biancus Holdings Limited Cyprus 100% 100% Audited1.5 (viii) Redclif fe Holdings Limited Cyprus 100% 100% Audited1.5 (ix) Imperial Energy Gas Limited ($) Cyprus 100% 100%1.5 (x) Imperial Frac Services (Cyprus) Limited Cyprus 100% 100% Audited1.5 (xi) San Agio Investments Limited Cyprus 100% 100% Audited1.5 (xii) LLC Sibinternef t (**) Russia 47.52% 47.52% Audited up to
1.5 (xiii) LLC Alliancenef tegaz Russia 100% 100%1.5 (xiv) LLC Nord Imperial Russia 100% 100%1.5 (xv) LLC Imperial Trans service ($$) Russia 100% 100%1.5 (xvi) LLC Rus Imperial Group Russia 100% 100%1.5 (xvii) LLC Stratum ($$) Russia 100% 100%1.5 (xviii) LLC Imperial Frac Services Russia 50% 50%1.6 Carabobo One AB Sweden 100% 100% Audited1.6 (i) Petro Carabobo Ganga B.V. The Netherlands 100% 100% Audited1.7 ONGC (BTC) Ltd Cayman Islands 100% 100%1.8 Beas Rovuma Energy Mozambique Ltd Bri tish Virgin island 60% - Audited1.9 ONGC Hydrocarbons Ltd (#) Mauritus 100% -1.10 Krishna Rovuma Energy Mozambique Ltd (# ) Mauritius 100% -2. Mangalore Refinery and Petrochemicals Ltd. (MRPL) India 71.63% 71.63% AuditedB Joint Venture Entities1. Petronet LNG Limited (PLL) India 12.50% 12.50% Audited2. Petronet MHB Ltd (PMHBL) India 28.77% 28.77% Audited3. Mangalore SEZ Ltd (MSEZ) (note 3.1) India 26.46% 26.46% Unaudited4. ONGC Mangalore Petrochemicals Ltd. (OMPL) (note 3.2) India 48.15% 48.15% Audited5. ONGC Petro Additions Ltd. (OPaL) India 49.36% 49% Audited6. ONGC Tripura Power Company Ltd. ( OTPC) India 49.52% 49.52% Unaudited7. ONGC Teri Biotech Ltd. (OTBL) India 49.98% 49.98% Audited8. Dahej SEZ Limited (DSEZ) India 50.00 % 50.00 % Unaudited9. ONGC Mit tal Energy Limited (OMEL) (through OVL) Cyprus 49.98% 49.98% Unaudited10. Shell MRPL Aviation Fuels & Services Pv t. Limited
(SMASL)(through MRPL) India 50% 50% Audited11. Nor th East Transmission Company Ltd.
(NETC) (through OTPC) India 30.00% 30.00% Unaudited12. Mangalore STP Limited (through MSEZ) India 70.00% 70.00% UnauditedC Associates1. Pawan Hans Ltd. (PHL) India 49.00 % 49.00 % Unaudited
Class A and AuditedClass B 100%
Class C 55% direct Audited(balance 45%
held by OMEL) held by OMEL)
UnauditedUnauditedUnaudited
Unaudited
31.12.13
Audited up to 31.12.13
Audited up to 31.12.13
Audited up to 31.12.13
Audited up to 31.12.13
Audited up to 31.12.13
Audited up to 31.12.13
Unaudited
UnauditedUnaudited
Name of the Subsidiaries/ Joint Venture and Associates
Country of Incorporation
Proportion Ownership InterestAs on
Status of Audit As on
31.03.201431.03.2014
SlNo.
31.03.2013
263
Annual Report 2013-14

(*) Jarpeno Limited has been rechristened as ImperialthEnergy Limited with ef fect from 19 April 2013.
(**) Although the Company has 47.52 percent ef fective ownership interest, it has 55.9 percent of voting rights in LLC Sibinternef t. LLC Sibinternef t is therefore a subsidiary of the Company, in accordance with the Companies Act, 1956 of India and included in consolidation of accounts accordingly.
rd($) These companies have been liquidated w.e.f. 23 March, 2014
($$) These two companies have now merged with LLC thNord Imperial w.e.f 29 November, 2013
(#) These companies are under liquidation.
3.1 Includes holding of 0.96% by OMPL.
3.2 Includes holding of 3% by MRPL
3.3 In view of dif ferent sets of environment/prevalent laws in respect of respective countries in which the subsidiaries/JV are operating, the accounting policies followed (for treatment of depreciation of
Tangible Assets, sales revenue and royalty etc.) by the subsidiaries/JVs are dif ferent from the accounting policies of the Company. For consolidation of financial statement, the transactions reported which have been arrived using such dif ferent accounting policies by the group companies have been considered and disclosed at Note no. 9.2, 14.2, 14.5, & 14.6, 15.2, 16.2, 17.1(c), 17.1(d), 17.1(e), 17.1(f), 24.3, 24.4, 24.5, 28.2, 29.6, 29.7, 32.2, 32.6, 45.2.3 & 48.
3.4 During the period group has changed the accounting policies to align with the Guidance Note on Accounting for Oil and Gas Producing Activities (Revised) notified by the Institute of Chartered Accountants of India and Expert advisory opinion of ICAI on treatment of right of way. The impact of such changes in policies resulted in net increase of profit before tax by 10,128.20 million and same has been disclosed in note no. 5.8, 9.3, 15.3, 15.4, 16.1 (c),18.1(b), 18.1(c) & 18.1(d).
As atst31 March, 2013
(` in million)4. Share Capital
4.2 Terms/rights attached to equity shares
The company has only one class of equity shares having a par value of `5 per share. Each holder of equity shares is entitled to one vote per share. The dividend proposed by the Board of Directors is subject to the approval of the shareholders in the ensuing Annual General Meeting.
In the event of liquidation of the company, the holders of equity shares will be entitled to receive remaining assets of the company, af ter distribution of all preferential amounts. The distribution will be in proportion to the number of equity shares held by the shareholders.
4.1 Reconciliation of the equity shares outstanding at the beginning and at the end of the reporting period
Outstanding at the beginning of the year 8,555.49 42,777.45 8,555.49 42,777.45Changes during year - - - -Outstanding at the end of the year 8,555.49 42,777.45 8,555.49 42,777.45
st As at 31 March, 2014 As at 31 March, 2013st
No. in million
No. in million
` in million
` in million
Particulars
Particulars
264
Authorised:
30,000,000,000 Equity Shares of ` 5 each 150,000.00 150,000.00
(Previous Year 30,000,000,000 Equity Shares of 5 each)
Issued and Subscribed:8,555,528,064 Equity Shares of 5 each 42,777.64 42,777.64(Previous Year 8,555,528,064 Equity Shares of 5 each)
Paid up :
8,555,490,120 Equity Shares of 5 each 42,777.45 42,777.45(Previous Year 8,555,490,120 Equity Shares of 5 each)
Add: Shares for feited 0.15
Total 42,777.60 42,777.60
`
``
``
0.15
As atst31 March, 2014
4.5 Shares reserved for issue under option : Nil (previous year Nil)
5 Reserves and Surplus
4.3 Details of shareholders holding more than 5% shares in the company are as under:-
Capital Reserve (Note 5.1)a) As per last Balance Sheet 1,154.05 1,104.97 b) Addition/(deduction) during the year 80.92 1,234.97 49.08 1,154.05
Capital Redemption Reserve (Note 5.3)a) As per Last Balance Sheet 91.95 46.02b) Add: Transfer from FE Translation Reserve 0.02 - c) Add: Transferred from P&L Account - 91.97 45.93 91.95
Securities Premium Account a) As per last Balance Sheet 144.33 144.33 b) Less: Bonus Share issued - 144.33 - 144.33
Debenture Redemption Reserve (Note no. 5.4)a) As per Last Balance Sheet 14,088.91 9,781.27b) Add: Transferred from Surplus Account 10,399.95 24,488.86 4,307.64 14,088.91
Deferred Government Grant (Note 2.2.c)a) As per last Balance Sheet 27.53 30.82 b) Addition during the year 17.07 - c) Less: Deduction during the year (note 5.5) 2.87 41.73 3.29 27.53
Foreign Exchange Translation Reserve (Note 5.6)a) As per Last Balance Sheet 37,554.33 24,639.98 b) Addition/(deletion) 33,209.48 12,914.35 c) Less: Transfer to Capital Redemption Reserve 0.02 70,763.79 - 37,554.33
Foreign Currency Monetary Item Exchange Account ( note 5.7) (3,925.56) -
Hedging Reserve ( note 32.6) 15.53 -General Reserve
a) As per last Balance Sheet 1,223,664.23 1,105,907.56 b) Add: Adj. with opening reserve ( Note no. 5.8) (3,143.02) -c) Add: Transferred from Surplus Accounts 132,250.48 1,352,771.69 117,756.67 1,223,664.23
Surplusa) As per last Balance Sheet 205,772.77 179,958.75 b) Add: Transferred from Statement of Profit and Loss 265,065.33 242,196.44 c) Add: Adjustment due to change in holding/other adjustment 36.06 58.45 d) Less: Proposed Dividend ( note 5.2) 2,138.87 4,277.75 e) Less: Interim Dividend 79,138.31 76,999.41 f) Less: Tax on Dividend 13,841.60 13,053.47 g) Less: Transfer to Capital Redemption Reserve - 45.93 h) Less: Transfer to Debenture redemption Reserve 10,399.95 4,307.64 i) Less: Transferred to General Reserve 132,250.48 233,104.95 117,756.67 205,772.77
Total 1,678,732.26 1,482,498.10
President of India 5,897.76 68.94 5,922.55 69.23Life Insurance Corporation of India 666.70 7.79 662.85 7.75Indian Oil Corporation Limited 657.92 7.69 657.92 7.69
As at st31 March, 2014
stAs at 31 March, 2014
As at st31 March, 2013
As at 31 March, 2013st
No. in million
No. in million
%holding
%holding
Name of the share holder
Particulars
4.4 Pursuant to the approval of the members dated 28.01.2011, during the financial year 2010-11, one equity share having face value of 10/- each had been sub-divided into two equity shares of 5/- each and bonus shares in proportion of one new equity bonus share of 5/- each for every one fully
``
`
(` in million)
265
paid up equity share of 5/- each held on 09.02.2011 (record date) had been allot ted. The company has issued total 4,277.75 million equity shares of face value of 5 each issued as fully paid up by way of bonus shares during the period of five years immediately preceding the reporting date.
`
` `
Annual Report 2013-14

5.1 Includes ` 159.44 million (Previous year ` 159.44 million) being assessed value of assets received as gif t and ` 4.18 million (Previous year ` 4.18 million) being Capital Reserve on Consolidation.
5.2 The Board of Directors have recommended a final dividend of ` 0.25 per share (previous year ` 0.50 per share) which is subject to the approval of the
5.7 Foreign Currency Monetary Item Exchange Account:The subsidiary, ONGC Videsh Limited has foreign exchange dif ference on the foreign currency bonds till 31.03.2014 amounting to 4,616.00 million (refer note no. 6.3.2) has been amortized over the outstanding tenure of the loan as per the provision of paragraph 46A of AS 11 as below:-
5.5 Represents the amount equivalent to depreciation transferred to the Statement of Profit and Loss.
5.6 Foreign Exchange Translation Reserve: The subsidiary, ONGC Videsh Limited has followed the Accounting Standard (AS) 11 - Ef fects of Changes in Foreign Exchange Rates (revised 2003) for incorporating in the consolidated
shareholders in the ensuing Annual General Meeting over and above the interim dividend of` 9.25 per share (Previous year 9.00 per share).
5.3 Includes ` 91.86 Million (Previous year ` 91.86 million) Capital Redemption Reserve towards redemption of Preference share capital during2011-12 and 2012-13 in respect of subsidiary, MRPL.
(` in million)
(` in million)
8.40 % 5 Years Unsecured Non-Convertible Redeemable Bonds in the nature of Debentures- Series I 12,892.38 3,937.84 16,830.22
8.54 % 10 Years Unsecured Non- Convertible RedeemableBonds in the nature of Debentures- Series II 1,196.53 369.80 1,566.33
Total (A) 14,088.91 4,307.64 18,396.55
Unsecured 3.75% 10 years USD Bonds - 3,312.85 3,312.85
Unsecured 2.50% 5 years USD Bonds
Total (B) - 6,073.56 6,073.56
Total (A+B) 14,088.91 10,381.20 24,470.11
- 2,760.71 2,760.71
Particulars
Particulars
Balance as on st31 March, 2013
As at st31 March, 2014
Addition during the period
Balance as onst 31 March, 2014
As at st31 March, 2013
Opening Balance - -
Additions during the year (4,616.00) -
Amortized during the year 690.44 -
Closing Balance (3,925.56) -
5.8 The Company has implemented the Guidance note on Oil & Gas Producing activities (revised)issued by the Institute of Chartered Accountants of India w.e.f. 01.04.2013. The company has carried out impairment testing of assets in exploratory phase (Exploratory Wells in Progress) as on 01.04.2013 and accordingly, an amount of 3,143.01 million `
(net of deferred tax of ` 1,618.41 million)has been accounted as provision and adjusted against reserve as on 01.04.2013. (Refer note no. 18.1.b)
5.9 Above Reserve and Surplus includes ` (-) 3,575.69 million share of jointly controlled entities(Previous year (-) 3,532.52 million).`
266
5.4 Debenture Redemption Reserve: -
Debenture Redemption Reserve includes ` 24,470.11 million in respect of subsidiary company OVL, as follows:
financial statements following the principles for translation of the financial statements of Non-integral Foreign Operations. Accordingly,the foreign exchange dif ference of ` 33,209.48 Million (Previous year ` 12,914.34 Million)hasbeen accounted as foreign currency translation reserve.
6.1 Above include Secured long term borrowings of` 112,385.66 million share of jointly controlled entities (Previous year ` 43,595.31 million) and Unsecured long term borrowings of ` 7,823.39 million share of jointly controlled entities (Previous year 6,881.69 million).
6.2 Secured Loan6.2.1 Zero coupon bond (ZCB): The Joint Venture,
PMHBL has issued Zero Coupon Bonds to Lenders as per Corporate Debt Restructuring (CDR) Approved Scheme, repayable in 36 quarterly installments commencing from Sept 2006 and ending on June, 2015. The ZCBs are secured by first mor tgage on Immovable Properties- present & future, first charge on movable properties - present & future and charge on all receivables from the project on pari-passu
stbasis. Balance outstanding as on 31 March, 2014 is ` 12.65 million (Previous year ` 94.88 million) out of which Group's share is ` 3.64 million (Previous year 27.29 million).
6.2.2 The Subsidiary, MRPL has external commercial borrowing (ECB) of ` 38,948.00 million (Previous year ` 16,293.00 million), secured by first pari-passu charge over immovable and movable fixed assets both present and future. The interest rate for ECB are based on 6 month LIBOR plus spread. The ef fective interest rate are 3.26%, 3.63%, 2.82%, 2.44% and 2.79% on ` 5,992.00 million, ` 8,988.00 million, ` 17,976.00 million, ` 2,996.00 million and ` 2,996.00 million respectively to be repaid by 2020-21.
6.2.3 The Joint Venture, PLL has outstanding loan from Banks, secured by first ranking mortgage and first
charge on pari-passu basis on all movable and immovable properties, both present and future including current assets except on trade receivables on which second charge is created on pari-passu basis at an average interest rate of
st10.02% p.a. applicable on 31 March, 2014. stBalance outstanding as on 31 March, 2014 is
` 9,706.30 million (Previous year ` 10,941.10 million) out of which group's share is ` 1,213.29 million (Previous year 1,367.64 million)
6.2.4 The joint venture, OMPL has external commercial borrowing (ECB) arrangement from a consortium of banks for USD 310 million, secured by first charge on all fixed asset and second charge of the current assets. The rate of interest for ECB-I (USD 250 million) and ECB-II (USD 60 million) are LIBOR+3.13% and LIBOR+3.15% respectively. ECB-I & ECB-II are repayable in 14 equal half
styearly installments commencing from 1 April, st2015 and 31 October, 2015 respectively. Balance
stoutstanding as on 31 March 2014 is ` 18,618.60 million (Previous year ` 13,597.50 million) out of which group's share is ` 89,64.65 million (Previous year 6,547.05 million)
6.2.5 The Joint venture, OMPL has borrowed Rupee Term Loan from a Consortium of Banks at the interest rate which is "SBI base rate+1.25%" secured by first charge on all fixed assetsand second charge on the current assets. The Rupee Term Loan is repayable in 36 equal
stquarterly installments from 31 December, 2014. stBalance outstanding as on 31 March 2014 is
` 17,293.90 million (Previous year ` 10,000.00 million) out of which group's share is ` 8,326.82 million (Previous year 4,814.89 million).
(` in million)6 Long-term borrowings
A. Secured(a) Zero Coupon Bond (note no. 6.2.1) 3.64 27.29 (b) Term Loan
- From Banks 100,654.50 34,089.49 - From Others 42,450.65 143,108.79 18,323.14 52,439.92
B. Unsecured(a) Non Convertible Redeemable Bonds ( Note 6.3.1) 48,423.00 - (b) Non Convertible Redeemable Debentures 3,700.00 23,400.00 (c) Term Loan
- From Banks 106,606.50 - - From Others 8,000.00 6,999.98
(d) Non - Recourse deferred credit (Note 6.3.4) - 134.98 (e) Non-current maturities of finance lease obligations
( note 6.3.5) 4,811.12 2,759.08 (f) Sales Tax Deferment Loan ( Note 6.3.7) 2,159.17 173,699.79 2,693.51 35,987.55
Total Long Term Borrowing (A+B) 316,808.58 88,427.47
As at st31 March, 2014
As at st31 March, 2013
Particulars
267
Annual Report 2013-14

Corporation Washington D.C., USA, Proparco, France and Asian Development Bank at an average cost of 8.85% p.a. (inclusive of hedge cost) and loan from Bajaj Allianz Life Insurance Company Ltd (Indian lender) at an average
stinterest rate of 10.02% p.a. as applicable as on 31 March, 2014. In respect of external commercial borrowings f rom Internat ional F inance Corporation Washington D.C., USA and Proparco, France, PLL, has entered into derivative contracts to hedge the loan including interest. Balance
stoutstanding as on 31 March, 2014, is 13,771.10
million (Previous year ` 16,241.10 million) out of which group's share is 1,721.39 million (Previous year 2,030.14 million).
6.3 Unsecured Loan
6.3.1 Non-conver tible redeemable debenture (Rupee Bonds):
During the financial year 2009-10, the subsidiary, OVL, had raised funds from the financial markets by issuance of non-convertible redeemable debenture (Rupee Bonds) in the nature of debentures as per following:-
8.54 % 10 Years Unsecured Non-Convertible RedeemableBonds in the nature of Debentures- Series II 3,700.00 6-Jan-2010 6-Jan-2020
8.40 % 5 Years Unsecured Non-Convertible RedeemableBonds in the nature of Debentures- Series I( refer note no 12.3) 19,700.00 23-Dec-2009 23-Dec-2014
Total 23,400.00
USD 500Million Unsecured Non-Convertible Reg S Bonds( Coupon-3.75% payable semi-annually in arrears) 27,145.00 7-May-2013 7-May-2023
USD 300Million Unsecured Non-Convertible Reg S Bonds( Coupon-2.50% payable semi-annually in arrears) 16,287.00 7-May-2013 7-May-2018
Foreign Exchange dif ference (note 5.7) 4,616.00
Total 48,048.00
Particulars
Particulars
Amount
Amount
(` in million)
(` in million)
Date ofissue
Date ofissue
Daterepayable on
Daterepayable on
The above securities have been listed in National Stock Exchange of India Ltd. (NSE). Further the Company is required to maintain 100% asset cover as per SEBI guidelines. There is no put / call option on these bonds. The bonds are repayable in full (bullet repayment) on maturity date.
6.3.2 Foreign Currency Bonds
During the year 2013-14, the subsidiary, OVL, had raised funds from the international financial markets by issuance of non-convertible redeemable Reg-S foreign currency bonds as per following:
The above securities have been listed in Singapore 8.94%, 9.27%, 9.06%, 9.15% and 9.27% on 2,737.50 Exchange (SGX). The USD 300 million Reg S bonds million, ` 262.50 million, ` 1,250.00 million, 2,750.00 were issued at price of 99.655% and USD 500 million, ` 87.90 million, ` 1,537.50 million, ` 399.60 million Reg S bonds were issued at price of 99.950% million, ` 282.50 million and ` 692.50 million . The bonds have been issued in denomination of respectively, repayment up to 2018-19.USD 200,000 and integral multiples of USD 1,000 in 6.3.4 The Subsidiary, OVL has unsecured non-recourse excess thereof. There is no periodical put/call deferred credit nil (previous year 134.98 million) option. The bonds are repayable in full (bullet from contractors of pipeline project executed in repayment) on maturity date. Sudan. The Non recourse deferred credit is
6.3.3 The Subsidiary, MRPL has unsecured term loan from repayable from the instalments of pipeline lease Oil Industry Development Board (OIDB) of ` 8,000.00 rentals from the Ministry of Energy and Mining million (previous year ` 6,999.98 million). The interest (MEM), Sudan. The position of non-recourse rates on the same are 8.89%, 9.04%, 8.73%, 8.98%, deferred credit is as under:-
`
269
6.2.6 The joint venture, OPaL has borrowed Secured term loan from a Consortium of Banks & External Commercial Borrowings (ECB), by first ranking pari-passu mortgage / charge on immovable and movable properties and assets both present and future and second ranking pari-passu charge on the current assets. The details of rate, repayable period & outstanding amount are as below:-
6.2.7 The Joint Venture, MSEZ has term loan from a Consortium of Banks at the interest rate "base rate+agreed spread (i.e. at 11.25%) " secured by mortgage and hypothecation of immovable and movable assets repayable in 36 unequal quarterly installment commencing af ter moratorium period of 6 month from commercial operation date (COD
stis expected to be 1 April, 2015). Balance stoutstanding as on 31 March, 2014 is ` 5,546.62
million (Previous year ` 4,333.00 million) out of which group's share ` 1,467.76 million (Previous year 1,146.61 million).
6.2.8 The Rupee term loan (RTL) of the Joint Venture, OTPC executed with Power Finance Corporation
stLtd (PFC) has been repaid by OTPC on 31 Jan, 2014 and has been taken over by the State Bank of India (SBI). The outstanding loan from SBI is secured by first rank pari-passu charge on all immoveable properties - present and future, relating to the project and first charge by way of
hypothecation on all moveable properties - present and future, relating to project and first charge on all the receivables, Let ter of credit and Escrow Account. Interest on the RTL is at SBI base rate (floating)+ 0.50% (spread) and is repayable in 60 equal quarterly installments commencing
stfrom the 31 March, 2014. Balance outstanding for stthe same on 31 March, 2014 is 23,131.10 million
(Previous year ` 20,142.65 million) out of which group's share is 11,455.49 million (Previous year` 9,975.43 million). Further, the Joint venture company NETC of OTPC (NETC), still continue to avail loan from PFC by creating a first charge on its immovable properties acquired for the project along with the revenue and receivables from the project - present and future against which Group's share is `1,885.86 million (previous year
st` 2,035.27 million) as on 31 March, 2014.
6.2.9 The Joint Venture, PLL has external commercial borrowings from Internat ional Finance
(` in million)
Bank-MediumTerm loan
Bank-LongTerm Loan
from Q4 FY 2015-16to Q4 FY 2025-26
Sub Debt Base rate+spread 0.75%(11.00%ef fectively)
ExternalcommercialborrowingsUSD 50Million to Q4 FY 2019-20
ExternalcommercialborrowingsUSD 250Million
Total 140,046.03 16,740.00 69,126.72 8,262.86
11.00% By 31.12.2014 - 16,740.00 8,262.86
11.75% 41 quarterlyinstallments starting
110,303.61 - 54,445.86 -
Repayable af ter3 year from date ofdisbursement 16,434.62 - 8,112.13 - (i.e. Dec, 2016).
6 month 9 half yearlyUSD LIBOR installment+324 basis starting from 3,024.50 - 1,492.89 -points Q4 FY 2015-16
6 month 15 half yearlyUSD LIBOR installments+range 347 starting from 10,283.30 - 5,075.84 -to 355 basis Q4 FY 2015-16points to Q4 FY 2022-23
Type of loan Effective Rate Repayable period Outstanding Amount as on
31.03.2014 31.03.2013 31.03.2014 31.03.2013
Group’s share in outstanding on
268
Annual Report 2013-14

6.3.5 The subsidiary, OVL has unsecured non-current maturity of finance lease obligation of ` 4,811.12 million (Previous year 2,759.08 million).
6.3.6 The subsidiary, OVL has availed a term loan from Bank amounting to ` 106,606.50 million (USD 1,775 million) (Previous year ` nil) for the purpose of acquisition of block in Mozambique.
6.3.7 The Subsidiary, MRPL, has deferred payment liability on account of sale tax deferment liability of
` 2,159.17 million (Previous year 2,693.51 million) with nil interest rate, to be repaid by 2019-20.
6.3.8 The Joint Venture, PLL has raised the fund by issuing "Bonds- 8.35% Debenture - Series I" which are unsecured, non-conver tible debentures repayable in financial year 2018-19. Balance
stoutstanding as on 31 March, 2014 is ` 3,000.00 million (Previous year Nil) out of which group's share 375.00 million (Previous year Nil).
(` in million)
Non - Recourse Deferred (unsecured) As atst31 March, 2014
As atst31 March, 2013
Current (Note 12.3) 1,043.37 809.89
Non-Current (Note 6) - 134.98
Total 1,043.37 944.87
(` in million)
Particulars As atst31 March, 2014
As atst31 March, 2013
(i) Liabilities
Depletion of Producing Properties 218,766.58 177,977.15
Depreciation Allocated to Wells in Progress & expenses 23,002.57 14,799.59relating to NELP
Deferred Revenue Expenditure writ ten of f 3,718.06 5,050.44
Development wells-in Progress 10,052.58 12,045.58
Depreciation 18,419.18 7,898.11
Others 7,300.79 3,707.51
Deferred tax liability of ONGBV, OAAL- Subsidiary of OVL 7,347.57 11,714.50
Total (i) 288,607.33 233,192.88
(ii) Assets
Depreciation 22,690.58 13,710.90
Unabsorbed losses and allowances (1,581.49) -
Dry wells writ ten of f 18,340.46 10,650.76
Provision for Non-Moving Inventories 1,876.75 1,584.30
Provision for Doubt ful Debts/ Claims /Advances/ Interest 4,270.17 9,501.06
Provision for Abandonment 38,633.84 24,029.48
Provision for Leave Encashment\PRBS 1.73 1.56
Provision toward Additional Profit Petroleum & interest 3,426.45 3,102.97
Statutory duties unpaid u/s 43B 778.74 14,894.44
Others (note no. 7.1) 14,649.07 7,227.40
Deferred tax asset of ONGBV - Subsidiary of OVL 6,885.93 6,238.82
Total (ii) 109,972.23 90,941.69
270
7. Deferred Tax Liabilities stThe Deferred Tax Liability/Asset of the company, its subsidiaries and joint ventures as at 31 March, 2014 comprises
of the major components of Deferred Tax Liabilities and Deferred Tax Assets under Accounting Standard-22 on 'Accounting for Taxes on Income' the details of the same given here under:
7.1 Includes deferred tax asset of 1,618.41 million (Previous Year Nil) created consequent to assessment of impairment during exploration
` phase as at 01.04.2013 in terms of the Guidance Note on Oil and Gas Producing Activities (Revised) as referred at note no. 5.8 & 18.1(b)
(` in million)
(` in million)
Particulars As atst31 March, 2014
As atst31 March, 2014
As atst31 March, 2013
As atst31 March, 2013
Net Deferred Tax Liability of ONGC 165,786.79 128,879.81Net Deferred Tax Liability of OVL 6,921.94 3,649.86Net Deferred Tax Liability of ONGBV 6,965.31 7,733.56 Net Deferred Tax Liability of OAAL 328.23 261.47 Net Deferred Tax Liability of Carabobo One AB 54.02 69.61 Net Deferred Tax Liability of MRPL 4,703.24 7,343.14 Net Deferred Tax Liability of PLL 691.25 488.75 Net Deferred Tax Liability of OTPC 70.29 63.87 Net Deferred Tax Liability of DSL - -Consolidated Net Deferred Tax Liability 185,521.07 148,490.07
Net Deferred Tax Asset of ONGBV 6,763.69 5,840.86 Net Deferred Tax Asset of OAAL - 230.79 Net Deferred Tax Asset of PMHBL 122.24 167.17 Net Deferred Tax Asset of OTBL 0.04 0.06 Consolidated Net Deferred Tax Asset 6,885.97 6,238.88
Trade payables
- Outstanding dues to Micro & Small Enterprises - -
- Outstanding dues to other than Micro & Small Enterprises 1,020.45 1,301.85
Others
- Advance from customers 3,374.39 3,275.51
- Deposits from Suppliers and Contractors 31.23 52.49
- Liability for Capital Goods 1,773.16 1,662.97
- Liabilities for Liquidated Damages 9,904.05 9,250.07
- Other Liabilities 2,422.03 1,620.22
Total 18,525.31 17,163.11
8. Other Long Term Liabilities
8.1 Above other long term liabilities includes 7,261.96 million share of jointly controlled entities(Previous year ` 6,244.16 million).
`
Particulars
271
7.2 The above includes Deferred Tax Asset of ` 6,885.97 million (Previous year 6,238.88 million) and Deferred Tax Liability of 185,521.07 million (Previous Year 148,490.07 million)in respect of various components of entities consolidated as below:
`` `
Annual Report 2013-14

(` in million)
(` in million)
As atst31 March, 2014
As atst31 March, 2014
As atst31 March, 2013
As atst31 March, 2013
Provision for Employee benefits
- Unavailed Leave 386.24 18,509.05
- Gratuity 3.52 3.85
- Post Retirement Medical & Terminal Benefits 28,778.25 26,563.42
Provision for Abandonment (Note no. 9.3 & 44) 274266.03 207,255.35
Other Provisions (Note no. 44) 664.09 631.10
Total 304,098.13 252,962.77
Secured
Short Term Loans from Banks 810.75 738.30
Unsecured
Loans Repayable on demand from Bank 3,868.75 66,479.09
Other Short Term Loans :
From Banks 133,633.50 48,053.57
From Others 759.72 -
Total 139,072.72 115,270.96
9. Long Term Provisions
10. Short Term Borrowings
9.1 Above long term provisions includes ` 15.73 million share of jointly controlled entities (Previous year 11.07 million).
9.2 Subsidiaries and the Joint Venture Companies of OVL provide for the retirement benefits in accordance with the laws of Countries of their respective jurisdictions. The net impact on account of the dif ference in accounting policy is not ascertainable.
Above Secured short term borrowing includes` 810.75 million (Previous year ` 696.46 million) shares of jointly controlled entities and unsecured short term borrowing includes ` 3,868.75 million (Previous year 54,530.89 million) shares of jointly controlled entities.
10.1 Short Term Loan - Secured
10.1.1 The subsidiary, MRPL has outstanding secured short term Loan of ` 471.51 million (Previous year` 158.95 million) from Bank secured by way of hypothecation of MRPL's stock of raw materials, finished goods, stock-in-process, stores, spares, components, book debts, outstanding moneys receivable, claim, bills, contracts, engagements, securities, both present and future and further secured by second ranking pari-passu charge
9.3 Change in policy of accounting in respect of provision for abandonment net of salvage value to gross basis (refer accounting policy no. 2.2.k.1) has resulted in an increase in provision by` 26,969.32 million with corresponding increase in producing property by ` 26,729.88 million, Exploratory well in Progress by ` 59.04 million, Development well in progress by 42.97 million as on 31.03.2014 and decrease in profit before tax amounting to ` 137.43 million for the year ended 31.03.2014.
against company's immovable and movable fixed Asset both present and future. This includes ` 471.51 million (Previous year ` 117.12 million) in respect of joint venture company of MRPL, Shell MRPL Aviation Fuels & Services Pvt Ltd.
10.1.2 The Joint venture company, OTPC has borrowed short term loan from bank repayable within one year from date of first disbursement, that is by
th30 September, 2014 unless otherwise extended further. The short term loan is secured by first rank pari-passu charge on all immovable properties, present and future relating to project and firstcharge on all the receivable, let ter of credit andEscrow Account at interest rate SBI base rate ( f loat ing)+.75% (spread). The balance outstanding as on 31.03.2014 is of 685.00 million
Particulars
Particulars
272
(Previous year ` 1,169.84 million) out of which group's share is ` 339.24 million (Previous year` 579.35 million).
10.2 Short term Loan-Unsecured
10.2.1 The Joint venture, OPaL has borrowed short term loan from bank repayable on demand of` Nil (Previous year ` 104,003.95 million) out of which group's share is ` Nil (Previous year` 50,961.94 million).
10.2.2 The Joint venture, OMPL has borrowed short term loan from bank repayable on demand of 7,389.26 million (Previous year ` 7,412.31 million) out of which group's share is 3,557.85 million (Previous year 3,568.95 million).
(` in million)
As atst31 March, 2014
As atst31 March, 2013
- Outstanding dues to Micro & Small Enterprises 82.20 3.60
- Outstanding dues to other than Micro & Small Enterprises (note 11.3) 291,894.47 185,848.16
- Deferred Credit on Gas Sale (note 11.2) 14,806.41 296.04
Total 306,783.08 186,147.80
(` in million)
As atst31 March, 2014
As atst31 March, 2013
Current Maturity of Long Term Borrowings (note 12.2 & 12.3) 34,028.47 2,268.60
Current Maturity of Finance Lease Obligations 1,217.72 889.04
Interest Accrued but not due on Borrowings 2,098.79 1,181.89
Interest Accrued and due on Borrowings 135.33 272.99
Advance from Customers 27,087.38 5,184.07
Unclaimed Dividend ( note 12.4) 248.59 232.11
Liability for Capital Goods 28,044.22 40,037.21
Liability for Statutory Payments 19,634.39 19,954.87
Liability for Gratuity 18.22 155.98
Deposits from Suppliers and Contractors 7,061.07 4,024.10
Cash Call payable to JV Partners 31,299.06 22,186.46
Liability for Employees 9,641.61 6,586.84
Liability for Superannuation Benefits 427.31 20,204.79
Liabilities for Liquidated Damages 10,666.22 9,061.49
Other Liabilities ( note 12.5) 46,585.52 38,628.69
Total 218,193.90 170,869.13
12. Other Current liabilities
11. Trade Payables
10.2.3 The Joint venture, PLL has borrowed short term buyers credit from bank repayable on demand of ` 2,487.20 million (Previous year Nil) out of which group's share is ` 310.90 million (Previous year` Nil).
10.2.4 The Subsidiary, MRPL has availed ` Nil (Previous year ` 11,948.20 million) in the form of buyers credit from banks.
10.2.5 The subsidiary OVL has availed bridge/shortterm loan of `133,633.50 million (Previous year` 48,053.57 million) for the purpose of participating interest in Area 1 of fshore, Mozambique. Borrowings in previous year were taken for acquisition of participating interest in ACG fields and BTC pipeline, Azerbaijan which has been repaid in current year.
11.1 Above trade payable includes ` 3,597.75 million share of jointly controlled entities (Previous year` 5,109.40 million).
11.2 Deferred credit on gas sales represents amounts received from gas customers against "Take or Pay" obligations under relevant gas sales agreements. The amounts are to be utilized to supply gas in
subsequent year(s) free of charge to such customers.
11.3 In case of subsidiary MRPL, the trade payables includes ` 79,141.99 million being overdue amount payable to National Iranian Oil Company (NIOC) pending set tlement due to non finalisation of remit tance channel arising out of UN/US/EU backed sanctions.
Particulars
Particulars
273
Annual Report 2013-14
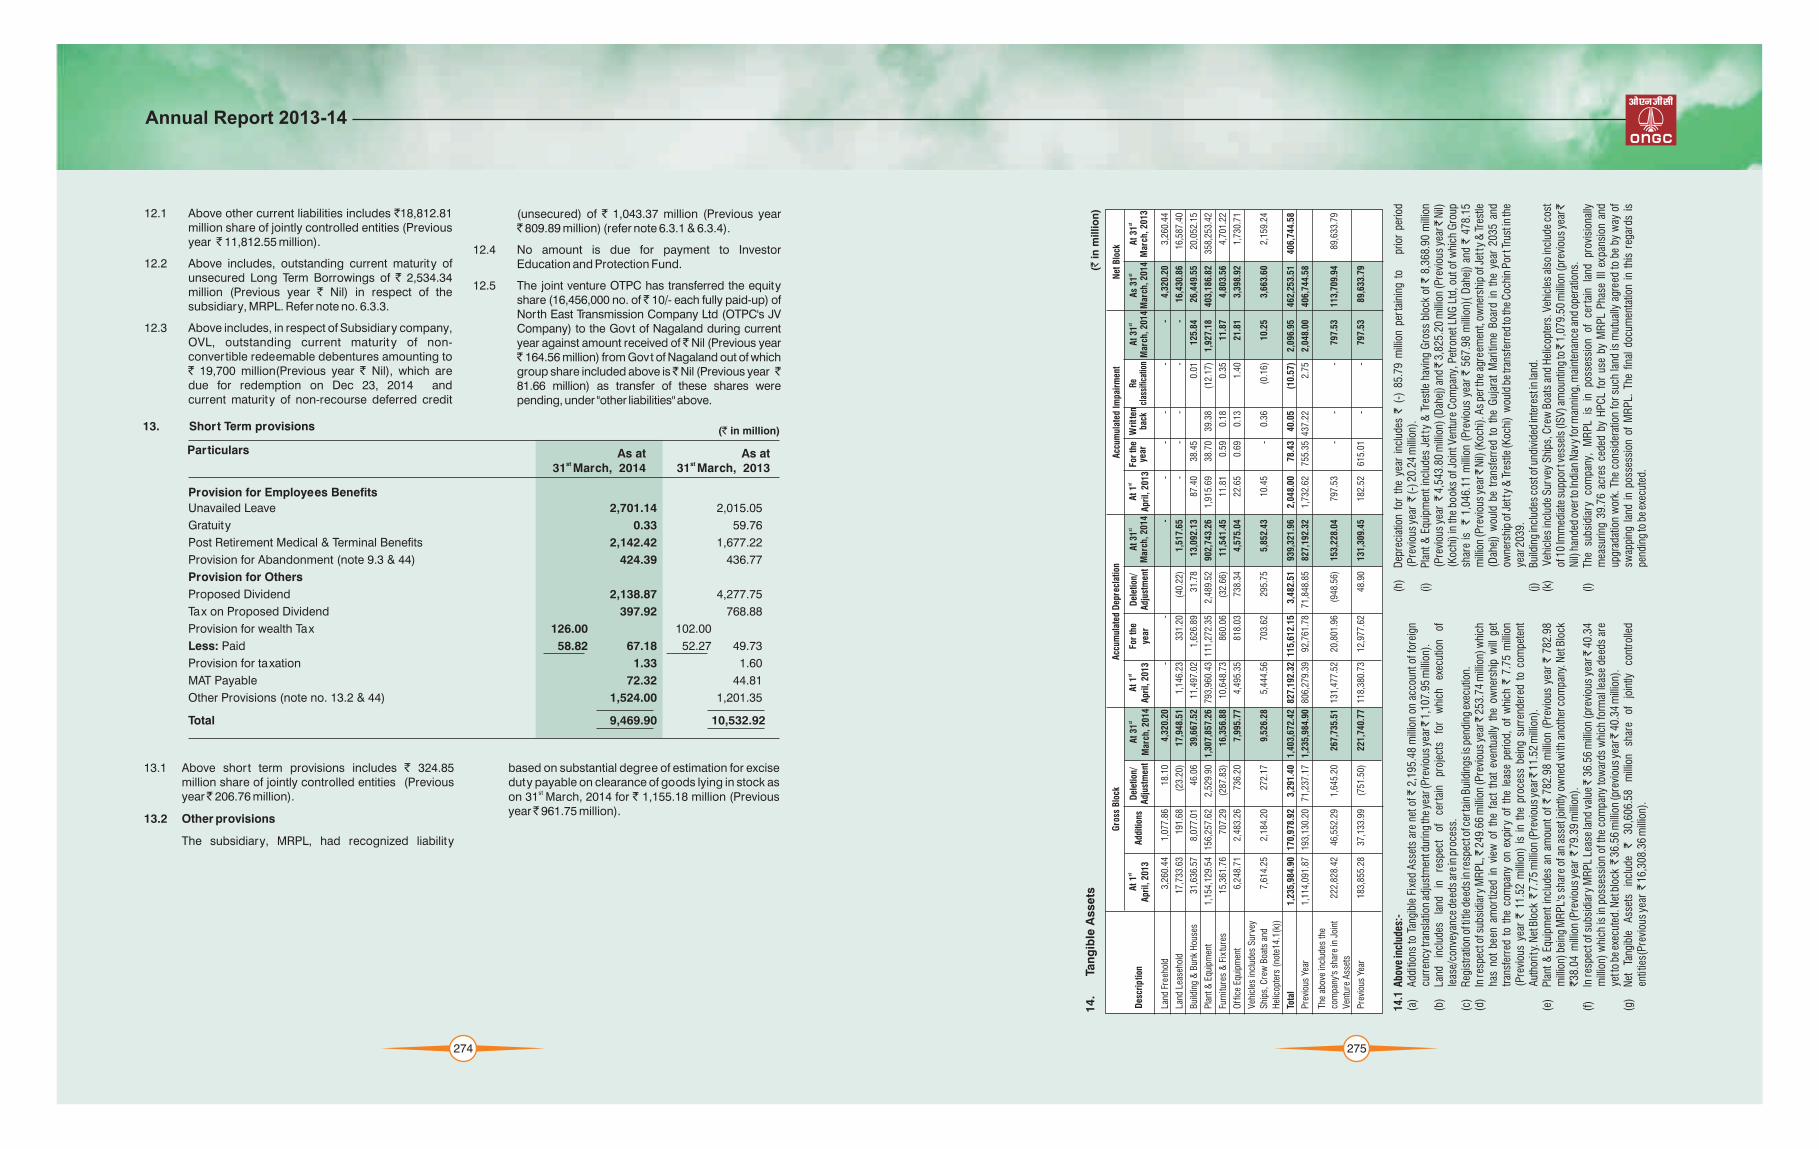
12.1 Above other current liabilities includes `18,812.81 million share of jointly controlled entities (Previous year 11,812.55 million).
12.2 Above includes, outstanding current maturity of unsecured Long Term Borrowings of ` 2,534.34 million (Previous year ` Nil) in respect of the subsidiary, MRPL. Refer note no. 6.3.3.
12.3 Above includes, in respect of Subsidiary company, OVL, outstanding current maturity of non-convertible redeemable debentures amounting to ` 19,700 million(Previous year ` Nil), which aredue for redemption on Dec 23, 2014 andcurrent maturity of non-recourse deferred credit
(unsecured) of ` 1,043.37 million (Previous year` 809.89 million) (refer note 6.3.1 & 6.3.4).
12.4 No amount is due for payment to Investor Education and Protection Fund.
12.5 The joint venture OTPC has transferred the equity share (16,456,000 no. of 10/- each fully paid-up) of North East Transmission Company Ltd (OTPC's JV Company) to the Govt of Nagaland during current year against amount received of Nil (Previous year ` 164.56 million) from Govt of Nagaland out of which group share included above is Nil (Previous year 81.66 million) as transfer of these shares were pending, under "other liabilities" above.
(` in million)
As atst 31 March, 2014
As atst 31 March, 2013
Provision for Employees Benefits
Unavailed Leave 2,701.14 2,015.05
Gratuity 0.33 59.76
Post Retirement Medical & Terminal Benefits 2,142.42 1,677.22
Provision for Abandonment (note 9.3 & 44) 424.39 436.77
Provision for Others
Proposed Dividend 2,138.87 4,277.75
Tax on Proposed Dividend 397.92 768.88
Provision for wealth Tax 126.00 102.00
Less: Paid 58.82 67.18 52.27 49.73
Provision for taxation 1.33 1.60
MAT Payable 72.32 44.81
Other Provisions (note no. 13.2 & 44) 1,524.00 1,201.35
Total 9,469.90 10,532.92
13. Short Term provisions
13.1 Above short term provisions includes ` 324.85 million share of jointly controlled entities (Previous year 206.76 million).
13.2 Other provisions
The subsidiary, MRPL, had recognized liability
Particulars
274
based on substantial degree of estimation for excise duty payable on clearance of goods lying in stock as
st on 31 March, 2014 for ` 1,155.18 million (Previous year 961.75 million).
275
14.
Tan
gib
le A
sse
ts
Land
Fre
ehol
d 3
,260
.44
1,0
77.8
6 1
8.10
4
,320
.20
-
-
-
-
--
-
-
4,3
20.2
0 3
,260
.44
Land
Lea
seho
ld 1
7,73
3.63
1
91.6
8 (
23.2
0) 1
7,94
8.51
1
,146
.23
331
.20
(40
.22)
1,5
17.6
5 -
-
- -
-
1
6,43
0.86
1
6,58
7.40
Bui
ldin
g &
Bun
k H
ouse
s 3
1,63
6.57
8
,077
.01
46.
06
39,
667.
52
11,
497.
02
1,6
26.8
9 3
1.78
1
3,09
2.13
8
7.40
3
8.45
0
.01
125
.84
26,
449.
55
20,
052.
15
Pla
nt &
Equ
ipm
ent
1,1
54,1
29.5
4 1
56,2
57.6
2 2
,529
.90
1,3
07,8
57.2
6 7
93,9
60.4
3 1
11,2
72.3
5 2
,489
.52
902
,743
.26
1,9
15.6
9 3
8.70
3
9.38
(
12.1
7) 1
,927
.18
403
,186
.82
358
,253
.42
Furn
itur
es &
Fix
ture
s 1
5,36
1.76
7
07.2
9 (
287.
83)
16,
356.
88
10,
648.
73
860
.06
(32
.66)
11,
541.
45
11.
81
0.5
9 0
.18
0.3
5 1
1.87
4
,803
.56
4,7
01.2
2
Off
ice
Equi
pmen
t 6
,248
.71
2,4
83.2
6 7
36.2
0 7
,995
.77
4,4
95.3
5 8
18.0
3 7
38.3
4 4
,575
.04
22.
65
0.6
9 0
.13
1.4
0 2
1.81
3
,398
.92
1,7
30.7
1
Veh
icle
s in
clud
es S
urve
y
Shi
ps, C
rew
Boa
ts a
nd
Hel
icop
ters
(no
te14
.1(k
))
Tota
l 1
,235
,984
.90
170
,978
.92
3,2
91.4
0 1
,403
,672
.42
827
,192
.32
115
,612
.15
3,4
82.5
1 9
39,3
21.9
6 2
,048
.00
78.
43
40.
05
(10
.57)
2,0
96.9
5 4
62,2
53.5
1 4
06,7
44.5
8
Pre
viou
s Ye
ar 1
,114
,091
.87
193
,130
.20
71,
237.
17
1,23
5,98
4.90
80
6,27
9.39
9
2,76
1.78
7
1,84
8.85
8
27,1
92.3
2 1
,732
.62
755
.35
437
.22
2.7
5 2
,048
.00
406
,744
.58
The
abov
e in
clud
es th
e
com
pany
's s
hare
in J
oint
Ven
ture
Ass
ets
Pre
viou
s Ye
ar 1
83,8
55.2
8 3
7,13
3.99
(
751.
50)
221
,740
.77
118
,380
.73
12,
977.
62
48.
90
131
,309
.45
182
.52
615
.01
--
797
.53
89,
633.
79
7,61
4.25
2
,184
.20
272
.17
9,5
26.2
8 5
,444
.56
703
.62
295
.75
5,8
52.4
3 1
0.45
-
0.3
6 (
0.16
) 1
0.25
3
,663
.60
2,1
59.2
4
222,
828.
42
46,
552.
29
1,6
45.2
0 2
67,7
35.5
1 1
31,4
77.5
2 2
0,80
1.96
(
948.
56)
153
,228
.04
797
.53
-
-
-
797
.53
113
,709
.94
89,
633.
79
Des
crip
tion
stA
t 1
Apr
il, 2
013
stA
t 1
Apr
il, 2
013
stA
t 1
Apr
il, 2
013
For
the
year
For
the
year
Wri
tten
back
Re
clas
sific
atio
nA
ddit
ions
Gro
ss B
lock
Acc
umul
ated
Dep
recl
atio
nA
ccum
ulat
ed I
mpa
irm
ent
Net
Blo
ck
Del
etio
n/A
djus
tmen
tD
elet
ion/
Adj
ustm
ent
stA
t 31
Mar
ch, 2
014
stA
t 31
M
arch
, 201
4
stA
t 31
M
arch
, 201
4
stA
s 31
M
arch
, 201
4
stA
t 31
M
arch
, 201
3
14.1
Abo
ve in
clud
es:-
(a)
Add
itio
ns to
Tan
gibl
e Fi
xed
Ass
ets
are
net o
f ` 2
,195
.48
mill
ion
on a
ccou
nt o
f for
eign
cu
rren
cy tr
ansl
atio
n ad
just
men
t dur
ing
the
year
(Pre
viou
s ye
ar
1,1
07.9
5 m
illio
n).
(b)
Land
in
clud
es
land
in
re
spec
t of
ce
rtai
n pr
ojec
ts
for
whi
ch
exec
utio
n of
le
ase/
conv
eyan
ce d
eeds
are
in p
roce
ss.
(c)
Reg
istr
atio
n of
title
dee
ds in
resp
ect o
f cer
tain
Bui
ldin
gs is
pen
ding
exe
cutio
n.(d
)In
res
pect
of s
ubsi
diar
y M
RP
L,
249
.66
mill
ion
(Pre
viou
s ye
ar
253
.74
mill
ion)
whi
ch
has
not
been
am
ortiz
ed i
n vi
ew o
f th
e fa
ct t
hat
even
tual
ly t
he o
wne
rshi
p w
ill g
et
tran
sfer
red
to t
he c
ompa
ny o
n ex
piry
of
the
leas
e pe
riod,
of
whi
ch `
7.7
5 m
illio
n (P
revi
ous
year
` 1
1.52
mill
ion)
is
in t
he p
roce
ss b
eing
sur
rend
ered
to
com
pete
nt
Aut
hori
ty. N
et B
lock
7
.75
mill
ion
(Pre
viou
s ye
ar
11.
52 m
illio
n).
(e)
Pla
nt &
Equ
ipm
ent
incl
udes
an
amou
nt o
f `
782.
98 m
illio
n (P
revi
ous
year
` 7
82.9
8 m
illio
n) b
eing
MR
PL'
s sh
are
of a
n as
set j
oint
ly o
wne
d w
ith
anot
her c
ompa
ny. N
et B
lock
`3
8.04
mill
ion
(Pre
viou
s ye
ar
79.
39 m
illio
n).
(f)
In r
espe
ct o
f sub
sidi
ary
MR
PL
Leas
e la
nd v
alue
3
6.56
mill
ion
(pre
viou
s ye
ar
40.
34
mill
ion)
whi
ch is
in p
osse
ssio
n of
the
com
pany
tow
ards
whi
ch fo
rmal
leas
e de
eds
are
yet t
o be
exe
cute
d. N
et b
lock
3
6.56
mill
ion
(pre
viou
s ye
ar
40.3
4 m
illio
n).
(g)
Net
Ta
ngib
le
Ass
ets
incl
ude
` 30
,606
.58
mill
ion
shar
e of
jo
intly
co
ntro
lled
enti
ties(
Pre
viou
s ye
ar
16,
308.
36 m
illio
n).
`
(` in
millio
n)
(h)
Dep
reci
atio
n fo
r th
e ye
ar i
nclu
des
` (-
) 85
.79
mill
ion
pert
aini
ng t
o
prio
r pe
riod
(Pre
viou
s ye
ar
(-) 2
0.24
mill
ion)
.(i
)P
lant
& E
quip
men
t in
clud
es J
etty
& T
rest
le h
avin
g G
ross
blo
ck o
f `
8,36
8.90
mill
ion
(Pre
viou
s ye
ar
4,5
43.8
0 m
illio
n) (D
ahej
) and
3
,825
.20
mill
ion
(Pre
viou
s ye
ar
Nil)
(K
ochi
) in
the
book
s of
Joi
nt V
entu
re C
ompa
ny, P
etro
net L
NG
Ltd
, out
of w
hich
Gro
up
shar
e is
`
1,04
6.11
mill
ion
(Pre
viou
s ye
ar `
567
.98
mill
ion)
( D
ahej
) an
d 47
8.15
m
illio
n (P
revi
ous
year
N
il). A
s pe
r the
agr
eem
ent,
owne
rshi
p of
Jet
ty &
Tre
stle
(D
ahej
) w
ould
be
tran
sfer
red
to t
he G
ujar
at M
arit
ime
Boa
rd i
n th
e ye
ar 2
035
and
owne
rshi
p of
Jet
ty &
Tre
stle
(Koc
hi)
wou
ld b
e tr
ansf
erre
d to
the
Coc
hin
Por
t Tru
st in
the
year
203
9.(j
)B
uild
ing
incl
udes
cos
t of u
ndiv
ided
inte
rest
in la
nd.
(k)
Veh
icle
s in
clud
e S
urve
y S
hips
, Cre
w B
oats
and
Hel
icop
ters
. Veh
icle
s al
so in
clud
e co
st
of 1
0 Im
med
iate
sup
port
ves
sels
(IS
V) a
mou
ntin
g to
1
,079
.50
mill
ion
(pre
viou
s ye
ar
Nil)
han
ded
over
to In
dian
Nav
y fo
r man
ning
, mai
nten
ance
and
ope
ratio
ns.
(l)
The
subs
idia
ry
com
pany
, M
RP
L is
in
po
sses
sion
of
ce
rtai
n la
nd
prov
isio
nally
m
easu
ring
39.7
6 ac
res
cede
d by
HP
CL
for
use
by M
RP
L P
hase
III
expa
nsio
n an
d up
grad
atio
n w
ork.
The
con
side
ratio
n fo
r su
ch la
nd is
mut
ually
agr
eed
to b
e by
way
of
swap
ping
lan
d in
pos
sess
ion
of M
RP
L. T
he f
inal
doc
umen
tatio
n in
thi
s re
gard
s is
pe
ndin
g to
be
exec
uted
.
` (K
ochi
)
`
Annual Report 2013-14
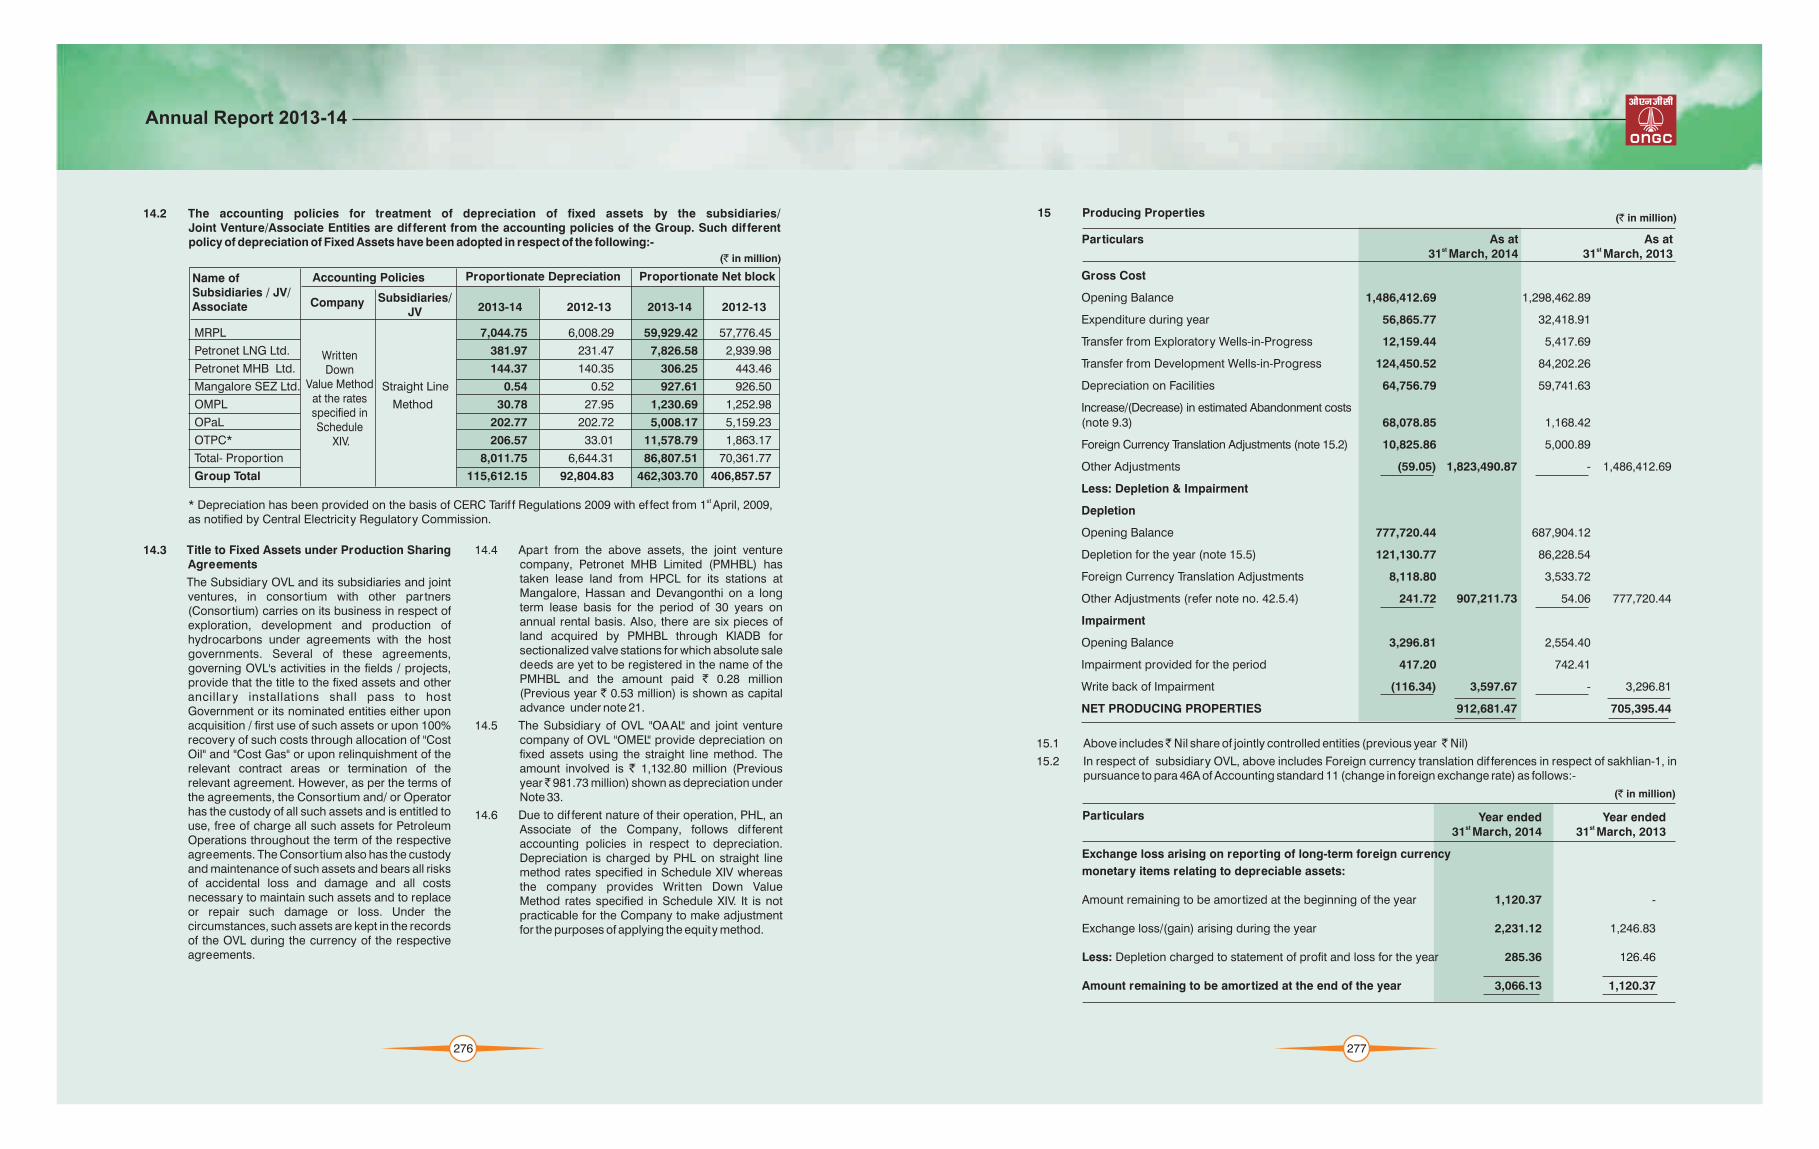
(` in million)
14.2 The accounting policies for treatment of depreciation of fixed assets by the subsidiaries/Joint Venture/Associate Entities are dif ferent from the accounting policies of the Group. Such dif ferent policy of depreciation of Fixed Assets have been adopted in respect of the following:-
14.3 Title to Fixed Assets under Production Sharing Agreements
The Subsidiary OVL and its subsidiaries and joint ventures, in consor tium with other partners (Consortium) carries on its business in respect of exploration, development and production of hydrocarbons under agreements with the host governments. Several of these agreements, governing OVL's activities in the fields / projects, provide that the title to the fixed assets and other ancillar y installations shall pass to host Government or its nominated entities either upon acquisition / first use of such assets or upon 100% recovery of such costs through allocation of "Cost Oil" and "Cost Gas" or upon relinquishment of the relevant contract areas or termination of the relevant agreement. However, as per the terms of the agreements, the Consortium and/ or Operator has the custody of all such assets and is entitled to use, free of charge all such assets for Petroleum Operations throughout the term of the respective agreements. The Consortium also has the custody and maintenance of such assets and bears all risks of accidental loss and damage and all costs necessary to maintain such assets and to replace or repair such damage or loss. Under the circumstances, such assets are kept in the records of the OVL during the currency of the respective agreements.
14.4 Apart from the above assets, the joint venture company, Petronet MHB Limited (PMHBL) has taken lease land from HPCL for its stations at Mangalore, Hassan and Devangonthi on a long term lease basis for the period of 30 years on annual rental basis. Also, there are six pieces of land acquired by PMHBL through KIADB for sectionalized valve stations for which absolute sale deeds are yet to be registered in the name of the PMHBL and the amount paid ` 0.28 million (Previous year ` 0.53 million) is shown as capital advance under note 21.
14.5 The Subsidiary of OVL "OAAL" and joint venture company of OVL "OMEL" provide depreciation on fixed assets using the straight line method. The amount involved is ` 1,132.80 million (Previous year 981.73 million) shown as depreciation underNote 33.
14.6 Due to dif ferent nature of their operation, PHL, an Associate of the Company, follows dif ferent accounting policies in respect to depreciation. Depreciation is charged by PHL on straight line method rates specified in Schedule XIV whereas the company provides Writ ten Down Value Method rates specified in Schedule XIV. It is not practicable for the Company to make adjustment for the purposes of applying the equity method.
MRPL 7,044.75 6,008.29 59,929.42 57,776.45
Petronet LNG Ltd. 381.97 231.47 7,826.58 2,939.98
Petronet MHB Ltd. 144.37 140.35 306.25 443.46
Mangalore SEZ Ltd. 0.54 0.52 927.61 926.50
OMPL 30.78 27.95 1,230.69 1,252.98
OPaL 202.77 202.72 5,008.17 5,159.23
OTPC* 206.57 33.01 11,578.79 1,863.17
Total- Proportion 8,011.75 6,644.31 86,807.51 70,361.77
Group Total 115,612.15 92,804.83 462,303.70 406,857.57
Straight Line
Method
st * Depreciation has been provided on the basis of CERC Tarif f Regulations 2009 with ef fect from 1 April, 2009, as notified by Central Electricity Regulatory Commission.
Writ ten Down
Value Methodat the ratesspecified inSchedule
XIV.
Name of Subsidiaries / JV/Associate
Accounting Policies
2013-14 2012-13 2012-13Company Subsidiaries/JV 2013-14
Proportionate Depreciation Proportionate Net block
276
15 Producing Properties
Gross Cost
Opening Balance 1,486,412.69 1,298,462.89
Expenditure during year 56,865.77 32,418.91
Transfer from Exploratory Wells-in-Progress 12,159.44 5,417.69
Transfer from Development Wells-in-Progress 124,450.52 84,202.26
Depreciation on Facilities 64,756.79 59,741.63
Increase/(Decrease) in estimated Abandonment costs
(note 9.3) 68,078.85 1,168.42
Foreign Currency Translation Adjustments (note 15.2) 10,825.86 5,000.89
Other Adjustments (59.05) 1,823,490.87 - 1,486,412.69
Less: Depletion & Impairment
Depletion
Opening Balance 777,720.44 687,904.12
Depletion for the year (note 15.5) 121,130.77 86,228.54
Foreign Currency Translation Adjustments 8,118.80 3,533.72
Other Adjustments (refer note no. 42.5.4) 241.72 907,211.73 54.06 777,720.44
Impairment
Opening Balance 3,296.81 2,554.40
Impairment provided for the period 417.20 742.41
Write back of Impairment (116.34) 3,597.67 - 3,296.81
NET PRODUCING PROPERTIES 912,681.47 705,395.44
As at st 31 March, 2014
As at st 31 March, 2013
15.1 Above includes Nil share of jointly controlled entities (previous year il)
15.2 In respect of subsidiary OVL, above includes Foreign currency translation dif ferences in respect of sakhlian-1, in pursuance to para 46A of Accounting standard 11 (change in foreign exchange rate) as follows:-
` N
(` in million)
Particulars Year endedst 31 March, 2014
Year endedst 31 March, 2013
Exchange loss arising on reporting of long-term foreign currency
monetary items relating to depreciable assets:
Amount remaining to be amortized at the beginning of the year 1,120.37 -
Exchange loss/(gain) arising during the year 2,231.12 1,246.83
Less: Depletion charged to statement of profit and loss for the year 285.36 126.46
Amount remaining to be amortized at the end of the year 3,066.13 1,120.37
(` in million)
Particulars
277
Annual Report 2013-14

15.3 Change in policy of capitalizing the cost of side tracking of producing wells, only if it results in increased proved developed reserves, to capitalizing the cost if it results in increased proved developed reserves or future economic benefits therefrom beyond previously assessed standard of performance (refer accounting policy no. 2.2.i.3), has the impact of increase in profit before tax by ` 7,879.28 million with corresponding increase in Producing Properties by ` 7,328.59 million and Development Wells in Progress by` 550.69 million during the year ended 31.03.2014.
15.4 Change in policy of transferring development wells to producing properties upon establishment of proved developed reserves and connectivity for production, to only upon establishment of proved developed reserves irrespective of connectivity, has the impact of decrease in profit before tax by` 247.48 million on account of increase in depletion on Development wells in progress
(DWIP) capitalized to Producing Properties with co r r espond ing decr ease in DWIP by` 5,444.14 million and increase in net Producing property by ` 5,196.66 million for the year ended 31.03.2014 (refer accounting policy no. 2.2.e.4.3).
15.5 During the year, in respect of Company's Joint Asset, PMT JV has downgraded reserves for the Mid and South Tapti fields due to geological surprises. As a result, the production profile is envisaged only up to 2015-16 and the sale realization (net of statutory levies) will be transferred to Site Restoration Fund pursuant to the Profit Sharing Contract. Under these circumstances, the field has been fully depleted and depletion aggregating to ` 9,090.44 million has been charged to the Statement of Profit and Loss. Similarly, a provision for impairment of` 441.87 million representing the salvage value of Tapti field and Tapti Capital Work in Progress has been made in the financial statements.
278 279
16.
Inta
ng
ible
Asse
ts
Com
pute
r S
oftw
are
6,7
95.5
8 1
88.6
5 8
1.85
6
,902
.38
5,8
31.6
2 5
09.8
4 7
9.49
6
,261
.97
22.
27
--
- 2
2.27
6
18.1
4 9
41.6
9
Cop
yrig
hts
& P
aten
ts -
-
(
56.5
0) 5
6.50
-
-
(
56.5
0) 5
6.50
-
-
--
-
-
-
Go
odw
ill (
note
16.
4) 2
0.13
-
-
2
0.13
1
2.07
2
.01
-
14.
08
-
--
- -
6
.05
8.0
6
Rig
ht o
f w
ay
142.
10
9.9
3 5
.49
146
.54
50.
60
14.
45
48.
68
16.
37
-
--
- -
1
30.1
7 9
1.50
Tota
l 6
,957
.81
198
.58
30.
84
7,1
25.5
5 5
,894
.29
526
.30
71.
67
6,3
48.9
2 2
2.27
-
-
-
2
2.27
7
54.3
6 1
,041
.25
Pre
viou
s Ye
ar 6
,667
.51
339
.92
49.
62
6,9
57.8
1 5
,281
.14
664
.76
51.
61
5,8
94.2
9 2
2.27
-
-
-
2
2.27
1
,041
.25
The
abov
e in
clud
es th
e
Com
pany
's s
hare
in J
oint
508
.96
88.
95
58.
23
539
.68
299
.63
103
.61
49.
22
354
.02
-
-
-
-
-
185
.66
149
.77
Ven
ture
Ass
ets
Pre
viou
s Ye
ar 3
03.0
0 7
6.09
6
.70
372
.39
230
.79
(6.
68)
1.4
9 2
22.6
2 -
-
--
- 1
49.7
7
Des
crip
tion
stA
t 1
Apr
il, 2
013
stA
t 1
Apr
il, 2
013
stA
t 1
Apr
il, 2
013
For
the
year
For
the
year
Wri
tten
back
Re
clas
sific
atio
nA
ddit
ions
Gro
ss B
lock
Acc
umul
ated
Dep
recl
atio
nA
ccum
ulat
ed I
mpa
irm
ent
Net
Blo
ck
Del
etio
n/A
djus
tmen
tD
elet
ion/
Adj
ustm
ent
stA
t 31
M
arch
, 201
4
stA
t 31
M
arch
, 201
4
stA
t 31
M
arch
, 201
4
stA
t 31
M
arch
, 201
4
stA
t 31
M
arch
, 201
3
16.1
Abo
ve in
clud
es:-
opin
ion
on "A
ccou
ntin
g of
righ
t of w
ay".
This
cha
nge
in p
olic
y ha
s re
sult
ed in
dec
reas
e (a
)A
ddit
ion
to
Inta
ngib
le
Ass
et
are
net
of `
(-)
24.2
8 m
illio
n on
ac
coun
t of
in p
rofi
t bef
ore
tax
by
11.
84 m
illio
n,fo
reig
n cu
rren
cy t
rans
latio
n ad
just
men
t du
ring
the
year
(pre
viou
s ye
ar `
(-)
24.
28
16.2
The
Ass
ocia
te,
Paw
an
Han
s Lt
d,
is
char
ging
co
st
of
soft
war
e pu
rcha
sed/
mill
ion)
.de
velo
ped
in-h
ouse
up
to
0.5
0 m
illio
n ea
ch to
sta
tem
ent o
f pro
fit &
loss
in th
e ye
ar o
f (b
)N
et
Inta
ngib
le
asse
t in
clud
e `
91.2
1 m
illio
n sh
ares
of
jo
intly
co
ntro
lled
purc
hase
.en
titie
s(pr
evio
us y
ear
1
01.7
2 m
illio
n).
16.3
The
Join
t Ven
ture
Com
pany
, OTP
C h
as p
aid
amou
nt o
f 1
97.4
0 m
illio
n (p
revi
ous
year
(c
)In
res
pect
of
Join
t V
entu
re
Com
pany
, P
etro
net
MH
B L
td (
PM
HB
L),
Cos
t of
Rig
ht o
f `
109.
65 m
illio
n) o
ut o
f whi
ch g
roup
's s
hare
is
97.
76 m
illio
n (p
revi
ous
year
5
4.29
w
ay fo
r lay
ing
pipe
line
amou
ntin
g to
3
8.86
mill
ion(
prev
ious
yea
r 3
8.86
mill
ion)
as
mill
ion)
to ta
ke p
osse
ssio
n of
For
est l
and
whi
ch h
as b
een
acco
unte
d as
rig
ht to
use
gr
oup
shar
e in
clud
ed a
bove
is c
apit
aliz
ed a
s in
tang
ible
ass
et a
nd s
aid
amou
nt is
bei
ng
land
" by
the
OTP
C. T
he s
aid
amou
nt is
bei
ng a
mor
tized
ove
r a p
erio
d of
25
year
s be
ing
amor
tized
ove
r pe
riod
of 3
5 ye
ars
bein
g th
e es
timat
ed d
esig
n lif
e of
pip
elin
e.
The
the
estim
ated
ope
ratin
g lif
e of
the
Pro
ject
.co
mpa
ny h
as c
hang
ed it
s ac
coun
ting
polic
y on
dep
reca
tion
of in
tang
ible
ass
et in
cas
e 16
.4R
epre
sent
s co
nsid
erat
ion
for p
urch
ase
of b
usin
ess
(Nit
roge
n P
lant
) in
exce
ss o
f bo
ok
of r
ight
of
way
(re
fer
revi
sed
acco
untin
g po
licy
no.
2.2
.p.6
) in
line
wit
h re
cent
ICA
I va
lue
of n
et a
sset
s ac
quir
ed b
y su
bsid
iary
MR
PL.
"
(` in
millio
n)
Annual Report 2013-14
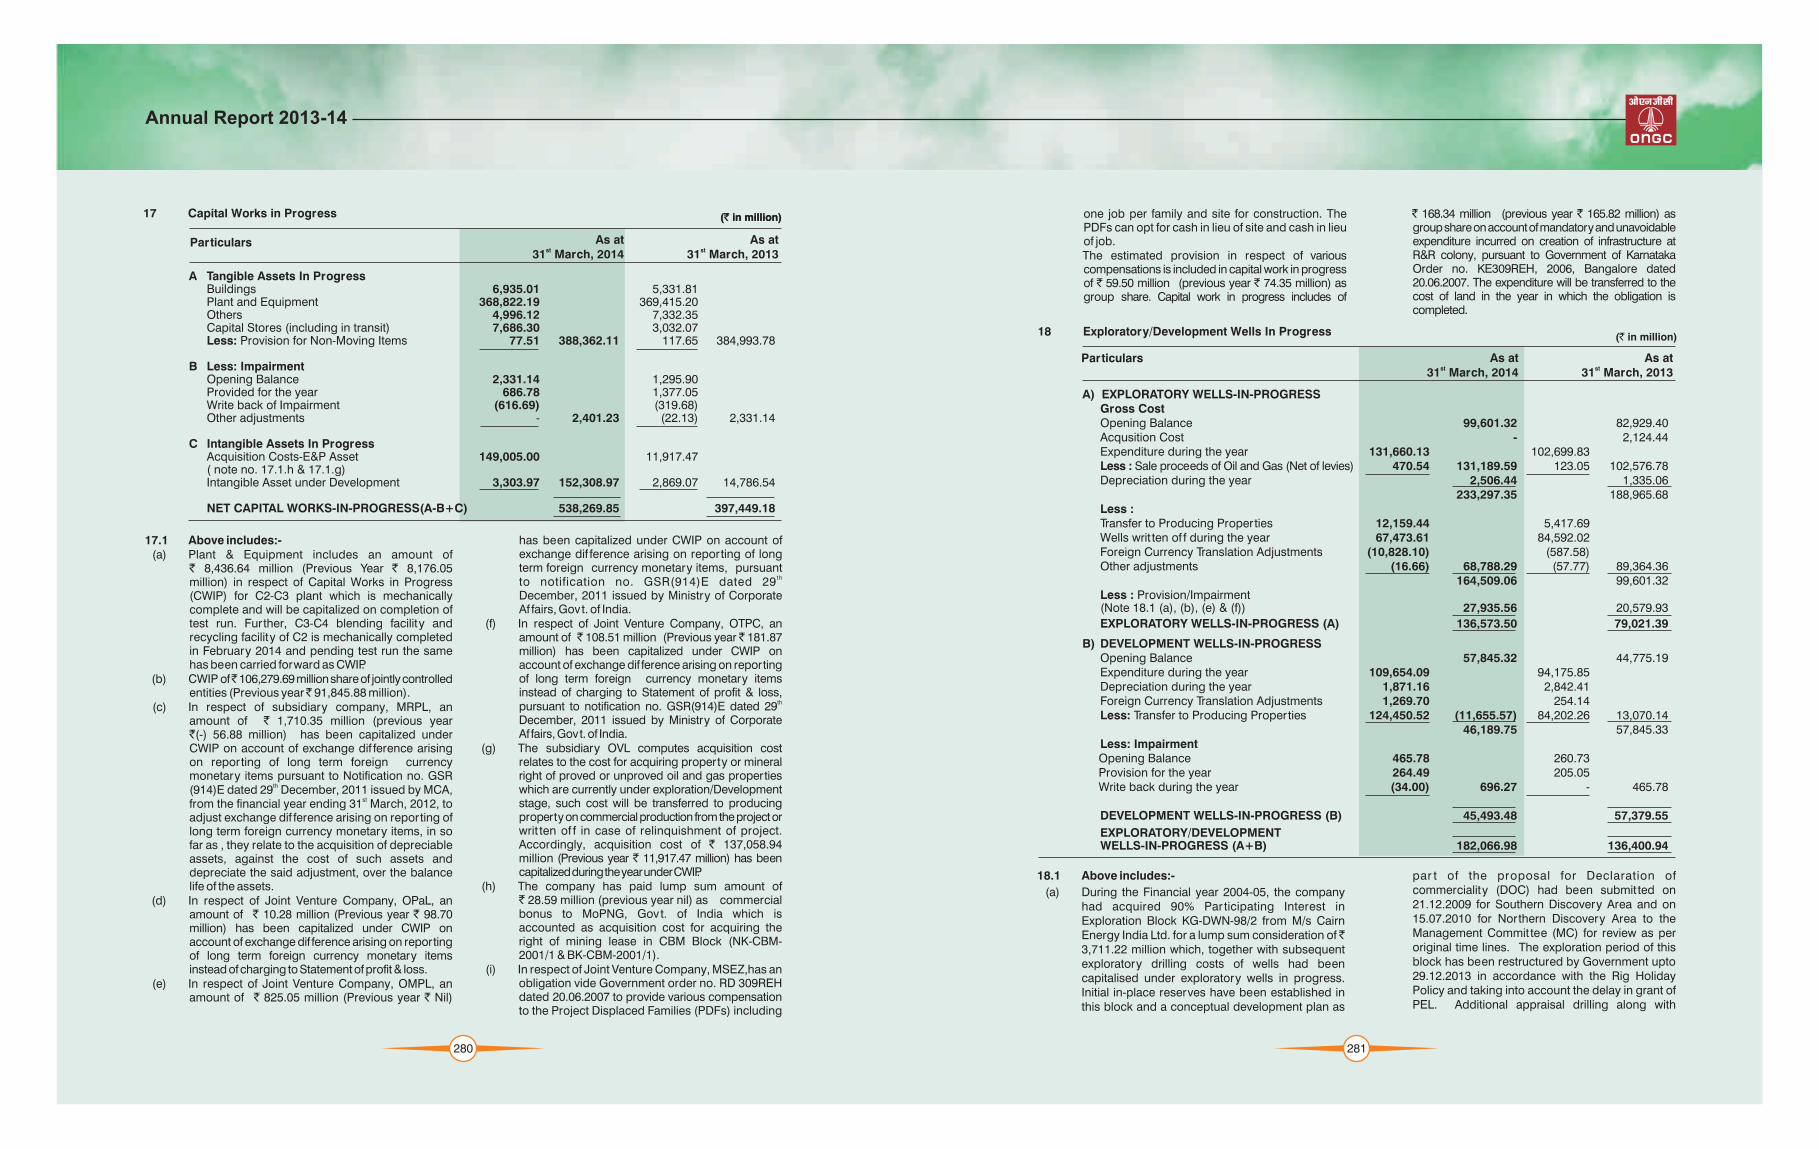
17 Capital Works in Progress
A Tangible Assets In ProgressBuildings 6,935.01 5,331.81 Plant and Equipment 368,822.19 369,415.20 Others 4,996.12 7,332.35 Capital Stores (including in transit) 7,686.30 3,032.07 Less: Provision for Non-Moving Items 77.51 388,362.11 117.65 384,993.78
B Less: Impairment
Opening Balance 2,331.14 1,295.90 Provided for the year 686.78 1,377.05 Write back of Impairment (616.69) (319.68)Other adjustments - 2,401.23 (22.13) 2,331.14
C Intangible Assets In Progress
Acquisition Costs-E&P Asset 149,005.00 11,917.47 ( note no. 17.1.h & 17.1.g)Intangible Asset under Development 3,303.97 152,308.97 2,869.07 14,786.54
NET CAPITAL WORKS-IN-PROGRESS(A-B+C) 538,269.85 397,449.18
As at st31 March, 2014
As at st31 March, 2013
17.1 Above includes:-(a) Plant & Equipment includes an amount of
` 8,436.64 million (Previous Year ` 8,176.05 million) in respect of Capital Works in Progress (CWIP) for C2-C3 plant which is mechanically complete and will be capitalized on completion of test run. Further, C3-C4 blending facility and recycling facility of C2 is mechanically completed in February 2014 and pending test run the same has been carried forward as CWIP.
(b) CWIP of 106,279.69 million share of jointly controlled entities (Previous year 91,845.88 million).
(c) In respect of subsidiary company, MRPL, an amount of ` 1,710.35 million (previous year`(-) 56.88 million) has been capitalized under CWIP on account of exchange dif ference arising on reporting of long term foreign currency monetary items pursuant to Notification no. GSR
th(914)E dated 29 December, 2011 issued by MCA, stfrom the financial year ending 31 March, 2012, to
adjust exchange dif ference arising on reporting of long term foreign currency monetary items, in so far as , they relate to the acquisition of depreciable assets, against the cost of such assets and depreciate the said adjustment, over the balance life of the assets.
(d) In respect of Joint Venture Company, OPaL, an amount of ` 10.28 million (Previous year ` 98.70 million) has been capitalized under CWIP on account of exchange dif ference arising on reporting of long term foreign currency monetary items instead of charging to Statement of profit & loss.
(e) In respect of Joint Venture Company, OMPL, an amount of ` 825.05 million (Previous year ` Nil)
has been capitalized under CWIP on account of exchange dif ference arising on reporting of long term foreign currency monetary items, pursuant
thto notification no. GSR(914)E dated 29 December, 2011 issued by Ministry of Corporate Af fairs, Govt. of India.
(f) In respect of Joint Venture Company, OTPC, an amount of 108.51 million (Previous year 181.87 million) has been capitalized under CWIP on account of exchange dif ference arising on reporting of long term foreign currency monetary items instead of charging to Statement of profit & loss,
thpursuant to notification no. GSR(914)E dated 29 December, 2011 issued by Ministry of Corporate Af fairs, Govt. of India.
(g) The subsidiary OVL computes acquisition cost relates to the cost for acquiring property or mineral right of proved or unproved oil and gas properties which are currently under exploration/Development stage, such cost will be transferred to producing property on commercial production from the project or writ ten of f in case of relinquishment of project. Accordingly, acquisition cost of ` 137,058.94 million (Previous year 11,917.47 million) has been capitalized during the year under CWIP.
(h) The company has paid lump sum amount of` 28.59 million (previous year nil) as commercial bonus to MoPNG, Govt. of India which is accounted as acquisition cost for acquiring the right of mining lease in CBM Block (NK-CBM-2001/1 & BK-CBM-2001/1).
(i) In respect of Joint Venture Company, MSEZ,has an obligation vide Government order no. RD 309REH dated 20.06.2007 to provide various compensation to the Project Displaced Families (PDFs) including
(` in million)(` in million)
Particulars
280
one job per family and site for construction. The PDFs can opt for cash in lieu of site and cash in lieu of job.The estimated provision in respect of various compensations is included in capital work in progress of ` 59.50 million (previous year ` 74.35 million) as group share. Capital work in progress includes of
18.1 Above includes:-
(a) During the Financial year 2004-05, the company had acquired 90% Par ticipating Interest in Exploration Block KG-DWN-98/2 from M/s Cairn Energy India Ltd. for a lump sum consideration of 3,711.22 million which, together with subsequent exploratory drilling costs of wells had been capitalised under exploratory wells in progress. Initial in-place reserves have been established in this block and a conceptual development plan as
168.34 million (previous year 165.82 million) as group share on account of mandatory and unavoidable expenditure incurred on creation of infrastructure at R&R colony, pursuant to Government of Karnataka Order no. KE309REH, 2006, Bangalore dated 20.06.2007. The expenditure will be transferred to the cost of land in the year in which the obligation is completed.
par t of the proposal for Declaration of commerciality (DOC) had been submit ted on 21.12.2009 for Southern Discovery Area and on 15.07.2010 for Northern Discovery Area to the Management Commit tee (MC) for review as per original time lines. The exploration period of this block has been restructured by Government upto 29.12.2013 in accordance with the Rig Holiday Policy and taking into account the delay in grant of PEL. Additional appraisal drilling along with
18 Exploratory/Development Wells In Progress
A) EXPLORATORY WELLS-IN-PROGRESS Gross Cost
Opening Balance 99,601.32 82,929.40 Acqusition Cost - 2,124.44 Expenditure during the year 131,660.13 102,699.83 Less : Sale proceeds of Oil and Gas (Net of levies) 470.54 131,189.59 123.05 102,576.78Depreciation during the year 2,506.44 1,335.06
233,297.35 188,965.68 Less :Transfer to Producing Properties 12,159.44 5,417.69 Wells writ ten of f during the year 67,473.61 84,592.02 Foreign Currency Translation Adjustments (10,828.10) (587.58)Other adjustments (16.66) 68,788.29 (57.77) 89,364.36
164,509.06 99,601.32 Less : Provision/Impairment (Note 18.1 (a), (b), (e) & (f)) 27,935.56 20,579.93
EXPLORATORY WELLS-IN-PROGRESS (A) 136,573.50 79,021.39
B) DEVELOPMENT WELLS-IN-PROGRESSOpening Balance 57,845.32 44,775.19 Expenditure during the year 109,654.09 94,175.85 Depreciation during the year 1,871.16 2,842.41 Foreign Currency Translation Adjustments 1,269.70 254.14 Less: Transfer to Producing Properties 124,450.52 (11,655.57) 84,202.26 13,070.14
46,189.75 57,845.33 Less: Impairment Opening Balance 465.78 260.73 Provision for the year 264.49 205.05 Write back during the year (34.00) 696.27 - 465.78
DEVELOPMENT WELLS-IN-PROGRESS (B) 45,493.48 57,379.55
EXPLORATORY/DEVELOPMENTWELLS-IN-PROGRESS (A+B) 182,066.98 136,400.94
As at st31 March, 2014
As at st31 March, 2013
(` in million)
Particulars
281
Annual Report 2013-14
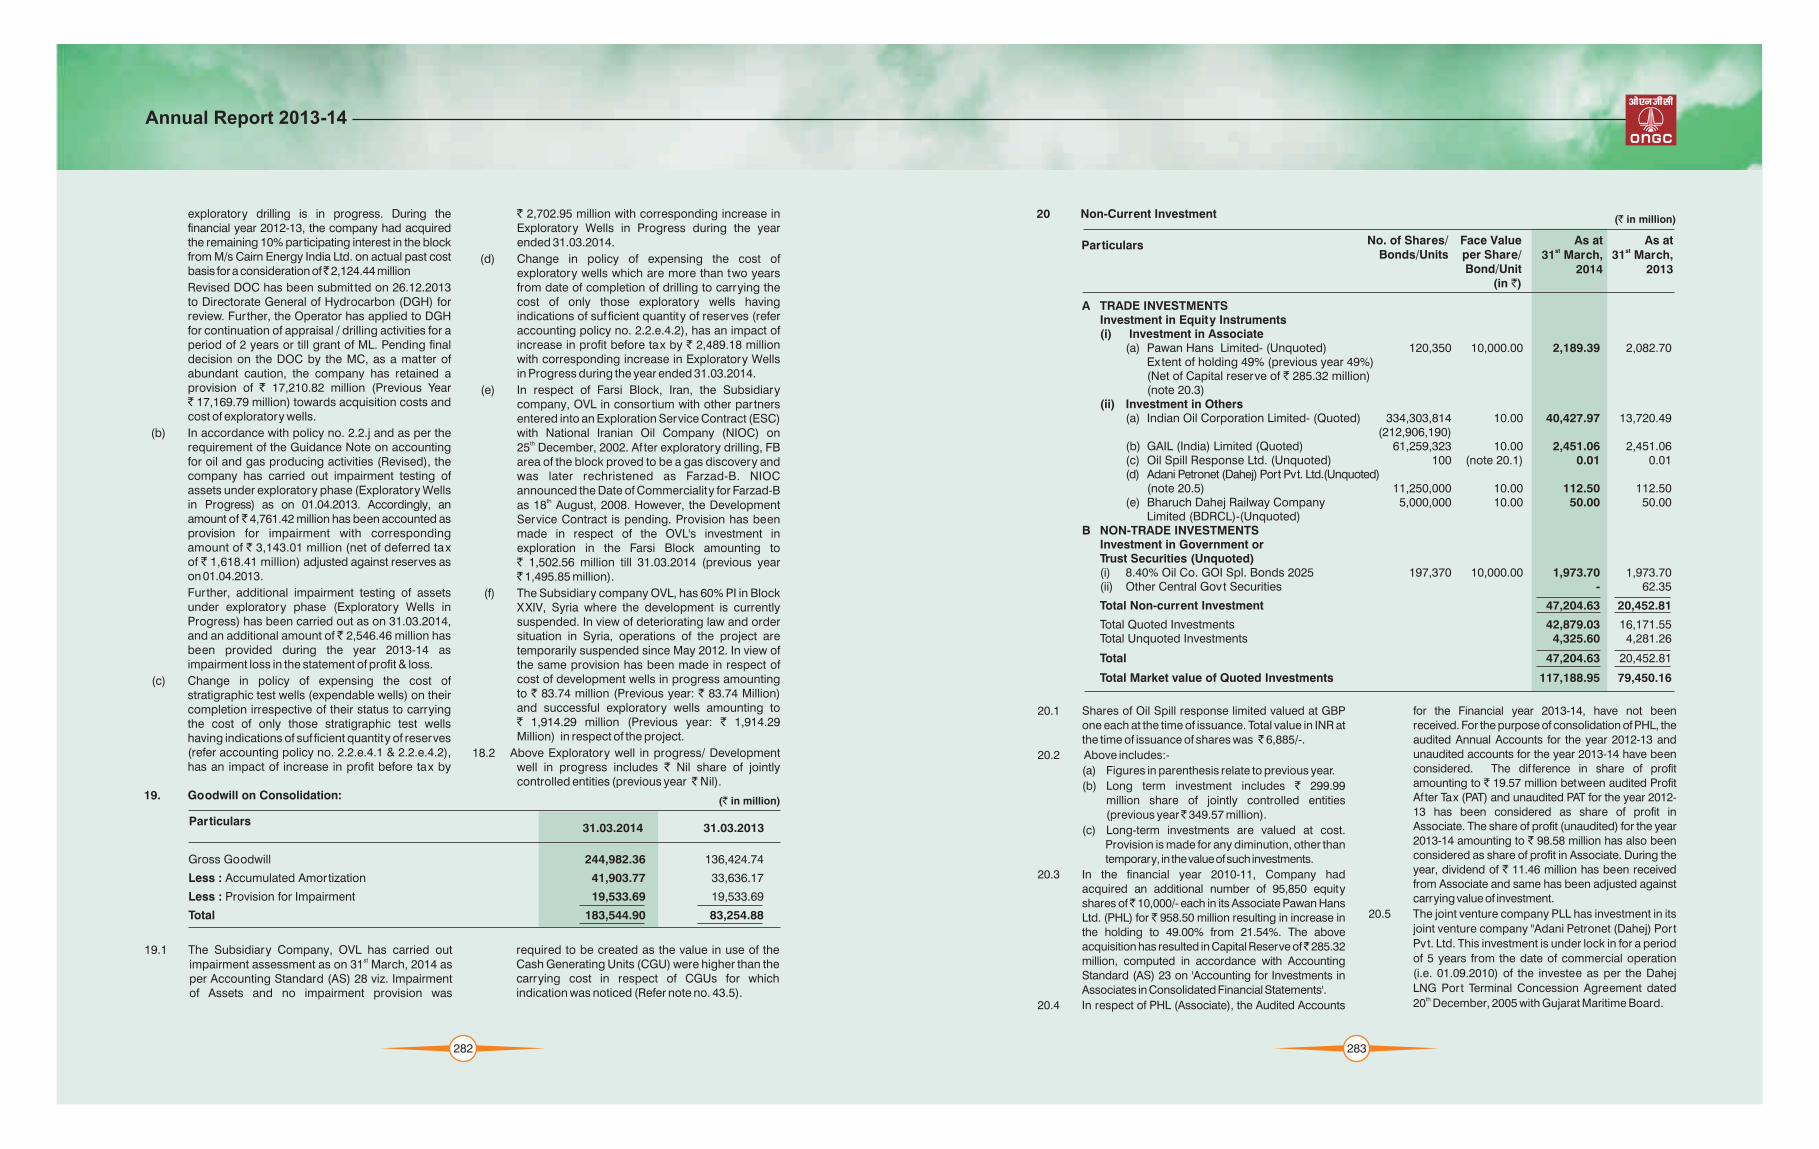
exploratory drilling is in progress. During the financial year 2012-13, the company had acquired the remaining 10% participating interest in the block from M/s Cairn Energy India Ltd. on actual past cost basis for a consideration of 2,124.44 million
Revised DOC has been submit ted on 26.12.2013 to Directorate General of Hydrocarbon (DGH) for review. Further, the Operator has applied to DGH for continuation of appraisal / drilling activities for a period of 2 years or till grant of ML. Pending final decision on the DOC by the MC, as a matter of abundant caution, the company has retained a provision of ` 17,210.82 million (Previous Year` 17,169.79 million) towards acquisition costs and cost of exploratory wells.
(b) In accordance with policy no. 2.2.j and as per the requirement of the Guidance Note on accounting for oil and gas producing activities (Revised), the company has carried out impairment testing of assets under exploratory phase (Exploratory Wells in Progress) as on 01.04.2013. Accordingly, an amount of 4,761.42 million has been accounted as provision for impairment with corresponding amount of ` 3,143.01 million (net of deferred tax of ` 1,618.41 million) adjusted against reserves as on 01.04.2013.
Further, additional impairment testing of assets under exploratory phase (Exploratory Wells in Progress) has been carried out as on 31.03.2014, and an additional amount of 2,546.46 million has been provided during the year 2013-14 as impairment loss in the statement of profit & loss.
(c) Change in policy of expensing the cost of stratigraphic test wells (expendable wells) on their completion irrespective of their status to carrying the cost of only those stratigraphic test wells having indications of suf ficient quantity of reserves (refer accounting policy no. 2.2.e.4.1 & 2.2.e.4.2), has an impact of increase in profit before tax by
` 2,702.95 million with corresponding increase in Exploratory Wells in Progress during the year ended 31.03.2014.
(d) Change in policy of expensing the cost of exploratory wells which are more than two years from date of completion of drilling to carrying the cost of only those exploratory wells having indications of suf ficient quantity of reserves (refer accounting policy no. 2.2.e.4.2), has an impact of increase in profit before tax by ` 2,489.18 million with corresponding increase in Exploratory Wells in Progress during the year ended 31.03.2014.
(e) In respect of Farsi Block, Iran, the Subsidiary company, OVL in consortium with other partners entered into an Exploration Service Contract (ESC) with National Iranian Oil Company (NIOC) on
th25 December, 2002. Af ter exploratory drilling, FB area of the block proved to be a gas discovery and was later rechristened as Farzad-B. NIOC announced the Date of Commerciality for Farzad-B
thas 18 August, 2008. However, the Development Service Contract is pending. Provision has been made in respect of the OVL's investment in exploration in the Farsi Block amounting to` 1,502.56 million till 31.03.2014 (previous year ` 1,495.85 million).
(f) The Subsidiary company OVL, has 60% PI in Block XXIV, Syria where the development is currently suspended. In view of deteriorating law and order situation in Syria, operations of the project are temporarily suspended since May 2012. In view of the same provision has been made in respect of cost of development wells in progress amounting to ` 83.74 million (Previous year: ` 83.74 Million) and successful exploratory wells amounting to` 1,914.29 million (Previous year: ` 1,914.29 Million) in respect of the project.
18.2 Above Exploratory well in progress/ Development well in progress includes ` Nil share of jointly controlled entities (previous year Nil).
31.03.2014 31.03.2013
Gross Goodwill 244,982.36 136,424.74
Less : Accumulated Amortization 41,903.77 33,636.17
Less : Provision for Impairment 19,533.69 19,533.69
Total 183,544.90 83,254.88
(` in million)
19.1 The Subsidiary Company, OVL has carried out stimpairment assessment as on 31 March, 2014 as
per Accounting Standard (AS) 28 viz. Impairment of Assets and no impairment provision was
required to be created as the value in use of the Cash Generating Units (CGU) were higher than the carrying cost in respect of CGUs for which indication was noticed (Refer note no. 43.5).
19. Goodwill on Consolidation:
Particulars
282
20 Non-Current Investment
A TRADE INVESTMENTSInvestment in Equity Instruments(i) Investment in Associate
(a) Pawan Hans Limited- (Unquoted) 120,350 10,000.00 2,189.39 2,082.70 Extent of holding 49% (previous year 49%) (Net of Capital reserve of ` 285.32 million)(note 20.3)
(ii) Investment in Others(a) Indian Oil Corporation Limited- (Quoted) 334,303,814 10.00 40,427.97 13,720.49
(212,906,190)(b) GAIL (India) Limited (Quoted) 61,259,323 10.00 2,451.06 2,451.06 (c) Oil Spill Response Ltd. (Unquoted) 100 (note 20.1) 0.01 0.01 (d) Adani Petronet (Dahej) Port Pvt. Ltd.(Unquoted)
(note 20.5) 11,250,000 10.00 112.50 112.50 (e) Bharuch Dahej Railway Company 5,000,000 10.00 50.00 50.00
Limited (BDRCL)-(Unquoted)B NON-TRADE INVESTMENTS
Investment in Government orTrust Securities (Unquoted)(i) 8.40% Oil Co. GOI Spl. Bonds 2025 197,370 10,000.00 1,973.70 1,973.70 (ii) Other Central Govt Securities - 62.35
Total Non-current Investment 47,204.63 20,452.81
Total Quoted Investments 42,879.03 16,171.55Total Unquoted Investments 4,325.60 4,281.26
Total 47,204.63 20,452.81
Total Market value of Quoted Investments 117,188.95 79,450.16
No. of Shares/Bonds/Units
Face Valueper Share/Bond/Unit
(in `)
As atst31 March,
2014
As atst31 March,
2013
(` in million)
20.1 Shares of Oil Spill response limited valued at GBP one each at the time of issuance. Total value in INR at the time of issuance of shares was 6,885/-.
20.2 Above includes:-
(a) Figures in parenthesis relate to previous year.
(b) Long term investment includes 299.99million share of jointly controlled entities(previous year 349.57 million).
(c) Long-term investments are valued at cost. Provision is made for any diminution, other than temporary, in the value of such investments.
20.3 In the financial year 2010-11, Company had acquired an additional number of 95,850 equity shares of 10,000/- each in its Associate Pawan Hans Ltd. (PHL) for ` 958.50 million resulting in increase in the holding to 49.00% from 21.54%. The above acquisition has resulted in Capital Reserve of 285.32 million, computed in accordance with Accounting Standard (AS) 23 on 'Accounting for Investments in Associates in Consolidated Financial Statements'.
20.4 In respect of PHL (Associate), the Audited Accounts
`
`
`
for the Financial year 2013-14, have not been received. For the purpose of consolidation of PHL, the audited Annual Accounts for the year 2012-13 and unaudited accounts for the year 2013-14 have been considered. The dif ference in share of profit amounting to ` 19.57 million between audited Profit Af ter Tax (PAT) and unaudited PAT for the year 2012-13 has been considered as share of profit in Associate. The share of profit (unaudited) for the year 2013-14 amounting to ` 98.58 million has also been considered as share of profit in Associate. During the year, dividend of ` 11.46 million has been received from Associate and same has been adjusted against carrying value of investment.
20.5 The joint venture company PLL has investment in its
joint venture company "Adani Petronet (Dahej) Port
Pvt. Ltd. This investment is under lock in for a period
of 5 years from the date of commercial operation
(i.e. 01.09.2010) of the investee as per the Dahej
LNG Port Terminal Concession Agreement dated th20 December, 2005 with Gujarat Maritime Board.
Particulars
283
Annual Report 2013-14

21 Long - Term Loans And Advances
Secured and Considered goodLoans & Advances to Associates 367.84 745.33 Loans and Advances to Employees 7,612.28 7,253.06 Loans and advances to Others 119.17 8,099.29 119.55 8,117.94
Unsecured(Considered Good unless otherwise stated) Capital Advances 19,332.69 22,227.16Public Sector UndertakingsConsidered Good - - Considered Doubt ful 240.50 240.50 Less : Provision for doubt ful Advances 240.50 - 240.50 -
Advances against Equity pending allotment 9,953.78 6,779.42 Loans and Advances to EmployeesConsidered Good 739.16 688.79 Considered Doubt ful 1.73 7.75 Less : Provision for Doubt ful Loan/Advances 1.73 739.16 7.75 688.79
Adv Recoverable in Cash or in kindConsidered Good ( note no. 21.3) 8,220.40 10,378.73 Considered Doubt ful (Note 21.2 ) 13,141.40 13,044.32 Less : Provision for Doubt ful Claims/Advances 13,141.40 8,220.40 13,044.32 10,378.73
Loans & Advances to OthersConsidered Good 27.67 27.48 Considered Doubt ful (Note 21. 4) 1,687.30 1,022.10 Less : Provision for Doubt ful Loan/Advances 1,687.30 27.67 1,022.10 27.48
Cash Call Receivable from Jv partnersConsidered Good 340.27 257.27 Considered Doubt ful 6,245.07 5,920.29 Less : Provision for Doubt ful cash call 6,245.07 340.27 5,920.29 257.27
MAT Credit Entitlement 2,909.32 24.65 Advance payment of Tax 329,690.97 382,492.76 Less : Provision for Taxation 281,031.74 48,659.23 345,969.76 36,523.00
Deposits With Customs/Port Trusts etc. 37.89 37.97 Security Deposits 157.81 86.37 Other DepositConsidered Good 3,730.94 4,080.23 Considered Doubt ful 629.88 608.06 Less: Provision for Doubt ful Deposits 629.88 3,926.64 608.06 4,204.57
Total 102,208.45 89,229.01
As at st31 March, 2014
As at st31 March, 2013
(` in million)
Particulars
284
21.1 Above long term loan & advances includes` 9,898.49 million share of jointly controlled entities (Previous Year 13,932.37 million).
21.2 In Ravva Joint Venture, the demand towards additional profit petroleum raised by the Government of India (GoI), due to dif ferences in interpretation of the provisions of the Production Sharing Contract (PSC) in respect of computation of Post-Tax Rate of Return (PTRR), based on the decision of the Malaysian High Court set ting aside an earlier arbitral tribunal award in favour of operator, was disputed by the operator M/s Cairn Energy India Pty Ltd. The company is not a party to the dispute but has agreed to abide by the decision applicable to the operator. The company had made a provision towards the claim made by the GoI in earlier years and the amount of provision
stoutstanding as on 31 March, 2014 is ` 10,080.75 million (equivalent to USD 167.84 million) af ter adjustments for interest and exchange rate fluctuations. The GoI had recovered the above amount [including interest thereon USD 54.88 million (` 3296.09 million )] from the company in earlier years which has been carried as recoverable under Long Term Loans and advances
stin the Balance Sheet as at 31 March, 2014.
In subsequent legal proceedings, the Appellate Authority of the Honorable Malaysian High Court of Kuala Lumpur had set aside the decision of the Malaysian High Court and the earlier decision of arbitral tribunal in favour of operator was restored, against which the GoI had preferred an appeal before the Federal Court of Malaysia. The Federal Cour t of Malaysia, vide its order dated
th11 October, 2011, had dismissed the said appeal of the GoI.
The company has taken up the matter regarding refund of the recoveries made in view of the favourable judgment of the Federal Court of Malaysia with MoP&NG. However, according to a
thcommunication dated 13 January, 2012 received, MoP&NG expressed the view that ONGC's proposal would be examined when the issues of ONGC carry under Ravva PSC is decided in its entirety by the Government along with other partners.
In view of the perceived uncertainties in obtaining the refund at this stage, the provision made in the books as above has been retained and netted of f against the amount recoverable as above in the
stfinancial statements for the year ended 31 March, 2014.
21.3 During the financial year 2010-11, the Oil Marketing Companies, nominees of the GoI recovered USD 32.07 million (`1,926.28 million), ONGC's share as per directives of GoI in respect of Jointly Controlled Assets-Panna, Mukta & Tapti. The recovery is towards certain observations raised by auditors appointed by the Director General of Hydrocarbons (DGH) under Production Sharing Contract (PSC) for the period 2002-03 to 2005-06 in respect of cost and profit petroleum share payable to GoI. BGEPIL along with RIL ("Claimants") have served a notice of arbitration on the GoI in respect of dispute, dif ferences and claims arisen in connection with the term of Panna, Mukta and Tapti PSC's. Since the company is not a party to the arbitration proceedings, it had requested MoP&NG that in case of an arbitral award, the same be made applicable to ONGC also, as a constituent of contractor for both the PSC's. Subsequently, vide let ter dated July 4, 2011 MoPNG has advised ONGC not to participate in the arbitration initiated by RIL & BGEPIL under Panna, Mukta & Tapti PSC's. MoP&NG has also stated that in case of an arbitral award, the same will be applicable to ONGC also as a constituent of the contractor for both the PSC's. Pending final arbitral award, the same has been shown as Receivable form GoI under 'Advance Recoverable in Cash or kind or value to be received' under 'Long Term Loans and Advances. (Figures in INR is reinstated).
21.4 The subsidiar y company OVL has 25% participating interest (PI) in the exploration Block Satpayev Area Kazakhstan, and 75% PI is hold by KMG the national oil company of Kazakhstan. As per the carry agreement, OVL is financing KMG's share of expenditure in the exploration block during the exploratory period (carry loan). The amount of carry loan will be refunded by KMG along with accrued interest in the event of commercial discovery and production from the project. The KMG's share of expenditure financed by OVL in the Block has been accounted for as loan to KMG. The interest on the carry loan has not been accounted for in view of uncertainty of recovery. Provision has been made towards the amount of carry loan of ` 1,687.30 million as on
st31 March, 2014 (Previous year ` 1,022.10 million) to KMG in view of the block being under exploration as there is no certainty of commercial discovery and has been depicted as other loans and advances-Doubtful. (Refer note 35.2)
285
Annual Report 2013-14
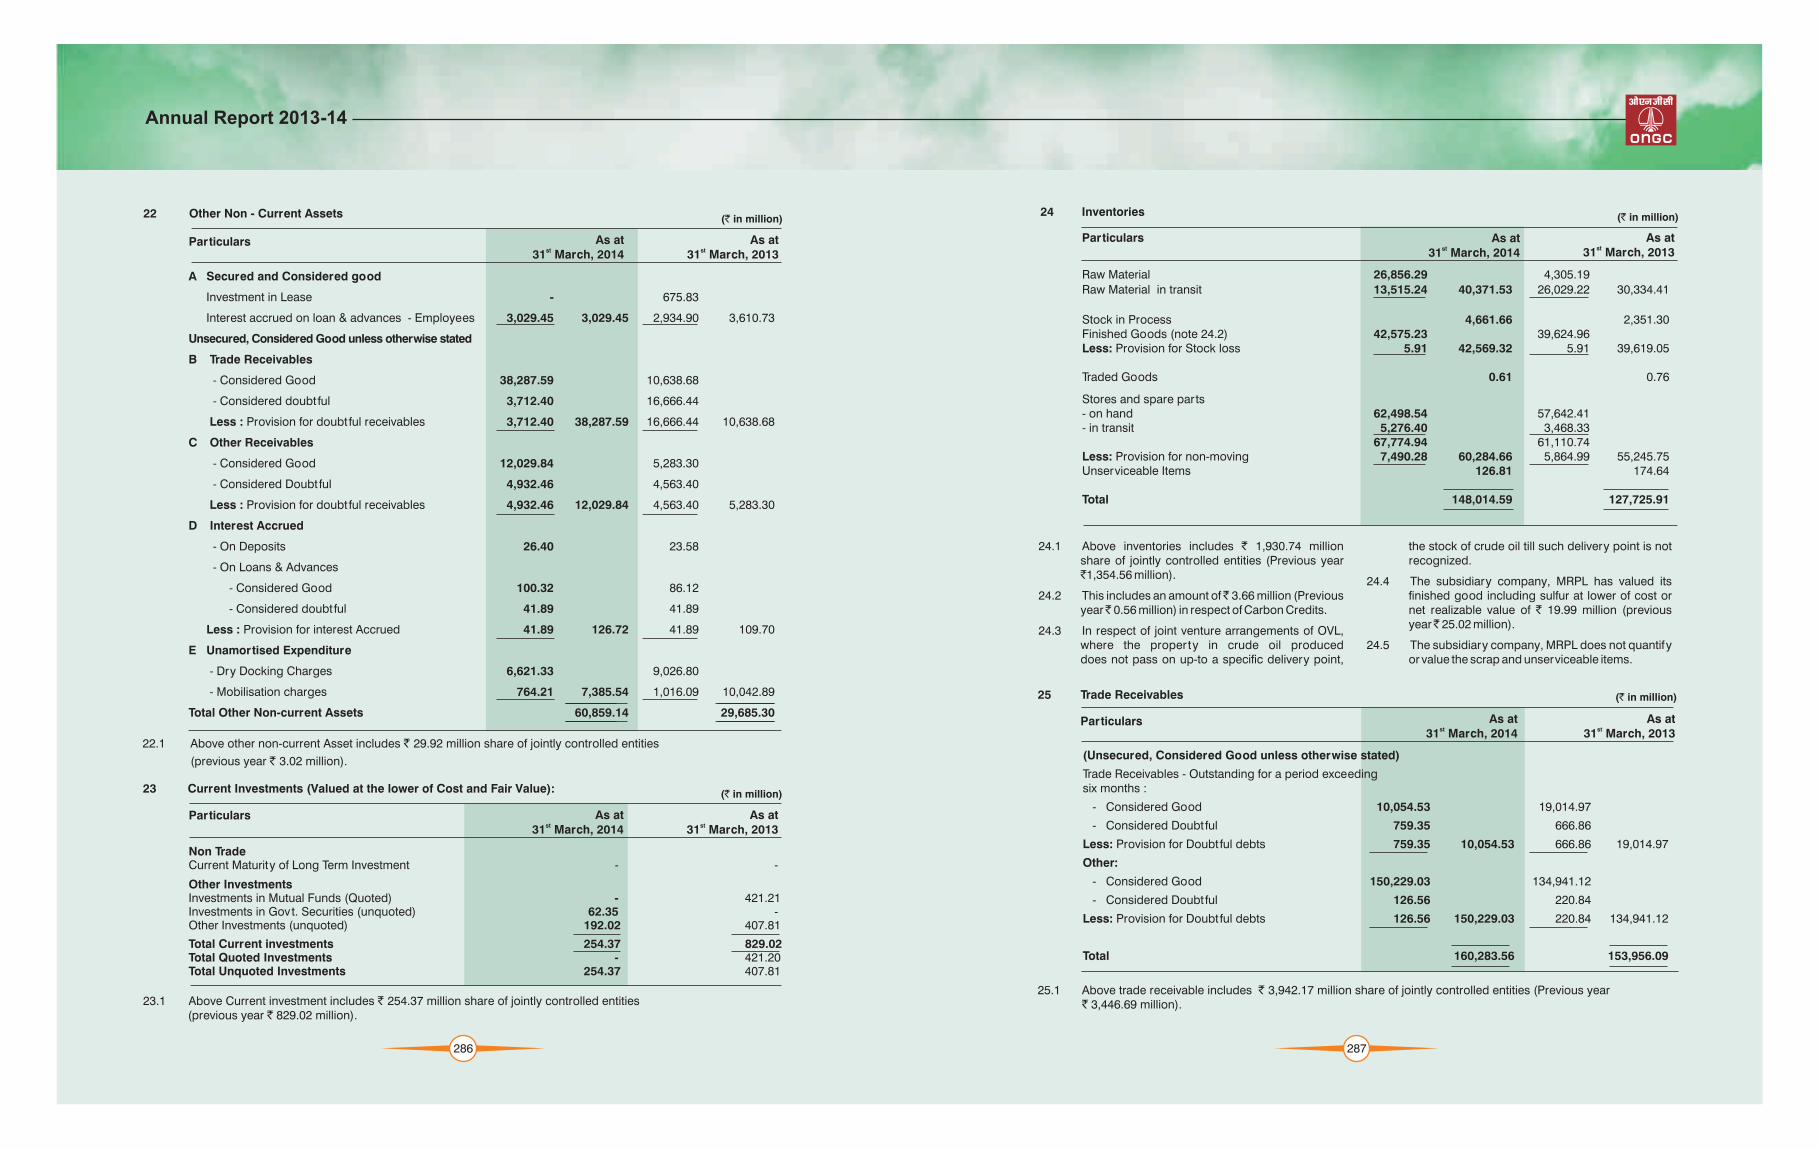
22 Other Non - Current Assets
A Secured and Considered good
Investment in Lease - 675.83
Interest accrued on loan & advances - Employees 3,029.45 3,029.45 2,934.90 3,610.73
Unsecured, Considered Good unless otherwise stated
B Trade Receivables
- Considered Good 38,287.59 10,638.68
- Considered doubt ful 3,712.40 16,666.44
Less : Provision for doubt ful receivables 3,712.40 38,287.59 16,666.44 10,638.68
C Other Receivables
- Considered Good 12,029.84 5,283.30
- Considered Doubt ful 4,932.46 4,563.40
Less : Provision for doubt ful receivables 4,932.46 12,029.84 4,563.40 5,283.30
D Interest Accrued
- On Deposits 26.40 23.58
- On Loans & Advances
- Considered Good 100.32 86.12
- Considered doubt ful 41.89 41.89
Less : Provision for interest Accrued 41.89 126.72 41.89 109.70
E Unamortised Expenditure
- Dry Docking Charges 6,621.33 9,026.80
- Mobilisation charges 764.21 7,385.54 1,016.09 10,042.89
Total Other Non-current Assets 60,859.14 29,685.30
As at st31 March, 2014
As at st31 March, 2013
(` in million)
23 Current Investments (Valued at the lower of Cost and Fair Value):
Non Trade Current Maturity of Long Term Investment - -
Other InvestmentsInvestments in Mutual Funds (Quoted) - 421.21 Investments in Govt. Securities (unquoted) 62.35 - Other Investments (unquoted) 192.02 407.81
Total Current investments 254.37 829.02 Total Quoted Investments - 421.20 Total Unquoted Investments 254.37 407.81
As at st31 March, 2014
As at st31 March, 2013
(` in million)
22.1 Above other non-current Asset includes ` 29.92 million share of jointly controlled entities
(previous year ` 3.02 million).
23.1 Above Current investment includes ` 254.37 million share of jointly controlled entities(previous year ` 829.02 million).
Particulars
Particulars
286
(Unsecured, Considered Good unless otherwise stated)
Trade Receivables - Outstanding for a period exceedingsix months :
- Considered Good 10,054.53 19,014.97
- Considered Doubt ful 759.35 666.86
Less: Provision for Doubt ful debts 759.35 10,054.53 666.86 19,014.97
Other:
- Considered Good 150,229.03 134,941.12
- Considered Doubt ful 126.56 220.84
Less: Provision for Doubt ful debts 126.56 150,229.03 220.84 134,941.12
Total 160,283.56 153,956.09
As at st31 March, 2014
As at st31 March, 2013
(` in million)
Raw Material 26,856.29 4,305.19
Raw Material in transit 13,515.24 40,371.53 26,029.22 30,334.41
Stock in Process 4,661.66 2,351.30 Finished Goods (note 24.2) 42,575.23 39,624.96 Less: Provision for Stock loss 5.91 42,569.32 5.91 39,619.05
Traded Goods 0.61 0.76
Stores and spare parts- on hand 62,498.54 57,642.41 - in transit 5,276.40 3,468.33
67,774.94 61,110.74 Less: Provision for non-moving 7,490.28 60,284.66 5,864.99 55,245.75 Unserviceable Items 126.81 174.64
Total 148,014.59 127,725.91
As at st31 March, 2014
As at st31 March, 2013
(` in million)24 Inventories
25 Trade Receivables
24.1 Above inventories includes ` 1,930.74 million the stock of crude oil till such delivery point is not share of jointly controlled entities (Previous year recognized.`1,354.56 million).
24.4 The subsidiary company, MRPL has valued its 24.2 This includes an amount of 3.66 million (Previous finished good including sulfur at lower of cost or
year 0.56 million) in respect of Carbon Credits. net realizable value of ` 19.99 million (previous year 25.02 million).
24.3 In respect of joint venture arrangements of OVL, where the property in crude oil produced 24.5 The subsidiary company, MRPL does not quantify does not pass on up-to a specific delivery point, or value the scrap and unserviceable items.
25.1 Above trade receivable includes ` 3,942.17 million share of jointly controlled (Previous year` 3,446.69 million).
entities
Particulars
Particulars
287
Annual Report 2013-14

26 Cash and Cash Equivalents
Balance with Bank on Current Accounts 8,533.78 11,655.54
Cash on hand 4,529.90 17.31
Short Term Investment in Mutual Funds 12,372.59 19.75
Bank Deposit 218,904.03 183,322.00
Deposit towards margin money against guarantees issued 66.51 62.44
On Deposit Accounts for more than 12 months maturity 4.76 724.79
Unclaimed Dividend Account (Note 26.2 & 26.3) 389.69 388.68
Total 244,801.26 196,190.51
As at st31 March, 2014
As at st31 March, 2013
(` in million)
26.1 Amount deposited in unclaimed dividend account 26.3 Above Cash and Bank balance include ` 7,769.03 is earmarked for payment of dividend and cannot million share of jointly controlled entities (Previous be used for any other purpose year 3,389.43 million).
26.2 Unpaid dividend includes ` 140.91 million 26.4 The deposits maintained by the company with (previous year ` 156.38 million) is pertaining banks comprise time deposit, which can be to minority shares in subsidiary company withdrawn by the company at any point without MRPL. prior notice or penalty on the principal
(Secured, Considered Good)
Loan & Advances to Associate 350.45 310.84Loans and Advances to Employees 2085.35 2,435.80 1966.37 2,277.21
(Unsecured, Considered Good unless otherwise stated) Loan to Public Sector Undertakings 2,367.70 - Loan & advances to Employees 517.38 429.94 Balance with Tax Authorities 228.73 319.21 Cash Call Receivable from JV Partners 8,359.22 10,153.00 Prepaid expenses for underlef t 1,667.24 262.94 Adv Recoverable in Cash or in kindConsidered Good 35,263.56 30,807.31 Considered Dout ful 3,030.84 3,476.94 Less: Provision for dout ful 3,030.84 35,263.56 3,476.94 30,807.31
Advance payment of Tax 20,419.24 22,227.91 Less : Provision for Taxation 12,833.84 7,585.40 12,987.79 9,240.12
MAT Credit 28.21 - Deposits With Customs/Port Trusts etc. 3,295.19 3,063.91 Other Deposits ( note no. 27.2) 6,450.98 9,746.17 3,212.45 6,276.36
Total 68,199.41 59,766.09
As at st31 March, 2014
As at st31 March, 2013
(` in million)27 Short Term Loans And Advances
27.1 Above, short term loans And advances includes royalty being deposited by the company fromst` 362.28 million share of jointly controlled entities 1 February, 2014 as per the interim order of the
(Previous year 748.92 million). Hon'ble Supreme Court of India. (also refer Note27.2 Includes ` 2,092.23 million towards dif ferential no. 45.2.4).
Particulars
Particulars
288
Secured and Considered goodInterest Accrued on Loans & Advances- Employee 246.15 216.65 - Associates - 246.15 9.86 226.51
(Unsecured, Considered Good unless otherwise stated) Interest Accrued- On Investments 1.38 1.38 - On Deposits 2,214.85 4,023.11 - On Loans & Advances 793.02 3,009.25 769.13 4,793.62
Other Current Assets (note 28.3) 3,103.32 4,011.55 Cost of Ongoing Project (note 28.2) 62.87 49.97
Unamortised Expenditure
- Dry Docking Charges 2,933.68 3,783.05
- Mobilisation charges 640.69 3,574.37 1,032.64 4,815.69
Total 9,995.96 13,897.34
A. Sale of Products
Own Product 1,808,736.23 1,681,824.57 Less : Transfer to Exploratory Wells in Progress 522.58 164.55 Government of India's (GoI's) share in Profit Petroleum 38,526.99 39,049.57 32,586.55 32,751.10
1,769,686.66 1,649,073.47 Traded Products Revenue 44.42 43.16
B. Other Operating RevenuePipeline Transportation Receipts 4,170.92 1,057.92 Contractual Short Lif ted Gas Receipts 80.21 51.72 Surplus from Gas pool Account (note 29.8) 3,720.47 3,597.73 North-East Gas Subsidy (note 29.7) 2,366.91 2,122.91 SEZ Lease Income 234.77 209.06 Other Operation Income 1,276.16 1,556.35 Processing Charges 414.03 621.69 Production Bonus 57.29 12,320.76 147.90 9,365.28
Total 1,782,051.84 1,658,481.91
As at st31 March, 2014
2013-14 2012-13
As at st31 March, 2013
(` in million)
(` in million)
28 Other Current Assets
29 Revenue From Operations
28.1 Above other current assets includes 335.08 recognized on full completion or substantial
million share of jointly controlled entities (Previous completion. Till the time of completion of project
year 237.40 million). same are being carried as costs of ongoing project.
28.2 In respect of Joint venture Company OTBL, 28.3 The subsidiary company, OVL has lease
revenue from projects based on execution and investment in Khartoum-Port Sudan Pipeline
costs at tributable and allocable thereto are Project. (refer note 41.1).
`
`
Particulars
Particulars
289
Annual Report 2013-14

29.1 In terms of the decision of Government of India (GOI), the company has shared under-recoveries of Oil Marketing Companies (OMCs) on price sensitive products viz. Diesel, Domestic LPG and PDS Kerosene for the year 2013-14 by extending the discount in the prices of Crude Oil, Domestic
29.2 For Crude Oil produced in Assam, sales revenue is based on the pricing formula provided by MoP&NG. Revenue from rest of nominated crude is accounted in terms of Crude Oil Sales Agreements (COSAs) already signed and made
stef fective from 1 April, 2010.
29.3 Based on the directives issued by MoP&NG and Petroleum Planning and Analysis Cell (PPAC) vide
st stlet ters dated 31 May, 2012 and 1 June, 2012 strespectively, w.e.f. 1 April, 2012, refineries started
making deductions from ONGC payments towards Octroi/ VAT/ CST on discounts allowed by ONGC to refineries on supplies of crude oil. Total deduction made by refineries on this account
st thfrom 1 April, 2012 to 30 September, 2013 amounting to ` 25,032.60 million (includes `15,846.70 million for the year 2012-13) was provided for. During the year, the company has decided to revise the sales revenue and
stcorresponding statutory levies w.e.f. 1 April, 2012 onwards, considering deductions made by refineries based on MoP&NG directives. Aforesaid p r ov is ion made by the Company t i l l
th30 September, 2013 has also been writ ten back.
29.4 Recognition of revenue on account of Short Lif ted Gas amounting to 1,253.74 million (Previous Year ` 571.42 million) has been postponed. This will be recognized when there is reasonable certainty regarding ultimate collection.
29.5 For APM consumers in North-East, consumer price is 60% of the producer price, i.e., US$ 2.52/ mmbtu inclusive of royalty and the dif ference between producer price and consumer price is
paid to the company through GoI Budget up to allocated quantity and shown as 'North-East Gas Subsidy’.
29.6 In respect of Joint venture company PLL, revenue from services of ` 253.83 million (previous year` 213.10 million) are net of service tax.
29.7 The OVL's Subsidiary- ONGBV follows the entitlement method for revenue recognition associated with sale of crude oil and liquids for its share of petroleum production as specified in the Exploration Production Sharing Agreement (EPSA) and Crude Oil Pipeline Agreement (COPA). The amount reported using such method is 39,747.98 Million (previous year 28,534.95 million).
29.8 The company is supplying majority of Natural gas to Gas Authority of India Limited (GAIL) which also purchases gas from other sources and sells toAPM and non-APM consumers. Based on the Government directives, excess in Gas Pool Account at the end of financial year is transferred to ONGC/ OIL in accordance with their contribution. Based on the details received from GAIL, an amount of ` 3,508.10 million (Previous year` 3,700.00 million) for Gas Pool Receipts for the current year, ` 212.37 million (Previous year` 339.23 million)on account of interest on Gas Pool Account and a reversal of nil (Previous year` 441.50 million) has been considered as 'Surplus from Gas Pool Account'.
29.9 Above revenue from operation includes` 50,232.74 million share of jointly controlled entities (previous year 42,411.52 million).
LPG and PDS Kerosene based on the ratesof discount communicated by Petroleum Planning and Analysis Cell (PPAC) and Ministry of Petroleum and Natural Gas (MoP&NG). The impact of discount is as under:
Gross Revenue 563,842.85 494,206.50
Less: Value Added Tax (VAT) 17,841.84 14,114.40
Sales Revenue 5,46,001.01 480,092.10
Less: Statutory Levies 68,440.26 59,502.49
Profit Before Tax 4,77,560.75 420,589.61
2013-14Decrease in 2012-13
(` in million)
290
Interest Income
Long Term Investments 169.59 439.76
Deposits with Banks/PSUs 18,388.08 20,333.50
Loans and Advances to Associate 493.81 144.62
Loans and Advances to Employees 100.92 450.84
Income Tax Refund 2,395.65 95.00
Site Restoration Fund Deposit 9,432.74 8,303.24
Delayed Payment from Customers and Others 523.60 31,504.39 1,250.16 31,017.12
Dividend Income
Long Term Investments 1,938.74 1,658.74
Short Term -Debt Mutual Funds 2,444.30 4,383.04 1,644.53 3,303.27
Other Non Operating Income
Excess Provisions writ ten back ( note 29.3) 16,343.62 5,340.34
Liabilities no longer required writ ten back 2,873.23 5,663.20
Profit on sale of investment 38.09 -
Contractual Receipts 1,486.27 650.06
Miscellaneous Receipts 12,308.47 33,049.68 8,932.92 20,586.52
Total 68,937.11 54,906.91
Closing Stock
- Stock in Process 4,661.66 2,351.30 - Finished Goods and Stock in trade 44,471.54 49,133.20 39,625.72 41,977.02
Opening Stock - Stock in Process 2,351.30 3,525.35 - Finished Goods and Stock in trade 39,625.72 28,838.12 Less: Adjustment 36.45 41,940.57 1,591.46 30,772.01
NET (INCREASE)/DECREASE IN INVENTORIES (7,192.63) (11,205.01)
2013-14
2013-14
2012-13
2012-13
(` in million)
(` in million)
30 Other Income
31 (Increase)/Decrease Inventories
30.1 Above other income includes `345.06 million share of jointly controlled entities (previous year ` 302.11 million).
31.1 Above includes ` (-) 26.59 million share of jointly controlled entities (previous year ` (-) 2,303.21 million).
Particulars
Particulars
291
Annual Report 2013-14

Royalty (Note 32.2) 150,101.83 137,209.63
Cess 99,733.91 99,970.75 Motor Spirit Cess 2.83 - Natural Calamity Contingent Duty 1,097.40 1,101.05 Excise Duty on stock (Net) (Note 32.3) 150.76 275.09 Sales Tax 3,122.96 3,834.14 Service Tax 438.76 352.81 Education cess 2,348.31 3,111.09 Octroi and Port Trust Charges 4,896.60 4,057.30 Staf f Expenditure 25,308.78 24,579.93 Workover Operations 20,944.08 19,135.41 Water Injection, Desalting and Demulsification 11,794.01 12,854.60 Consumption of Raw Materials, Stores and Spares 682,767.17 617,263.53 Pollution Control 6,133.59 5,810.33 Transport Expenses 9,419.99 8,891.83 Insurance 2,516.25 1,653.25 Power and Fuel 2,865.98 2,182.51 Repairs and Maintenance 10,787.12 9,603.95 Contractual payments including Hire charges etc. 14,407.07 9,418.05 Other Production Expenditure 35,608.46 27,205.00 Transportation and Freight of Products 11,559.67 11,821.98 Research and Development 6,014.37 6,002.02 General Administrative Expenses 38,401.83 33,369.51 Exchange Loss (Net) (2,894.69) 2,599.04 Provision for mark to market loss onderivative contracts ( note-32.7) 2,244.85 1,606.76 Adjustments for overlif t/(underlif t) 503.46 546.00 Loss on sale of investment 16.12 28.79 Other Expenditure 21,401.06 23,060.70
Total 1,161,692.53 1,067,545.05
2013-14 2012-13
(` in million)32 Production, Transportation, Selling and Distribution Expenditure
32.1 Above production, transportation, selling and distribution expenditure includes ` 43,919.03 million, share of jointly controlled entities (previous year 36,997.64 million).
32.2 The Subsidiary of OVL- ONGBV conducts its operations in Sudan jointly with Sudapet the national oil company of Sudan among others. All government stakes other than income taxes are considered to be royalty interest. Royalties on production represent the entitlement of the government of Sudan to a portion of ONGBV's share of crude oil and liquid production and are recorded using the rates in ef fect under the terms of the contract at the time of production. Royalties / taxes in Syrian concession are accounted similarly by ONGBV. The amount of royalty reported in respect of Sudan and Syrian concession is `15,863.65 Million under Royalty above (previous year 11,833.19 million).
32.3 Excise duty on sale of product has been deducted
from Sales revenue and Excise duty shown above represents the dif ference between excise duty on opening and closing stock of finished goods.
32.4 During the previous year, the Company had recognised additional liability of 5,079.53 million towards revision in Long Service Rewards Scheme. Further, in terms of DPE guidelines, the company had also recognized liabilit y of` 18,504.79 million towards superannuation benefits to employees. These had been allocated to activities as per the policy of the company.
32.5 An amount of 16,108.86 million has been provided thduring quarter ended 30 June, 2013 (Cumulative st16,108.86 million till 31 March, 2014) towards
contribution for conversion of Post Retirement Benefit Scheme (PRBS) from Defined Benefit Scheme to Defined Contributory Scheme based on guidelines of Department of Public Enterprise. The said amount has been allocated to dif ferent activities as per the policy of the Company.
Particulars
292
32.6 Derivative Contracts accounting as per the Accounting Standard(AS) 30 "Financial instruments: Recognition and Measurement" The Joint venture company (SMASL) through in respect of those derivative transactions which are subsidiary company MRPL, in line with its risk not covered by the existing Accounting Standard management policy, the financial risks mainly (AS) 11. This treatment has resulted in net gain of relating to changes in the exchange rates are `15.53 million (group share) (previous year ` Nil) hedged by using forward contracts.arising out of fair valuation of outstanding derivative The Joint venture company (SMASL) through contracts which has been recognized in "Hedging subsidiary company MRPLhas adopted, during the Reserve" under "Reserve and Surplus".year under review, the principles of hedge
Forward contracts for receivables including firm commitments and
highly probable forecasted transactions 389.45
Receivables, including firm commitments and highly probable
forecasted transactions 3.24
Category of derivative Instruments
Particulars
Group share as onst 31 March, 2014
Group share as onst 31 March, 2014
(` in million)
(` in million)st
Un-hedged foreign currency exposures as at 31 March,2014 are as under :-
32.7 Derivative instruments and un-hedged foreign banks whereby it has swapped the principalcurrency exposure: and interest amounts payable towards Bonds
issued in domestic markets into USD liability as The subsidiary company, OVL has entered into follows:cross currency swap transactions with various
Underlying Notional Principal Amount (` in Million) Amount ( USD in Million) Date
8.40% 5 Years Unsecured Non-Convertible RedeemableBonds in the nature of
rd Debentures- Series I 15,000.00 299.23 23 Dec., 2014
8.54% 10 Years UnsecuredNon-Convertible RedeemableBonds in the nature of
th Debentures- Series II 3,700.00 73.93 6 Jan., 2020
Total 18,700.00 373.16
Notional Principal Termination
The business of the subsidiary company, OVL is The above swap positions were outstanding oncarried out entirely outside India. The revenues of the 31 March, 2014 and have been revalued on that date OVL are received entirely in foreign currency and based on Mark-to-market positions reported by substantially all the expenses are incurred in foreign counter-par t y banks. During the year ended
stcurrency. Accordingly, the Company has swapped the 31 March, 2014 Mark-to-market loss amounting toBonds issued in Indian Rupees into USD so as to align ` 2,244.85 Million (Previous period ` 1606.76 Millions) the currency of its liabilities and assets, thereby has been charged in the Statement of Profit and Loss.hedging the resulting exposure.
st
293
Particulars of derivative contracts entered into for hedging foreign currency exchange risks, which stare outstanding as at 31 March, 2014 are as under:-
Annual Report 2013-14

35.1 Above provisions and write of fs includes 26.68 million shares of jointly controlled entities (previous year ` 5.97 million).
`
Depletion (refer note 15.5) 121,160.69 86,228.54
Amortisation of Goodwill 4,544.99 4,161.72 Depreciation 115,896.63 93,227.56 Less : Allocated to : Exploratory Drilling 2,506.43 1,335.06 Development Drilling 1,871.16 2,842.40 Depreciation on Facilities 64,756.79 59,741.63 Others 9,845.15 36,917.10 4,323.72 24,984.75
Impairment Loss (note 18.1(b) & 43)During the year 3,993.34 3,014.50 Less: Reversal during the period 807.08 3,186.26 756.47 2,258.03
Total 165,809.04 117,633.04
I) Interest expenses 4,776.07 3,492.98
ii) Other borrowing costs 392.66 175.55 iii) Lease Finance Charges 411.55 388.73 iv) Foreign Exchange Fluctuation considred
as Borrowing Cost 663.07 780.71
Total 6,243.35 4,837.97
2013-14
2013-14
2012-13
2012-13
(` in million)
(` in million)
33 Depreciation, Depletion, Amortization And Impairment
PROVISIONS
For Doubt ful Debts ( note-35.2) 3,305.11 16,940.14 For Doubt ful Advances 4,483.48 2,461.97 For Non-Moving Inventory 1,780.50 1,066.51 For Others 102.88 2,079.73 Sub-Total 9,671.97 22,548.35 WRITE-OFFSDisposal/Condemnation of Fixed Assets (Net) 157.79 56.80 Claims/Advances 1.22 2.18 Inventory 55.31 84.83 Bad debts 129.96 1,101.31 Less: Provisions 129.96 - 1,101.31 - Acquision Cost Writ ten of f - 254.37 Others 676.76 (702.94)Sub-Total 891.08 (304.76)
Total 10,563.05 22,243.59
2013-14 2012-13
(` in million)35 Provisions And Write Offs
34 Finance Costs
33.1 Above depreciation, depletion, amortization and impairment, includes ` 832.44 million share of jointlycontrolled entities. (previous year ` 522.82 Million).
34.1 Above finance Costs includes ` 765.03 million share of jointly controlled entities (previous year ` 494.19 Million).
Particulars
Particulars
Particulars
294
35.2 In respect of subsidiary company OVL, provision for doubt ful debts/claims includes carry loan of665.20 million (previous year 487.94 million) to KMG in view of the block being under exploration and there is
no certainty of commercial discovery and hence the recovery of the loan. (refer note 21.4)` `
A. EXPENDITURE
Statutory levies - 51.86
Other production, selling & distribution expenditure (188.93) (434.96)
Excess Abandonment Provision writ ten back (note no.44) (2,353.23) -
Interest -Others 343.82 12.43
Exchange Fluctuation - (58.47)
Survey (6.30) 0.47
Dry Wells 82.55 455.38
Depletion 164.56 82.55
Depreciation (85.79) (20.24)
Sub-Total (2,043.32) 89.02
B. INCOME
Sales (104.88) (193.96)
Interest -Others 0.23 3.22
Other Income 484.70 280.90
Sub-Total 380.05 90.16
Total (Net) (2,423.37) (1.14)
2013-14 2012-13
(` in million)36 Adjustments Relating to Prior Period (Net) :
36.1 Above adjustments relating to prior period include ` 64.28 million share of jointly controlled entities(Previous year 22.04 million).
Net Profit af ter Tax ( ` in million) 265,065.33 242,196.44
Weighted Average Number of Shares (Nos. in million) 8,555.49 8,555.49
Basic & Diluted earnings per equity share( ` ) 30.98 28.31
Face Value per equity Share ( ` ) 5.00 5.00
2013-14 2012-13
37 Earnings Per Equity Share
38 Disclosure under Accounting Standard-16 on "Borrowing Costs” :
Borrowing cost capitalized during the period is 13,659.16 million (previous year 8,413.24 million).
Particulars
Particulars
295
Annual Report 2013-14

39.2 Notes :
39.2.1 The annexed matrix presentation depicts the geographical segments based on assets as primary segments and business segments as secondary segments.
39.2.2 Segments have been identified and reported taking into account the dif fering risks and returns, the organization structure and the internal reporting systems. These have been organized into the following main geographical and business segments:
Geographical Segments
a) In India - Of fshore
- Onshore
b) Outside India.
Business Segments
a) Exploration & Production
b) Refining
39.2.3 Segment Revenue, Results, Assets and Liabilities include the respective amounts identifiable to each of the segments and amount allocated on reasonable basis. Un-allocated includes common expenditure incurred for all the segments and expenses incurred at the corporate level.
39.2.4 Inter Segment Sales have been priced at prevailing market rates.
39.2.5 Segment Assets includes ` 754.36 million of Intangible Assets (Previous year 1,041.25 million).
Revenue from operation (Gross) 29 1,782,051.84 1,658,481.91
Prior period Sales 36 (104.88) (193.96)
Total 1,781,946.96 1,658,287.95
Segment Revenue as per note no. 39.1 1,781,946.96 1,658,287.95
2013-14Particulars Note 2012-13
(` in million)
40 Disclosure under Accounting Standard -18 on "Related Party Disclosure :
40.1 Name of related parties and description of relationship :
40.1.1 Joint Ventures/Jointly Controlled Entities :
"
Sl No. Name Relationship
A Jointly Controlled Entities in India
i ONGC Mangalore Petrochemicals Ltd Jointly Controlled Entity in India
ii Petronet LNG Limited Jointly Controlled Entity in India
iii ONGC Teri Biotech Limited Jointly Controlled Entity in India
iv Mangalore SEZ Limited Jointly Controlled Entity in India
v ONGC Petro-additions Limited Jointly Controlled Entity in India
vi ONGC Tripura Power Co. Limited Jointly Controlled Entity in India
vii Dahej SEZ Limited Jointly Controlled Entity in India viii North East Transmission Company Ltd.
Limited (NETC) (through OTPC)
ix Mangalore STP Limited (through MSEZ) Jointly Controlled Entity in India
x Adani Petronet (Dahej) Port Pvt. Ltd Jointly Controlled Entity in India
xi Shell MRPL Aviation Fuels & Services Pvt. Limited(through MRPL) Jointly Controlled Entity in India
xii Mangalam Retail Services Limited (through MRPL) Jointly Controlled Entity in India
B Joint Ventures/Associates of Subsidiary
i ONGC Mit tal Energy Limited, Cyprus Joint Venture (Outside India) through OVL
Jointly Controlled Entity in India
39.2.6 Reconciliation of the Segment Revenue with the Revenue as per note 29 & 36 is given below:
297296
(` in
millio
n)
Rev
enue
Exte
rnal
Sal
es 5
25,0
36.9
4 2
39,7
88.5
0 7
52,4
63.7
6 2
17,7
71.5
2 4
6,88
6.24
1,
781,
946.
96
499
,727
.85
254
,709
.05
688
,329
.15
175
,578
.25
39,
943.
65 1
,658
,287
.95
Inte
r S
egm
ent S
ales
74,
365.
85
39.
58
-
- 7
4,40
5.43
7
6,91
5.36
-
30.
61
-
- 7
6,94
5.97
Tota
l Rev
enue
599
,402
.79
239
,788
.50
752
,503
.34
217
,771
.52
46,
886.
24
1,85
6,35
2.39
5
76,6
43.2
1 2
54,7
09.0
5 6
88,3
59.7
6 1
75,5
78.2
5 3
9,94
3.65
1,7
35,2
33.9
2
Res
ults
Seg
men
t Res
ult P
rofi
t(+
)/Lo
ss(-
) 2
66,8
62.1
4 3
3,95
7.36
6
,603
.10
72,
991.
66
- 3
80,4
14.2
6 2
43,1
96.9
2 4
0,21
7.27
(
1,60
0.02
) 6
8,13
6.20
-
349
,950
.37
Una
lloca
ted
Cor
pora
te
Expe
nses
15,
580.
67
15,
580.
67
11,
118.
12
11,
118.
12
Ope
rati
ng P
rofi
t 2
66,8
62.1
4 3
3,95
7.36
6
,603
.10
72,
991.
66
(15
,580
.67)
364
,833
.59
243
,196
.92
40,
217.
27
(1,
600.
02)
68,
136.
20
(11
,118
.12)
338
,832
.25
Inte
rest
Exp
ense
s 6
,587
.18
6,5
87.1
8 4
,850
.40
4,8
50.4
0
Inte
rest
/Div
iden
d In
com
e 3
5,88
7.65
3
5,88
7.65
3
3,43
9.77
3
3,43
9.77
Inco
me
Taxe
s 1
27,6
03.8
6 1
27,6
03.8
6 1
27,5
19.0
2 1
27,5
19.0
2
Pro
fit f
rom
Ord
inar
y A
ctiv
itie
s 2
66,8
62.1
4 3
3,95
7.36
6
,603
.10
72,
991.
66
(113
,884
.06)
266
,530
.20
243
,196
.92
40,
217.
27
(1,
600.
02)
68,
136.
20
(110
,047
.77)
239
,902
.60
Extr
aord
inar
y G
ain
-
Net
Pro
fit
266
,862
.14
33,
957.
36
6,6
03.1
0 7
2,99
1.66
(1
13,8
84.0
6) 2
66,5
30.2
0 2
43,1
96.9
2 4
0,21
7.27
(
1,60
0.02
) 6
8,13
6.20
(1
10,0
47.7
7) 2
39,9
02.6
0
Oth
er I
nfor
mat
ion
Seg
men
t A
sset
s 9
41,1
00.5
3 4
69,1
70.1
2 3
77,3
93.2
4 9
42,9
86.9
2 -
2,7
30,6
50.8
1 8
43,1
20.6
5 4
10,7
09.2
3 2
54,9
79.8
5 5
94,0
95.2
8 -
2,10
2,90
5.01
Una
lloca
ted
Cor
pora
te A
sset
s 5
18,4
57.1
6 5
18,4
57.1
6 4
31,6
68.3
6 4
31,6
68.3
6
Tota
l Ass
ets
941
,100
.53
469
,170
.12
377
,393
.24
942
,986
.92
518
,457
.16
3,2
49,1
07.9
7 8
43,1
20.6
5 4
10,7
09.2
3 2
54,9
79.8
5 5
94,0
95.2
8 4
31,6
68.3
6 2
,534
,573
.37
Seg
men
t Li
abili
ties
325
,744
.15
101
,389
.08
299
,210
.81
474
,171
.17
- 1
,200
,515
.21
291
,247
.23
100
,824
.29
184
,961
.53
182
,509
.89
- 7
59,5
42.9
4
Una
lloca
ted
Cor
pora
te L
iabi
litie
s 3
27,0
82.9
0 3
27,0
82.9
0 2
49,7
50.3
8 2
49,7
50.3
8
Tota
l Lia
bilit
ies
325
,744
.15
101
,389
.08
299
,210
.81
474
,171
.17
327
,082
.90
1,5
27,5
98.1
1 2
91,2
47.2
3 1
00,8
24.2
9 1
84,9
61.5
3 1
82,5
09.8
9 2
49,7
50.3
8 1
,009
,293
.32
Cap
ital
Exp
endi
ture
151
,060
.11
137
,423
.11
19,
205.
29
214
,888
.69
34,
257.
28
556
,834
.48
177
,525
.61
91,
283.
07
28,
079.
41
73,
537.
67
42,
819.
52
413
,245
.28
Dep
reci
atio
n* 8
7,19
4.91
2
1,32
6.18
7
,063
.03
48,
742.
40
1,5
61.2
9 1
65,8
87.8
1 6
6,55
0.20
1
6,39
3.35
6
,140
.16
27,
367.
22
1,2
44.4
2 1
17,6
95.3
5
Oth
er N
on-c
ash
Expe
nses
1,5
95.1
7 6
45.8
5 1
64.5
4 8
,210
.01
(52
.55)
10,
563.
02
10,
138.
48
8,6
94.1
5 9
2.42
2
,912
.30
406
.22
22,
243.
57
2013-1
4
Part
icu
lars
In I
nd
iaIn
In
dia
E&
PE
&P
Off
sh
ore
Off
sh
ore
On
sh
ore
On
sh
ore
Re
fin
ing
Re
fin
ing
2012-1
3
Ou
tsid
eIn
dia
Ou
tsid
eIn
dia
Un
allo
cate
dU
nallo
cate
dG
ran
d
Tota
lG
ran
d
Tota
l
* A
lso
In
clu
des
Dep
letio
n,A
mo
rtiz
atio
n a
nd
Im
pair
men
t Lo
ss.
39.1
T
he
Co
nso
lid
ate
d S
eg
me
nt
Info
rmati
on
as p
er
Acco
un
tin
g S
tan
dard
AS
-17 f
or
the
Co
mp
an
y is g
ive
n b
elo
w :
39
D
isclo
su
re u
nd
er
Acco
un
tin
g S
tan
dard
-17 o
n "
Se
gm
en
t R
ep
ort
ing
”Annual Report 2013-14

40.2 Key Management Personnel:
298
Sl No. Whole-time Functional Directors:
A Parent Company
i) Shri. D K Sarraf, Chairman and Managing Director from 01.03.2014.
ii) Shri. K.S. Jamestin
iii) Shri. A K Banerjee
iv) Shri. Shashi Shankar
v) Shri. N K Verma
vi) Shri. T K Sengupta from 01.02.2014
vii) Shri. Sudhir Vasudeva, Chairman and Managing Director up to 28.02.2014.
viii) Shri. P K Borthakur, up to 31.01.2014.
B Subsidiaries and Joint Ventures
i) Shri. D K Sarraf, Managing Director , OVL (up to 28.02.2014)
ii) Shri. S P Garg, Director (Finance)& Managing Director, OVL
iii) Shri. S Bhattacharya, Director (Operations) OVL
th iv) Shri. Anil Bhandari, Director (Exploration) from 6 March, 2014
v) Shri. P. P. Upadhya, Managing Director , MRPL
vi) Shri. Vishnu Agarwal, Director (Finance), MRPL
vii) Shri. V.G.Joshi, Director (Refinery), MRPL from 04.04.2013
viii) Ir. A R Baron Mackay Holding B.V., Director, ONGC Nile Ganga B.V.
ix) Mr. Costas Christoforou, Director, Imperial Energy Limited
x) Ms. Arlene Nahikian, Director, Imperial Energy Limited
xi) Ms. K. Antoniadou, Director, Imperial Energy Limited
xii) Ms. E. Chrysanthou, Director, Imperial Energy Limited
xiii) Mr. A. Loizou, Director, Imperial Energy Limited
xiv) Mr. Roland Göransson, Director, Carabobo One AB
xv) Mr. Richard Chindt, Director, Carabobo One AB
xvi) Dr. A.K. Balyan, (Managing Director & CEO), PLL
xvii) Shri. R K Garg, Director - Finance, PLL
xviii) Shri. Rajendra Singh, Director(Technical), PLL
xix) Shri. Rajiv Banga, Managing Director & CEO, MSEZ
xx) Shri. Anil Khurana, Managing Director, PMHBL
xxi) Shri. Sudhindra Kumar Dube, Managing Director, OTPC
xxii) Dr. P. S. V. Rao, CEO, OPaL
Sale of Products toa) Shell MRPL Aviation Fuels & Services Pvt. Limited 5,877.10 4,022.24b) ONGC Mangalore Petrochemicals Ltd 2,564.58 -c) ONGC Tripura Power Co. limited 1236.49 184.79
Services Received from :a) ONGC Teri Biotech Ltd 112.42 182.34b) Dahej SEZ Ltd. 9.12 9.33c) ONGC Mangalore Petrochemicals Ltd. 1.01 1.03d) Petronet MHB Ltd 62.57 -e) Mangalore SEZ Ltd. 13.68 1.42f) Petronet LNG Ltd - 0.78
Services Provided to :a) ONGC Petro-additions Ltd. 117.63 117.50b) ONGC Teri Biotech Limited 0.12 -c) Mangalore SEZ Ltd. - 5.80d) ONGC Tripura Power Co. Ltd. 235.96 220.35e) ONGC Mangalore Petrochemicals Limited 7.16 11.75f) Petronet MHBLtd 29.18 -g) Petronet LNG Ltd - 1.32h) Shell MRPL Aviation Fuels & Services Pvt. Limited 0.33 0.29
Advance against Equity during year :a) ONGC Petro-addition Ltd 6,985.60 -b) Dahej SEZ Ltd - -c) ONGC Tripura Power Co. Limited 2,925.10 103.32
Dividend Incomea) Petronet LNG Limited 234.38 234.38b) Shell MRPL Aviation Fuels & Services Pvt. Limited 12.00 -
Amount Receivable : a) ONGC Petro-additions Limited 54.69 42.96b) ONGC Tripura Power Co. Ltd 373.80 -c) Mangalam Retail Services Limited - 0.05d) Mangalore SEZ Ltd. 119.37 134.19e) ONGC Mangalore Petrochemicals Limited 685.32 17.42f) Shell MRPL Aviation Fuels & Services Pvt. Limited 622.96 406.91g) Petronet MHBLtd 6.59 -
Amount Payable : a) ONGC Teri Biotech Ltd 51.55 115.98b) Petronet MHBLtd - 1.83c) Dahej SEZ Ltd. 7.54 7.00d) ONGC Tripura Power Co. Ltd 0.02 -e) Mangalore SEZ Ltd 0.09 -
Advance against Equity outstanding :a) ONGC Petro-addition Limited 6709.24 3,328.69b) ONGC Tripura Power Co. Ltd 2925.10 -c) ONGC Mangalore Petrochemicals Ltd. 9,799.76 9,799.76d) Mangalam Retail Services Ltd 0.50 0.50
2013-14 2012-13
(` in million)
40.3 Details of Transactions40.3.1 Joint Ventures/ Jointly Controlled Entities :
Details
40.3.2 Key Management PersonnelRemuneration Paid to Key Management Personnel ` 69.08 million (previous year ` 70.86 million).
299
Annual Report 2013-14
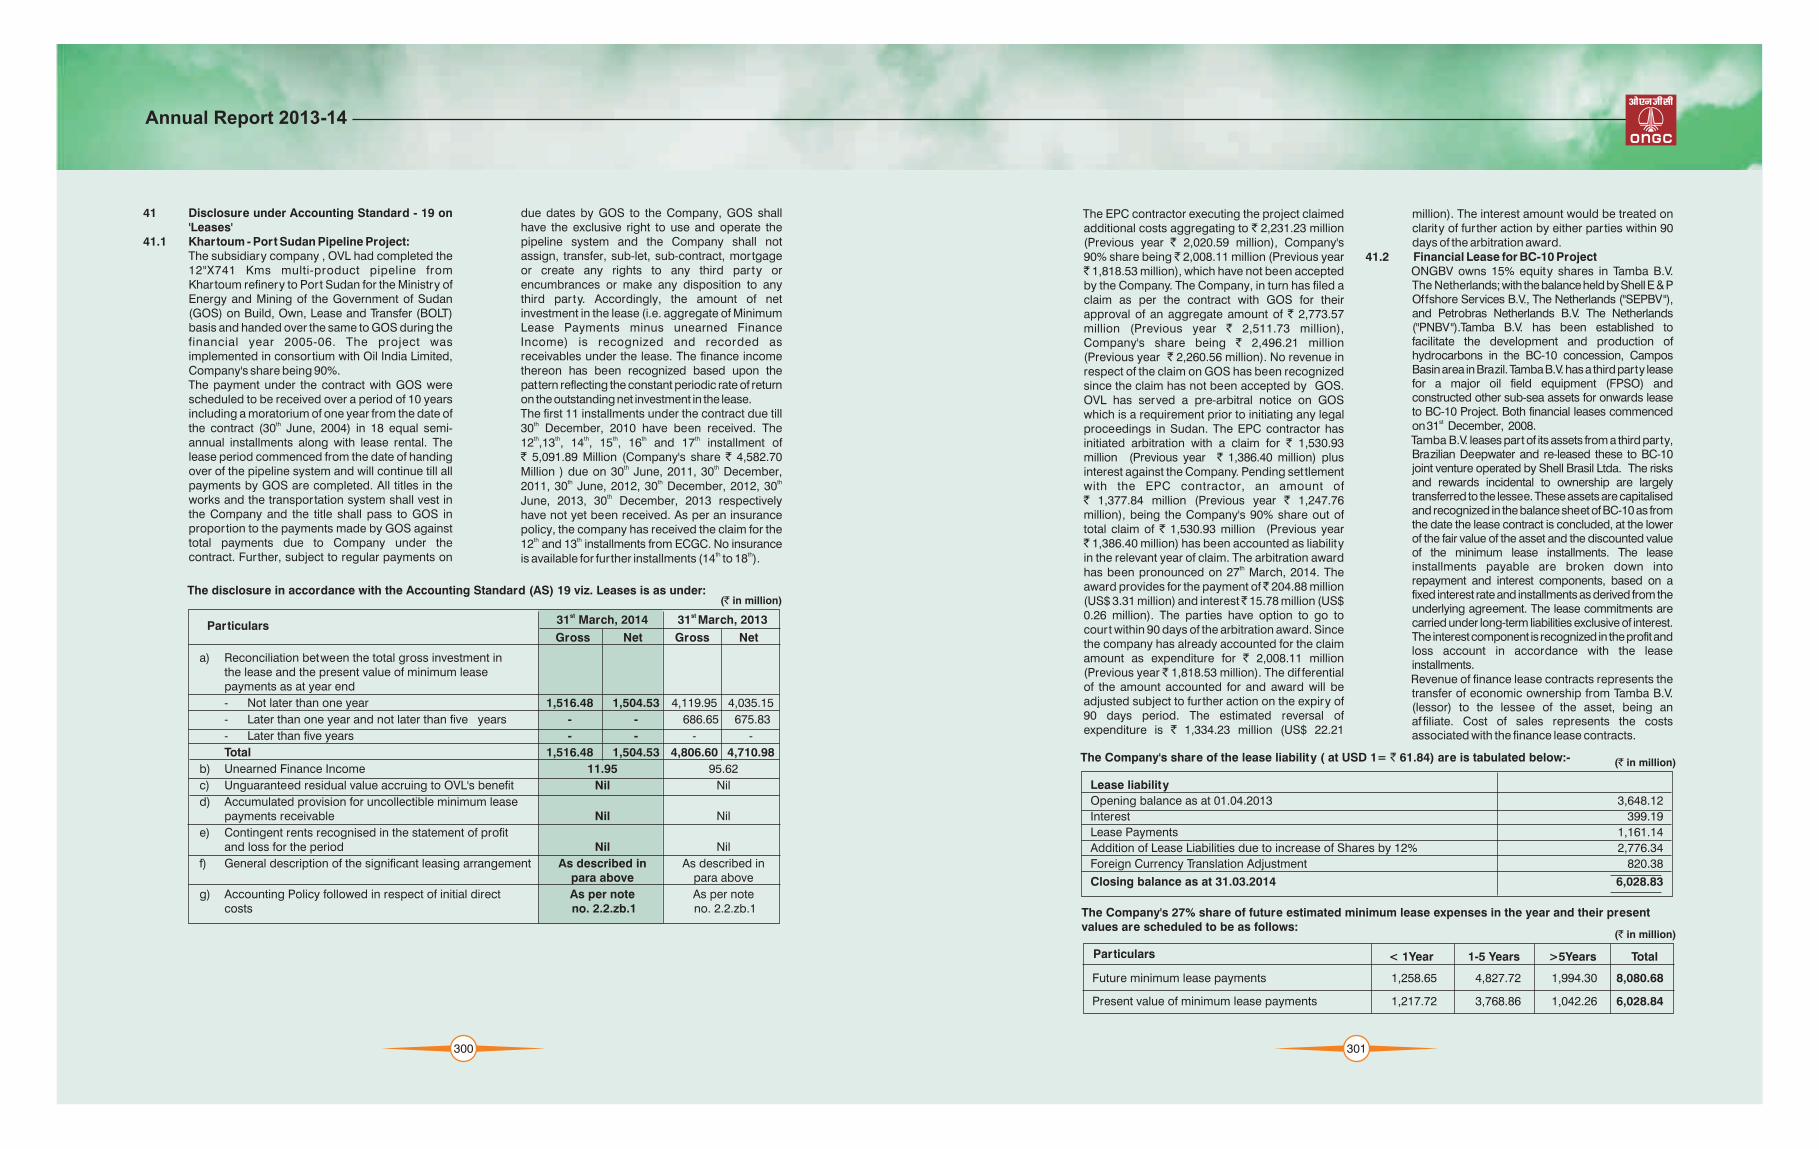
41 Disclosure under Accounting Standard - 19 on 'Leases'
41.1 Khartoum - Port Sudan Pipeline Project:The subsidiary company , OVL had completed the 12"X741 Kms multi-product pipeline from Khartoum refinery to Port Sudan for the Ministry of Energy and Mining of the Government of Sudan (GOS) on Build, Own, Lease and Transfer (BOLT) basis and handed over the same to GOS during the financial year 2005-06. The project was implemented in consortium with Oil India Limited, Company's share being 90%. The payment under the contract with GOS were scheduled to be received over a period of 10 years including a moratorium of one year from the date of
ththe contract (30 June, 2004) in 18 equal semi-annual installments along with lease rental. The lease period commenced from the date of handing over of the pipeline system and will continue till all payments by GOS are completed. All titles in the works and the transportation system shall vest in the Company and the title shall pass to GOS in proportion to the payments made by GOS against total payments due to Company under the contract. Further, subject to regular payments on
due dates by GOS to the Company, GOS shall have the exclusive right to use and operate the pipeline system and the Company shall not assign, transfer, sub-let, sub-contract, mortgage or create any rights to any third party or encumbrances or make any disposition to any third party. Accordingly, the amount of net investment in the lease (i.e. aggregate of Minimum Lease Payments minus unearned Finance Income) is recognized and recorded as receivables under the lease. The finance income thereon has been recognized based upon the pattern reflecting the constant periodic rate of return on the outstanding net investment in the lease.The first 11 installments under the contract due till
th30 December, 2010 have been received. The th th th th th th12 ,13 , 14 , 15 , 16 and 17 installment of
` 5,091.89 Million (Company's share ` 4,582.70 th thMillion ) due on 30 June, 2011, 30 December,
th th th2011, 30 June, 2012, 30 December, 2012, 30 thJune, 2013, 30 December, 2013 respectively
have not yet been received. As per an insurance policy, the company has received the claim for the
th th12 and 13 installments from ECGC. No insurance th this available for further installments (14 to 18 ).
a) Reconciliation between the total gross investment inthe lease and the present value of minimum leasepayments as at year end
- Not later than one year 1,516.48 1,504.53 4,119.95 4,035.15
- Later than one year and not later than five years - - 686.65 675.83
- Later than five years - - - -
Total 1,516.48 1,504.53 4,806.60 4,710.98
b) Unearned Finance Income 11.95 95.62
c) Unguaranteed residual value accruing to OVL's benefit Nil Nil
d) Accumulated provision for uncollectible minimum leasepayments receivable Nil Nil
e) Contingent rents recognised in the statement of profitand loss for the period Nil Nil
f) General description of the significant leasing arrangement As described inpara above
g) Accounting Policy followed in respect of initial directcosts no. 2.2.zb.1
As described inpara above
As per note As per note no. 2.2.zb.1
st31 March, 2014
Gross GrossNet Net
st 31 March, 2013
The disclosure in accordance with the Accounting Standard (AS) 19 viz. Leases is as under:(` in million)
Particulars
300
The EPC contractor executing the project claimed additional costs aggregating to ` 2,231.23 million (Previous year ` 2,020.59 million), Company's 90% share being 2,008.11 million (Previous year` 1,818.53 million), which have not been accepted by the Company. The Company, in turn has filed a claim as per the contract with GOS for their approval of an aggregate amount of ` 2,773.57 million (Previous year ` 2,511.73 million), Company's share being ` 2,496.21 million (Previous year ` 2,260.56 million). No revenue in respect of the claim on GOS has been recognized since the claim has not been accepted by GOS. OVL has served a pre-arbitral notice on GOS which is a requirement prior to initiating any legal proceedings in Sudan. The EPC contractor has initiated arbitration with a claim for ` 1,530.93 million (Previous year ` 1,386.40 million) plus interest against the Company. Pending set tlement with the EPC contractor, an amount of` 1,377.84 million (Previous year ` 1,247.76 million), being the Company's 90% share out of total claim of ` 1,530.93 million (Previous year` 1,386.40 million) has been accounted as liability in the relevant year of claim. The arbitration award
thhas been pronounced on 27 March, 2014. The award provides for the payment of 204.88 million (US$ 3.31 million) and interest 15.78 million (US$ 0.26 million). The parties have option to go to court within 90 days of the arbitration award. Since the company has already accounted for the claim amount as expenditure for ` 2,008.11 million (Previous year ` 1,818.53 million). The dif ferential of the amount accounted for and award will be adjusted subject to further action on the expiry of 90 days period. The estimated reversal of expenditure is ` 1,334.23 million (US$ 22.21
million). The interest amount would be treated on clarity of further action by either parties within 90 days of the arbitration award.
41.2 Financial Lease for BC-10 ProjectONGBV owns 15% equity shares in Tamba B.V. The Netherlands; with the balance held by Shell E & P Offshore Services B.V., The Netherlands ("SEPBV"), and Petrobras Netherlands B.V. The Netherlands ("PNBV").Tamba B.V. has been established to facilitate the development and production of hydrocarbons in the BC-10 concession, Campos Basin area in Brazil. Tamba B.V. has a third party lease for a major oil field equipment (FPSO) and constructed other sub-sea assets for onwards lease to BC-10 Project. Both financial leases commenced
ston 31 December, 2008.Tamba B.V. leases part of its assets from a third party, Brazilian Deepwater and re-leased these to BC-10 joint venture operated by Shell Brasil Ltda. The risks and rewards incidental to ownership are largely transferred to the lessee. These assets are capitalised and recognized in the balance sheet of BC-10 as from the date the lease contract is concluded, at the lower of the fair value of the asset and the discounted value of the minimum lease installments. The lease installments payable are broken down into repayment and interest components, based on a fixed interest rate and installments as derived from the underlying agreement. The lease commitments are carried under long-term liabilities exclusive of interest. The interest component is recognized in the profit and loss account in accordance with the lease installments.Revenue of finance lease contracts represents the transfer of economic ownership from Tamba B.V. (lessor) to the lessee of the asset, being an af filiate. Cost of sales represents the costs associated with the finance lease contracts.
Lease liability
Opening balance as at 01.04.2013 3,648.12
Interest 399.19
Lease Payments 1,161.14
Addition of Lease Liabilities due to increase of Shares by 12% 2,776.34
Foreign Currency Translation Adjustment 820.38
Closing balance as at 31.03.2014 6,028.83
The Company's 27% share of future estimated minimum lease expenses in the year and their present values are scheduled to be as follows:
< 1Year 1-5 Years >5Years Total
Future minimum lease payments 1,258.65 4,827.72 1,994.30 8,080.68
Present value of minimum lease payments 1,217.72 3,768.86 1,042.26 6,028.84
(` in million)
(` in million)
The Company's share of the lease liability ( at USD 1= ` 61.84) are is tabulated below:-
Particulars
301
Annual Report 2013-14

Tamba B.V., JV company of ONGBV (27%) has entered into a 15-year lease contract for the supply of the FPSO with a third party. The lease contract contains priced termination options for each of the 15 years and priced extension options for the 4 years following the initial 15-year term. The Company can exercise a priced purchase option during the term of the lease. The interest rate implicit in the lease is 9.5% (Previous year 9.5%).
41.3 The company has cer tain of fice/residential premises on Operating Lease which are cancellable by giving appropriate notice as per the respective agreements. During the year 1,020.78
million (Previous year 1,011.83 million) had been paid towards cancellable Operating Lease.
41.4 The Joint venture company, OTPC, has certain of fice premises under operating lease non-cancellable agreements. The lease rental expense recognized in the Statement of Capital Work-in-
st Progress for the period ended 31 March, 2014 is` 9.24 million (previous year ` 9.24 million) as group share. Liability amounting to ` 3.73 million(previous year ` 2.79 million) as group share has been provided for rent equalization reserve till
st 31 March, 2014.
Particulars As at 31.03.2014 As at 31.03.2013
Not later than one year 11.55 9.24
Later than one year and not later than five years 43.91 46.22
Later than five years - 6.93
Total 55.46 62.39
(` in million)
42. Disclosure under Accounting Standard - 27 on Financial Reporting of Interest in Joint Ventures:
42.1 Jointly Controlled Assets in India
In respect of certain blocks, the Company's Joint Ventures (JV) with certain body corporates have entered into Production Sharing Contracts (PSCs) with GoI. Details of these blocks and JVs as on 31.03.2014 are as under:
Sl. No. Blocks Company's PI * Others Partners and their PI in the
JV/Operatorship***
A Jointly Operated JVs
1 Panna, Mukta and Tapti 40% (40%) BGEPIL 30%, RIL 30%
2 AN-DWN-2009/3 60% (60%) OIL 40%
B ONGC Operated JVs
3 CB-OS/1 Development Phase** 55.26% (55.26%) TPL 6.7%, HOEC 38.04%
4 MN-DWN-98/3** 100% (60%) (PIBBV 40%)
5 MN-OSN-2000/2 40% (40%) GAIL 20%, IOC 20%, OIL 20%
6 AA-ONN-2001/2 80% (80%) IOC 20%
7 AA-ONN-2001/3 85% (85%) OIL 15%
8 KK-DWN-2002/2 80% ( 80%) HPCL 20%
9 CY-ONN-2002/2 60% (60%) BPRL 40%
10 AA-ONN-2002/4 90% (90%) OIL 10%
11 CY-DWN-2004/3 70% (70%) GSPC 10%, HPCL 10%, GAIL 10%
12 CY-PR-DWN-2004/1 70% (70%) GSPC 10%, HPCL 10%, GAIL 10%
13 CB-ONN-2004/1** 60% (50%) GSPC 40%, (HERA-MEC LTD 10%)
14 CB-ONN-2004/2 55% (55% ) GSPC 45%
15 CB-ONN-2004/3 65% (65%) GSPC 35%
16 CY-ONN-2004/1 80% (80%) BPRL 20%
The group share in future minimum lease payments and payment profile under the non-cancelableoperating leases are as follows:
302
Sl. No. Blocks Company's PI * Others Partners and their PI in the
JV/Operatorship***
303
17 CY-ONN-2004/2 80% (80%) BPRL 20%
18 MB-OSN-2005-1 80% (80%) GSPC 20%
19 MB-OSN-2005-5 70% (70% ) GSPC 30%
28 BK-CBM-2001/1 80% (80%) IOC 20%
29 CB-ONN-2005/4 51% (51%) GSPC 49%
30 CB-ONN-2005/10 51% (51%) GSPC 49%
31 PR-ONN-2005/1 80% (80%) TPL 20%
32 WB-ONN-2005/4 75% (75%) OIL 25%
33 AA-ONN-2005/1 60% (60%) OIL 30%, ACIL -10%
34 GV-ONN-2005/3 80% (80%) TPL 20%
35 AN-DWN-2009/2 60% (60%) OIL 40%
36 AN-DWN-2009/1 70% (70%) OIL 30%
37 AN-DWN-2009/5** 100%(90%) (GSPC 10%)
38 AN-DWN-2009/13** 80% (70%) GAIL 10%, NTPC 10%, (GSPC 10%)
39 AN-DWN-2009/18 60% (60%) OIL 30%, GAIL 10%
40 GK-OSN-2009/1 40%(40%) AWEL 20%, GSPC 20%, IOC 20%
41 GK-OSN-2009/2 40%(40%) AWEL 30%, IOC 30%
42 KG-OSN-2009/1 80% (80%) APGIC 10%, NTPC 10%
43 KG-OSN-2009/2 90% (90%) APGIC 10%
44 KG-OSN-2009/4 50% (50%) APGIC 10%, OIL 30%, NTPC 10%
45 AA-ONN-2009/3 50% (50%) OIL 50%
46 CB-ONN-2009/4 50% (50%) GSPC 50%
47 GK-OSN-2010/1 60% (60%) OIL-30%, GAIL-10%
48 GK-OSN-2010/2 90% (90%) GAIL- 10%
49 CB-ONN-2010/6 80% (80%) IOC- 20%
C. Operated by JV Partners
50 Ravva 40% (40%) Cairn India (Operator) 22.5% , VIL 25%, ROPL 12.5%
51 CY-OS-90/1 (PY3) 40% (40%) HEPI (operator) 18%, HOEC 21% TPL 21%
52 RJ-ON-90/1 30% (30%) Cairn India (Operator) 35%,CEHL 35%
53 CB-OS/2 -Development Phase 50% (50%) Cairn India (operator) 40% , TPL 10%
54 CB-ON/7 -Development Phase 30% (30%) HOEC (Operator) 35%, GSPC 35%
55 CB-ON/3 - Development Phase 30% (30%) EOL (Operator)70%
56 AA-ONN-2002/3 70% (70%) OIL (Operator) 30%
57 AN-DWN-2003/2 45%(45%) ENI (Operator) 40% GAIL 15%
58 KG-ONN-2003/1 51% (51%) Cairn India 49% (Operator)
20 MB-OSN-2005-6 80% (80% ) GSPC 20%
21 KG-DWN-2005/1 70% (70% ) IOC 20%, GSPC 10%
22 KK-DWN-2005/2 90% (90%) GSPC 10%
23 KG-OSN-2005/1 60%(60% ) HMEL 20%, GSPC 20%
24 KG-OSN-2005/2 80% (80%) HMEL 20%
25 Raniganj 74% (74%) CIL 26%
26 Jharia 90% (90%) CIL 10%
27 NK-CBM-2001/1 80% (80%) IOC 20%
Annual Report 2013-14
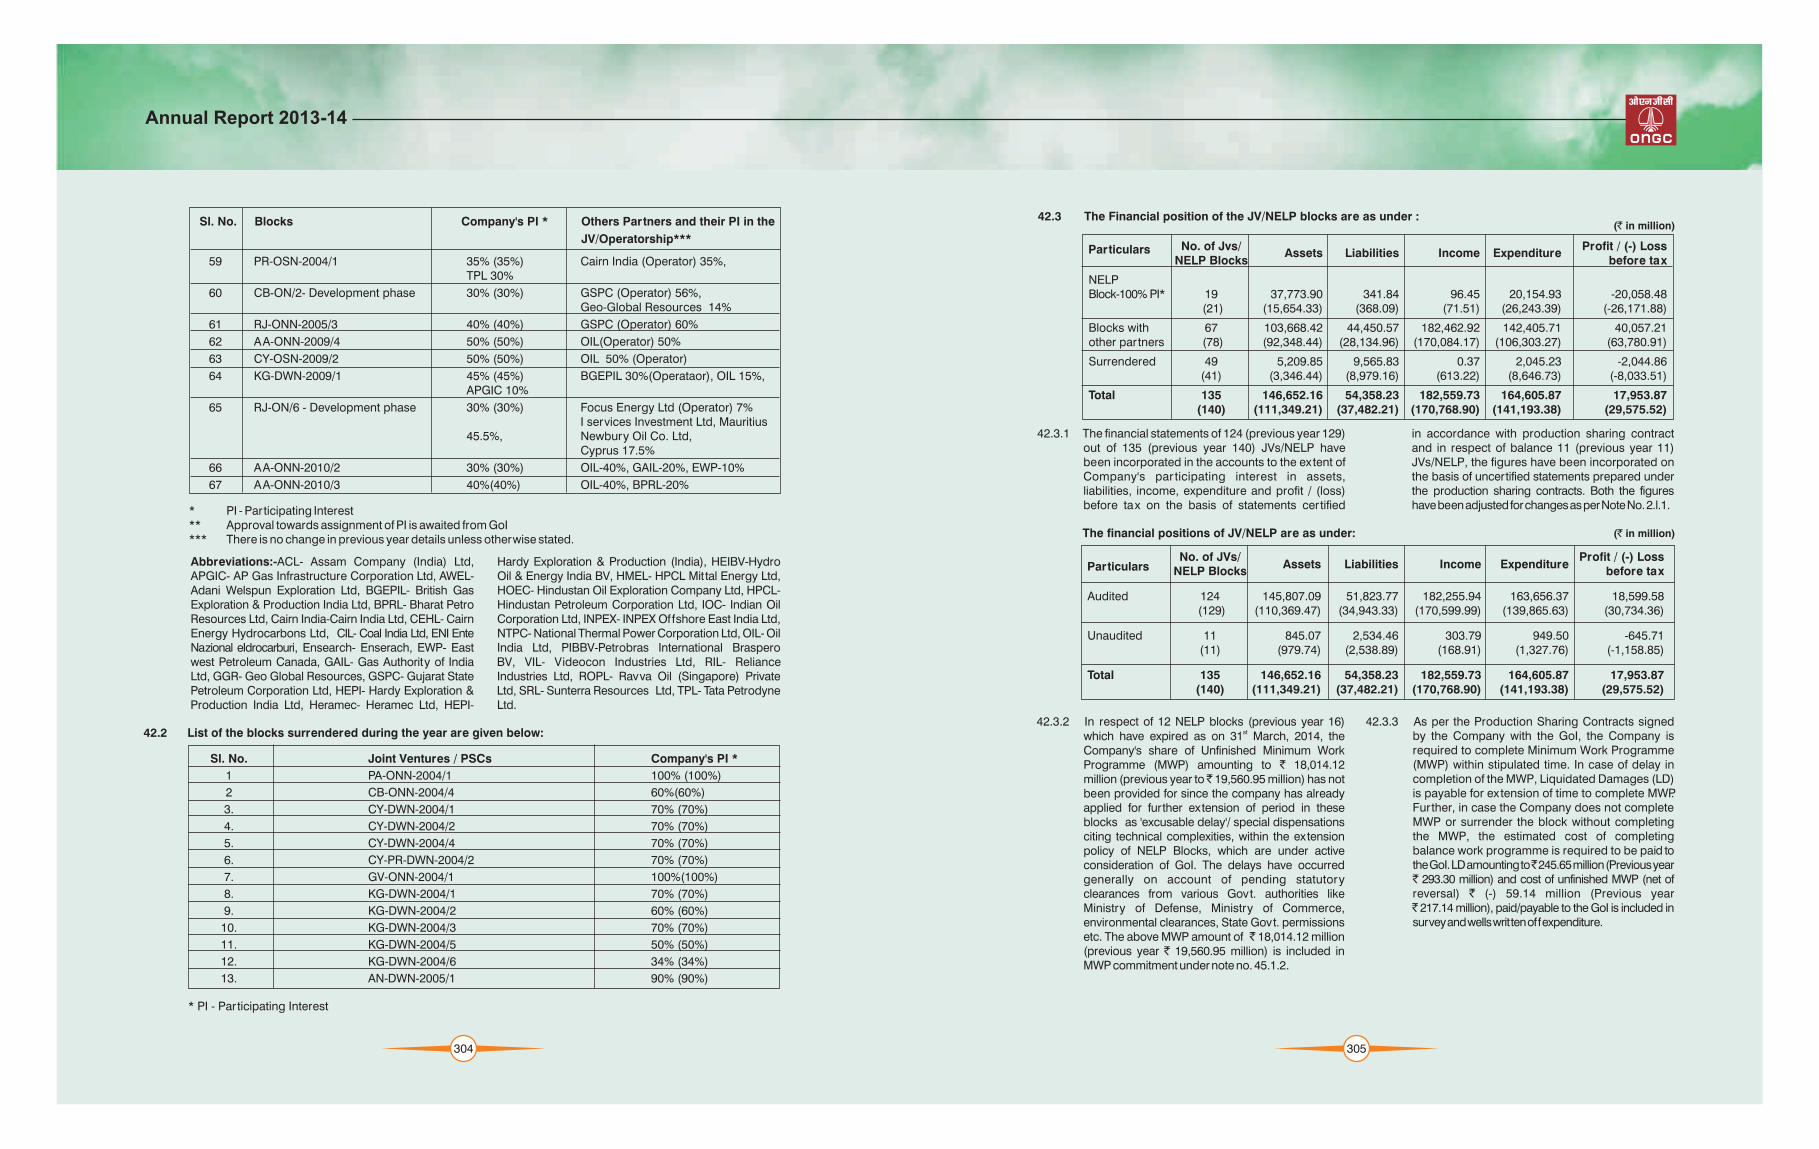
59 PR-OSN-2004/1 35% (35%) Cairn India (Operator) 35%, TPL 30%
60 CB-ON/2- Development phase 30% (30%) GSPC (Operator) 56%, Geo-Global Resources 14%
61 RJ-ONN-2005/3 40% (40%) GSPC (Operator) 60%
62 AA-ONN-2009/4 50% (50%) OIL(Operator) 50%
63 CY-OSN-2009/2 50% (50%) OIL 50% (Operator)
64 KG-DWN-2009/1 45% (45%) BGEPIL 30%(Operataor), OIL 15%,APGIC 10%
65 RJ-ON/6 - Development phase 30% (30%) Focus Energy Ltd (Operator) 7% I services Investment Ltd, Mauritius
45.5%, Newbury Oil Co. Ltd,Cyprus 17.5%
66 AA-ONN-2010/2 30% (30%) OIL-40%, GAIL-20%, EWP-10%
67 AA-ONN-2010/3 40%(40%) OIL-40%, BPRL-20%
* PI - Participating Interest** Approval towards assignment of PI is awaited from GoI*** There is no change in previous year details unless otherwise stated.
Abbreviations:-ACL- Assam Company (India) Ltd, Hardy Exploration & Production (India), HEIBV-Hydro APGIC- AP Gas Infrastructure Corporation Ltd, AWEL- Oil & Energy India BV, HMEL- HPCL Mittal Energy Ltd, Adani Welspun Exploration Ltd, BGEPIL- British Gas HOEC- Hindustan Oil Exploration Company Ltd, HPCL- Exploration & Production India Ltd, BPRL- Bharat Petro Hindustan Petroleum Corporation Ltd, IOC- Indian Oil Resources Ltd, Cairn India-Cairn India Ltd, CEHL- Cairn Corporation Ltd, INPEX- INPEX Of fshore East India Ltd, Energy Hydrocarbons Ltd, CIL- Coal India Ltd, ENI Ente NTPC- National Thermal Power Corporation Ltd, OIL- Oil Nazional eIdrocarburi, Ensearch- Enserach, EWP- East India Ltd, PIBBV-Petrobras International Brasperowest Petroleum Canada, GAIL- Gas Authority of India BV, VIL- Videocon Industries Ltd, RIL- Reliance Ltd, GGR- Geo Global Resources, GSPC- Gujarat State Industries Ltd, ROPL- Ravva Oil (Singapore) PrivatePetroleum Corporation Ltd, HEPI- Hardy Exploration & Ltd, SRL- Sunterra Resources Ltd, TPL- Tata Petrodyne Production India Ltd, Heramec- Heramec Ltd, HEPI- Ltd.
Sl. No. Joint Ventures / PSCs Company's PI *
1 PA-ONN-2004/1 100% (100%)
2 CB-ONN-2004/4 60%(60%)
3. CY-DWN-2004/1 70% (70%)
4. CY-DWN-2004/2 70% (70%)
5. CY-DWN-2004/4 70% (70%)
6. CY-PR-DWN-2004/2 70% (70%)
7. GV-ONN-2004/1 100%(100%)
8. KG-DWN-2004/1 70% (70%)
9. KG-DWN-2004/2 60% (60%)
10. KG-DWN-2004/3 70% (70%)
11. KG-DWN-2004/5 50% (50%)
12. KG-DWN-2004/6 34% (34%)
13. AN-DWN-2005/1 90% (90%)
* PI - Participating Interest
Sl. No. Blocks Company's PI * Others Partners and their PI in the
JV/Operatorship***
304
42.2 List of the blocks surrendered during the year are given below:
42.3 The Financial position of the JV/NELP blocks are as under :(` in million)
(` in million)
No. of Jvs/Assets Liabilities Income Expenditure
NELP Blocks before tax
NELPBlock-100% PI* 19
(21) (15,654.33) (368.09) (71.51) (26,243.39) (-26,171.88)
67 (78) (92,348.44) (28,134.96) (170,084.17) (106,303.27) (63,780.91)
Surrendered 49 (41)
Total 135(140) (111,349.21) (37,482.21) (170,768.90) (141,193.38) (29,575.52)
Profit / (-) Loss
37,773.90 341.84 96.45 20,154.93 -20,058.48
Blocks with 103,668.42 44,450.57 182,462.92 142,405.71 40,057.21other partners
5,209.85 9,565.83 0.37 2,045.23 -2,044.86(3,346.44) (8,979.16) (613.22) (8,646.73) (-8,033.51)
146,652.16 54,358.23 182,559.73 164,605.87 17,953.87
No. of JVs/NELP Blocks before tax
Profit / (-) LossAssets Liabilities Income Expenditure
Audited 124 145,807.09 51,823.77 182,255.94 163,656.37 18,599.58 (129) (110,369.47) (34,943.33) (170,599.99) (139,865.63) (30,734.36)
Unaudited 11 845.07 2,534.46 303.79 949.50 -645.71(11) (979.74) (2,538.89) (168.91) (1,327.76) (-1,158.85)
Total 135 146,652.16 54,358.23 182,559.73 164,605.87 17,953.87(140) (111,349.21) (37,482.21) (170,768.90) (141,193.38) (29,575.52)
42.3.1 The financial statements of 124 (previous year 129) out of 135 (previous year 140) JVs/NELP have been incorporated in the accounts to the extent of Company's par ticipating interest in assets, liabilities, income, expenditure and profit / (loss) before tax on the basis of statements certified
in accordance with production sharing contract and in respect of balance 11 (previous year 11) JVs/NELP, the figures have been incorporated on the basis of uncertified statements prepared under the production sharing contracts. Both the figures have been adjusted for changes as per Note No. 2.l.1.
42.3.2 In respect of 12 NELP blocks (previous year 16) stwhich have expired as on 31 March, 2014, the
Company's share of Unfinished Minimum Work Programme (MWP) amounting to ` 18,014.12 million (previous year to 19,560.95 million) has not been provided for since the company has already applied for further extension of period in these blocks as 'excusable delay'/ special dispensations citing technical complexities, within the extension policy of NELP Blocks, which are under active consideration of GoI. The delays have occurred generally on account of pending statutory clearances from various Govt. authorities like Ministry of Defense, Ministry of Commerce, environmental clearances, State Govt. permissions etc. The above MWP amount of 18,014.12 million (previous year ` 19,560.95 million) is included in MWP commitment under note no. 45.1.2.
42.3.3 As per the Production Sharing Contracts signed by the Company with the GoI, the Company is required to complete Minimum Work Programme (MWP) within stipulated time. In case of delay in completion of the MWP, Liquidated Damages (LD) is payable for extension of time to complete MWP. Further, in case the Company does not complete MWP or surrender the block without completing the MWP, the estimated cost of completing balance work programme is required to be paid to the GoI. LD amounting to 245.65 million (Previous year 293.30 million) and cost of unfinished MWP (net of
reversal) ` (-) 59.14 million (Previous year 217.14 million), paid/payable to the GoI is included in
survey and wells written off expenditure.
The financial positions of JV/NELP are as under:
Particulars
Particulars
305
Annual Report 2013-14

British Gas has agreed to pay a lump sum amount of the above blocks. Since the government approval in USD 50 Million, towards full and final set tlement of respect of MN DWN 2002/2 is pending, no adjustment carry costs/cash calls due in all the above blocks, is made in the accounts towards the lump sum amount subject to government approval for transfer of PI in all due as above.
42.4 Company's share in Joint Ventures (Outside India) through Subsidiary - OVL
Sl.No. participating
share (%)
1 Block 06.1 Vietnam, Of fshore 45% TNK VietnamB.V. -35%Petrovietnam - 20% production
2 Block 2a, 2b & 4, GNPOC.Sudan, Onshore (ThroughONGC Nile Ganga B.V.)Onshore
3 Block 1a, 1b, & 4, GPOCSouth Sudan, Onshore (Through ONGC Nile GangaB.V.)Onshore
4 Block 5A South Sudan, Onshore
shutdown due to securi tysituation.
5 Sakhalin -1 Project,Russia, Of fshore SODECO - 30%
SMNG - 11.5%R N Astra - 8.5%
6 AFPC Project Syria, Onshore (Through ONGC Nile GangaB.V.) *
7 MECL Colombia, Onshore (Through ONGC AmazonAlaknanda Limited)
8 Block BC-10 Brazil, Of fshore (Through ONGC NileGanga B.V.)**
9 OOO Imperial Frac Service (Through Imperial Energy Ltd)
10 San Cristobal ProjectVenezuela, Onshore (Through ONGC Nile GangaB.V.)
Name of the Project and Company's Other Operator Status Country of Operation Consortium
Members
TNK Vietnam The project is underB.V. development and
25% CNPC - 40% Joint The project is under Petronas - 30% Operatorship production. Sudapet - 5% (GNPOC)
25% CNPC - 40% Joint The project is underPetronas - 30% Operatorship production. CurrentlyNilepet - 5% (GPOC) under temporary shutdown
due to securi ty si tuation
24.125% Petronas - 67.875% Joint The project is underNilepet - 8% Operatorship development and
(SPOC) production. Currentlyunder temporary
20% ENL - 30% ENL The project is under development and production
38.75% Fulin - 50% SSPD * The project is underMit tals - 11.25% production.
50% Sinopec - 50% Joint The project is underOperatorship exploration, development
and production
27% Shell - 73% Shell The project is underdevelopment andproduction
50% Mr. Vladimir OVL The companyAleksandrovich provides FraccingBorisov - 50% Services
40% CVP- 60% Joint The project is underOperatorship development and
production
306
Name of the Block PI Date of Transfer of PI
KG OSN 2004/1 45% 25.11.2011
KG DWN 98/4 30% 18.05.2011
MN DWN 2002/2 25% 01.12.2011
42.3.4 The company had acquired Participating Interest (PI) (BGEPIL) in the following blocks, ef fective from the of British Gas Exploration & Production India Ltd following dates as approved by the board of directors.
307
Sl.No. participating
share (%)
Name of the Project and Company's Other Operator Status Country of Operation Consortium
Members
11 Block A-1 Myanmar, Of fshore 17% Daewoo - 51% Daewoo The project isMOGE- 15% under production.KOGAS - 8.5%GAIL - 8.5%
12 Block A-3 Myanmar, Of fshore 17% Daewoo - 51% Daewoo The project is underKOGAS - 8.5% production.GAIL - 8.5%MOGE- 15%
13 Farsi Block Project Iran, Of fshore 40% IOC - 40% OVL The project 's explorationOIL - 20% period ended on 24 June
2009. Agreement on MDPand Development servicecontract is pending.
14 Block X XIV Syria, Onshore 60% IPRMEL - 25% IPR MEL IPRMEL the OperatorTriocean-15% declared Force Majeure
ef fective 29 April 2012
15 Khar toum-Por t Sudan Pipeline 90% OIL - 10% OVL The pipeline has beenProject Sudan, Onshore completed and is under
lease.
16 Block RC-8 Colombia, Of fshore 40% Ecopetrol - 40% OVL The project is underPetrobras - 20% exploration
17 Block RC-9 Colombia, Of fshore 50% Ecopetrol - 50% Ecopetrol The project is underexploration
18 Block RC-10 Colombia, Of fshore 50% Ecopetrol - 50% OVL The project is underexploration
19 Block BM-SEAL-4,Brazil, 25% Petrobras- 75% Petrobras The project is underOf fshore (Through ONGC Nile explorationGanga B.V)
20 LLA - 69 (Through MECL) 50% SINOPEC- 50% Joint The project is underOperatorship exploration
21 Block SSJN-7 Colombia, 50% Pacific - 50% Pacific The project is under Onshore exploration
22 Block CPO-5 Colombia, Onshore 70% Petro Dorado - 30% OVL The project is underexploration
23 SHWE Offshore Pipeline Project, 17% Daewoo - 51% Daewoo Pipeline is completed andMyanmar, Of fshore KOGAS - 8.5% transpor tation of Block
GAIL - 8.5% Myanmar A1/A3 GasMOGE - 15%
24 Onshore Gas Pipeline Project 8.35% CNPC-SEAP- 50.9% CNPC-SEAP The project is under(SEAGPCL), Myanmar, Onshore Daewoo - 25.04% operation.(Through ONGC Nile Ganga KOGAS- 4.17%B.V.) GAIL - 4.17%
MOGE - 7.37%
25 Carabobo Project, Venezuela 11% CVP - 60% Joint The project is underOnshore (Through Carabobo Petronas Ve-11% operatorship development andOne AB) Repsol Exp-11% production.
INDOIL-7%
26 Satpayev Contract Area 3575, 25% KMG - 75% SOLLP The project is underKazakhstan, Of fshore Exploration
Annual Report 2013-14

Sl.No. participating
share (%)
Name of the Project and Company's Other Operator Status Country of Operation Consortium
Members
27 Azeri, Chirag, Guneshli fields 2.72% BP - 35.79% BP The project is underAzerbaijan, Of fshore SOCAR - 11.65% development and
Chevron - 11.27% productionInpex - 10.96%Statoil - 8.56%Ex xon-Mobil - 8.00%TPAO - 6.75%Itochu - 4.30%
28 BTC Pipeline Azerbaijan, 2.36% BP - 30.1% BP The project is underOnshore (Through ONGC SOCAR - 25% operation(BTC)) Chevron - 8.9%
Statoil - 8.71%TPAO - 6.53%Eni - 5% Total - 5%Itochu - 3.40%Inpex - 2.5%Conoco Philips -2.5%
29 Area 1 of fshore Block, 16.00% Anadarko- 26.5% Anadarko The project is underMozambique*** Mitsui-20% development
PTTEP-8.5%BPRL-10%OIL-4%ENH-15%
30 Block SS 04, Bangladesh 45.00% OIL-45% OVL The project is underof fshore BAPEX-10% exploration
31 Block SS 09, Bangladesh 45.00% OIL-45% OVL The project is underof fshore BAPEX-10% exploration
Abbreviations used: CNPC - China National Petroleum Sakhalinmornef tegas Shelf; SODECO - Sakhalin Oil Corporation; CNPC-SEAP-CNPC South-East Asia Development Company Limited; SOLLP - Satpayev Pipeline Co Ltd; CVP - CorporacionVenezolana Del Operating Company LLP (100% subsidiary of KMG); Petroleo S.A.; Daewoo - Daewoo International SSPD: Syria Shell Petroleum Development B.V.; Sudapet Corporation; ENL - Exxon Nef tegas Limited; Fulin - Fulin - Sudapet Limited; Triocean: Tri-Ocean Mediterranean; Investments Sarl; GAIL - GAIL (India) Limited; GNPOC - SOCAR: State Oil Company of Azerbaijan Republic; TPAO - Greater Nile Petroleum operating Company; GPOC - Turkish Petroleum Corporation; BREML - Beas Rovuma Greater Pioneer Operating Company; SPOC - Sudd Energy Mozambique Ltd; ENH - Empresa Nacional De Petroleum Operating Company;IOC - Indian Oil Hidrocarbonates, E.P.Corporation Limited; INDOIL- Indoil Netherlands B.V.; # Ovl holds 60% shares in BREMLIPRMEL - IPR Mediterranean Exploration Limited; KMG * OVL has ef fectively 38.75% interest in Himalaya Energy KazMunayGas; KOGAS - Korea Gas Corporation; B.V; Syria B.V. (HESBV) with Mit tals and Fulin ef fectively Mit tals - Mit tal Investments Sarl; MOGE- Myanmar Oil holding 11.25% and 50% interest respectively. HESBV, and Gas Enterprise; Nilepet - Nilepet Limited, South through its subsidiaries, holds 33.33%, 37.5% and 36% Sudan; OCL - ONGC Campos Ltda.. OIL - Oil India interest in Ash Sham (including deep and lateral) Limited; Pacific - Pacific Stratus Energy, Colombia; concession, Deir-Ez-Zor and Annexure-IV (including Petrobras - PetroleoBrasileiro S.A.; Petro-Dorado - Petro- deep and lateral) concessions and a gas utilization Dorado South America S.A.; Petronas - Petronas Carigali agreement in Syria; the balance interest in the Overseas Sdn Bhd; PetronasVe: PC Venezuela Ltd; concessions being held by SSPD- the Operator.Petrovietnam - Vietnam Oil and Gas Group; Repsol - **In case of Block BC-10 Brazil, Of fshore additional 12%
thRepsol YPF Cuba SA; Repsol Exp- Repsol Exploracion stake was acquired on 30 December, 2013.S.A.; SEAGPCL - South East Asia Gas Pipeline Company ***In case of Area 1 of fshore Block, Mozambique, 10% is Ltd.; Shell - Shell Brazil Ltda; Sinopec - Sinopec directly held by ONGC Videsh Ltd. and 6% through O v e r s e a s O i l a n d G a s L i m i t e d ; S M N G - subsidiary BREML.
308
42.5 Company's share in Joint VenturesThe Company, its Subsidiaries' and the Joint Venture Company's share of assets, liabilities, income and expenses in the Joint Ventures as furnished by the Operator has been incorporated in the financial statements as given below:
(` in million)
Project Asset Liabilities Income Expenditure*(Including Loss
depreciation)stA. Audited as of 31 March, 2014
Block 06.1, Vietnam 10,194.97 1,571.18 8,951.34 5,698.91 3,252.43
Farsi Block, Iran (0.30) 62.23 0.24 12.59 (12.35)
Sudan Pipeline,
OVL's Share (90%) 689.96 4,618.35 93.21 3,372.35 (3,279.14)
LLC Imperial Frac Service-Jarpeno 310.96 11.22 465.95 332.51 133.44
Block 2a, 2b & 4, Sudan 24,736.09 5,967.80 31,872.39 25,491.99 6,380.40
Block 1a, 1b, & 4, South Sudan 6,785.99 1,032.52 8,752.55 6,395.05 2,357.50
Block BC-10 & Exploratory Blocks, Brazil 73,934.48 37,064.75 14,853.02 12,764.99 2,088.03
PIVSA (San Cristobal), Venezuela 22,570.80 38,054.57 27,615.66 17,070.72 10,544.94
Pipeco 1 onshore Project, Myanmar(SEAGP) 5,923.11 681.28 403.30 413.40 (10.10)
Tamba B.V. 26,685.63 7,653.40 7,373.96 5,363.00 2,010.96
AFPC, Syria 5,166.20 742.90 - 202.82 (202.82)
MECL, Colombia 27,344.03 4,916.66 20,104.51 10,143.26 9,961.25
Petro Carabobo, Venezuela** 11,641.94 2,078.81 699.71 851.77 (152.06)
BREML, Mozambique 16,776.06 2,666.60 - 29.00 (29.00)
Total (A) 232,759.93 107,122.28 121,185.84 88,142.36 33,043.48 stB. Audited as of 31 December, 2013
Sakhalin 1 Russia 169,247.67 46,714.49 69,417.10 32,601.99 36,815.11
Block RC-8, Colombia (0.48) 583.08 - 124.29 (124.29)
Block RC-10, Colombia 0.98 789.72 - 183.31 (183.31)
Block RC-9, Colombia 40.49 6.26 0.34 122.76 (122.42)
Blocks 25-29, & 36, Cuba 2.39 (470.59) 0.02 (70.23) 70.25
Block A-1, Myanmar 13,950.01 3,212.85 331.53 1,097.98 (766.45)
Block A-3, Myanmar 4,824.51 745.03 2,091.78 1,270.92 820.86
CPO 5 Block, Colombia 1,004.02 386.55 0.37 718.44 (718.07)
SHWE Of fshore Pipeline Myanmar 2,006.39 (35.31) 453.92 1,967.31 (1,513.39)
Total (B) 191,075.98 51,932.08 72,295.06 38,016.77 34,278.29
C. Unaudited
Block XXIV, Syria 28.68 498.93 - 403.21 (403.21)
Block GUA of fshore, Colombia 6.71 59.81 - 51.60 (51.60)
Block SSJN-7, Colombia - 7.58 0.35 56.46 (56.11)
Block 81 (1), Libya 0.03 125.96 - 0.02 (0.02)
Block Area 1, Mozambique 163,373.85 453.82 - 3.91 (3.91)
Block 128, Vietnam 165.41 286.34 - 36.66 (36.66)
Block 6 North Ramadan, Egypt - 71.49 - (2.12) 2.12
Block 5A, South Sudan 10,426.66 805.80 744.99 1,464.73 (719.74)
Block NC-188, Libya 1.89 (0.81) - 3.55 (3.55)
Block NEMED, Egypt - (2.21) - 0.07 (0.07)
Satpayev Block, Kazakhstan 4,838.79 6.83 - 740.61 (740.61)
ACG, Azerbaijan 50,274.72 262,308.30 18,480.13 5,539.22 12,940.91
Total (C) 229,116.74 264,621.84 19,225.47 8,297.92 10,927.55
Grand Total 652,952.65 423,676.20 212,706.37 134,457.05 78,249.32
Profit/(-)
before Tax
309
Annual Report 2013-14

* Represents expenditure as per joint venture statement. In the accounts of the Company, the amount is reflected af ter net ting of f as per the Accounting Standard (AS) 27 viz. Financial Reporting of interests in Joint Ventures.
** Excludes signature bonus paid by Subsidiaryand classified under capital work-in-progress
42.5.1 The OVL's share of assets, liabilities, income and expenses has been converted into the reporting currency at the average exchange rate over the period for which the details are provided by the Operators. Generally the details are provided by the operators on monthly basis except in respect of Sakhalin-1, Russia, where the details are provided by the Operator on quarterly basis.
42.5.2 Block 5A, Blocks 1,2 &4 in Republic of South Sudan
The subsidiary company, OVL has 24.125% participating interest in Block 5A, South Sudan. The project is jointly operated by the partners Petronas Carigali Nile Ltd, ONGC Videsh Limited and Nilepet, the national oil company of South Sudan..
In view of security situation due to internal conflict in the country all petroleum operation in Block 5A
ndis temporarily shut down from 22 December, 2013. However recently ceasefire agreement has been signed by the waring parties & the negotiations is under progress under the mediation of African union countries and inter government authorities on development (IGAD). All actions are taken by the partners to resume production swif tly on security clearance by the host government. In view of above there is an indication of impairment in the project & impairment test was conducted considering2 years deferment of production. Based on the impairment evaluation as per the procedure of the company in accordance with the requirement of Accounting Standard-28 (AS-28), no impairment provision is required.
42.5.3 Satpayev Block, Kazakhstan: thEf fective 12 October, 2011, the subsidiary
Company, OVL has acquired 25% Subsoil use rights from National Company JSC KazMunayGas (KMG) in the Contract for Exploration and Production of Hydrocarbon (Contract) in Satpayev Area which was signed on 15 June, 2010 between Ministry of Oil and Gas (MOG), Kazakhstan and KMG. KMG now holds subsoil use rights of 75% in the Block. The amounts paid toward initial payment and signature bonus amounting to 4,753.53 million (Previous year: 4,753.53
million) are disclosed as Capital-Work-in-Progress in Note 19, as part of acquisition cost to be treated as per the final status of the project.
` `
42.5.4 AFPC, Syria
ONGC Nile Ganga BV (ONGBV) and Fulin Investments Sarl, a subsidiary of China National Petroleum Company International (CNPCI), hold 50% shareholding each in the Dutch joint venture company, named Himalaya Energy Syria B.V. (HESBV). HES B.V. in turn through three German entities i.e. HES Sham, HES Dez and HES Gas Syria holds 33.33% to 37.5% Participating Interest (PI) in four Production Sharing Contracts (PSCs) in Syria. The Syria business for the above PSC of ONGBV is structured as separate class of business (Class C).
stEf fective 1 December 2011, Al Furat Petroleum Company (AFPC) an Operating Company jointly held by the Syria Shell Petroleum Development B.V. (SSPD) a company acting as an operator for the Contractor and HESBV (collectively the Contractor) and General Petroleum Company (GPC), Syria, which represents Government of Syria in the Operating Company, were included in the list of sanctioned enterprises by the European Union (EU) as part of the strengthening of the sanctions on Syria. Due to the sanctions, HESBV, as an EU company, has been forbidden to directly or indirectly make funds or resources available to or for the benefit of AFPC and GPC
th stOn the 16 May, 2012, the Syrian court (the 1 degree cour t) ruled in favour of "single management", provided that Contractor will be kept informed of all transactions. In addition the court considered that Contractor's share of profits should be set aside in a separate bank account. AFPC Chairman appealed for three motives (i) to challenge the above two cour t-determined measures that allows Contractor to monitor the Chairman powers; (ii) to exercise all powers required for running AFPC and solely operate the bank accounts; and to (iii) challenge the
threquirement to set aside profits. On 28 of November, 2012, the Court of appeal in Syrian Court rejected the appeal of the Chairman. As a result, the first degree court judgment became final.
As per the financials prepared by HESBV for the styear ended 31 March, 2014, ONGBV's share of
net fixed assets in HESBV is USD 40.97 million (Previous year USD 38.05 million) and net trade receivables of USD 31.01 million (Previous year USD 30.28 million). Due to the prevailing political situation in Syria and the EU sanction, this Cash Generating Unit (CGU), including the above mentioned assets and receivables was tested for impairment by comparing the carrying value with
stthe recoverable value as on 31 March, 2014. No
310
impairment provision was required in view of the recoverable value being higher than the carrying value. Although there is no production due to Force Majeure, a provision towards depletion amounting to USD 3.99 million (` 241.72 million) has been made based on the estimated % of depletion for previous year.
42.5.5 Blocks SS-04 & SS-09, Bangladesh:
The subsidiary company, OVL in consor tium with Oil India Ltd. (OIL) was awarded two shallow water Blocks SS-04 and SS-09 located in the of fshore area in People's Republic of Bangladesh on
th20 August, 2013 and the Production Sharing Contracts (PSCs) of the Blocks were signed by Government of People's Republic of Bangladesh represented by Ministry of Power, Energy and Mineral Resources, Bangladesh Oil andGas & Mineral Corporation (PETROBANGLA), consortium of OVL & OIL and Bangladesh Petroleum Exploration and Production Company
thLimited (BAPEX) on 17 February, 2014. PSCs envisage the exploration, appraisal, development and production of petroleum in contract area of the Blocks SS-04 and SS-09 measuring 7,269 square kilometers and 7,026 square kilometers respectively. The exploration term consists of 8 (eight) consecutive contract years comprising 5 (five) years as Initial exploration term and 3 (three) years as Subsequent exploration term. OVL will act as the Operator of the Blocks and has PI of 45%, OIL holds 45% PI and BAPEX 10% PI. BAPEX's 10% PI shall be carried by OVL and OIL in proportion to their respective interests in respect of all expenditure up to the date of first commercial discovery and shall be re-paid from the first available cost recover Petroleum.
.42.5.6 ACG Abandonment Cost:
The subsidiary company, OVL, has provided Abandonment Provisions for ACG project as on 31.03.2014 based on the total Capital Cost incurred on the project since inception till 31.03.2014. The Total Capital Cost till 31.03.2014 is USD 28,397.70 million for the AIOC joint venture. OVL's share of the cost (@ 2.7213 %) is USD 772.78 million. Accordingly, maximum provision of 10 % i.e. USD 77.28 million towards Abandonment Fund as per PSA provisions has been made on 31.03.2014.
42.5.7 Mozambique Offshore Area 1:
(a) The company has acquired 10% participatinginterest (PI) in the Rovuma Area 1 of fshoreBlock, Mozambique from Anadarko Moçambique Area 1 Limitada (Anadarko) during the year. The transaction has been completed on 28 February, 2014 and total purchase consideration was USD 2,640 Million (` 163,944.00 Million).
th
The Rovuma Area 1 of fshore Block is indevelopment stage. As per Note No 2.2.e.2 ofthe significant accounting policies, the netassets less liabilities pertaining to Company's10% PI in Area 1 of fshore block as on
February, 2014 was accounted for in the respective assets and liabilities. The dif ferencebetween the purchase consideration and net book value of assets less liabilities has beenaccounted as acquisition cost as per thesignificant policy 2.2.e.2.
th 28
accounting
Details ( USD in Million ) ( ` in Million)
Purchase Price 2,640.00 163,944.00
Less: Net share of assets as on closing
thdate (28 February 14) 316.75 19,670.22
Acquisition Cost 2,323.25 144,273.78
311
(b) Capitalization of borrowing cost:
The consideration amount of USD 2,640 million was financed by way of USD 725 million one year term bridge loan, USD 1,775 million five year term Loan and balance through the Company's internal
stresources. The total borrowing cost upto to 31 March 2014 with respect to the loans, amounts to` 2,140.58 million. As per Note No. 2.2.x of the accounting policy of the group, borrowing cost of
2,092.85 million directly related to the assets under construction has been capitalised to the relatedassets.
(c) Foreign exchange variation on long term foreign currency monetary items:
The subsidiary company, OVL, the exchange dif ference amounting to ` 3,543.16 million arising on the USD 1,775 million five year term loan has been capitalised to the related assets.
(d) The subsidiary Company, OVL, in joint venture with Oil India Limited (OIL) acquired 6% PI in the Rovuma Area 1 of fshore Block, Mozambique from Videocon Mauritius Energy Limited (Videocon) by acquiring 60% shares and OIL acquiring 40% shares of V ideocon Mozambique Rovuma 1 Limited (renamed as Beas Rovuma Energy Mozambique
thLimited (BREML) with ef fect from 30 January, 2014). BREML holds 10% PI in the Rovuma Area 1 of fshore Block, Mozambique. The transaction was completed on 7 January, 2014.
(e) As per the condition of sale and purchase agreement with Videocon for acquiring the shares of BREML, the consideration is subject to adjustment for the seller's final statements of accounts which will be submit ted within 120 days
thfrom the date of closing i.e. by 7 May, 2014.
`
th
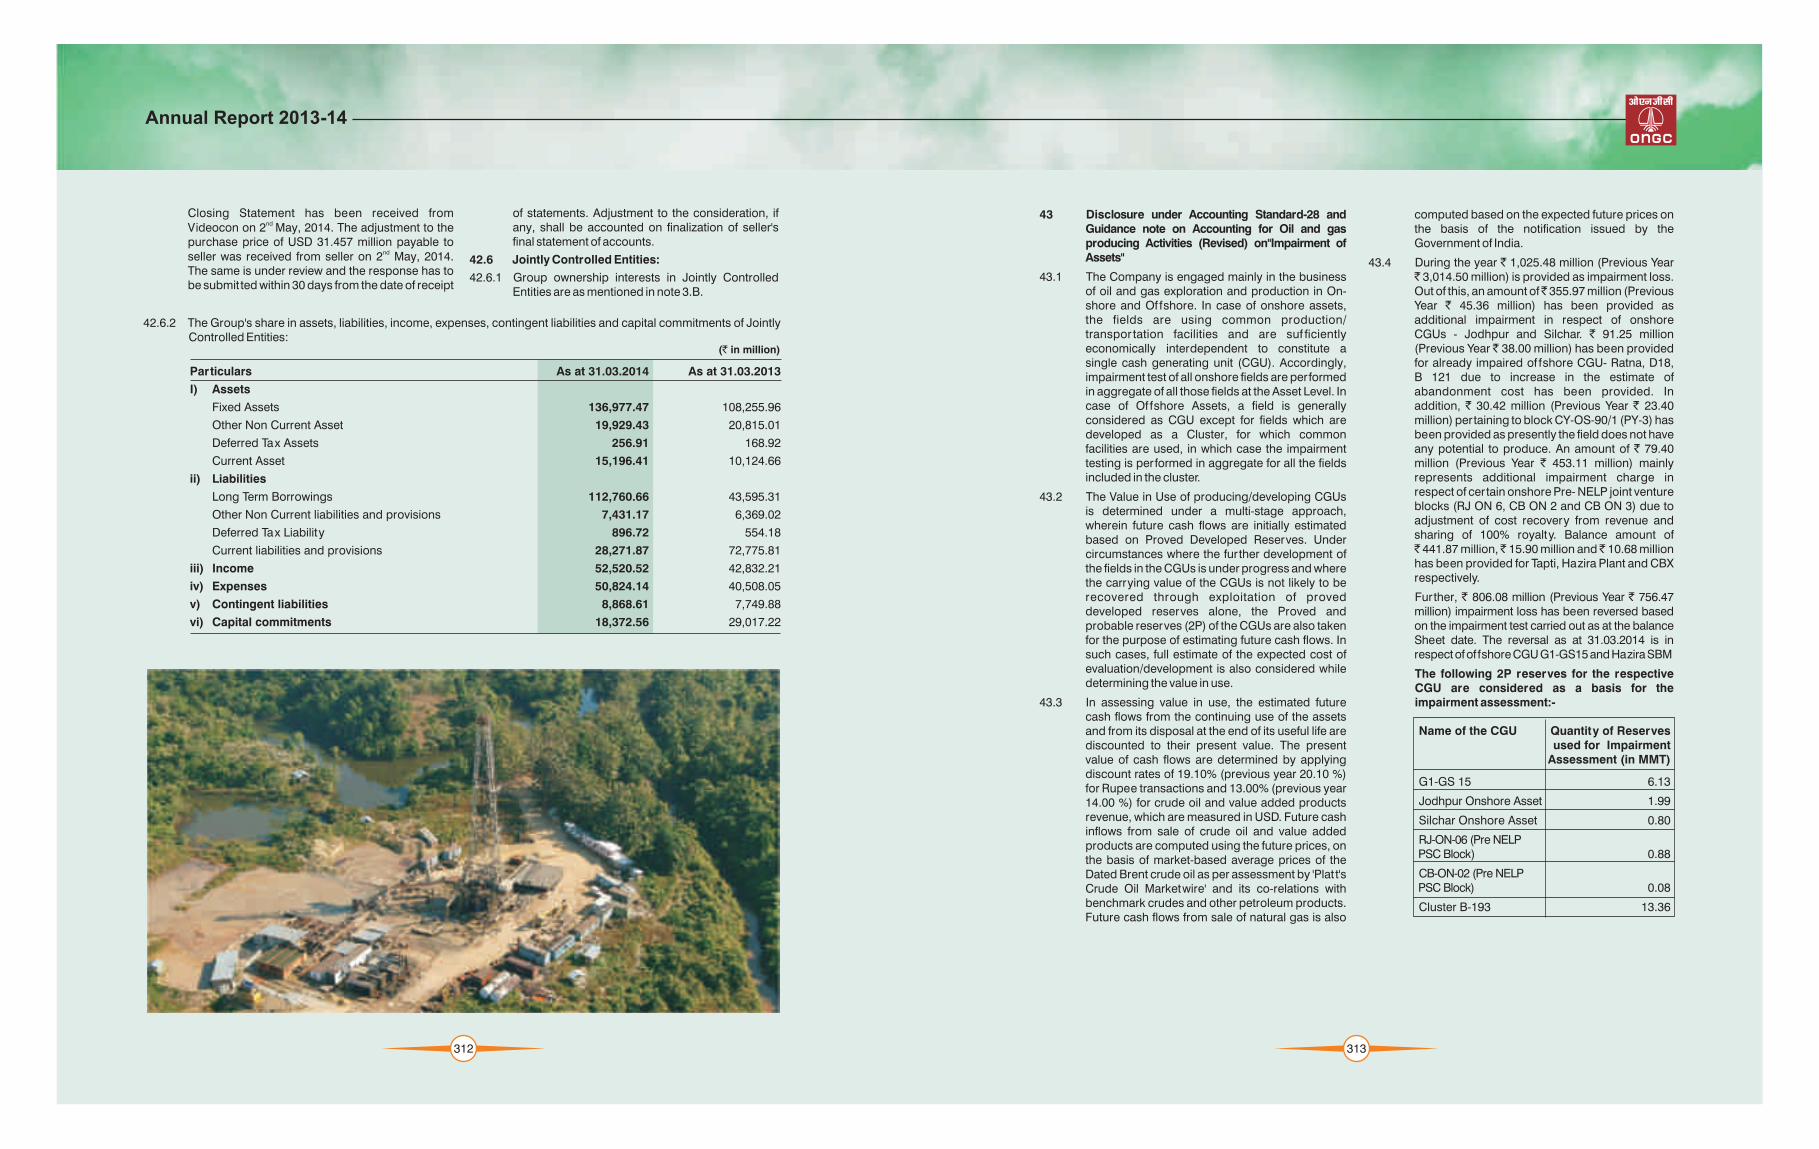
Closing Statement has been received from nd Videocon on 2 May, 2014. The adjustment to the
purchase price of USD 31.457 million payable to ndseller was received from seller on 2 May, 2014.
The same is under review and the response has to be submit ted within 30 days from the date of receipt
of statements. Adjustment to the consideration, if any, shall be accounted on finalization of seller's final statement of accounts.
42.6 Jointly Controlled Entities:
42.6.1 Group ownership interests in Jointly Controlled Entities are as mentioned in note 3.B.
Particulars As at 31.03.2014 As at 31.03.2013
I) Assets
Fixed Assets 136,977.47 108,255.96
Other Non Current Asset 19,929.43 20,815.01
Deferred Tax Assets 256.91 168.92
Current Asset 15,196.41 10,124.66
ii) Liabilities
Long Term Borrowings 112,760.66 43,595.31
Other Non Current liabilities and provisions 7,431.17 6,369.02
Deferred Tax Liability 896.72 554.18
Current liabilities and provisions 28,271.87 72,775.81
iii) Income 52,520.52 42,832.21
iv) Expenses 50,824.14 40,508.05
v) Contingent liabilities 8,868.61 7,749.88
vi) Capital commitments 18,372.56 29,017.22
(` in million)
312
42.6.2 The Group's share in assets, liabilities, income, expenses, contingent liabilities and capital commitments of Jointly Controlled Entities:
43 Disclosure under Accounting Standard-28 and Guidance note on Accounting for Oil and gas producing Activities (Revised) on"Impairment of Assets"
43.1 The Company is engaged mainly in the business of oil and gas exploration and production in On-shore and Of fshore. In case of onshore assets,the fields are using common production/ transpor tation facilities and are suf ficiently economically interdependent to constitute a single cash generating unit (CGU). Accordingly, impairment test of all onshore fields are performed in aggregate of all those fields at the Asset Level. In case of Of fshore Assets, a field is generally considered as CGU except for fields which are developed as a Cluster, for which common facilities are used, in which case the impairment testing is performed in aggregate for all the fields included in the cluster.
43.2 The Value in Use of producing/developing CGUs is determined under a multi-stage approach, wherein future cash flows are initially estimated based on Proved Developed Reserves. Under circumstances where the further development of the fields in the CGUs is under progress and where the carrying value of the CGUs is not likely to be recovered through exploitation of proved developed reserves alone, the Proved and probable reserves (2P) of the CGUs are also taken for the purpose of estimating future cash flows. In such cases, full estimate of the expected cost of evaluation/development is also considered while determining the value in use.
43.3 In assessing value in use, the estimated future cash flows from the continuing use of the assets and from its disposal at the end of its useful life are discounted to their present value. The present value of cash flows are determined by applying discount rates of 19.10% (previous year 20.10 %) for Rupee transactions and 13.00% (previous year 14.00 %) for crude oil and value added products revenue, which are measured in USD. Future cash inflows from sale of crude oil and value added products are computed using the future prices, on the basis of market-based average prices of the Dated Brent crude oil as per assessment by 'Plat t's Crude Oil Marketwire' and its co-relations with benchmark crudes and other petroleum products. Future cash flows from sale of natural gas is also
computed based on the expected future prices on the basis of the notification issued by the Government of India.
43.4 During the year ` 1,025.48 million (Previous Year` 3,014.50 million) is provided as impairment loss. Out of this, an amount of 355.97 million (Previous Year ` 45.36 million) has been provided as additional impairment in respect of onshoreCGUs - Jodhpur and Silchar. ` 91.25 million (Previous Year 38.00 million) has been provided for already impaired of fshore CGU- Ratna, D18,B 121 due to increase in the estimate of abandonment cost has been provided. In addition, ` 30.42 million (Previous Year ` 23.40 million) pertaining to block CY-OS-90/1 (PY-3) has been provided as presently the field does not have any potential to produce. An amount of ` 79.40 million (Previous Year ` 453.11 million) mainly represents additional impairment charge in respect of certain onshore Pre- NELP joint venture blocks (RJ ON 6, CB ON 2 and CB ON 3) due to adjustment of cost recovery from revenue and sharing of 100% royalty. Balance amount of` 441.87 million, 15.90 million and 10.68 million has been provided for Tapti, Hazira Plant and CBX respectively.
Further, ` 806.08 million (Previous Year ` 756.47 million) impairment loss has been reversed based on the impairment test carried out as at the balance Sheet date. The reversal as at 31.03.2014 is in respect of of fshore CGU G1-GS15 and Hazira SBM
The following 2P reserves for the respectiveCGU are considered as a basis for theimpairment assessment:-
Name of the CGU Quantity of Reservesused for Impairment
Assessment (in MMT)
G1-GS 15 6.13
Jodhpur Onshore Asset 1.99
Silchar Onshore Asset 0.80
RJ-ON-06 (Pre NELPPSC Block) 0.88
CB-ON-02 (Pre NELPPSC Block) 0.08
Cluster B-193 13.36
313
Annual Report 2013-14

43.5 The subsidiary company OVL, has assessed indicators for impairment and carried out impairment test in respect of Cash Generating Units (CGUs) based on value in use method as on
st31 March, 2014 where indicators were observed. However, no impairment in any of the CGU was required since the value in use of the CGU's is higher than their respective carrying value. In respect of the projects Imperial Energy, Russia, AFPC, Syria, GPOC and Block 5A, South Sudan operations are carried out with common production and transportation facilities, catering the various fields in the project which are suf ficiently economically interdependent and hence constitute a single cash generating unit for the purposes of Accounting Standard 28 (AS-28) -Impairment of Assets and impairment test is performed in aggregate for all the fields in the respective project which are
considered as single cash generating unit.The following 2P reserves for the respective CGU considered as a basis for the impairment assessment:-
Projects (CGU) Proved and ProbableReserves
(MMT)
Imperial Energy , Russia 90.063
AFPC, Syria 3.108
Block 5A, South Sudan 4.774
GPOC, South Sudan 5.705
44 Disclosure under Accounting Standard - 29 on "Provisions, Contingent Liabilities and Contingent Assets":Movement in Provisions - Abandonment liability & others
For Court cases, arbitration and others, where the timing of expected out flows is upon set tlement of the proceedings and in case of provision for abandonment expected out flow af ter end of :
(` in million)
Provision for Abandonment Others
2013-14 2012-13 2013-14 2012-13
Opening Balance 207,692.12 204,138.82 1,832.45 1,942.45
Add: Provision made during the year 69,351.54 3,553.30 355.64 351.25
Less: Provision writ ten back/ reclassified/
reduction during the year
Closing Balance 274,690.43 207,692.12 2,188.09 1,832.45
2,353.23 - - 461.25
45 Disclosures under Schedule VI to the Companies Act, 1956:
45.1 Capital Commitment not provided for:-
45.1.1 Estimated amount of contracts remaining to be executed on capital account:-
i) In respect of the Company, its subsidiaries and Joint Venture Entities- `260,496.14 million (previous year` 146,670.94 million).
ii) In respect of Joint Ventures - 27,708.70 million (previous year 27,834.64 million).
45.1.2 Estimated amount of Minimum Work Programme (MWP) committed under various 'Production Sharing Contracts':-
i) In respect Nominated Blocks 441.59 million (previous year 958.54 million).
ii) In respect of NELP blocks in which the Company has 100% participating interest of ` 9,600.47million( previous year 12,305.38 million) .
iii) In respect of NELP blocks in Joint Ventures, company's share is ` 62,247.39 million (previous year ` 62,127.36 million).
314
Particulars
Sl. Particulars As at As atst stNo. 31 March, 2014 31 March, 2013
I. In respect of Company : i. Income tax matters 63,951.09 39,121.76 ii. Excise Duty matters 9,702.14 8,840.67 iii. Custom Duty matters 2,319.33 2,219.95 iv. Royalty 117,301.90 90,178.00 v. Cess 6.57 6.57 vi. Sales Tax 46,118.72 45,853.77vii. Octroi 68.54 68.54viii. AP Mineral Bearing Land (Infrastructure) Cess 2,211.27 1,986.94ix Specified Land Tax (Assam) 3,528.89 3,194.73 x. Claims of contractors in Arbitration/Court. 55,814.99 30,583.20 xi. In respect of other matters 73,906.78 54,182.76 xii. Service Tax 53,768.09 44,859.97 xiii. EPF 66.35 66.35 Sub Total 428,764.66 321,163.21
II In respect of Joint Ventures : i. Income tax matters 8.91 8.91ii. Excise Duty matters 4.17 -iii. Custom Duty matters 3,798.73 3744.00iv. Cess - -v. Sales Tax 2,649.81 2,950.00vi. Claim of GoI for additional profit petroleum 4,732.63 4286.17vii. Claims of contractors in Arbitration/Court 363.31 333.24viii. Service Tax 230.02 165.13ix. In respect of other matters 854.74 907.67
Sub Total 12,642.32 12,395.12
Total (I+II) 441,406.98 333,558.32
(` in million)
45.2.1 The above claims / demands are at various stages of appeal and in the opinion of the Company are not tenable.
45.2.2 In addition, in respect of the company, liability for payment to contractual workers for regularization of their services is pending with labour court under civil suit. The amount of liability is not ascertainable.
45.2.3 In respect of subsidiary company OVL, all known contingent liabilities have been indicated. The contingent liabilities, if any, in respect of joint ventures, where the Company is the non-operator are not ascertainable except Sakhalin-1 where the Operator has intimated that the status of contingent liability is Nil.
45.2.4 In terms of the statutory provisions of Oilfields (Regulation and Development) Act, 1948 (ORDA), Petroleum & Natural Gas (PNG) Rules 1959 and Notifications issued thereunder; the Company is liable to pay royalty to Central Government and State Governments, on production of Crude Oil and Natural Gas from of fshore fields and onshore fields, respectively. Since 2008-09, the company has been paying royalty on crude oil at realized price which is net of under-recovery of the OMCs shared by the Company as per GoI directives. On an application filed by the State of Gujarat, the
Hon'ble High Court of Gujarat in its order dated 30.11.2013 has directed the company to pay the short fall of royalty on crude oil produced from the onshore fields in the State of Gujarat on pre-discount prices from 01.04.2008 onwards. Based on the Special Leave Petition filed by the Company, pending further orders, Hon'ble Supreme Court vide order dated 13.02.2014 stayed the operation of the impugned judgment subject to the condition that the company pays royalty to the State of Gujarat on pre-discounted price of crude oil w.e.f. 01.02.2014 onwards. Accordingly, possible obligation on this account for the period from April 2008 to March 2014 has been disclosed as Contingent Liability for ` 1,16,326.96 million. Dif ferential royalty (royalty on pre-discount price minus royalty on post-discount price) being deposited w.e.f. Feb'14 in terms of court order has been shown as deposit.
45.2.5 In respect of joint venture company, Petronet MHB Limited, there are 127 cases (previous year 127 cases) regarding enhancement of land compensation pending with Karnataka High Court against Order of Principal Judge Bangalore Rural District Court. 34 Cases for enhancement of land and malkies Compensation was dismissed by Hassan District Court, against 15 dismissed cases
45.2 Contingent Liabilities:
Claims against the Company/ disputed demands not acknowledged as debt:-
315
Annual Report 2013-14

the petitioners filed their Writ petition in High Court of Karnataka. Out of 3 cases for enhancement of land and malkies compensation & damage outside the ROU pending with Mangalore District Court, one case is dismissed and 02 cases are in progress. In the dismissed case petitioner filed the writ petition in Hon'ble High Court of Karnataka of which the proceedings is in progress. The contingent liability are not ascertainable at present in above cases.
45.2.6 In respect of joint venture company, Petronet MHB Limited, had submit ted onetime set tlement (OTS) Proposal for payment of balance outstanding Zero Coupon Bond (ZCB) to lenders as per CDR. The Lender Banks have raised the issue of payment of recompense amount. As per Legal Opinion, the liability for the recompense amount has triggered. The liability on this amount is ascertainable only at the time of final acceptance of the proposal.
45.2.7 In respect of joint venture company, Petronet MHB Limited, party "Petronet India Ltd (PIL)" has initiated Arbitration proceedings for recovery of their Operationalization Fees. The company has contested the liability on this account.
45.2.8 Performance Guarantees executed under the contracts:
I. The Company has given an undertaking to State bank of India (SBI), for an additional funding up to ` 2,223.50 million (previous year 2,234.00 million) in respect of joint venture company "ONGC Tripura Power Co. Limited (OTPC)" for cost overrun, if any.
ii. The subsidiary, OVL has given a Performance Guarantee on behalf of Petro Carabobo Ganga B.V. to Government of Venezuela in respect of Carabobo 1 Project. The total investment commitment is estimated at USD 1,333 million. The outstanding guarantee obligation of the OVL was
st80,059.98 million as at 31 March, 2014 (previous year 72,501.87 million) The Company is confident that Petro Carabobo Ganga B.V. will be able to honor its obligations.
iii. The OVL subsidiary, ONGBV has given counter guarantee to the State Bank of India for the issue of performance bonds in favour of Nigerian National Petroleum Corporation, on behalf of ONGC Mit tal Energy Limited, with a maximum of 51% of the guaranteed amounts. The outstanding guarantee obligation of the company was `4,594.59 million (USD 76.50 million) (previous year ` 4,160.84 million (USD 76.50 million) as at 31.03.2014.
iv. The subsidiary company OVL, has issued Performance Guarantee in respect of concessionary contract for Block BC-10, Brazil and Blocks BM-S-73 and BM-ES-42 on behalf of ONGC Campos Ltda (OCL). The Company is confident that OCL will be able to honor its obligations.
v. The OVL subsidiar y, ONGBV has given performance guarantee to ANP, the regulatory authority in Brazil, favoring ONGC Campos Ltda (OCL) for BC-10 Project where OCL has a 27% participating interest (previous year 15%) and Shell Brazil is the operator.
As at31.03.14
Opening 222.98 215.77 203.245 208.179 426.22 423.95
Addition 4.71 22.79 18.652 14.917 23.36 37.71
Production 15.54 15.58 19.174 19.851 34.71 35.43
Closing 212.16 222.98 202.723 203.245 414.87 426.22
Opening 190.81 190.46 155.897 156.074 346.71 346.53
Addition 7.94 9.87 0.020 5.170 7.96 15.04
Production 9.44 9.51 5.321 5.348 14.76 14.86
Closing 189.31 190.81 150.595 155.897 339.90 346.71
Opening 413.79 406.23 359.142 364.253 772.93 770.48
Addition 12.65 32.66 18.671 20.087 31.33 52.75
Production 24.97 25.10 24.496 25.199 49.47 50.29
Closing 401.47 413.79 353.318 359.142 754.78 772.93
As at As at As at As at As at31.03.13 31.03.14 31.03.13 31.03.14 31.03.13
A. In India
Crude Oil(MMT)Details
Gas(Billion Cubic Meter)
Total Oil Equivalent (MMTOE)(note 46.2.1)
Offshore
Onshore
Total in India
46 Disclosure under Guidance Note on "Accounting for Oil & Gas Producing Activities" (approved by Reserve Estimates Committee):
46.1 Company's share of Proved Reserves on the geographical basis is as under:
316
As at31.03.14
Opening 9.956 16.971 - - 9.956 16.971
Addition 0.286 0.176 - - 0.286 0.176
Ded/Adj - 6.595 - - - 6.595
Production 0.741 0.596 - 0.741 0.596
Closing 9.501 9.956 - - 9.501 9.956
Opening 6.595 - - - 6.595 -
Addition - - - - - -
- (6.595) - - - (6.595)
Production 0.218 - - - 0.218 -
Closing 6.377 6.595 - - 6.377 6.595
Opening 5.921 6.348 - - 5.921 6.348
Addition - (0.428) - - - (0.428)
Ded/Adj - (0.001) - - - (0.001)
Production 0.034 - - 0.034 -
Closing 5.887 5.921 - - 5.887 5.921
As at As at As at As at As at31.03.13 31.03.14 31.03.13 31.03.14 31.03.13
Ded/Adj
Opening 32.894 34.261 70.531 71.182 103.425 105.443
Addition 5.499 0.003 3.399 (0.001) 8.898 0.002
Ded/Adj - - - - - -
Production 1.488 1.370 0.576 0.650 2.064 2.020
Closing 36.905 32.894 73.354 70.531 110.259 103.425
Opening 0.598 0.635 6.414 8.518 7.012 9.153
Addition - - - - - -
Ded/Adj - - 0.001 - 0.001 -
Production 0.032 0.037 1.851 2.104 1.883 2.141
Closing 0.566 0.598 4.562 6.414 5.128 7.012
Opening 2.581 2.707 - - 2.581 2.707
Addition - - - - - -
Ded/Adj - - - - - -
Production - 0.126 - - - 0.126
Closing 2.581 2.581 - - 2.581 2.581
Opening 4.717 4.778 0.334 0.399 5.051 5.177
Addition 3.342 0.230 0.335 (0.053) 3.677 0.177
Ded/Adj - - - - - -
Production 0.318 0.291 0.013 0.012 0.331 0.303
Closing 7.741 4.717 0.656 0.334 8.397 5.051
Opening 3.453 3.504 - - 3.453 3.504
Addition 0.626 0.501 - - 0.626 0.501
Ded/Adj (0.001) - - - (0.001) -
Production 0.597 0.552 - - 0.597 0.552
Closing 3.483 3.453 - - 3.483 3.453
B. Outside India
Crude Oil(MMT)
Details
Gas(Billion Cubic Meter)
Total Oil Equivalent (MMTOE)(note 46.2.1)
GNOP,Sudan
GPOC,South Sudan
Block 5A,South Sudan
AFPC, Syria
BC-10,Brazil
MECL,Colombia
Sakhalin-1, Russia
Block 06.1, Vietnam
317
Annual Report 2013-14

As at31.03.14
As at As at As at As at As at31.03.13 31.03.14 31.03.13 31.03.14 31.03.13
Opening 14.970 15.530 4.721 4.683 19.691 20.213
Addition - - - 0.109 - 0.109
Ded/Adj - - - - - -
Production 0.387 0.560 0.036 0.071 0.423 0.631
Closing 14.583 14.970 4.685 4.721 19.268 19.691
Opening 10.966 11.766 - - 10.966 11.766
Addition - - - - - -
Ded/Adj - - - - - -
Production 0.767 0.800 - 0.767 0.800
Closing 10.199 10.966 - - 10.199 10.966
Opening 0.022 - - - 0.022 -
Addition 3.795 0.023 - - 3.795 0.023
Ded/Adj - - - - - -
Production 0.021 0.001 - - 0.021 0.001
Closing 3.796 0.022 - - 3.796 0.022
Opening 1.803 1.804 - - 1.803 1.804
Addition - - - - - -
Ded/Adj - - - - - -
Production 0.001 - - - 0.001
Closing 1.803 1.803 - - 1.803 1.803
Opening - - 10.297 10.297 10.297 10.297
Addition - - 1.595 - 1.595 -
Ded/Adj - - - - - -
Production - - 0.201 - 0.201 -
Closing - - 11.691 10.297 11.691 10.297
Opening 9.646 - - - 9.646 -
Addition - 9.656 - - - 9.656
Ded/Adj - - - - - -
Production 0.883 0.010 - - 0.883 0.010
Closing 8.763 9.646 - - 8.763 9.646
Opening 104.122 98.304 92.297 95.079 196.419 193.383
Addition 13.548 10.161 5.329 0.055 18.877 10.216
Ded/Adj (0.001) 0.003 0.001 0.001 - 0.004
Production 5.486 4.343 2.677 2.837 8.163 7.180
Closing 112.185 104.119 94.948 92.296 207.133 196.415
Crude Oil(MMT)
Details
Gas(Billion Cubic Meter)
Total Oil Equivalent (MMTOE)(note 46.2.1)
IEC, Russia
PIVSA,Venezuela
Carabobo - 1,Venezuela
BLOCK-XXIV, Syria
BLOCK-A1 & A3,
Myanmar
ACG,Azerbaijan
TotalOutside India
318
46.2 Company's share of Proved Developed Reserves on the geographical basis is as under:
As at31.03.14
As at As at As at As at As at31.03.13 31.03.14 31.03.13 31.03.14 31.03.13
Opening 160.62 153.50 110.254 114.690 270.87 268.19
Addition 13.90 22.70 41.630 15.431 55.53 38.13
Production 15.54 15.58 19.174 19.867 34.71 35.45
Closing 158.99 160.62 132.710 110.254 291.70 270.87
Opening 150.81 148.73 110.010 110.364 260.81 259.09
Addition 5.18 11.57 2.225 4.933 7.40 16.50
Production 9.39 9.49 5.251 5.287 14.64 14.78
Closing 146.60 150.81 106.984 110.010 253.58 260.81
Opening 311.43 302.23 220.264 225.055 531.69 527.28
Addition 19.09 34.27 43.855 20.364 62.93 54.63
Production 24.93 25.07 24.425 25.154 49.36 50.22
Closing 305.58 311.43 239.694 220.264 545.28 531.69
A. In India
B. Outside India
Crude Oil(MMT)
Details
Gas(Billion Cubic Meter)
Total Oil Equivalent (MMTOE)(note 46.2.1)
Offshore
Onshore
Total inIndia
Opening 2.784 6.707 - - 2.784 6.707
Addition 0.413 1.203 - - 0.413 1.203
Ded/Adj - 4.530 - - - 4.530
Production 0.741 0.596 - - 0.741 0.596
Closing 2.456 2.784 - - 2.456 2.784
Opening 4.530 - - - 4.530 -
Addition - - - - - -
Ded/Adj - (4.530) - - - (4.530)
Production 0.218 - - - 0.218 -
Closing 4.312 4.530 - - 4.312 4.530
Opening 2.599 2.599 - - 2.599 2.599
Addition - - - - - -
Ded/Adj - - - - - -
Production 0.034 - - - 0.034 -
Closing 2.565 2.599 - - 2.565 2.599
Opening 13.391 9.122 10.163 10.794 23.554 19.916
Addition - 5.638 0.689 0.019 0.689 5.657
Ded/Adj - (0.001) - - - (0.001)
Production 1.488 1.370 0.576 0.650 2.064 2.020
Closing 11.903 13.391 10.276 10.163 22.179 23.554
GNOP, Sudan
GPOC,South Sudan
Block 5A,South Sudan
Sakhalin-1,Russia
319
Annual Report 2013-14
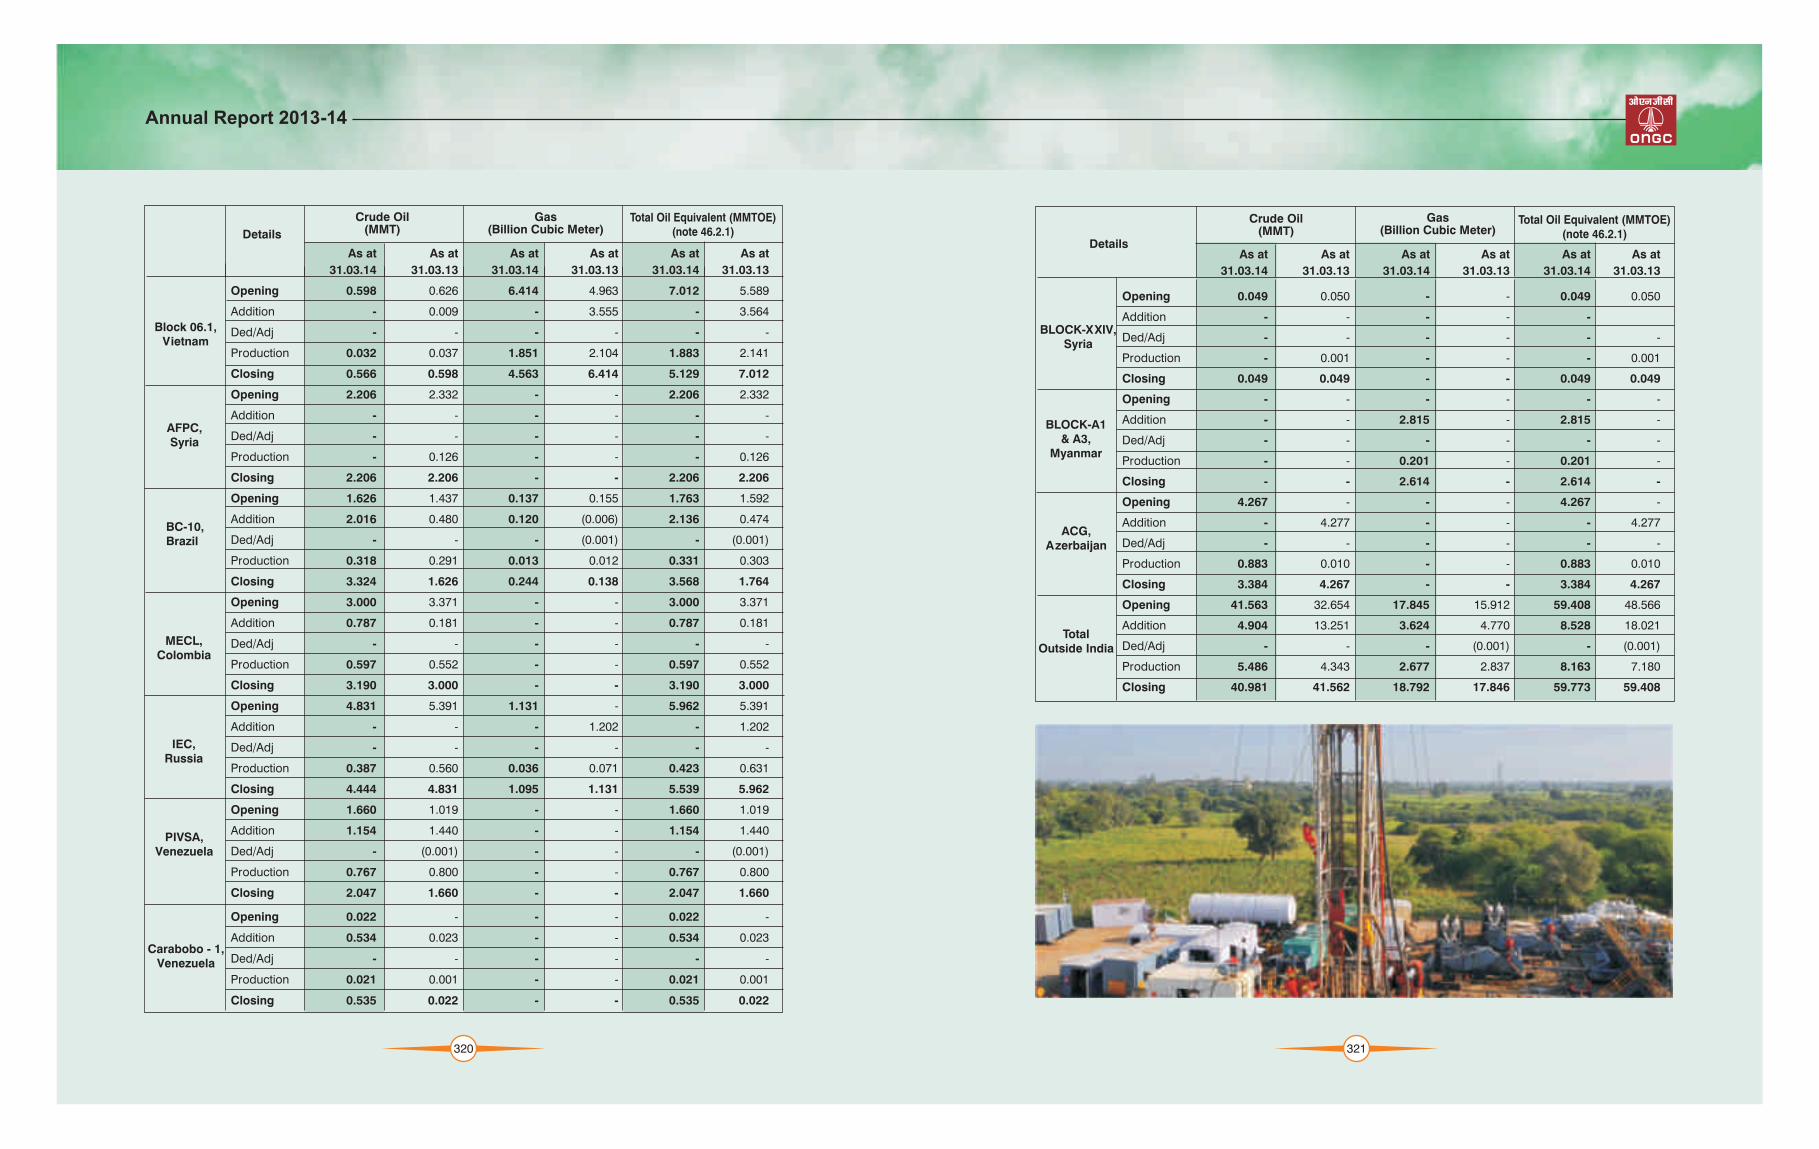
As at
31.03.14
As at As at As at As at As at
31.03.13 31.03.14 31.03.13 31.03.14 31.03.13
Opening 0.598 0.626 6.414 4.963 7.012 5.589
Addition - 0.009 - 3.555 - 3.564
Ded/Adj - - - - - -
Production 0.032 0.037 1.851 2.104 1.883 2.141
Closing 0.566 0.598 4.563 6.414 5.129 7.012
Opening 2.206 2.332 - - 2.206 2.332
Addition - - - - - -
Ded/Adj - - - - - -
Production - 0.126 - - - 0.126
Closing 2.206 2.206 - - 2.206 2.206
Opening 1.626 1.437 0.137 0.155 1.763 1.592
Addition 2.016 0.480 0.120 (0.006) 2.136 0.474
Ded/Adj - - - (0.001) - (0.001)
Production 0.318 0.291 0.013 0.012 0.331 0.303
Closing 3.324 1.626 0.244 0.138 3.568 1.764
Opening 3.000 3.371 - - 3.000 3.371
Addition 0.787 0.181 - - 0.787 0.181
Ded/Adj - - - - - -
Production 0.597 0.552 - - 0.597 0.552
Closing 3.190 3.000 - - 3.190 3.000
Opening 4.831 5.391 1.131 - 5.962 5.391
Addition - - - 1.202 - 1.202
Ded/Adj - - - - - -
Production 0.387 0.560 0.036 0.071 0.423 0.631
Closing 4.444 4.831 1.095 1.131 5.539 5.962
Opening 1.660 1.019 - - 1.660 1.019
Addition 1.154 1.440 - - 1.154 1.440
Ded/Adj - (0.001) - - - (0.001)
Production 0.767 0.800 - - 0.767 0.800
Closing 2.047 1.660 - - 2.047 1.660
Opening 0.022 - - - 0.022 -
Addition 0.534 0.023 - - 0.534 0.023
Ded/Adj - - - - - -
Production 0.021 0.001 - - 0.021 0.001
Closing 0.535 0.022 - - 0.535 0.022
Crude Oil(MMT)Details
Gas(Billion Cubic Meter)
Total Oil Equivalent (MMTOE)(note 46.2.1)
Block 06.1,Vietnam
AFPC,Syria
BC-10,Brazil
MECL,Colombia
IEC,Russia
PIVSA,Venezuela
Carabobo - 1,Venezuela
320
As at
31.03.14
As at As at As at As at As at
31.03.13 31.03.14 31.03.13 31.03.14 31.03.13
Opening 0.049 0.050 - - 0.049 0.050
Addition - - - - -
Ded/Adj - - - - - -
Production - 0.001 - - - 0.001
Closing 0.049 0.049 - - 0.049 0.049
Opening - - - - - -
Addition - - 2.815 - 2.815 -
Ded/Adj - - - - - -
Production - - 0.201 - 0.201 -
Closing - - 2.614 - 2.614 -
Opening 4.267 - - - 4.267 -
Addition - 4.277 - - - 4.277
Ded/Adj - - - - - -
Production 0.883 0.010 - - 0.883 0.010
Closing 3.384 4.267 - - 3.384 4.267
Opening 41.563 32.654 17.845 15.912 59.408 48.566
Addition 4.904 13.251 3.624 4.770 8.528 18.021
Ded/Adj - - - (0.001) - (0.001)
Production 5.486 4.343 2.677 2.837 8.163 7.180
Closing 40.981 41.562 18.792 17.846 59.773 59.408
Crude Oil(MMT)
Details
Gas(Billion Cubic Meter)
Total Oil Equivalent (MMTOE)(note 46.2.1)
BLOCK-XXIV,Syria
BLOCK-A1 & A3,
Myanmar
ACG, Azerbaijan
Total Outside India
321
Annual Report 2013-14

322
46.2.1 MMTOE denotes "Million Metric Tone Oil Equivalent" and for calculating Oil equivalent of Gas, 1000 M3 of Gas has been taken to be equal to 1 MT of Crude Oil. Variations in totals, if any, are due to internal summation and rounding of f.
46.2.2 The year-end reserves of the company and its subsidiary, OVL have been estimated by the Reserves Estimation Commit tee (REC) which follows international reser voir engineering procedures consistently.
The company and its subsidiary, OVL has adopted deterministic approach for reserves estimation and is following Society of Petroleum Engineers (SPE) - 1997 guidelines which defines reserves as "estimated volumes of crude oils, condensate, natural gas, natural gas liquids and associated substances anticipated to be commercially recoverable from known accumulations from a given date forward, under existing economic conditions, by established operating practices, and under current Government regulations.”
Volumetric estimation is the main procedure in estimation, which uses reservoir rock and fluid properties to calculate hydrocarbons in-place and then estimate that portion which will be recovered from it. As the field gets matured with reasonably good production history is available then performance method such as material balance, simulation, decline curve analysis are applied to get more accurate assessments of reserves.
The Company uses the services of third party agencies for due diligence and it gets the reserves of its assets audited by third party periodically by internationally reputed consultants who adopt latest industry practices for their evaluation.
The annual revision of estimates is based on the yearly exploratory and development activities and results thereof. New In place Volume and Ultimate Reserves are estimated for new field discoveries or new pool discoveries in already discovered fields. Also, appraisal activities lead to revision inestimates due to new subsurface data. Similarly, reinterpretation exercise is also carried out for old fields due to necessity of revision in petro-physical parameters, updating of static & dynamic models and performance analysis leading to change in reserves. Intervention of new technology, change in classifications and contractual provisions also necessitates revision in estimation of reserves.
47. The figures in respect of the company, Subsidiaries/Joint Venture Companies have been
regrouped/rearranged based upon the details obtained from the management as par t of consolidation process, Audited/unaudited accounts of respective group companies.
48. In view of the several subsidiaries and Joint Ventures of the company, with each entity operating under dif ferent regulatory requirements in dif ferent countries and adopting dif ferent policies and disclosure, the information required under Accounting Standard (AS) -15 on Employee Benefit is not disclosed in Consolidated Financial statement due to impracticability.
49. Disclosure on Foreign currency exposures at year end that have not been hedged by derivative instrument or otherwise:
The Company has receivables and payables in foreign currency as at the balance sheet date. These foreign currency exposures are not hedged by any derivative instruments or otherwise (Refer note 32.6 & 32.7).
50. Some balances of Trade/Other Receivables, Trade/Other Payables and Loans & Advances are subject to conf irmation/ reconci l iat ion. Adjustments, if any, will be accounted for on confirmation/ reconciliation of the same, which will not have a material impact.
Annual Report 2013-14

Electronic Clearing Services (ECS) Request Form
325
The Company extends the ECS facility to shareholders so as to enable them to receive dividend through electronic mode to their bank. This facility will be available in the following centres: Ahmedabad, Bangalore, Bhubaneswar, Chandigarh, Chennai, Delhi, Guwahati, Hyderabad, Jaipur, Kanpur, Kolkata, Mumbai, Nagpur, Patna, Thiruvananthapuram, Agra, Allahabad, Amritsar, Aurangabad, Baroda, Bhopal, Calicut, Cochin, Coimbatore, Dehradun, Erode, Gorakhpur, Gwalior, Hubli, Indore, Jabalpur, Jalandhar, Jammu, Jamshedpur, Jodhpur, Kolhapur, Lucknow, Ludhiana, Madurai, Mangalore, Mysore, Nasik, Panjim, Pune, Raipur, Rajkot, Salem, Shimla, Surat, Trichur, Trichy, Udaipur, Varanasi, Vijayawada, Visakhapatnam. Those who wish to avail the facility may fill up the ECS form given below and send the same to the Share Transfer Agent of the Company - M/s Karvy Computershare Private Limited in case of shares held in physical form and to their respective Depository Participant in case of shares held in Electronic/Demat form.
Electronic Clearing Services (ECS) Request form
(Note: If you are already receiving through ECS, please ignore this form)
Karvy Computershare Pvt. Ltd
Unit - ONGC, 17-24, Vit tal Rao Nagar
Madhapur, Hyderabad - 500 081
Andhra Pradesh - India
Tel: 040 23420818 Fax: 040 23420814
SHAREHOLDERS IN PHYSICAL FORM SHAREHOLDERS IN DEMAT FORM
To be sent to your Depositary participant (DP)
Dear Sir,
Subject : ECS Mandate/ Bank form for Dividend Payment
I the undersigned, shareholder of Oil and Natural Gas Corporation Limited (ONGC), wish to opt for ECS facility for payment of dividend. The following is a confirmation of my details and I hereby confirm my choice to opt for payment of dividend payable to me by a physical dividend warrant/demand draf t, on account of any circumstances beyond the control of ONGC, that may af fect payment of dividend through ECS.
1) For shares held in physical form
Folio No:
2) For shares held in Electronic form
[Shareholders holding shares in electronic form should forward this form to their
respective Depositary Participant (DP)].
DP ID
Client ID
3) Name & Address :
4) Bank Particulars :
Bank Name
Branch Name & Address
Account No. (as appearing in cheque book)
Account type
9 digit MICR code as appearing on the cheque

326
Proxy form[Pursuant to section 105(6) of the Companies Act, 2013 and rule 19(3) of the Companies (Management and Administration) Rules, 2014]
I/We, being the member (s) of …………. shares of the above named company, hereby appoint
1. .....................…………………… of ............................…………………. having e-mail Id……………….......... or failing him
2. of having e-mail Id or failing him
3.
.....................…………………… ............................…………………. ………………..........
.....................…………………… of ............................…………………. having e-mail Id……………….......... or failing him
And whose signature(s) are appended below as my/our proxy to at tend and vote (on a poll) for me/us and on my/our behalf at the 21st Annual General Meeting of the company, to be held on Friday, 19th September, 2014 at 10.00 A.M. at NDMC Indoor Stadium, Talkatora Garden, New Delhi and at any adjournment thereof in respect of such resolutions as are indicated below:
Sl No. RESOLUTIONS
ORDINARY BUSINESS
1 To receive, consider and adopt the Audited Financial Statement of the Company for the Financial Year ended 31st March, 2014, together with the Repor ts of the Directors and the Auditors’ thereon and comments of the Comptroller & Auditor General of India, in terms of Section 143(6) of the Companies Act, 2013.
2 To confirm the payment of two interim dividends and declare final dividend on equity shares for the year 2013-14.
3 To appoint a Director in place of Shri A K Banerjee (DIN-05287459) who retires by rotation and being eligible, of fers himself for re-appointment.
4 To authorise Board of Directors of the Company to fix the remuneration of the Joint Statutory Auditors of the Company for the Financial Year 2014-15, in terms of the provisions of section 139(5) read with section 142 of the Companies Act, 2013.
SPECIAL BUSINESS
5 To appoint Shri Tapas Kumar Sengupta (DIN-06802877) as Director of the Company.
6 To appoint Shri Dinesh Kumar Sarraf (DIN-00147870) as Director of the Company.
7 To appoint Dr. Subhash C. Khuntia (DIN-05344972) as Director of the Company.
8 To appoint Shri Ashok Varma (DIN-06909494) as Director of the Company.
9 To appoint Shri Desh Deepak Misra (DIN-06926783) as Director of the Company.
10 To ratify the remuneration of the Cost Auditors for the financial year ending 31st March, 2015.
Affix revenuestampof `1
Signed this…… day of……… 2014
Signature of shareholder
Signature of first Proxy holder Signature of second Proxy holder Signature of third Proxy holder
Note: This form of proxy in order to be ef fective should be duly completed and deposited at the Registered Office of the Company, not less than 48 hours before the commencement of the Meeting.
OIL AND NATURAL GAS CORPORATION LIMITED CIN: L74899DL1993GOI054155
Reg. office: JEEVAN BHARATI, 124 INDIRA CHOWK, NEW DELHI- 110001Website: www.ongcindia.com email: [email protected] Tel: 011-23301277/1299
Name of the member (s):
Registered address:
E-mail Id:
Folio No/ Client Id:
DP ID:
Attendance Slip
OIL AND NATURAL GAS CORPORATION LIMITED CIN: L74899DL1993GOI054155
Reg. office: JEEVAN BHARATI, 124 INDIRA CHOWK, NEW DELHI- 110001Website: www.ongcindia.com email: [email protected] Tel: 011-23301277/1299
Please fill in this at tendance slip and hand i t over at the entrance of the meeting venue.
Client ID*
D.P ID* Folio No.
No. of share(s) held
I cer tify that I am a member/proxy for the member of the Company.I hereby record my presence at the 21st Annual General Meeting of the Oil And Natural Gas Corporation Limited held on Friday, 19th September, 2014 at 10.00 A.M. at NDMC Indoor Stadium, Talkatora Garden, New Delhi.
Members/proxy’s name in Block Let ters
*Applicable for investor holding Share(s) in electronic form. Signature of Member/Proxy
327
Annual Report 2013-14

321328
Notes
Annual Report 2013-14

Notes
The Anchors of the Maharatna
Annual Report 2013-14


![THE COMPANIES ACT, 1956 ACT NO. 1 OF 1956 · 2011-11-11 · THE COMPANIES ACT, 1956 ACT NO. 1 OF 1956 [18th January, 1956] An Act to consolidate and amend the law relating to companies](https://static.fdocuments.in/doc/165x107/5f6faf1dda141018fa3fcf2e/the-companies-act-1956-act-no-1-of-1956-2011-11-11-the-companies-act-1956-act.jpg)

![The Companies Act, 1956 · The Companies Act, 1956 THE COMPANIES ACT, 1956 ACT NO. 1 OF 1956 [ 18th January, 1956] An Act to consolidate and amend the law relating to companies and](https://static.fdocuments.in/doc/165x107/5f6faf1fda141018fa3fcf35/the-companies-act-1956-the-companies-act-1956-the-companies-act-1956-act-no.jpg)