of Southern Bluefin Tuna...Commission for the Conservation of Southern Bluefin Tuna...
11
Commission for the Conservation of Southern Bluefin Tuna CCSBT-ESC/1708/04-Rev1 Secretariat Review of Catches (ESC agenda item 4.2) This paper provides an update of the reported SBT global catches, catch and effort, and exports from CCSBT Members and Cooperating Non-Members. 1) Global SBT Catch The global catch by flag is provided at Attachment A. The new and updated figures were obtained from the 2017 Data Exchange. The estimated total catch for the 2016 calendar year was 15,490t, an increase of 78.1t or 0.5% from the 2015 calendar year. The global TAC for the 2016 fishing season was the same as the 2015 fishing season (before carry-forward adjustments). The figures in Attachment A that differ from those in the report of the 2016 Extended Scientific Committee (ESC) meeting are italicised and shown in red. The differences for Taiwan and South Africa are due to them providing revisions to their 2015 catch during the 2017 CCSBT Data Exchange. South Africa further revised its 2015 and 2016 catches in August 2017. For the Global Catch Table, the following should once again be noted: • The column for “Retrospective unreported catch estimate scenarios” is separated into a surface fisheries catch scenario and a longline fisheries catch scenario. However, due to confidentiality that still exists in relation to these catch scenarios, the Secretariat recommends that the global catch table in the ESC report should: o exclude the retrospective catch estimate scenarios; and o contain the following explanatory text: “Reviews of southern bluefin tuna data presented to a Special Meeting of the Commission in 2006 suggested that the catches may have been substantially under-reported over the previous 10 to 20 years, and the data presented here do not yet include estimates for this unreported catch” In addition, due to confidentiality concerns, the Secretariat recommends that Attachment A of the present paper be excluded from the public domain. Attachment B provides charts of global annual reported catch by flag (figure 1), by gear (figure 2) and by CCSBT statistical area and gear (figure 3 – for statistical areas where annual catch has exceeded 200mt for at least one year).
Transcript of of Southern Bluefin Tuna...Commission for the Conservation of Southern Bluefin Tuna...
Commission for the Conservation of Southern Bluefin Tuna
CCSBT-ESC/1708/04-Rev1
Secretariat Review of Catches (ESC agenda item 4.2) This paper provides an update of the reported SBT global catches, catch and effort, and exports from CCSBT Members and Cooperating Non-Members. 1) Global SBT Catch The global catch by flag is provided at Attachment A. The new and updated figures were obtained from the 2017 Data Exchange. The estimated total catch for the 2016 calendar year was 15,490t, an increase of 78.1t or 0.5% from the 2015 calendar year. The global TAC for the 2016 fishing season was the same as the 2015 fishing season (before carry-forward adjustments). The figures in Attachment A that differ from those in the report of the 2016 Extended Scientific Committee (ESC) meeting are italicised and shown in red. The differences for Taiwan and South Africa are due to them providing revisions to their 2015 catch during the 2017 CCSBT Data Exchange. South Africa further revised its 2015 and 2016 catches in August 2017. For the Global Catch Table, the following should once again be noted:
• The column for “Retrospective unreported catch estimate scenarios” is separated into a surface fisheries catch scenario and a longline fisheries catch scenario. However, due to confidentiality that still exists in relation to these catch scenarios, the Secretariat recommends that the global catch table in the ESC report should:
o exclude the retrospective catch estimate scenarios; and o contain the following explanatory text:
“Reviews of southern bluefin tuna data presented to a Special Meeting of the Commission in 2006 suggested that the catches may have been substantially under-reported over the previous 10 to 20 years, and the data presented here do not yet include estimates for this unreported catch”
In addition, due to confidentiality concerns, the Secretariat recommends that Attachment A of the present paper be excluded from the public domain.
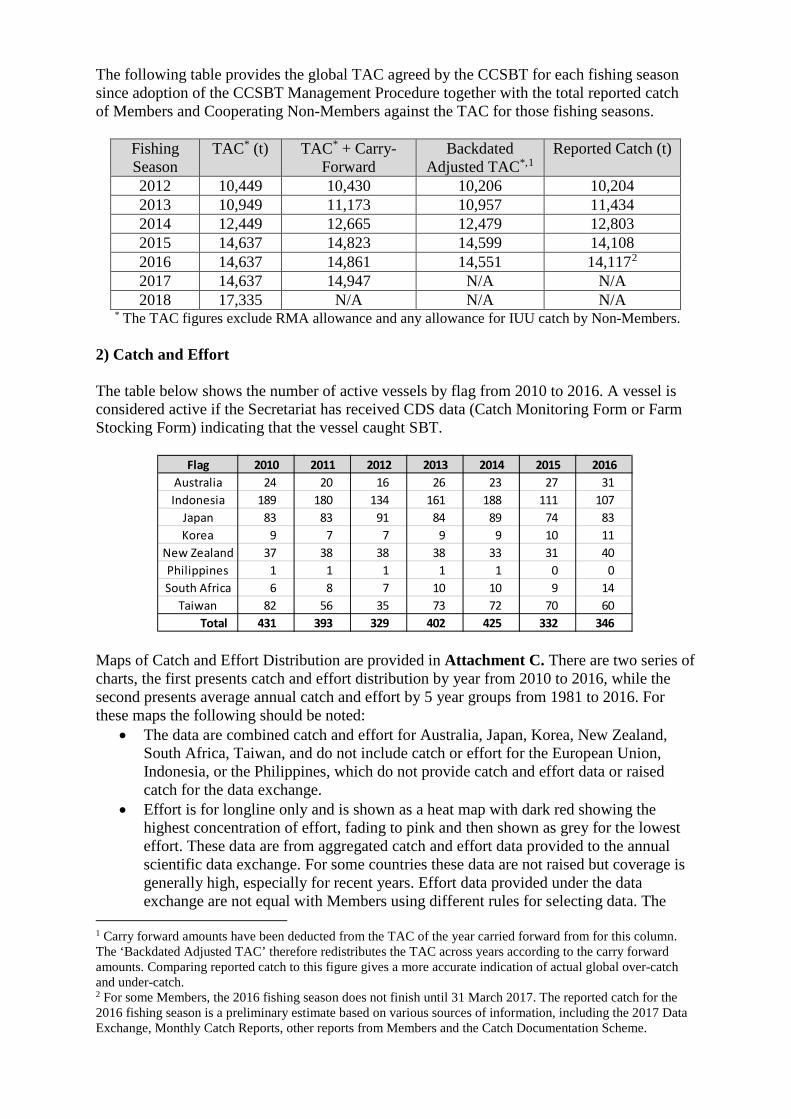
Attachment B provides charts of global annual reported catch by flag (figure 1), by gear (figure 2) and by CCSBT statistical area and gear (figure 3 – for statistical areas where annual catch has exceeded 200mt for at least one year).
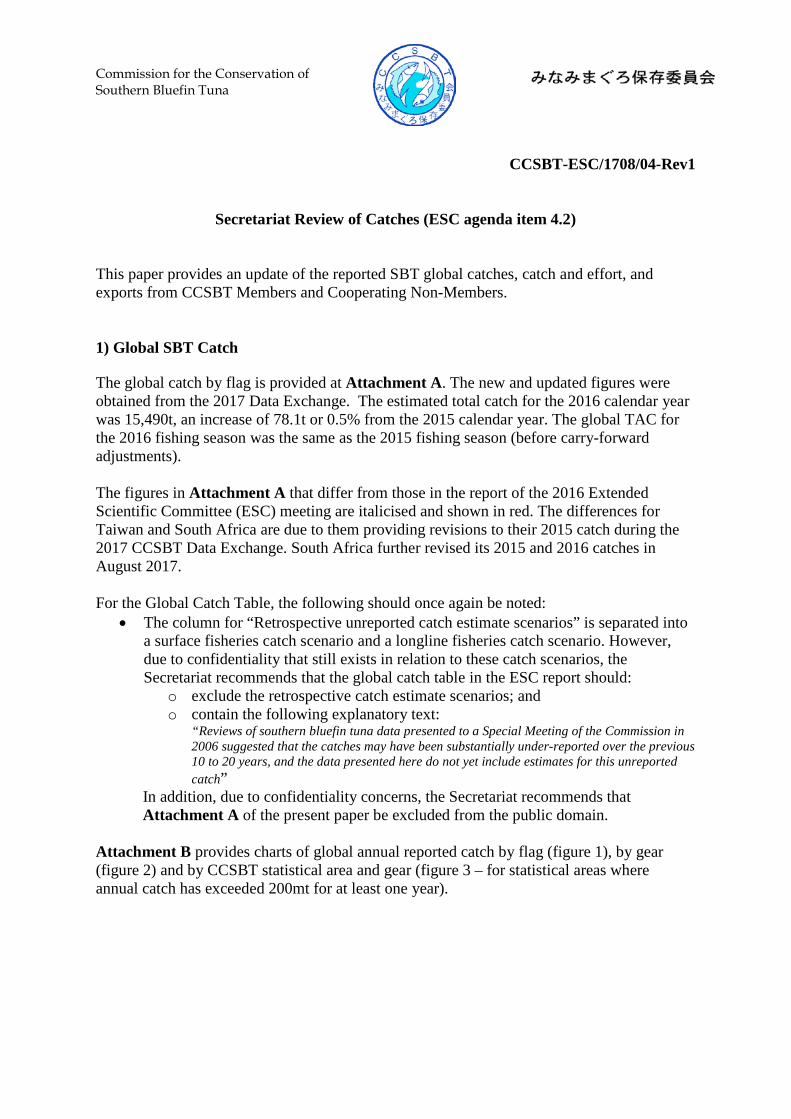
The following table provides the global TAC agreed by the CCSBT for each fishing season since adoption of the CCSBT Management Procedure together with the total reported catch of Members and Cooperating Non-Members against the TAC for those fishing seasons.
Fishing Season
TAC* (t) TAC* + Carry-Forward
Backdated Adjusted TAC*,1
Reported Catch (t)
2012 10,449 10,430 10,206 10,204 2013 10,949 11,173 10,957 11,434 2014 12,449 12,665 12,479 12,803 2015 14,637 14,823 14,599 14,108 2016 14,637 14,861 14,551 14,1172 2017 14,637 14,947 N/A N/A 2018 17,335 N/A N/A N/A
* The TAC figures exclude RMA allowance and any allowance for IUU catch by Non-Members. 2) Catch and Effort The table below shows the number of active vessels by flag from 2010 to 2016. A vessel is considered active if the Secretariat has received CDS data (Catch Monitoring Form or Farm Stocking Form) indicating that the vessel caught SBT.
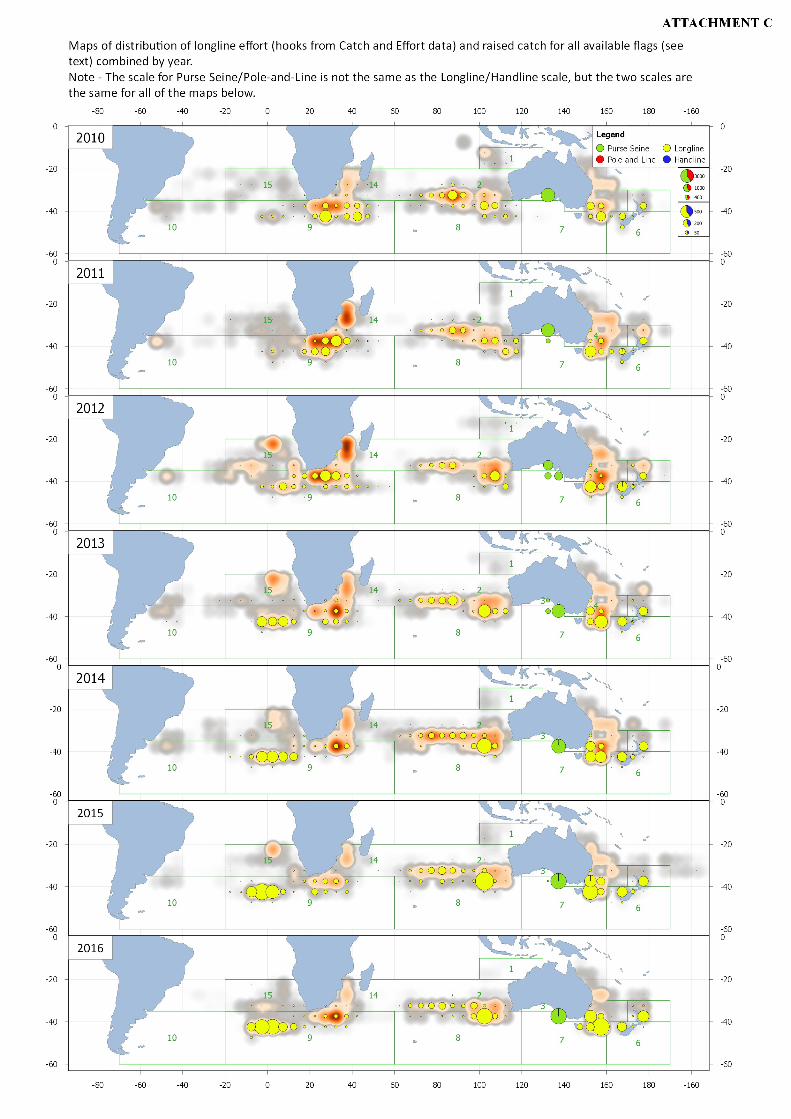
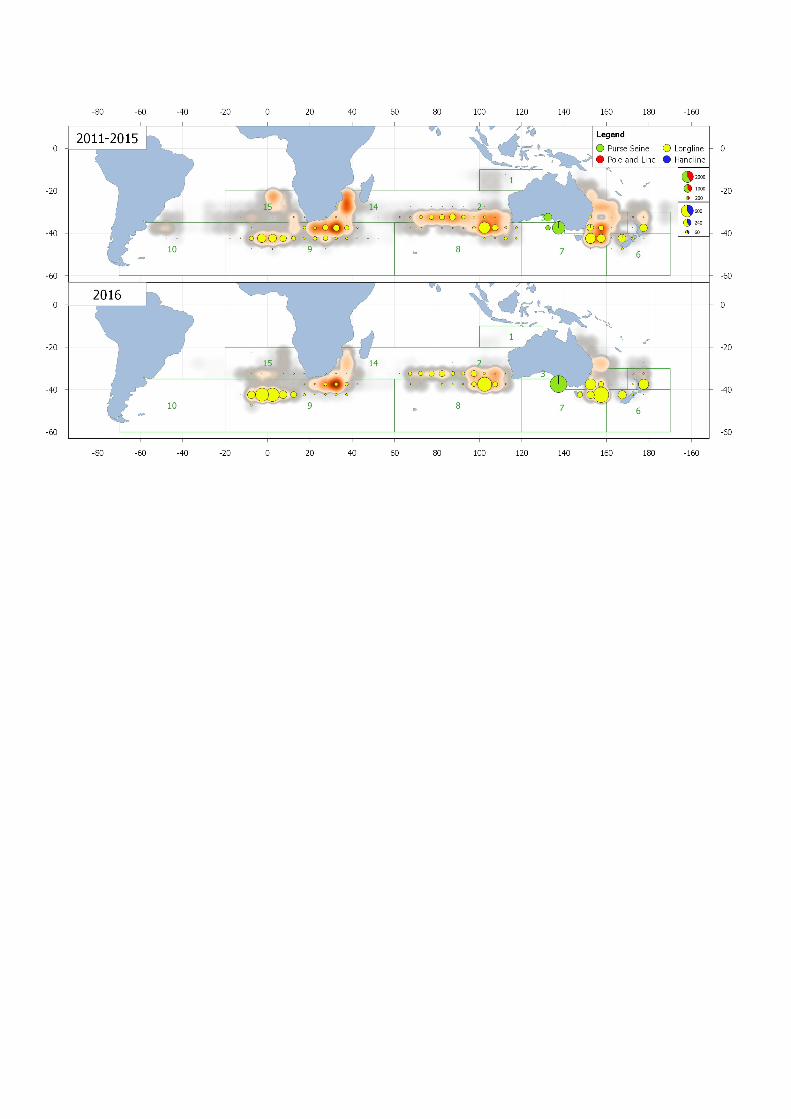
Maps of Catch and Effort Distribution are provided in Attachment C. There are two series of charts, the first presents catch and effort distribution by year from 2010 to 2016, while the second presents average annual catch and effort by 5 year groups from 1981 to 2016. For these maps the following should be noted:
• The data are combined catch and effort for Australia, Japan, Korea, New Zealand, South Africa, Taiwan, and do not include catch or effort for the European Union, Indonesia, or the Philippines, which do not provide catch and effort data or raised catch for the data exchange.
• Effort is for longline only and is shown as a heat map with dark red showing the highest concentration of effort, fading to pink and then shown as grey for the lowest effort. These data are from aggregated catch and effort data provided to the annual scientific data exchange. For some countries these data are not raised but coverage is generally high, especially for recent years. Effort data provided under the data exchange are not equal with Members using different rules for selecting data. The
1 Carry forward amounts have been deducted from the TAC of the year carried forward from for this column. The ‘Backdated Adjusted TAC’ therefore redistributes the TAC across years according to the carry forward amounts. Comparing reported catch to this figure gives a more accurate indication of actual global over-catch and under-catch. 2 For some Members, the 2016 fishing season does not finish until 31 March 2017. The reported catch for the 2016 fishing season is a preliminary estimate based on various sources of information, including the 2017 Data Exchange, Monthly Catch Reports, other reports from Members and the Catch Documentation Scheme.
Flag 2010 2011 2012 2013 2014 2015 2016Australia 24 20 16 26 23 27 31Indonesia 189 180 134 161 188 111 107
Japan 83 83 91 84 89 74 83Korea 9 7 7 9 9 10 11
New Zealand 37 38 38 38 33 31 40Philippines 1 1 1 1 1 0 0South Africa 6 8 7 10 10 9 14
Taiwan 82 56 35 73 72 70 60Total 431 393 329 402 425 332 346

effort heat maps are not on a standard scale and show relative effort concentration for each map. Effort is therefore presented for indicative purposes only and does not represent the best estimate of fishing effort that is targeting or catching SBT.
• Catch is taken from raised catch data provided to the annual scientific data exchange. • There are two separate and different catch scales on the maps, one for longline
(yellow) and handline catches (blue), and another for pole-and-line (red) and purse seine catches (green). The catch scales are the same for all maps in a series.
3) Catch Documentation Scheme statistics At ESC12, the meeting requested that the Secretariat provide Trade Information Scheme (TIS) information for future meetings of the ESC. The Trade Information Scheme ended on 31 December 2009 and was replaced by the Catch Documentation Scheme (CDS) as of 1 January 2010. TIS data will no longer be reported in this paper and are available in paper CCSBT-ESC/1509/04. This paper only presents data that have been taken from the CDS scheme, from 2010 onwards. The complete details of the CDS scheme are available on the CCSBT web site at: http://www.ccsbt.org/userfiles/file/docs_english/operational_resolutions/Resolution_CDS.pdf There are some limitations to the CDS that should be noted:
• The time lags between catch, landing, export and import for some SBT fisheries can result in lengthy delays before all catch information is available
• The scheme involves reporting of net weights and product types on CDS documents. However, not all Members have provided conversion factors for converting these to whole weight estimates and consequently, default conversion factors must often be used.
• Catch data from farms is taken from the farm stocking forms and allocated to catch year by using the catch harvest dates on the forms. The catch harvest dates are a range that can be several months and span across years. In the case where the dates span across years the catch has been apportioned to the years using the number of days in each year, but these estimates will not always match actual catch by year and therefore may differ from the relevant Members’ official catch figures.
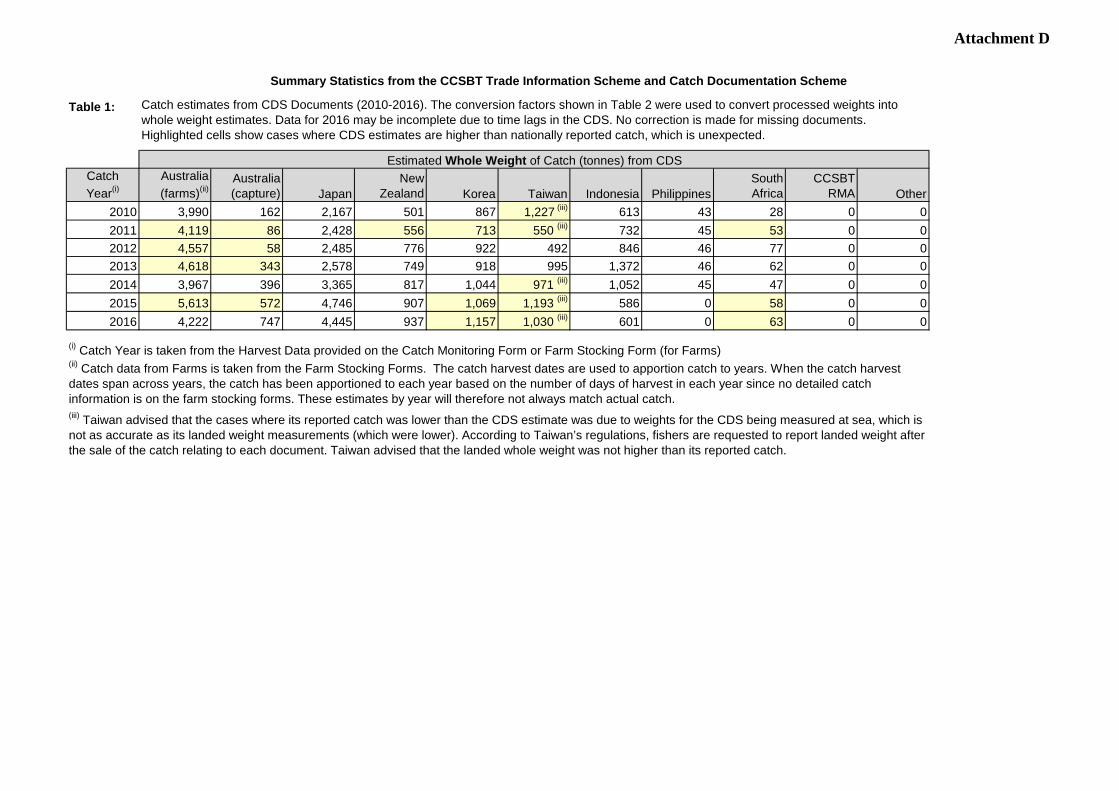
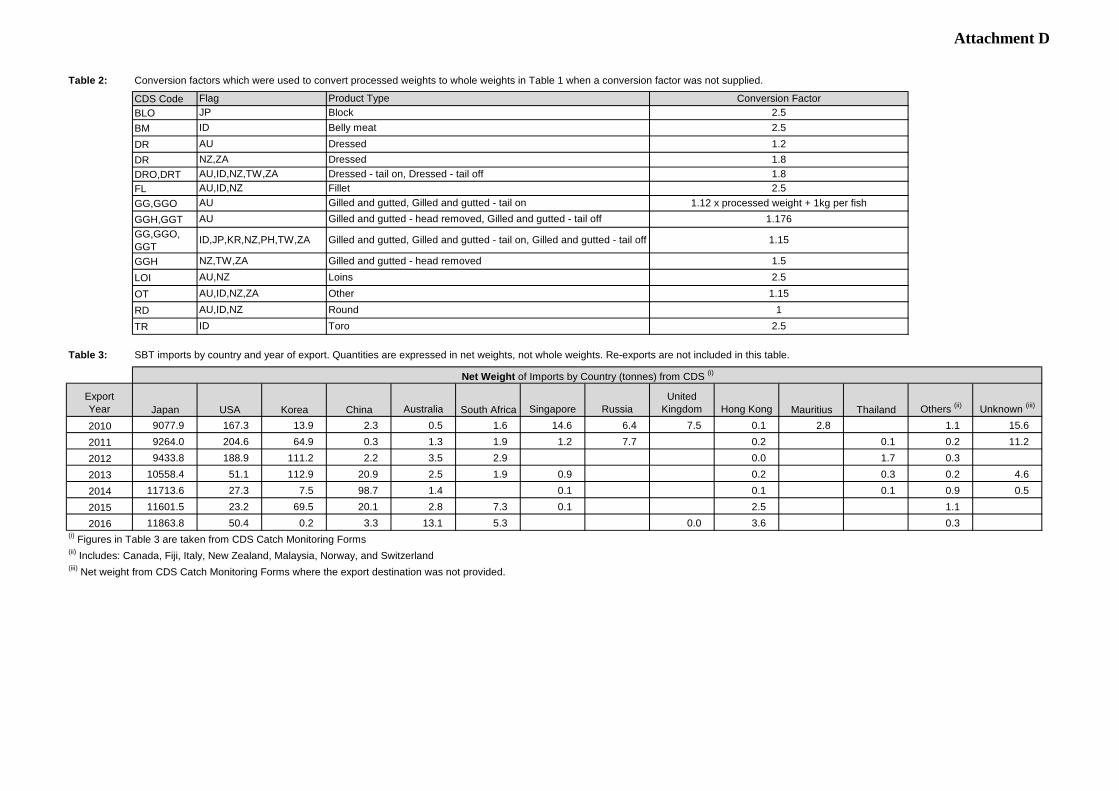
Bearing in mind the limitations of the CDS, Table 1 of Attachment D provides a summary of the catch per year and flag. Table 1 uses data from both Catch Monitoring Forms (for Wild Caught SBT) and Farm Stocking Forms (for Farmed SBT) under the CDS Scheme. Table 2 shows the conversion factors used in producing Table 1. When a conversion factor was supplied with the form then the provided conversion factor was used, if not then the factor shown in the table was used. Australian data with codes of GG, GGH, GGO, or GGT were converted using the Australian specific factors even if a conversion factor was provided. Conversion factors were provided mostly for Australian forms with processed codes of OT, LOI, and GGH, with a range of factors provided. Conversion factors were also provided for two New Zealand forms (processed codes GG and LOI) and six Indonesian forms (processed codes BM, FL, OT and TR). Table 3 shows the net weight of SBT exported to different importing countries according to the CDS. For each year from 2010 to 2016, between 97% and 99% of SBT exports were sent to Japan. Prepared by the Secretariat

Attachment A
This attachment is only available in the Members version of this report
Attachment B
Figure 1 – Annual Global catch by Flag
0
2000
4000
6000
8000
1990
1991
1992
1993
1994
1995
1996
1997
1998
1999
2000
2001
2002
2003
2004
2005
2006
2007
2008
2009
2010
2011
2012
2013
2014
2015
2016
Australia
0
2000
4000
6000
8000
1990
1991
1992
1993
1994
1995
1996
1997
1998
1999
2000
2001
2002
2003
2004
2005
2006
2007
2008
2009
2010
2011
2012
2013
2014
2015
2016
Japan
0
500
1000
1500
2000
1990
1991
1992
1993
1994
1995
1996
1997
1998
1999
2000
2001
2002
2003
2004
2005
2006
2007
2008
2009
2010
2011
2012
2013
2014
2015
2016
Taiwan
0
500
1000
1500
2000
1990
1991
1992
1993
1994
1995
1996
1997
1998
1999
2000
2001
2002
2003
2004
2005
2006
2007
2008
2009
2010
2011
2012
2013
2014
2015
2016
Korea
0
500
1000
1500
2000
2500
3000
1990
1991
1992
1993
1994
1995
1996
1997
1998
1999
2000
2001
2002
2003
2004
2005
2006
2007
2008
2009
2010
2011
2012
2013
2014
2015
2016
Indonesia
0
200
400
600
800
100019
90
1991
1992
1993
1994
1995
1996
1997
1998
1999
2000
2001
2002
2003
2004
2005
2006
2007
2008
2009
2010
2011
2012
2013
2014
2015
2016
New Zealand
0
20
40
60
80
100
1990
1991
1992
1993
1994
1995
1996
1997
1998
1999
2000
2001
2002
2003
2004
2005
2006
2007
2008
2009
2010
2011
2012
2013
2014
2015
2016
South Africa
0
20
40
60
80
100
1990
1991
1992
1993
1994
1995
1996
1997
1998
1999
2000
2001
2002
2003
2004
2005
2006
2007
2008
2009
2010
2011
2012
2013
2014
2015
2016
Philippines
0
20
40
60
80
100
1990
1991
1992
1993
1994
1995
1996
1997
1998
1999
2000
2001
2002
2003
2004
2005
2006
2007
2008
2009
2010
2011
2012
2013
2014
2015
2016
European Union

Figure 2 – Annual Global catch by Gear
Figure 3 – Annual Global catch by Statistical Area and Gear
0
2000
4000
6000
8000
10000
12000
14000
16000
18000
20000
1990
1991
1992
1993
1994
1995
1996
1997
1998
1999
2000
2001
2002
2003
2004
2005
2006
2007
2008
2009
2010
2011
2012
2013
2014
2015
2016
Global Catch (mt) by Gear
Purse Seine Pole and Line Longline Troll Other Handline Gillnet
0
500
1000
1500
2000
2500
1991
1992
1993
1994
1995
1996
1997
1998
1999
2000
2001
2002
2003
2004
2005
2006
2007
2008
2009
2010
2011
2012
2013
2014
2015
2016
Statistical Area 2
Gillnet Handline Longline Pole and Line Purse Seine Troll
0
1000
2000
3000
4000
5000
6000
7000
1990
1991
1992
1993
1994
1995
1996
1997
1998
1999
2000
2001
2002
2003
2004
2005
2006
2007
2008
2009
2010
2011
2012
2013
2014
2015
2016
Statistical Area 3
Gillnet Handline Longline Pole and Line Purse Seine Troll
0
1000
2000
3000
4000
5000
6000
7000
1991
1992
1993
1994
1995
1996
1997
1998
1999
2000
2001
2002
2003
2004
2005
2006
2007
2008
2009
2010
2011
2012
2013
2014
2015
2016
Statistical Area 8
Gillnet Handline Longline Pole and Line Purse Seine Troll
0
1000
2000
3000
4000
5000
6000
7000
1991
1992
1993
1994
1995
1996
1997
1998
1999
2000
2001
2002
2003
2004
2005
2006
2007
2008
2009
2010
2011
2012
2013
2014
2015
2016
Statistical Area 7
Gillnet Handline Longline Pole and Line Purse Seine Troll
0
500
1000
1500
2000
2500
1991
1992
1993
1994
1995
1996
1997
1998
1999
2000
2001
2002
2003
2004
2005
2006
2007
2008
2009
2010
2011
2012
2013
2014
2015
2016
Statistical Area 4
Gillnet Handline Longline Pole and Line Purse Seine Troll
0
500
1000
1500
2000
2500
1991
1992
1993
1994
1995
1996
1997
1998
1999
2000
2001
2002
2003
2004
2005
2006
2007
2008
2009
2010
2011
2012
2013
2014
2015
2016
Statistical Area 5
Gillnet Handline Longline Pole and Line Purse Seine Troll
0
500
1000
1500
2000
2500
1991
1992
1993
1994
1995
1996
1997
1998
1999
2000
2001
2002
2003
2004
2005
2006
2007
2008
2009
2010
2011
2012
2013
2014
2015
2016
Statistical Area 6
Gillnet Handline Longline Pole and Line Purse Seine Troll
0
1000
2000
3000
4000
5000
6000
7000
1991
1992
1993
1994
1995
1996
1997
1998
1999
2000
2001
2002
2003
2004
2005
2006
2007
2008
2009
2010
2011
2012
2013
2014
2015
2016
Statistical Area 9
Gillnet Handline Longline Pole and Line Purse Seine Troll
0
500
1000
1500
2000
2500
1991
1992
1993
1994
1995
1996
1997
1998
1999
2000
2001
2002
2003
2004
2005
2006
2007
2008
2009
2010
2011
2012
2013
2014
2015
2016
Statistical Area 14
Gillnet Handline Longline Pole and Line Purse Seine Troll
0
1000
2000
3000
4000
5000
6000
7000
1991
1992
1993
1994
1995
1996
1997
1998
1999
2000
2001
2002
2003
2004
2005
2006
2007
2008
2009
2010
2011
2012
2013
2014
2015
2016
Statistical Area Unspecified
Gillnet Handline Longline Pole and Line Purse Seine Troll

Attachment D
Table 1:
CatchYear(i)
Australia(farms)(ii)
Australia(capture) Japan
NewZealand Korea Taiwan Indonesia Philippines
SouthAfrica
CCSBTRMA Other
2010 3,990 162 2,167 501 867 1,227 (iii) 613 43 28 0 02011 4,119 86 2,428 556 713 550 (iii) 732 45 53 0 02012 4,557 58 2,485 776 922 492 846 46 77 0 02013 4,618 343 2,578 749 918 995 1,372 46 62 0 02014 3,967 396 3,365 817 1,044 971 (iii) 1,052 45 47 0 02015 5,613 572 4,746 907 1,069 1,193 (iii) 586 0 58 0 02016 4,222 747 4,445 937 1,157 1,030 (iii) 601 0 63 0 0
Summary Statistics from the CCSBT Trade Information Scheme and Catch Documentation Scheme
Catch estimates from CDS Documents (2010-2016). The conversion factors shown in Table 2 were used to convert processed weights into whole weight estimates. Data for 2016 may be incomplete due to time lags in the CDS. No correction is made for missing documents. Highlighted cells show cases where CDS estimates are higher than nationally reported catch, which is unexpected.
(i) Catch Year is taken from the Harvest Data provided on the Catch Monitoring Form or Farm Stocking Form (for Farms)(ii) Catch data from Farms is taken from the Farm Stocking Forms. The catch harvest dates are used to apportion catch to years. When the catch harvest dates span across years, the catch has been apportioned to each year based on the number of days of harvest in each year since no detailed catch information is on the farm stocking forms. These estimates by year will therefore not always match actual catch.(iii) Taiwan advised that the cases where its reported catch was lower than the CDS estimate was due to weights for the CDS being measured at sea, which is not as accurate as its landed weight measurements (which were lower). According to Taiwan’s regulations, fishers are requested to report landed weight after the sale of the catch relating to each document. Taiwan advised that the landed whole weight was not higher than its reported catch.
Estimated Whole Weight of Catch (tonnes) from CDS
Attachment D
Table 2: Conversion factors which were used to convert processed weights to whole weights in Table 1 when a conversion factor was not supplied.
CDS CodeBLOBMDRDRDRO,DRTFLGG,GGOGGH,GGTGG,GGO,GGTGGHLOIOTRDTR
Table 3: SBT imports by country and year of export. Quantities are expressed in net weights, not whole weights. Re-exports are not included in this table.
ExportYear Japan USA Korea China Australia South Africa Singapore Russia
United Kingdom Hong Kong Mauritius Thailand Others (ii) Unknown (iii)
2010 9077.9 167.3 13.9 2.3 0.5 1.6 14.6 6.4 7.5 0.1 2.8 1.1 15.62011 9264.0 204.6 64.9 0.3 1.3 1.9 1.2 7.7 0.2 0.1 0.2 11.22012 9433.8 188.9 111.2 2.2 3.5 2.9 0.0 1.7 0.32013 10558.4 51.1 112.9 20.9 2.5 1.9 0.9 0.2 0.3 0.2 4.62014 11713.6 27.3 7.5 98.7 1.4 0.1 0.1 0.1 0.9 0.52015 11601.5 23.2 69.5 20.1 2.8 7.3 0.1 2.5 1.12016 11863.8 50.4 0.2 3.3 13.1 5.3 0.0 3.6 0.3
(i) Figures in Table 3 are taken from CDS Catch Monitoring Forms(ii) Includes: Canada, Fiji, Italy, New Zealand, Malaysia, Norway, and Switzerland(iii) Net weight from CDS Catch Monitoring Forms where the export destination was not provided.
Flag Product Type Conversion Factor
ID Belly meat 2.5JP Block 2.5
AU Dressed 1.2NZ,ZA Dressed 1.8AU,ID,NZ,TW,ZA Dressed - tail on, Dressed - tail off 1.8AU,ID,NZ Fillet 2.5AU Gilled and gutted, Gilled and gutted - tail on 1.12 x processed weight + 1kg per fishAU Gilled and gutted - head removed, Gilled and gutted - tail off 1.176
ID,JP,KR,NZ,PH,TW,ZA Gilled and gutted, Gilled and gutted - tail on, Gilled and gutted - tail off 1.15
NZ,TW,ZA Gilled and gutted - head removed 1.5AU,NZ Loins 2.5AU,ID,NZ,ZA Other 1.15
Net Weight of Imports by Country (tonnes) from CDS (i)
AU,ID,NZ Round 1ID Toro 2.5