OF PUBLIC SAFETY - NCJRS · DEPARTMENT OF PUBLIC SAFETY PATROL DIVISION . Murder & Non-Negligent...
37
• • • -i'DEPARTMENT OF . PUBLIC SAFETY STATISTJICAL ANNUAL R'lBJPORT 1918 If you have issues viewing or accessing this file, please contact us at NCJRS.gov.
-
Upload
nguyenthuy -
Category
Documents
-
view
220 -
download
1
Transcript of OF PUBLIC SAFETY - NCJRS · DEPARTMENT OF PUBLIC SAFETY PATROL DIVISION . Murder & Non-Negligent...
•
•
•
-i'DEPARTMENT OF
. PUBLIC SAFETY
STATISTJICAL
ANNUAL R'lBJPORT
1918
If you have issues viewing or accessing this file, please contact us at NCJRS.gov.

•
.. I •
•
•
'. •
•
•
•
---- ----- ----
CITY OF SUNNYVALE
DEPARTMENT OF PUBLIC SAFETY
, 'YEAR OF 1978
SECTION
I
II
III
IV
V
VI
VII
1978 ANNUAL STATISTICAL REPORT
CONT~NTS i 'I:\§~
ORGANIZATION AND PERSONNEL 1 -2
1978 STATISTICAL DATA 3 ·10
1977 - 1978 STATISTICAL COMPARISON 11-16
1969 - 1978 STATISTICAL COMPARISON 17 ·21
1978 CRIME BREAKDOWN
1978 ARREST BREAKDOWN
1978 ACTIVITY SUMMARY
FEB 71979
ACQUISITIOK',{S
2'2-24
25-27
28-29
Compiled by M. Rodriguez
Principal Office Assistant January 17, 1979

•
•
•
..
..
•
• •
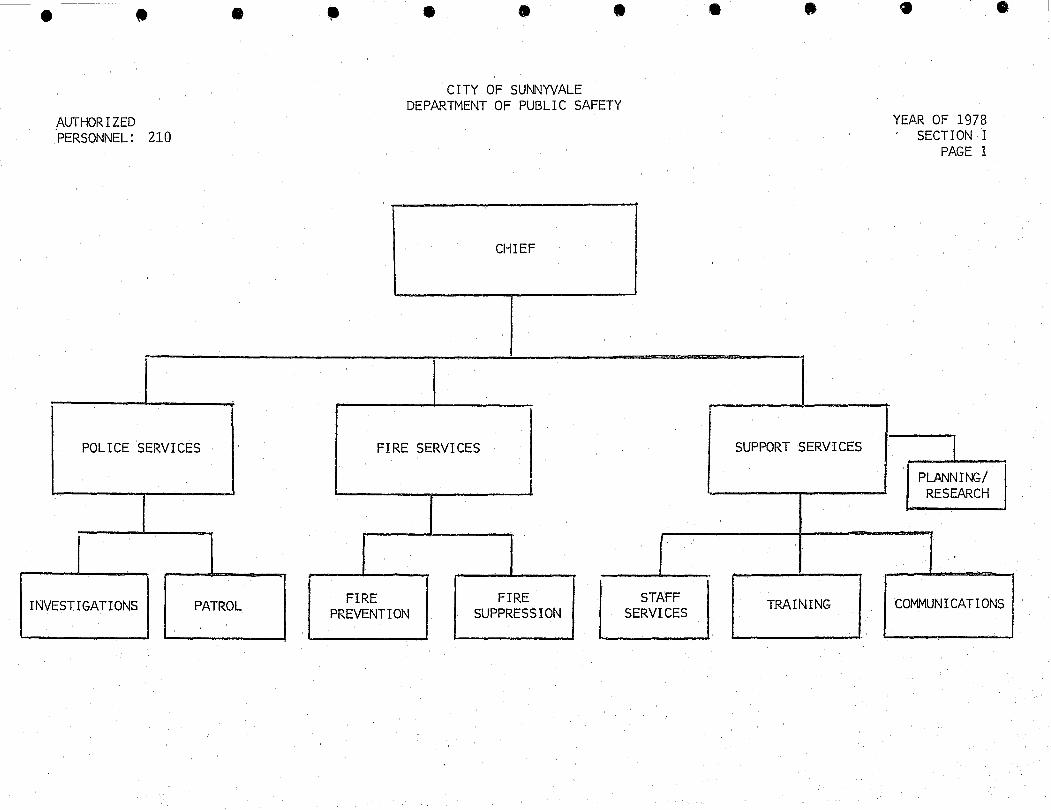
,AUTHOR I ZED PERSONNEL: 210
• • • • CITY OF SUNNYVALE
DEPARTMENT OF PUBLIC SAFETY
CHIEF
•
~----------------------------~------~--------------==--~--------~
POLICE SERVICES
:----...&.-_--,~
INVESTIGATIONS PATROL
FIRE SERVICES
FIRE PREVENTION
FIRE SUPPRESSION
STAFF SERVICES
SUPPORT SERVICES
TRAINING
•
YEAR OF 1978 SECTION I
PAGE 1
I PLANN I NG/
RESEARCH
•
COMMUNICATIONS

'. •
•
•
•
•
•
•
•
•
CITY OF SUNNYVALE DEPARTMENT OF PUBLIC SAFETY
DEPARTMENT PERSONNEL STRENGTH
UNIFORM PERSONNEL
Chief Comrilanders Captains Lieutenants Public Safety Officers
TOTAL
CIVILIAN PERSONNEL
Administrative Assistants Communications Supervisors Connmmications Officers Clerks/Secretaries Computer Operator Public Safety Property.C1erk
TOTAL
TOTAL DEPARTMENT STRENGTH
TEMPORARY PERSONNEL
Cadets Crossing Guards
TOTAL
AlJl1;OR I ZED 1977
1 3 6
35 135
2 1 9
16 3 1
19 20
180
32'
212
39
AUTHORIZED 1978
1 ;; 6
35 135
2 1 9
16 1 1
18 23
180
30
210
41
YEAR OF 1978 SECTION I
PAGE 2
ACTUAL AS OF 12-31-78
1 3 5
35 135
2 1 9
15 0. 1
18 23
179
38
207
41
•
•
• .1
•
•
•
•
•
•
•
•
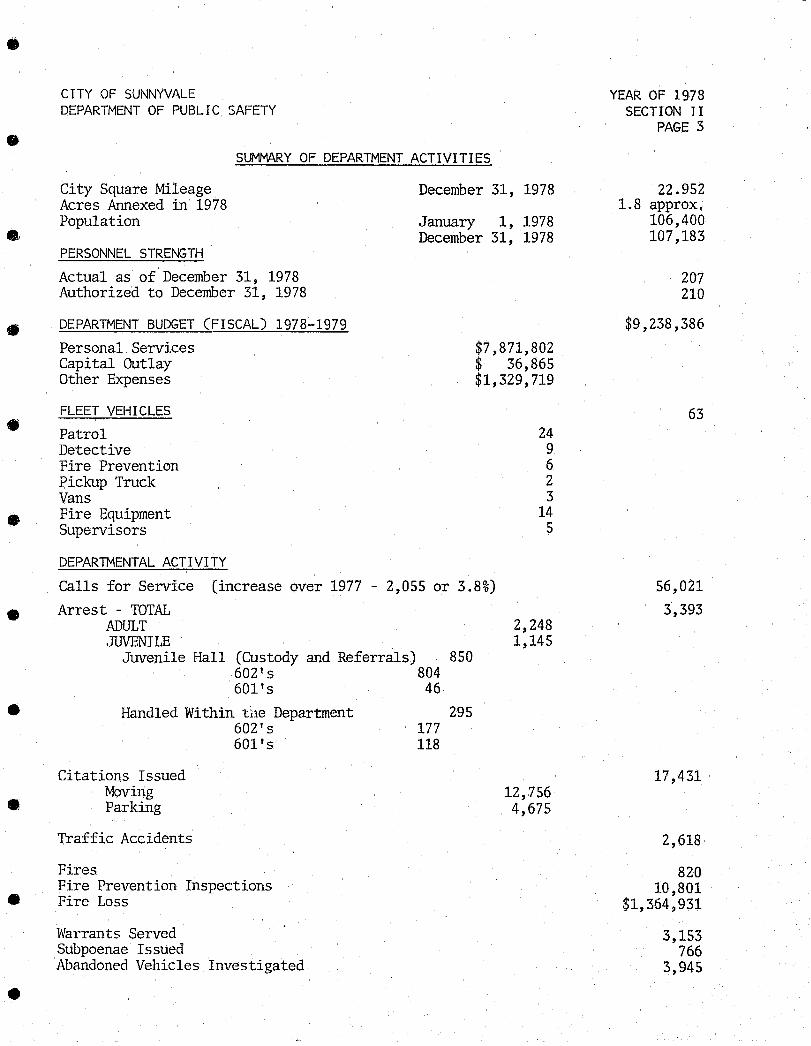
CITY OF SUNNYVALE DEPARTMENT OF PUBLIC SAFETY
SUMMARY OF DEPARTMENT ACTIVITIES
City Square Mileage Acres Annexed in 1978 Population
PERSONNEL STRENGTH
Actual as of December 31, 1978 Authorized to December 31, 1978
DEPARTMENT BUDGET (FISCAL) 1978-1979
Personal Services Capi tal Outlay Other Expenses
FLEET VEHICLES
Patrol Detective Fire Prevention Pickup Truck Vans Fire Equipment Supervisors
DEPARTMENTAL ACTIVITY
December 31, 1978
January 1, 1978 December 31, 1978
$7,871,802 $ 36,865 $1,329,719
24 9 6 2 3
14 5
Calls for Service (increase over 1977 - 2,055 or 3.8%)
Arrest - TOTAL ADULT JUVENILE
Juvenile Hall (Custody and Referrals) 850 602's 804 601's 46
Handled Wi thin t . .11e Department 602's
Citations Issued Moving Parking
Traffic Accidents
Fires
601's
Fire Prevention Inspections Fire Loss
Warrants Served Subpoenae Issued Abandoned Vehicles Investigated
177 118
295
2,248 1,145
12,756 4,675
YEAR OF 1978 SECTION II
PAGE 3
22.952 1.8 approx.
106,400 107,183
207 210
$9,238,386
63
56,021
3,393
17 ,431
2,618
820 10,801
$1,364)931
3,153 766
3,945

•
•
•
•
•
•
•
•
CITY OF SUNNYVALE DEPARTMENT OF PUBLIC SAFETY
PATROL DIVISION
. Murder & Non-Negligent Manslaughter
Forcible Rape
Robbery
Aggravated Assault
Burglary
Larceny-Theft
Aut9 Theft
CRIME INDEX TOTAL
~~ Manslaughter by Negligence
~~ Other Assaults - Not Aggravated
TOTAL PART I CRIMES
:: PART I CRIMES PER 100, 000 POPULATION (107,183 as of December 31, 1978)
:C FBI UNIFORM CRIME REPORTING PER 100,000 Population Ratio does not include
. .. Manslaughter by Negligence and Other Assaults - Not Aggravated
•
•
YEAR OF 1'978 SECTION I I
PAGE 4 ..
5
21
122
125
1,145
3,466
482
5,366
1
298
5,665
* 5,255.5
•
•
•
..
•
•
•
•
•
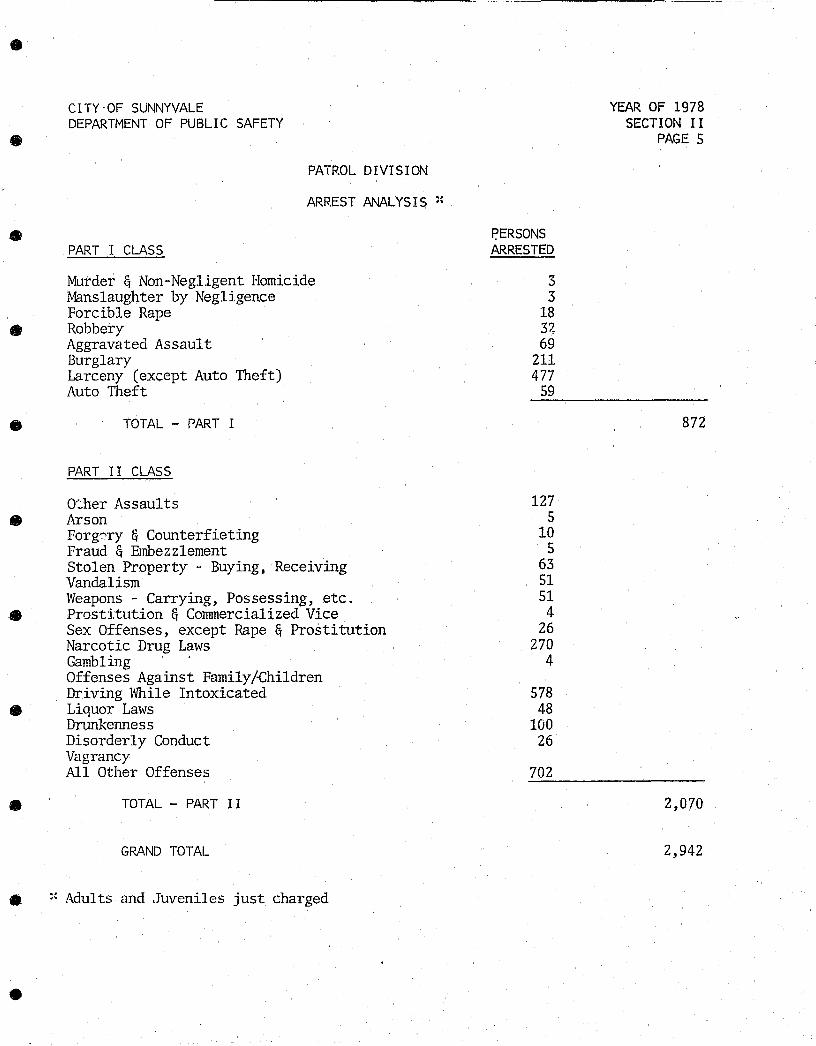
CITY·OF SUNNYVALE DEPARTMENT OF PUBLIC SAFETY
PART I CLASS
PATROL DIVISION
ARREST ANAL YS I S ~:
Murder & Non-Negligent Homicide Manslaughter by Negligence Forcible Rape Robbery Aggravated Assault Burglary Larceny (except Auto Theft) Auto Theft
TOTAL - PART I
PART I I CLASS
O:her Assaults Arson Forg~ry & Counterfieting Fraud & Embezzlement Stolen Property - Buying, Receiving Vandalism Weapons - Carrying, Possessing, etc. Prostitution & Connnercialized Vice Sex Offenses, except Rape & Prostitution Narcotic Drug Laws Gambling Offenses Against Family/~hildren Driving While Intoxicated Liquor Laws Drunkenness Disorderly Conduct Vagrancy All Other Offenses
TOTAL - PART I I
GRAND TOTAL
• :: Adults and Juveniles just charged
•
PERSONS ARRESTED
3 3
18 32 69
211 477
59
127 5
10 5
63 51 51 4
26 270
4
578 48
100 26
702
YEAR OF 1978 SECTION I I
PAGE 5
872
2,070
2,942

•
•
e·
•
•
•
•
•
•
CITY OF SUNNYVALE DEPARTMENT OF PUBLIC SAFETY
PATROL DIVISION
TRAFFIC SU~Y
MOTOR VEHICLE ACCIDENTS
Fatal Accidents Injury Accidents (includes 51 Pedestrian and
72 Bicycle Accidents) Property Damage Accidents
TRAFFIC CITIATIONS, COr-'PLAINTS AND ARRESTS
Hazardous Violations At Accidents Non-Accidents Driving While Intoxicated Arrests
Non-Hazardous Violations Parking Violations
TRAFFIC FATALITIES & INJURED PARTIES
Fatalities Injured Parties
:: ENFORCEMENT INDEX -' MODIFIED
(NUnber of Hazardous Traffic Arrests vs Fatal and Non-Fatal Injury Accidents)
:::: .IRAFFIC. LOSS
Fata.l Accidents 13 @ $125,000 Injury Accidents 878 @ $ 4,700 Property Damage 1,727 @ $ 670
= = =
878 1,727
844 11,750
581
162 4,675
15 1,095
$1,625,000 $4,126,600 $1,157,090
YEAR OF 1978 SECTION II
PAGE 6
2,618
18,012
14.79
:: Index figure does not include Hazardous Violation Complaints obtained, due to • change in Department policy during 1965.
•
:m Cost per accident figures derived from National Traffic Safety Memo #113, dated July, 1977.

•
•
•
•
•
•
•
•
•
CITY OF SUNNYVALE DEPARTMENT OF PUBLIC SAFETY
TOTAL FIRES
BUILDING FIRES
Public Assembly Educational Institutional Dwellings 1 & 2 Apartments Rooming-Boarding Houses Hotel, Inn Motor Hotel, Motel MObile Homes, Trailers Other Residential Mercantile/Offices Utilities/Laboratories Industrial Storage
OTHER FIRES
Construction Unoccupied Special Structures Outdoor Properties Railroad Property Road Property Transport Vehicle Special Vehicle
FIRE DIVISION
11 4 1
135 8S
2 1 8
14 8
27 12
6 2
312
12 174
6
308
512
YEAR OF 1978 SECTION r I
PAGE 7
820
•
•
•
•
•
•
•
•
•
•
•
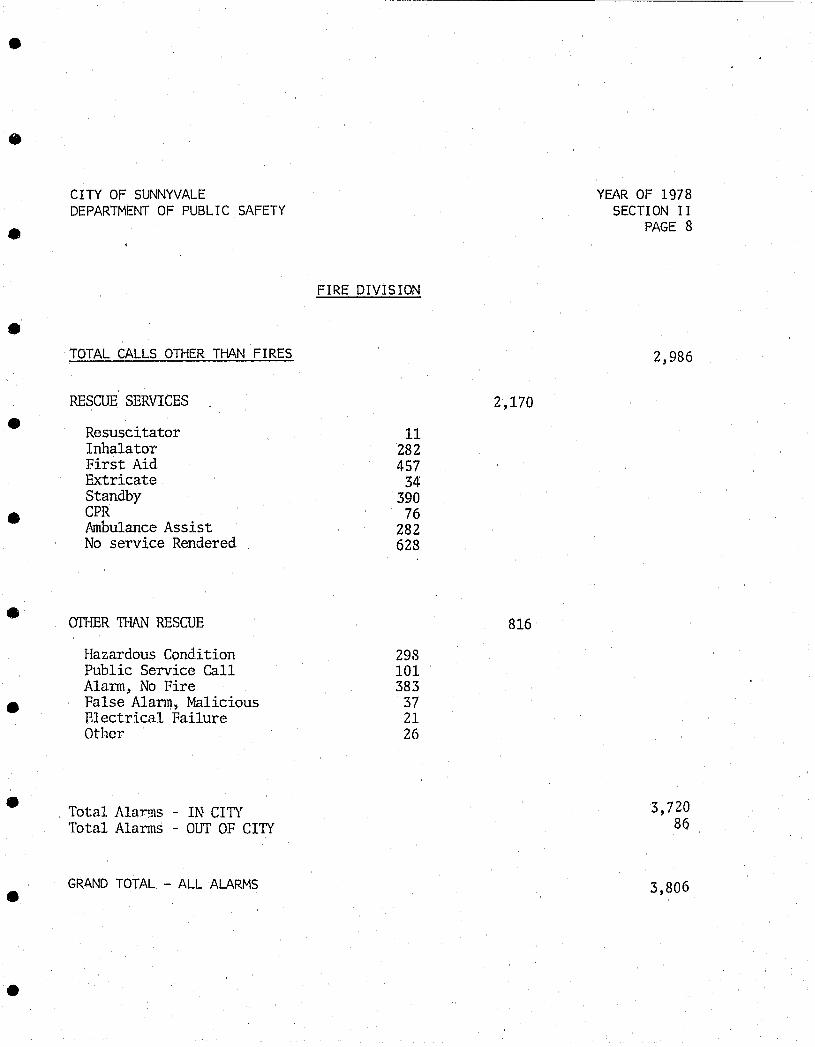
CITY OF SUNNYVALE DEPARTMENt OF PUBLIC SAFETY
TOTAL CALLS OTHER THAN FIRES
RESCUE SERVICES
Resuscitator Inhalator First Aid Extricate Standby CPR Ambulance Assist No service Rendered
OTI-lER TIIAN RESCUE
Hazardous Condition Public Service Call Al ann , No Fire False Alann, Malicious Electrical Failure Other
Total Ala~s - IN CITY Total Alanns - OUT OF CITY
GRAND TOTAL - ALL ALARMS
FIRE DIVISION
11 282 457
34 390
76 282 628
298 101 383
37 21 26
2,170
816
YEI'\R OF 1978 SECTION I I
PAGE 8
2,986
3,720 86
3,806

•
•
•
•
•
•
•
•
•
•
•
CITY OF SUNNYVALE DEPARTMENT OF PUBLIC SAFETY
TOTAL FIRE LOSS
Building Loss (Property) Building Loss (Contents) Other Loss (Property) Other Loss (Contents)
Citizens Killed by Fire Citizens Injured by Fire Personnel Killed by Fire Personnel Injured by Fire
* Fires per 1,000 Population
FIRE D [VIS ION
* Fire Loss per 1,000 Population Average Fire Loss per Building Fire
* Fire Loss per Capita
FIRE PREVENTION
Inspections Re-Inspections Number of Violations Detected Viola.tions Corrected Permits Issued Complaints Investigated Plan Checks Lectures and Demonstrations Total Audience
* Population 107,183 (as of December, 1978)
$ 922, 737 $444,335 $ 34,718 $ 3,141
YEAR OF 1978 SECTION II
PAGE 9
$1,4'(}4,931
2 8
20
7.65 $ 13,108 $ 4,438 $ 13.11
10,801 4,976
11,837 9,722
100 243 795 264
7,016

•
•
•
•
•
•
•
•
•
•
•
CITY OF SUNNYVALE DEPARTMENT OF PUBLIC SAFETY
~OSS DUE TO TRAFFIC, FIRE AND CRIME
$6,908,690
:: TRAFF I C LOS S
Scale: 1/4" = $100,000
$1,404,931
FIRE LOSS
YEAR OF 1978 SECTION I I
PAGE 10
$1,285,704
CRIME LOSS
); Traffic loss figures derived from National Traffic Safety Memo #113, dated July,. 1977
Fatal accidents Injury accidents Property Damage:
13 878
1,727
.@ $125,000 = $1,625,000 @ $ 4,700 = $4,126,600 @ $ 670 = $1,157,090

•
•
•
•
•
•
•
•
•
•
•
• • • • • • • • • • • CITY OF SUNNYVALE ·YEAR OF 1978 DEPARTMENT OF PUBLIC SAFETY SECTION III
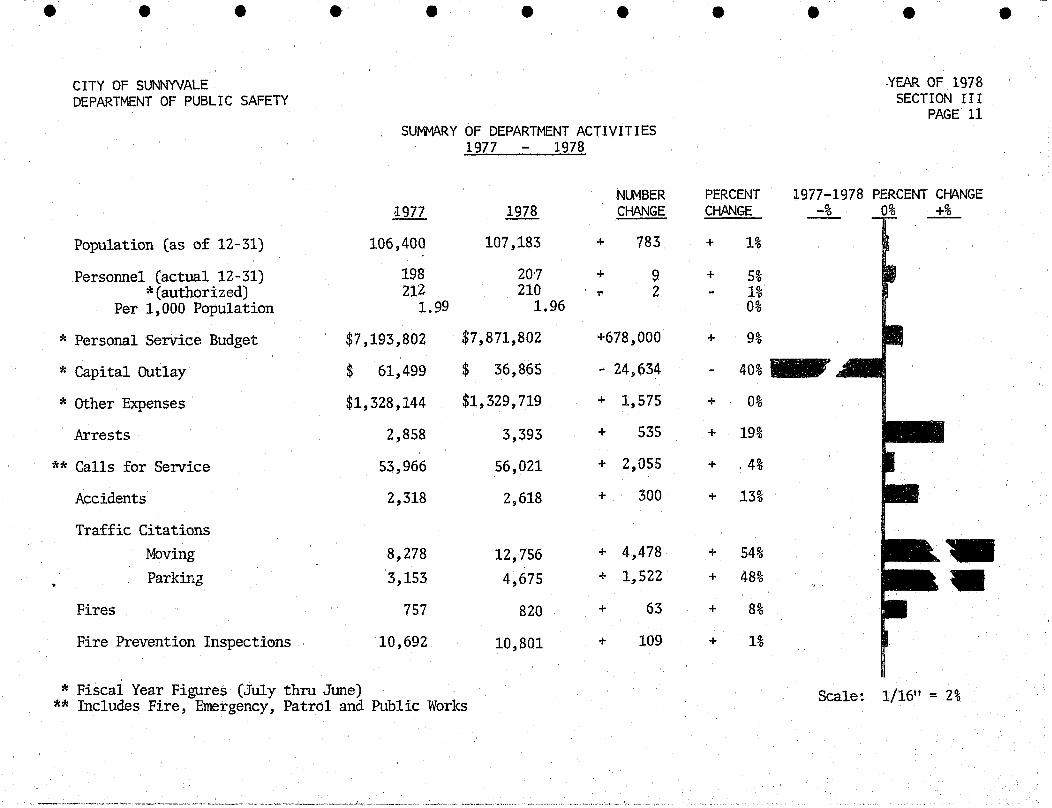
PAGE 11 SUMMARY OF DEPARTMENT ACTIVITIES
1977 1978
NLMBER PERCENT 1977-1978 PERCENT CHt\NGE J.977 1978 CHANGE CHANGE -% +%
Population (as of 12-31) 106,400 107,183 + 783 + 1%
Personnel (actual 12-31) 198 20-7 + 9 + 5% * (authorized) 212 210 ,. 2 1%
Per 1,000 Population 1.99 1.96 0%
* Personal Service Budget $7,193,802 $7,871,802 +678,000 + 9%
* Capital Outlay $ 61,499 $ 36,865 - 24,634 40% ...,.,
* Other Expenses $1,328,144 $1,329,719 + 1,575 + 0%
Arrests 2,858 3,393 + 535 + 19%
** Calls for Service 53,966 56,021 + 2,055 + .4%
Accidents 2,318 2,618 + 300 + 13%
Traffic Citations Moving 8,278 12,756 + 4,478 + 54% -Parking 3,153 4,675 + 1,522 + 48% • Fires 757 820 + 63 + 8%
Fire Prevention Inspections 10,692 10,801 + 109 + 1%
* Fiscal Year Figures (July thru June) ** Includes Fire, Emergency, Patrol and Public Works
Scale! 1/16" = 2%
----.. -~-.- ... - .... -----'<.--.... ,'"'-- ... ~---- - .~--<",.-.-'-"-------~ .. --.--.-------'"

•
•
•
•
•
•
•
•
•
•
•
CITY OF SUNNYVALE DEPARTMENT OF PUBLIC SAFETY
CLASSIFICArION OF OFFENSES
P,ATROL DIVISION
PART I CRIME 1977 - 1978
1-977
MUrder & Non-negligent manslaughter 3
Forcible Rape 18
Robbery 123
Aggravated Assault 87
Burglary 1,274
Larceny - Theft 3,045
Auto Theft 416
CRIME INDEX TOTAL 4,966
Manslaughter by Negligence 1
Other Assaults - Not Aggravated 317
TOTAL PART I OFFENSES 5,284
NUMBER 1-978 CHANGE
5 + 2
21 + 3
122 1
125 + 38
1,145 - 129
3,466 + 421
482 + 66
5,366 + 400
1
298 19
5,665 + 381
YEAR OF 1978 'SECTION I II
PAGE 12
. PERCENT CHANGE
+ 67%
+ 17%
1%
+ 44%
10%
+ 14%
+ 16%
+ 8%
6%
+ 7%
• ~ITY OF SUNNYVALE YEAR OF 1978 DEPARTMENT OF PUBLIC SAFETY SECTION III
• PAGE 13
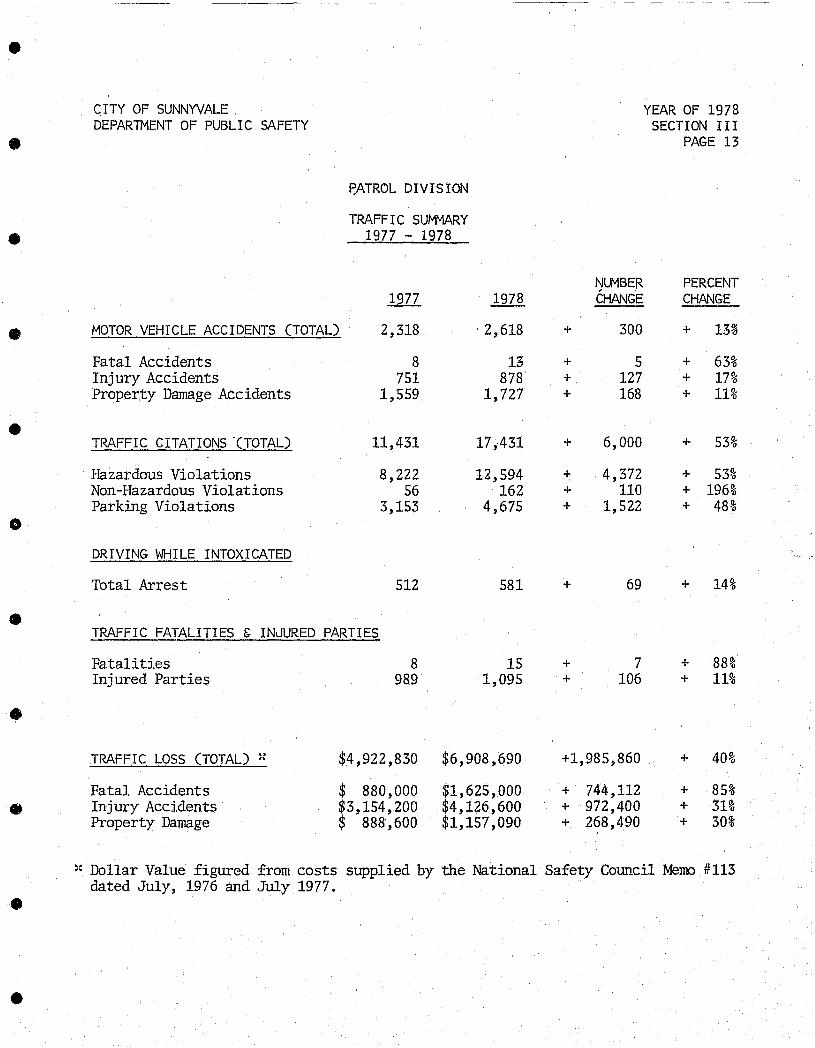
PATROL DIVISION
TRAFFIC SUf'lMARY
• 1977 - 1978_
~LMBER PERCENT 1977 1,978 CHANGE CHANGE
• MOTOR VEHICLE ACCIDENTS (TOTAL) 2,318 2,618 + 300 + 13~
Fatal Accidents 8 13 + 5 + 63% Injury Accidents 751 878 + 127 + 17% Property Damage Accidents 1,559 1,727 + 168 + 11%
• TRAFFIC CITATIONS '(TOTAL) 11,431 17,431 + 6,000 + 53%
Hazardous Violations 8,222 12,594 + 4,372 + 53% Non-Hazardous Violations 56 162 + 110 + 196% Parking Violations 3,153 4,675 + 1,522 + 48%
0
DRIVING WHILE INTOXICATED
Total Arrest 512 581 + 69 + 14%
• TRAFFIC FATALITIES & INJURED PARTIES
Fatalities 8 15 + 7 + 88% Injured Parties 989 1,095 + 106 + 11%
• TRAFFIC LOSS (TOTAL) .. $4,922,830 $6,908,690 +1,985,860 + 40% .-
Fatal Accidents $ 880,000 $1,625,000 + 744,112 + 85%
• Injury Accidents $3,154,200 $4,126,600 + 972,400 + 31% Property Damage $ 888',600 $1,157,090 + 268,490 + 30%
~: Dollar Value figured from costs supplied by the National Safety Council Memo #113 dated July, 1976 and July 1977.
•
•
•
• .CITY OF SUNNYVALE YEAR OF 1978 DEPARTMENT OF PUBLIC SAFETY SECTION I II
PAGE 14
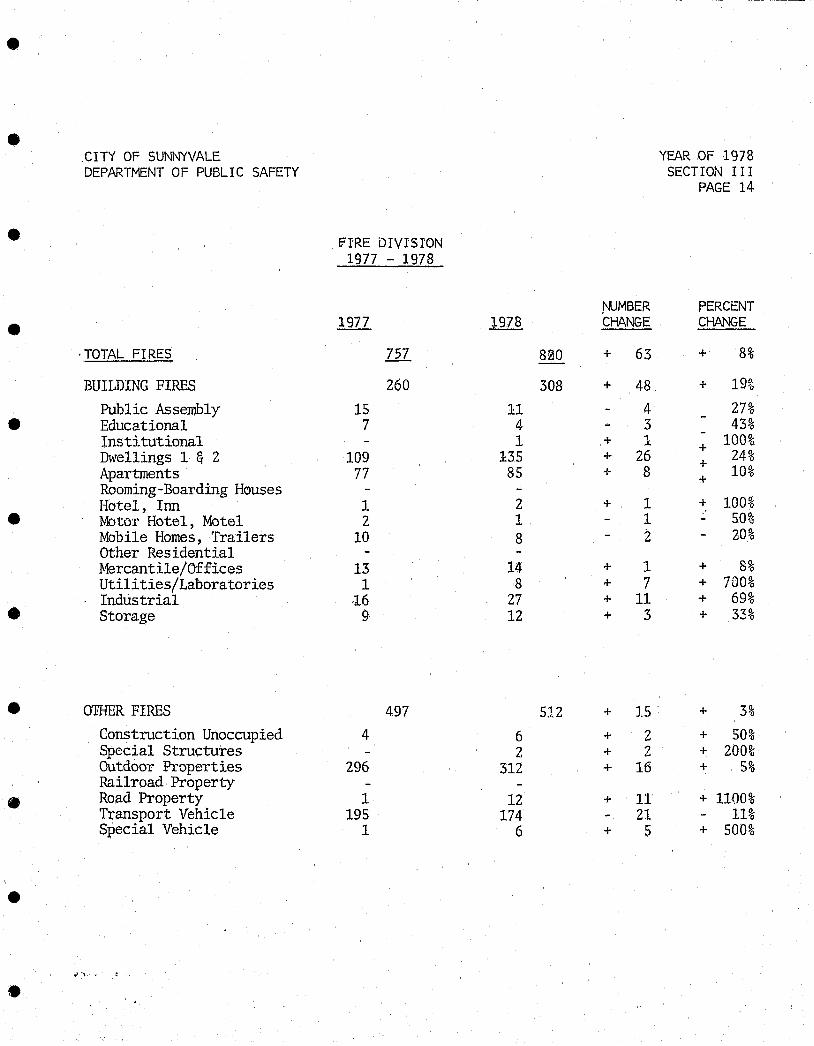
• fIRE DIVISION 1977 - 1978
,NUMBER PERCENT
• 1977 1978 CHANGE CHANGE
-TOTAL FIRES 757 800 + 63 + 8%
BUILDING FIRES 260 308 + 48 + 19%
Public Assembly 15 11 4 27%
• Educational 7 4 3 43% Institutional 1 + 1 100% + Dwellings 1 & 2 109 135 + 26 24% + Apartments 77 85 + 8 10% + Rooming-Boarding Houses Hotel, Inn 1 2 + 1 + 100%
• Motor Hotel, Motel 2 1. 1 - 50% Mobile Homes, Trailers 10 8 2 20% Other Residential Mercantile/Offices 13 14 + 1 + 8% Utilities/Laboratories 1 8 + 7 + 700% Industrial ·16 27 + 11 + 69%
• Storage 9 12 + 3 + 3u ...-0
• O'FHER FIRES 497 51.2 + 15· + 3%
Construction Unoccupied 4 6 + 2 + 50% Special Structures 2 + 2 + 200% Outdoor Properties 296 312 + 16 + 5% Railroad Property
• Road Property 1 12 + 11 + 1100% Transport Vehicle 195 174 21 11% Special Vehicle 1 6 + 5 + 500%
•
•
•
•
•
•
•
•
•
•
•
•
•
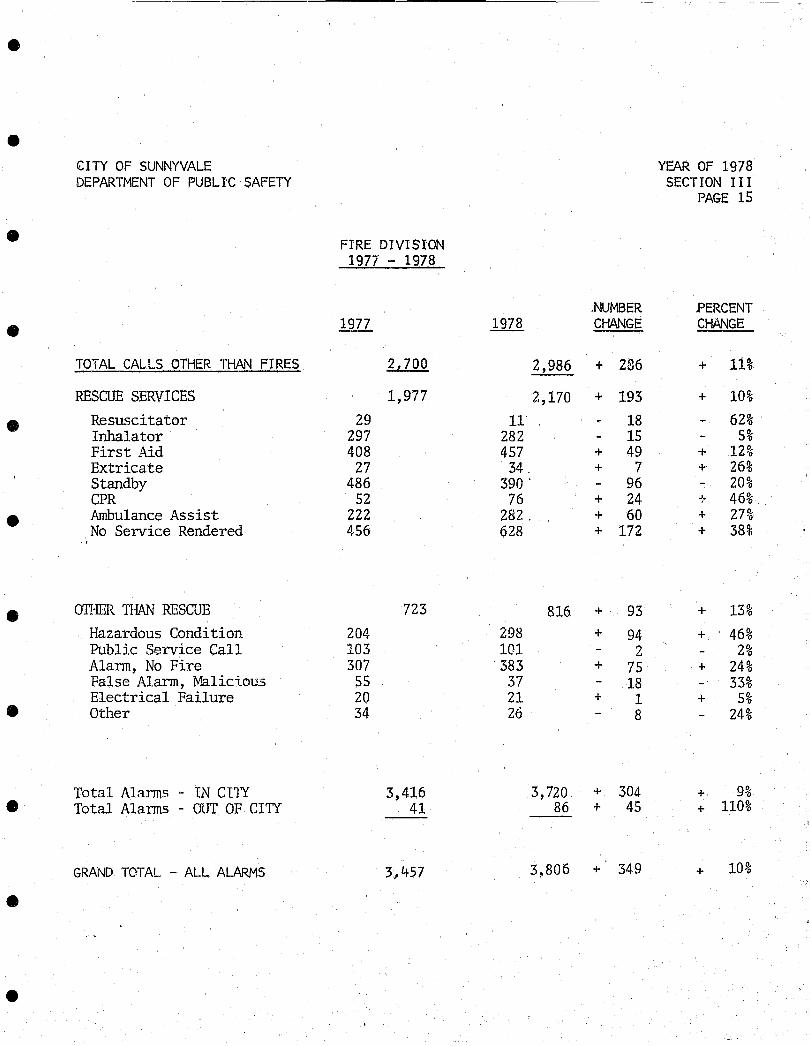
€ITY OF SUNNYVALE DEPARTMENT OF PUBLTC SAFETY
TOTAL CALLS OTHER THAN FIRES
RESCUE SERVICES
Resuscitator Inhalator First Aid Extricate Standby CPR Ambulance Assist No Service Rendered
OIHER 1HAN RESCUE Hazardous Condition Public Service Call Alarm, No Fire False Alarm, Malicious Electrical Failure Other
Total Alarms - IN CI1Y Total Alarms - OUT OF CITY
GRAND TOTAL - ALL ALARMS
FIRE DIVISION 1977 - 1978
1977
29 297 408
27 486
52 222 456
204 103 307
55 20 34
2,700
1,977
723
3,416 41
3,457
1978
11 282 457
34. 390 .
76 282. 628
298 101
' 383 37 21 26
.NUMBER CHANGE
2,986 + 286
2,170 + 193
18 15
+ 49 + 7
96 + 24 + 60 + 172
816 + 93 + 94
2 + 75
18 + 1
8
3,720 + 304-86 + 45 --
3,806 + 349
YEAR OF 1978 SECTION III
PAGE 15
PERCENT CHANGE
+ 11%
+ 10%
62% 5%
+ 12% + 26%
20% + 46% + 27% + 38%
+ 13%
+ 46% 2%
+ 24% 33%
+ 5% 24%
+ 9% + 110%
+ 10%
•
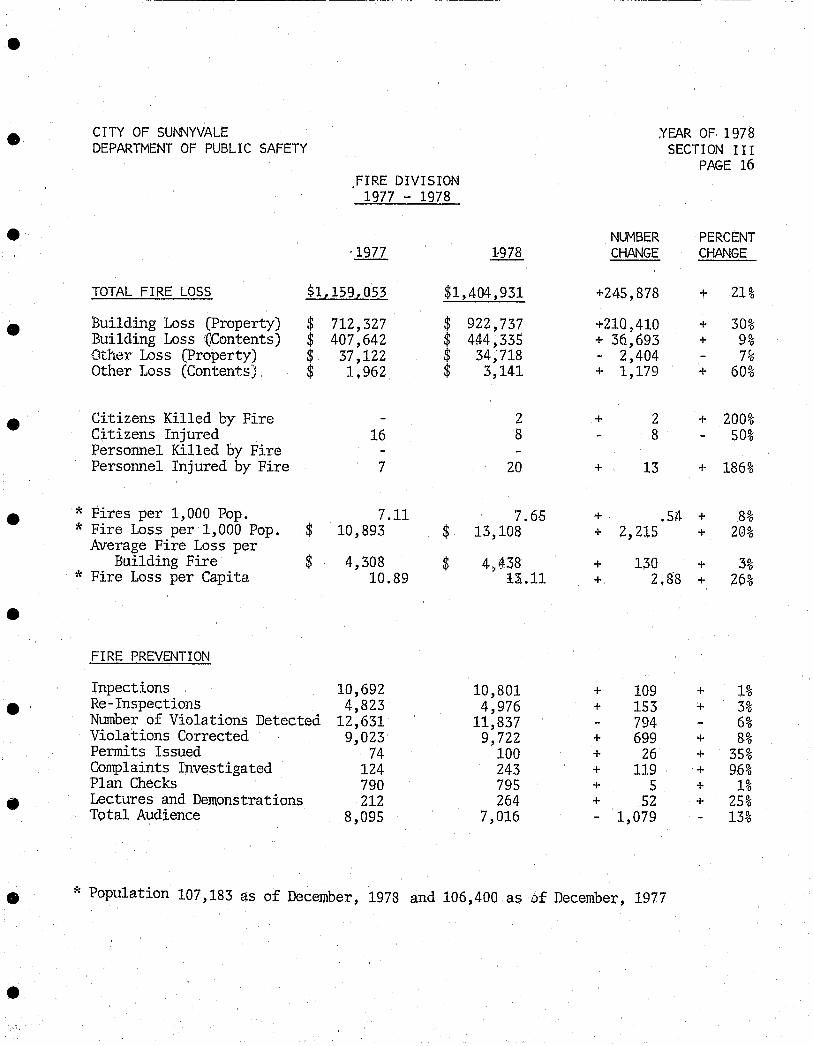
• CITY OF SUNNYVALE .YEAR OF 1978 DEPARTMENT OF PUBLIC SAFETY SECTION I II
PAGE 16 ,FIRE DIVISION
1977 - 1978
• NUMBER PERCENT ·1977 1978 CHANGE CHANGE
TOTAL FIRE LOSS $1,159,053 $1,404,931 +245,878 + 21%
• Building Loss (Property) $ 712,327 $ 922,737 +21Q,410 + 30% Building Loss ICContents) $ 407,642 $ 4a4 ,335 + 36,693 + 9% Other Loss (Property) $ 37,122 $ 34,718 - 2,404 7% Other Loss (Contents) $ 1,962 $ 3,141 + 1,179 + 60%
• Citizens Killed by Fire 2 + 2 + 200% Citizens Injured 16 8 8 50% Personnel Killed by Fire Personnel Injured by Fire 7 20 + 13 + 186%
• * Fires per 1,000 Pop. 7.11 7.65 + .54 + 8% * Fire Loss per 1,000 Pop. $ 10,893 $ 13,108 + 2,215 + 20%
Average Fire Loss per $ Building Fire 4,308 $ 4,438 + 130 + 3% * Fire Loss per Capita 10.89 ll.11 + 2,88 + 26%
• .FIRE PREVENTION
Inpections 10,692 10,801 + 109 + 1%
• Re-Inspections 4,823 4,976 + 153 + 3% Number of Violations Detected 12,631 11,837 794 6% Violations Corrected 9,023 9,722 + 699 + 8% Permits Issued 74 100 + 26 + 35% Complaints Investigated 124 243 + 119 + 96% Plan Checks 790 795 + 5 + 1%
• Lectures and Demonstrations 212 264 + 52 + 25% Total Audience 8,095 7,016 - 1,079 13%
• * Population 107,183 as of December, 1978 and 106,400 as of December, 1977
•

•
•
•
•
•
•
•
•
•
•
•
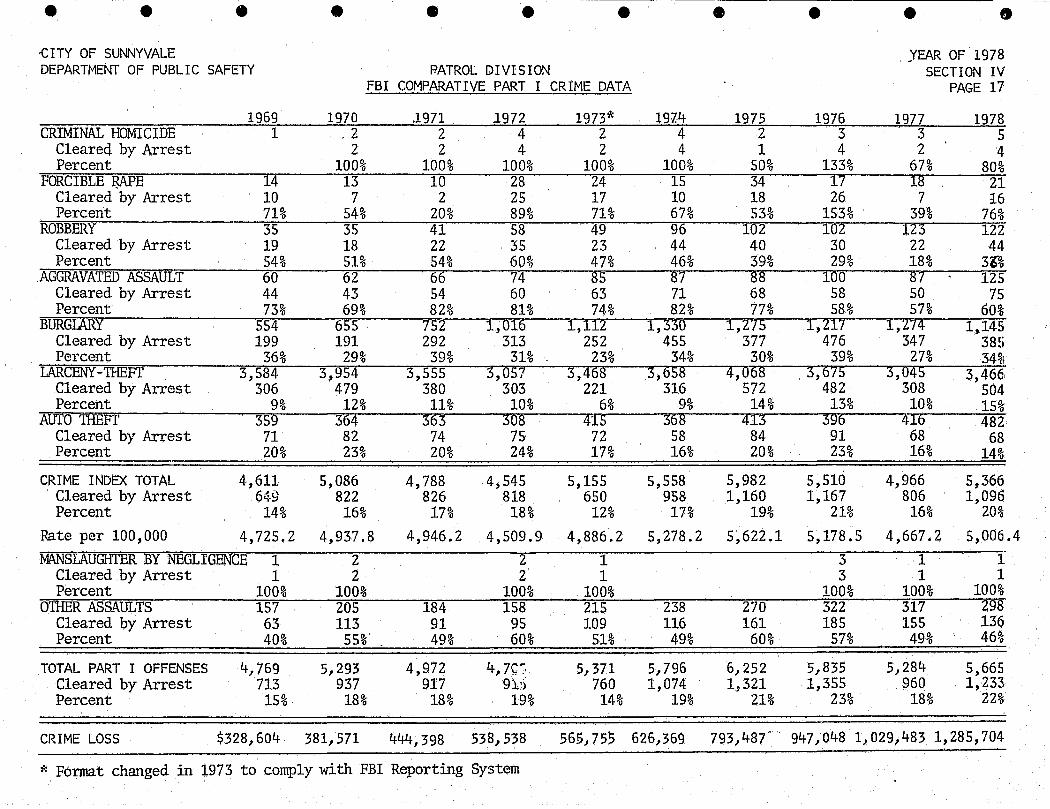
• • • • • • • • • • • -CITY OF SUNNYVALE JEAR OF 1978 DEPARTMENT OF PUBLIC SAFETY PATROL DIVISION SECTION IV
FBI COMPARATIVE PART I CRIME DATA PAGE 17
1969 1970 .1971 1972 1973* 197:4 1975 1976 1977 1978 CRIMINAL HOMICIDE 1 .2 2 4 2 4 2 3 3 5
C1eareq by Arrest 2 2 4 2 4 1 4 2 4 Percent 100% 100% 100% 100% 100% 50% 133% 67% 80%
FORCIBLE JW'E 14 13 10 28 24 15 34 17 18 21 Cleared by Arrest 10 7 2 25 17 10 18 26 7 16 Percent 71% 54% 20% 89% 71% 67% 53% 153% 39% 76%
ROBBERY 35 35 41 58 49 96 102 102 123 122 Cleared by Arrest 19 18 22 2S5 23 44 40 30 22 44 Percent 54% 51% 54% 60% 47% 46% 39% 29% 18% 3Z%
AGGRAVATED ASSAULT 60 62 66 74 85 87 88 100 87 125 Cleared by Arrest 44 43 54 60 63 71 68 58 50 75 Percent 73% 69% 82% 81% 74% 82% 77% 58% 57% 60%
BURGIARY 554 655 752 1,016 1,112 1,330 1,275 1,217 1,274 1,145 Cleared by Arrest 199 191 292 313 252 455 377 476 347 38S Percent 36% 29% 39% 31% 23% 34% 30% 39% 27% 34~i
LARCENY -THEFT 3,584 3,954 3,555 3,057 3,468 3,658 4,068 3,675 3,045 3,466~ Cleared by Arrest 306 479 380 303 221 316 572 482 308 504 Percent 9% 12% 11% 10% 6% 9% 14% 13% 10% 15%
Attra THEFT 359 364 363 308 415 368 413 396 416 482 Cleared by Arrest 71 82 74 75- 72 58 84 91 68 68 Percent 20% 23% 20% 24% 17% 16% 20% 23% 16% 14%
CRIME INDEX TOTAL 4,611 5,086 4,788 4,545 5,155 5,558 5,982 5,510 4,966 5,366 Cleared by Arrest 649 822 826 818 650 958 1,160 1,167 806 1,096 Percent 14% 16% 17% 18% 12% 17% 19% 21% 16% 20%
Rate per 100,000 4,725.2 4,937.8 4,946.2 4,509.9 4,886.2 5,278.2 5,622.1 5,178.5 4,667.2 5,006.4
MANSLAUGHI'ER BY NEGLIGENCE 1 2 2 1 3 1 i Cleared by Arrest 1 2 2 1 3 1 1 Percent 100% 100% 100% 100% 100% 100% 100%
OTHER ASSAULTS 157 205 184 158 215 238 270 322 317 298 Cleared by Arrest 63 113 91 95 109 116 161 185 155 136 Percent 40% 55% 49% 60% 51% 49% 60% 57% 49% 46%
TOTAL PART I OFFENSES 4,769 5,293 4,972 4, 7C,~, 5,371 5,796 6,252 5,835 5,284 5,665 Cleared by Arrest 713 937 917 91:) 760 1,074 1,321 1,355 960 1,233 Percent 15% 18% 18% 19% 14% 19% 21% 23% 18% 22%
CRIME LOSS $328,604 381,571 444,398 . 538,538 565,755 626,369 793,487" 947,048 1,029,483 1,285,704
* Format changed in 1973 to comply with FBI Reporting System
• • •
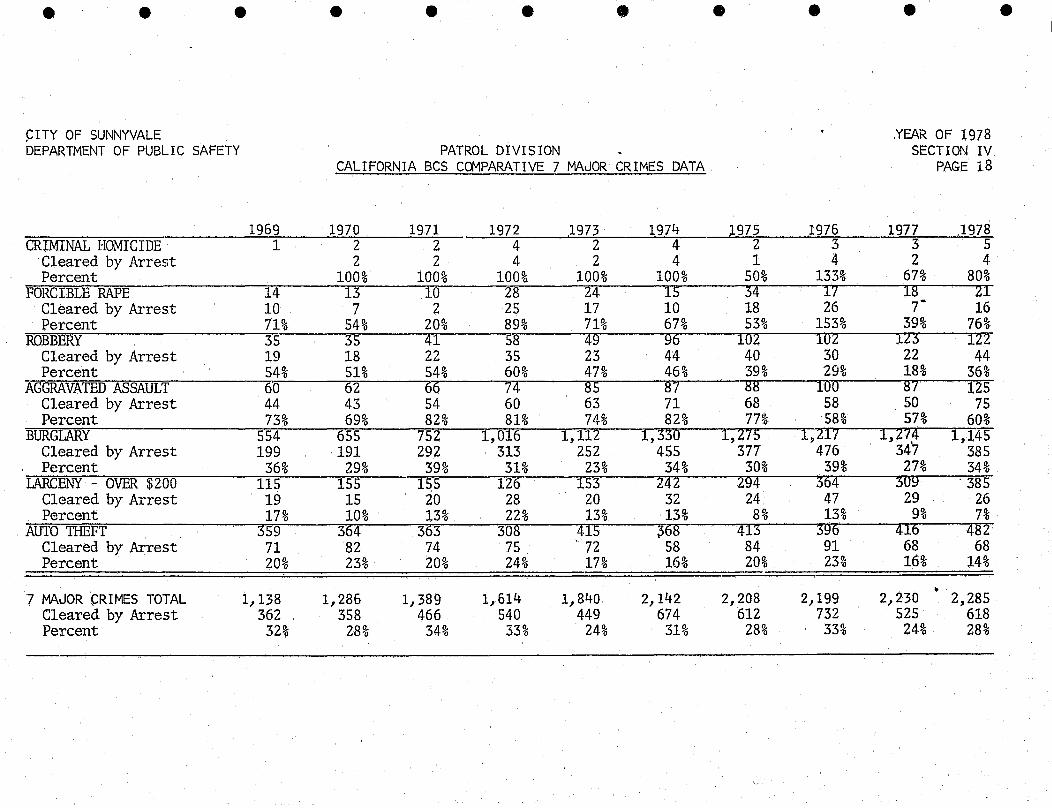
~ITY OF SUNNYVALE DEPARTMENT OF PUBLIC SAFETY
CRIMINAL HOMICIDE Cleared by Arrest Percent
FORCIBLE RAPE Cleared by Arrest Percent
ROBBERY Cleared by Arrest Percent
AGGRAVATED ASSAULT Cleared by Arrest Percent
BURGLARY Cleared by Arrest Percent
LARCENY - OVER $200 Cleared by Arrest Percent
AUTO THEFT Cleared by Arrest Percent
7 MAJOR CRIMES TOTAL Cleared by Arrest Percent
1969 1
14 10 71% 35 19 54% 6'0 44 73%
554 199
36% 115
19 17%
359 71 20%
1,138 362
32%
• • • •
PATROL DIVIS ION CALIFORNIA BCS COMPARATIVE 7 MAJOR CRIMES DATA
1970 1971 1972 ,1973 1974 2 2 4 2 4 2 2 4 2 4
100% 100% 100% 100% 100% 13 10 28 24 15
7 2 25 17 10 54% 20% 89% 71% 67% 35 41 58 49 96 18 22 35 23 44 51% 54% 60% 47% 46% 62 66 74 85 87 43 54 60 63 71 69% 82% 81% 74% 82%
655 752 1,016 1,112 1,330 191 292 313 252 455
29% 39% 31% 23% 34% 155 155 126 153 242 15 20 28 20 32 10% 13% 22% 13% 13%
364 363 308 415 $68 82 74 75 '72 58 23% 20% 24% 17% 16%
1,286 1,389 1,614 1,840 2,142 358 466 540 449 674
28% 34% 33% 24% 31%
• •
,1975 1976 2 3 1 4
50% 133% 34 17 18 26 53% 153%
102 102 40 30 39% 2£1% 88 100 68 58 77% 58%
1,275 1,217 377 476
30% 39% 294 364
24 47 8% 13%
413 396 84 91 20% 23%
2,208 2,199 612 732
28% 33%
•
.YEAR OF 1978 SECTION IV
PAGE 18
1977 .1978 3 5 2 4
67% 80% 18 21
7- 16 39% 76%
123 121 22 44 18% 36% 87 125 50 75 57% 60%
1,27,4 1,145 347 385
27% 34% 309 . 385
29 26 9% 7%
416 482 68 68 16% 14%
.. 2,230 2,285
525 618 24% 28%

• •
CITY OF SUNNYVALE DEPARTMENT OF PUBLIC SAFETY
Population (on 1-1-78)
Personnel (actual 12/31)
* (authorized) Per 1,000 Population
BUDGET * Personal Services Capital Outlay Other Expenses
Arrests
(;(Ills for Service
Accidents
Moving Citations
Parking Citations
Fires
Fire Prevention Insp.
Fire Loss
Fire Loss per Capita
Fire Fatalitie's Citizens Persormel
•
1969
97,583
174 183
1.88
$ 2,613,119 23,168
403,852
2,734
35,623
1,936
14,044
12,123
732
8,568
$ 512,989
$ 5.26
1
* Fiscal Year Figures (July to June)
•
1970
103,000
183 185
1.80
3,033,859 13,831
486,260
4,230
39,901
1,745
13,397
8,411
774
7,921
485,510
4.71
1
• • •
COMPARATIVE SUtJMlI,RY OF DEPARTMENT ACTIVITY 1969 - - - 1978
1971 1972 1973 ])974
96,800 100,777 105,500 105,300
191 194 189 194 185 187 188 190
1.91 1.86 .,
1.78 1.80
3,221,252 3,635,773 4,179,713 4,558,548 10,343 38,820 4,159 45,660
678,336 778,346 724,334 816,842
3,474 3,012 2,799 3,107
41,709 44,301 46,908 53,442
1,774 1,678 1,933 2,071
16,474 11,964 11,321 10,411
6,352 6,021 6,599 6,172
775 605 711 769
8,663 10,378 10,548 9,114
390,144 670,810 391,637 1,295,309
3.96 6.54 3.57 12.30
2 1 2
• •
1975 1976
106,400 106,400
198. 20.'3 202· 2M
1.90 lo9!!
5,616,686 6,416,502 25,987 52,020
1,036,453 1,104,490
3,212 3,147
54,067 56,701
2,071 2,146
10,023 10,427
3,215 2,827
854 824
10,414 10,307
1,761,957 950,751
16.60 8.94 .
1 4 1
• •
YEAR OF 1978 SECTION IV
PAGE 19
1977 1978
106,400 107,183
198 207 212 210
1.99 1.96
7,193,802 7,871~B02 61,499 36,865
1,328,144 1,329,719
2,858 3,393
53,966 56,021
2,318 2,618
8,278 12,756
3,153 4,675
757 820
10,692 10,801
1,159,053 1,404,931
10.89 13.11
2
----

•
•
•
•
•
•
•
•
•
CITY OF SUNNYVALE DEPARTMENT OF PUBLIC SAFETY
CQ'v1PARATIVE SUMMARY OF DEPARTMENT ACTIVITIES PERCENTAGE OF CHANGE
POPULATION PERSONNEL
UNIFORMED PATROL POLICE UNIFORMED FIRE NON-UNIFORMED
BUDGET * PERSONAL SERVICES CAPITAL OUTLAY OTHER EXPENSES
ARRESTS FBI INDEX CRIMES
CRIMINAL HCMICIDE FORCIBLE RAPE ROBBERY AGGRAVATED ASSAULT BURGl.Pu'l{Y LARCENY - THEFT
AUTO THEFT CALLS FOR SERVICE ACCIDENTS MOVING CITATIONS PARKING CITATIONS FIRE DIVISION RESPONSES FIRE PREVENTION INSPECTIONS
10 YEAR PERIOD 1969 - 1978
(85 - 102)
(64 - 77) (25 - 28)
Scale: 1/4" = 100%
It * Fiscal Year Figure
•
YEAR OF 1978 SECTION IV
PAGE 20
+ 10%
+ 18%
+
+
+
20% 20%
12%
+ 201%
+ 59%
+ 229%
+ 24%
+ 400%
+ 50%
+ 249% + 108%
+ 107%
3%
+ 34%
+ 57%
+ 35%
9%
61%
+ 157%
+ 26%

• CITY OF SUNNYVALE .YEAR OF ]978 DEPARTMENT OF PUBLIC SAFETY SECTION IV
• PAGE 2l
COMPARATIVE SUMMARY OF DEPARTMENT ACTIVITIES PERCENTAGE OF CHANGE
5 YEAR PERIOD 1974 - 1978
• POPULATION + 2%
PERSONNEL + 6%
UNIFORMED PATROL POLICE (93 - 102) + 10%
• UNIFORMED FIRE (73 - 77) + 6%
NON-UNIFORMED (28 - 28) 0%
BUDGET * PERSONAL SERVICES + 73%
• CAPITAL OUTLAY 19% OTIffiR EXPENSES + 63%
ARRESTS + 9% FBI INDEX CRIMES
• CRIMINAL HOMICIDE + 25% FORCIBLE RAPE + 40% ROBBERY + 27% AGGRAVATED ASSAULT + 44%
• BURGLARY 14%
LARCENY - THEFT 3%
AlITO THEFT + 31%
CALLS FOR SERVICE + 5%
• ACCIDENTS + 26%
MOVING CITATIONS + 23%
PARKING CITATIONS 24%
FIRE DIVISION RESPONSES + 62%
• FIRE PREVENTION INSPECTIONS + 19%
Scale: 1/2" = 100%
• * Fiscal Year Figure
•
------- - --- ----
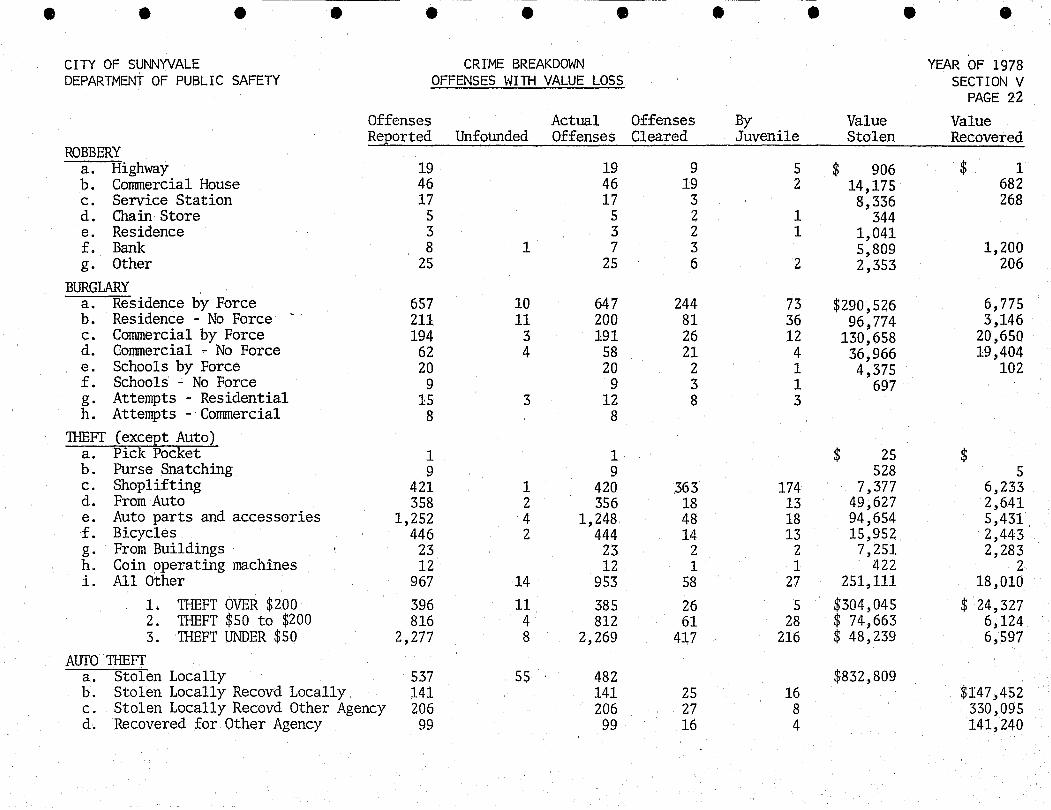
• • • • • • • • • • • CITY OF SUNNYVALE CR lME BREAKDOWN YEAR OF 1978 DEPARTMENT OF PUBLIC SAFETY OFFENSES WITH VALUE LOSS SECTION V
PAGE 22 Offenses Actual Offenses By Value Value ReEorted Unfounded Offenses Cleared Juvenile Stolen Recovered
ROBBERY a. Highway 19 19 9 5 $ 906 $ 1 b. Commercial House 46 46 19 2 14,175 682 c. Service Station 17 17 3 8,336 268 d. Chain Store 5 5 2 1 344 e. Residence 3 3 2 1 1,041 f. Bank 8 1 7 3 5,809 1,200 g. Other 25 25 6 2 2,353 206
BURGLARY a. Residence by Force 657 10 647 244 73 $290,526 6,775 b. Residence - No Force - 211 11 200 81 36 96,774 3,146 c. Commercial by Force 194 3 191 26 12 130,658 20,650 d. Commercial - No Force 62 4 58 21 4 36,966 19,404 e. Schools by Force 20 20 2 1 4,375 102 f. Schools - No Force 9 9 3 1 697 g. Attempts - Residential 15 3 12 8 3 h. Attempts - Commercial 8 8
TI-lEFI' (exceEt Auto) a. Pick Pocket 1 1 $ 25 $ b. Purse Snatching 9 9 528 5 c. Shoplifting 421 1 420 .363 174 7,377 6,233 d. From Auto 358 2 356 18 13 49,627 2,641 e. Auto parts and accessories 1,252 4 1,248 48 18 94,654 5,431 f. Bicycles 446 2 444 14 13 15,952 2,443 g. From Buildings 23 23 2 2 7,251 2,283 h. Coin operating machines 12 12 1 1 422 2 i. All Other 967 14 953 58 27 251,111 18,010
1. 'IHEFT OVER $ 20 0 396 11 385 26 5 $304,045 $ 24,327 2. THEFT $50 to $200 816 4 812 61 28 $ 74,663 6,124 3. TI-lEFT UNDER $ 5 0 2,277 8 2,269 417 216 $ 48,239 6,597
AUTO 'IHEFI' a. Stolen Locally 537 55 482 $832,809 b. Stolen Locally Recovd Locally 141 141 25 16 $147,452 c. Stolen Locally Recovd Other Agency 206 206 27 8 330,095 d. Recovered for Other Agency 99 99 16 4 141,240
- --
ie
CITY OF SUNNYVALE YEAR OF 1:978 DEPARTMENT OF PUBLIC SAFETY SECTION V
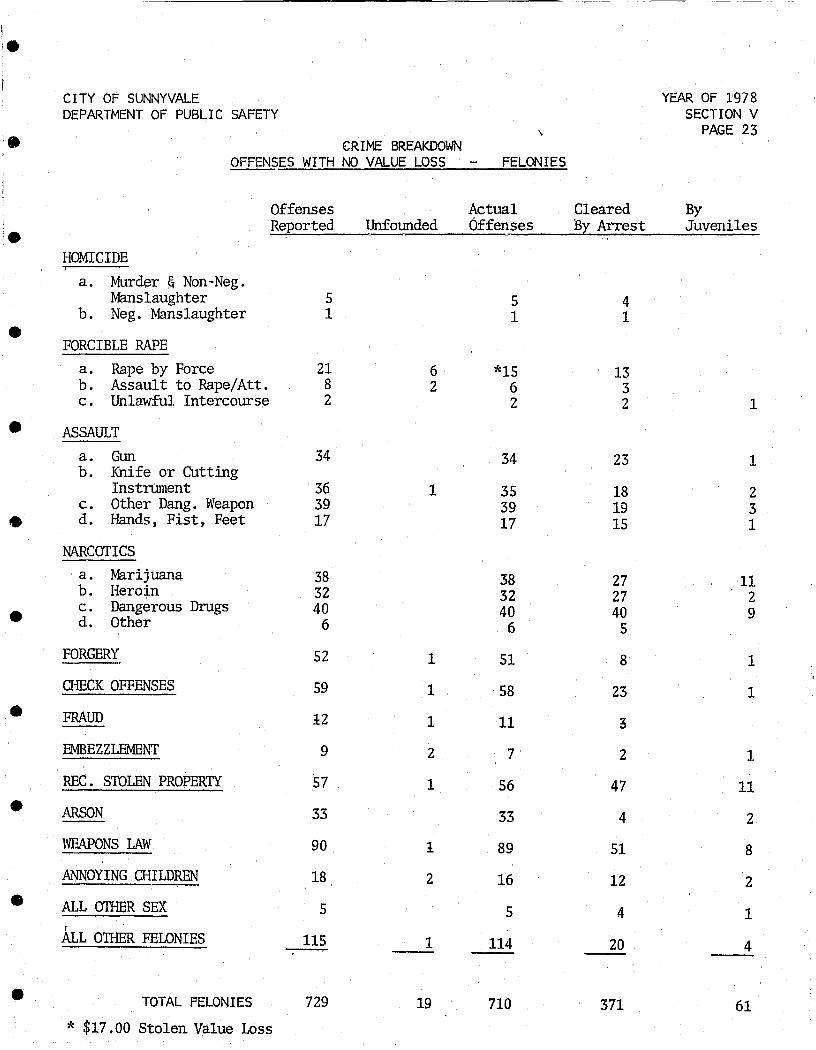
\ PAGE 23 '. CRIME BREAKDOWN OFFENSES WITH NO VALUE LOSS FELONIES
Offenses Actual Cleared By Reported UnfO'lmded 6ffenses By Arrest Juveniles i.
HOMICIDE !
a. Murder & Non-Neg. Manslaughter 5 5 4
b. Neg. Manslaughter 1 1 1 • FORCIBLE RAPE a. Rape by Force 21 6 *15 13 b. Assault to Rape/Att. 8 2 6 3 c. Unlawful Intercourse 2 2 2 1
• ASSAULT a. Gun 34 34 23 1 b. Knife or Cutting
Instnnnent 36 1 35 18 2 c. Other Dang. Weapon 39 39 19 3 • d. Hands, Fist, Feet 17 17 15 1
NARCOTICS a. Mlrijuana 38 38 27 11 b. Heroin 32 32 27 2
• c. Dangerous Drugs 40 40 40 9 d. Other 6 6 5
FORGERY 52 1 51 8 1 CHECK OFFENSES 59 1 58 23 1
• FRAUD 12 1 11 3
EMBEZZLEMENT 9 2 7 2 1
REC. STOLEN PROPERTY 57 1 56 47 11
• ARSON 33 33 4 2
WEAPONS LAW 90 1 89 51 8
ANNOYING CHILDREN 18 2 16 12 2
• ALL OTIIER SEX 5 5 4 1 1
ALL OTHER FELONIES 115 1 114 20 4
• TOTAL FELONIES 729 19 710 371 61 * $17.00 Stolen Value Loss
•
• CITY OF SUNNYVALE
• DEPARTMENT OF PUBLIC SAFETY
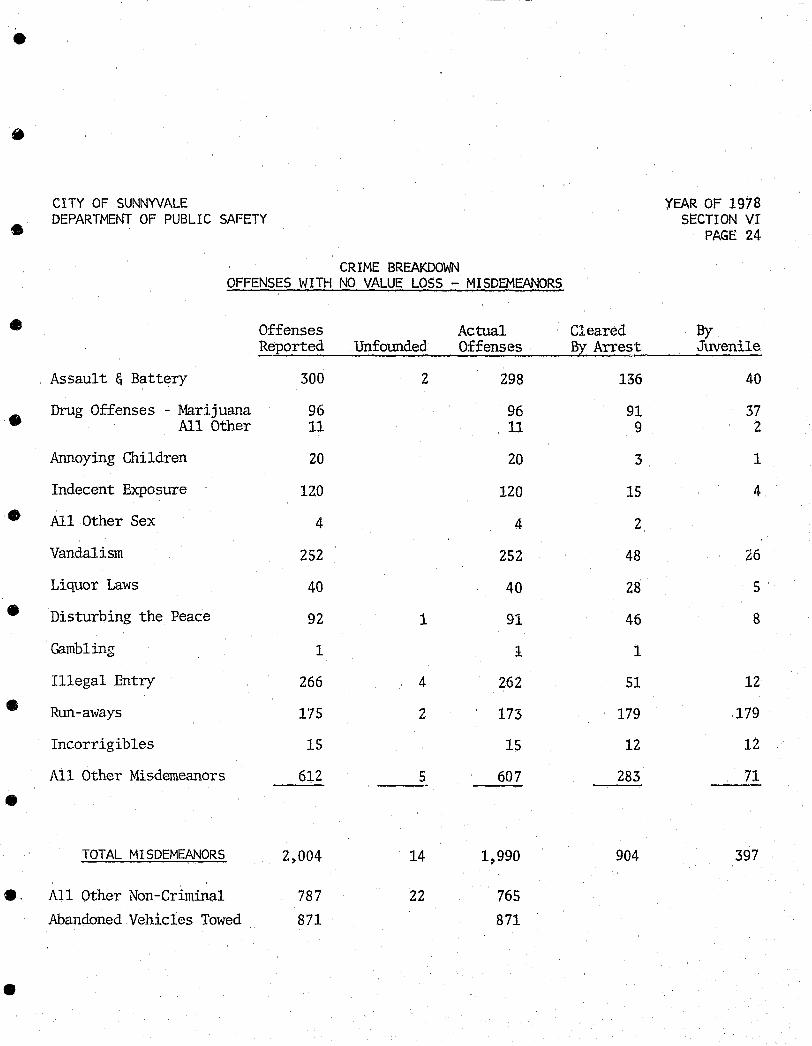
CRIME BREAKDOWN OFFENSES WITH NO VALUE LOSS - MISDEMEANORS
• Assault & Battery
• Drug Offenses - Marijuana All Other
Annoying Children
Indecent Exposure
• All Other Sex
Vandalism
Liquor Laws
• Disturbing the Peace
Gambling
Illegal Entry
• Run-aways
Incorrigibles
All Other Misdemeanors
• TOTAL MISDEMEANORS
tI. All Other Non-Criminal
Abandoned Vehicles Towed
•
Offenses Reported
300
96 11
20
120
4
252
40
92
1
266
175
15
612
2,004
787
871
Unfounded
2
1
4
2
5
14
22
Actual Offenses
298
96 11
20
120
4
252
40
91
1
262
173
15
607
1,990
765
871
YEAR OF 1978 SECTION VI
PAGE 24
Cleared By By Arre~t Juvenile
1:;6 40
91 37 9 2
3 1
15 4.
2
48 26
28 5
46 8
1
51 12
179 179
12 12
283 71
904 397
• 'CI'IY OF SUNNYVALE YEAR OF 1978 DEPARTMENT OF PUBLIC SAFETY SECfION VI
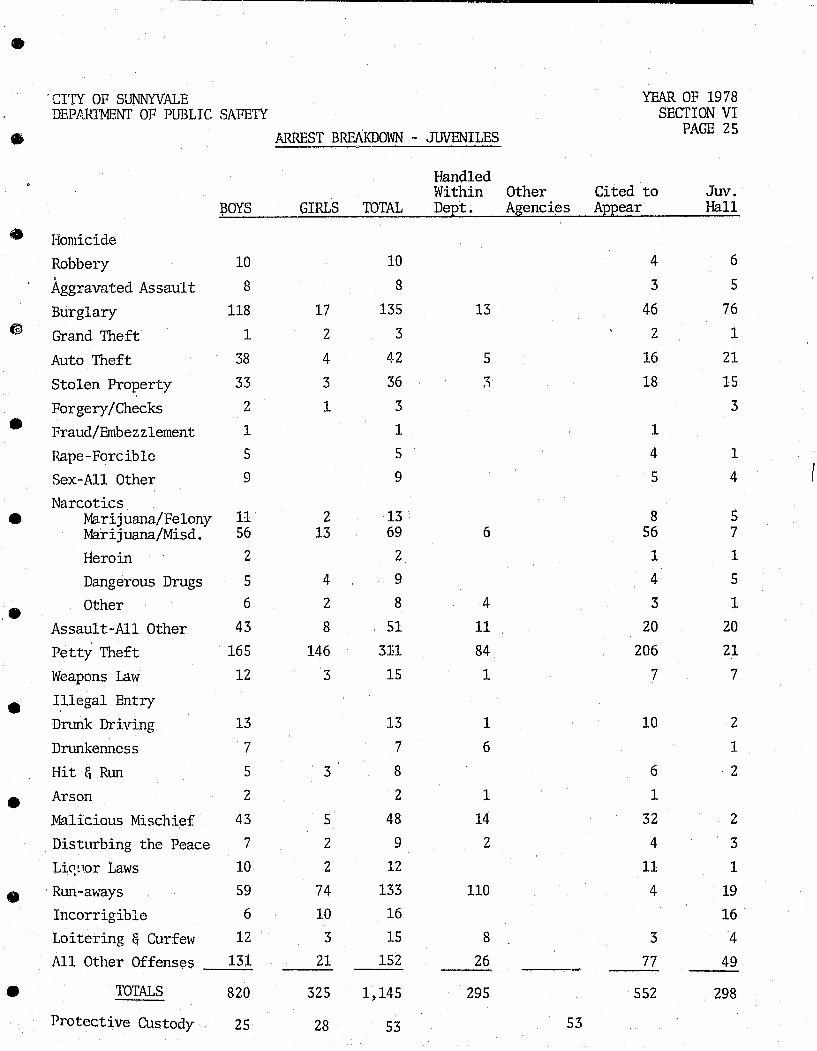
• ARREST BREAKDOWN - JlNENILES PAGE 25
Handled Within Other Cited to Juv.
~OYS GIRLS TOTAL DeEt. Agencies Appear Hall
• Homicide Robbery 10 10 4 6
Aggravated Assault 8 8 3 5
Burglary 118 17 135 13 46 76 G Grand Theft 1 2 3 2 1
Auto Theft 38 4 42 5 16 21
Stolen Property 33 3 36 ;; 18 15
Forgery/Checks 2 1 3 3
• Fraud/Embezzlement 1 1 1
Rape-Forcible 5 5 4 1
Sex-All Other 9 9 5 4
Narcotics
• Marijuana/Felony 11 2 13 8 5 Marijuana/Misd. 56 13 69 6 56 7
Heroin 2 2 1 1
Dangerous Drugs 5 4 9 4 5
,e Other 6 2 8 4 3 1
Assault-All Other 43 8 51 11 20 20
Petty Theft 165 146 31i1 84 206 21
Weapons Law 12 3 15 1 7 7
• Illegal Entry
Drunk Driving 13 13 1 10 2
Drunkenness 7 7 6 1
Hit & Run 5 3 8 6 2
• Arson 2 2 1 1
Malicious Mischief 43 5 48 14 32 2
Disturbing the Peace 7 2 9 2 4 3
Li~t1Or Laws 10 2 12 11 1
• Run-aways 59 74 133 110 4 19
Incorrigible 6 10 16 16
Loitering & Curfew 12 3 15 8 3 4 All Other Offens~s 131 21 152 26 77 49
• TOTALS 820 325 1,145 295 552 298
Protective Custody 25 28 53 53

• CITY OF SUNNYVALE yEAR OF 1978 DEPARTMENT OF PUBLIC SAFETY SECTION VI
• PAGE 26 ARREST BREAKDOWN - ADULT FELONIES
O'IHER CHARGED CHARGED MALE FEMALE TOTAL RELEASED JURIS. MISD. FELONY
Homicide 3 3 3
• Manslghtr Non-Veh. 1 1 2 2
Manslghtr Veh. 1 1 1
Robbery 21 1 22 2 20
Aggrav-::tted Assault 62 9 71 10 30 31
• Burglary 86 11 97 8 24 65
Grand Theft- Ex. Auto 16 4 20 6 14
Auto Theft 23 1 24 2 3 19
Rec. Stolen Property 41 4 45 15 18 12
• Forgery/Checks 6 1 7 7
Fraud/Embezzlement 1 1 1
Rape-Forcible 15 15 2 13
Rape-Statutory
• Indecent Exposure 2 2 2
Annoying Children 9 9 1 8
All Other Sex 1 1 1
Narcotics
• Marijuana 22 1 23 6 17
Heroin 26 7 33 5 3 25
Dangerous Drugs 32 11 43 6 2 35
Other Drug Laws 4 2 6 1 5
• Weapons Law 21 21 5 9 7
Drunk Driving Injury 9 1 10 8 .2
Hit & Run Injury 2 1 3 1 2
Arson 3 1 4 1 3
• Escape Kidnapping 1 1 1 .J.
Bookmaking All Other Felonies 36 2 38 9 10 19 --•
TOTAL 441 61 502 64 128 310
Felony Enroutes 63 7 70 70
•
• CI'IY OF SUNNYVALE YEAR OF 1978 DEPARTMENT OF PUBLIC SAFE'IY SECTION Vi
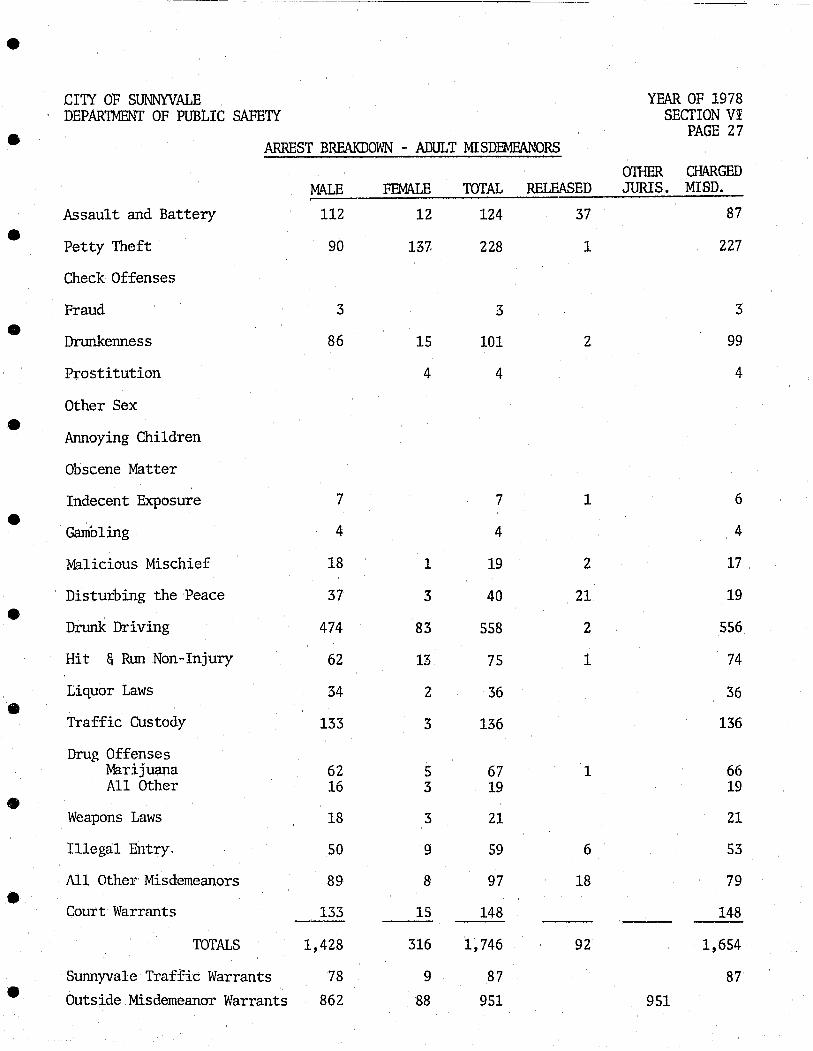
• PAGE 27 ARREST BREAKDOWN - ADULT MISDEMEANORS
01HER CHARGED MA.LE FEMALE TOTAL RELEASED JURIS. MISD. ,
Assault and Battery 112 12 124 37 87
• Petty Theft 90 137- 228 1 227
Check Offenses
Fraud 3 3 3
• Dnmkenness 86 IS 101 2 99
Prostitution 4 4 4
Other Sex
• Annoying Children
Obscene Matter
Indecent Exposure 7 7 1 6
• Gambling 4 4 4
Malicious Mischief 18 1 19 2 17
Distur.bing the Peace 37 3 40 21 19
• Drunk Driving 474 83 SS8 2 S56
Hit & Rtm Non-Injury 62 13 75 1 74
Liquor Laws 34 2 36 36
• Traffic Custody 133 3 136 136
Drug Offenses Marijuana 62 5 67 1 66 All Other 16 3 19 19
• Weapons Laws 18 3 21 21
Illegal Entry. 50 9 59 6 53
All Other Misdemeanors 89 8 97 18 79
• Court Warrants 133 15 148 148
TOTALS 1,428 316 1,746 92 1,654
Sunnyvale Traffic Warrants 78 9 87 87
• Outside Misdemeanor Warrants 862 88 951 951
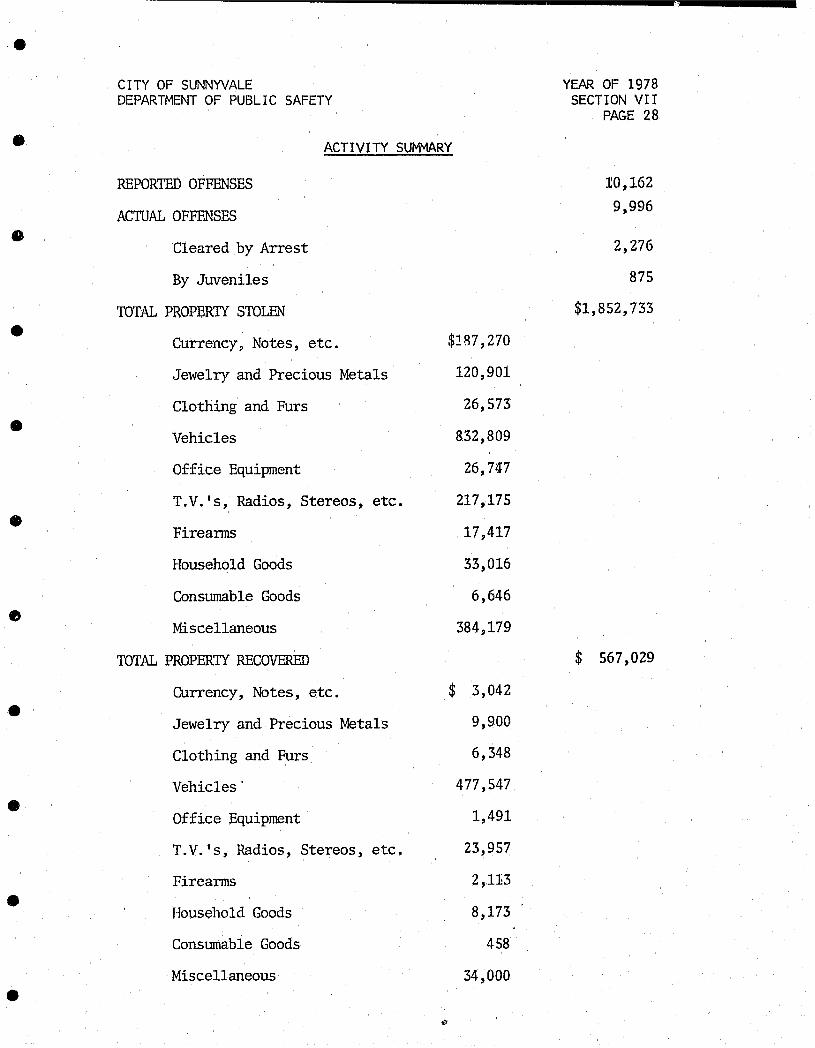
• CITY OF SUNNYVALE YEAR OF 1978 DEPARTMENT OF PUBLIC SAFETY SECTION VII
PAGE 28
• ACTIVITY SUMMARY
REPORTED OFFENSES 1:0,162
ACTUAL OFFENSES 9,996
• Cleared by Arrest 2,276
By Juveniles 875
TOTAL PROPERTY STOLEN $1,852,733
• $187,270 Currency, Notes, etc.
Jewelry and Precious Metals 120,901
Clothing and Furs 26,573
• Vehicles &32,809
Office Equipment 26,7'47
T . V. ' s, Radios, Stereos, etc. 217,175
• Fireanns 17,417
Household Goods 33,016
Consumable Goods 6,646 e
Miscellaneous 384,179
TOTAL PROPERTY RECOVERED $ 567,029
Currency, Notes, etc. $ 3,042
• Jewelry and Precious Metals 9,900
Clothing and Furs 6,348
Vehicles· 477 ,547
• Office Equipment 1,491
T . V. 's, Radios, Stereos, etc. 23,957
Firearms 2,113
• Household Goods 8,173
Constnnable Goods 458
Miscellaneous 34,000
•

•
• C1TY OF SUNNYVALE YEAR OF 1978 DEPARTMENT OF PUBLIC SAFETY SECTION VII
PAGE 29
ACTIVITY SUMMARY
• ARRESTS ~ TOTNt 4,554
ADULTS 3,356
Criminal 2,248
• Traffic 87
Enroutes 1,021
JUVENILES 1,198
Handled Within the Dept. 295
• Cited to Appear 552
Juvenile Hall 298
Released to Welfare Agency (Custody Only) 53
• WARRANTS RECEIVED 2,370
Sunnyvale Warrants 1,685
Enroute Warrants 685
WARRANTS SERVED 3,153
• Sunnyvale Warrants 1,242
Enroute Warrants 1,911
FIELD INTERROGATIONS 1,266
• PATROL MILES 813,317
ABANDONED VEHICLES TOWED 871
ABANDONED VliliICLES INVESTIGATED 3,945
• STOLEN BICYCLES 444
STOLEN BICYCLES RECOVERED 65
SUBPOENAE ISSUED 766
•
•
•
•
•
•
•
•
•
•
•
•
•
Years prior to 1977 a non-automated case number generation was used, which resulted in some minor administrative incidents receiving case numbers which increased the case number total. calls for services on page 20 for the years 1977 and 1978 reflect automated case numbers.


![Larceny Act, 1916. - Legislation.gov.uk · Larceny Act, 1916. [6 & 7 GEO. 5. CII. 50.] ARRANGEMENT OF SECTIONS. A.D.1916. Section. 1. Definition. 2. Simple larceny. 3. Larceny of](https://static.fdocuments.in/doc/165x107/5b684c7f7f8b9a6f778c9420/larceny-act-1916-larceny-act-1916-6-7-geo-5-cii-50-arrangement.jpg)