Of Bold Strokes and Fine Prints - CBGA · PDF fileOf Bold Strokes and Fine Prints ... 12....
105
Of Bold Strokes and Fine Prints Analysis of Union Budget 2015-16 Centre for Budget and Governance Accountability
Transcript of Of Bold Strokes and Fine Prints - CBGA · PDF fileOf Bold Strokes and Fine Prints ... 12....

i Cen
tre
for
Bu
dge
t an
d G
over
nan
ce A
ccou
nta
bil
ity
Of Bold Strokes and Fine Prints
Analysis of Union Budget 2015-16
Centre for Budget and Governance Accountability

Cen
tre
for
Bu
dge
t an
d G
over
nan
ce A
ccou
nta
bil
ity
ii
This document is for private circulation and is not a priced publication.
Copyright @ 2015 Centre for Budget and Governance Accountability
Reproduction of this publication for educational or other non-commercial purpose is authorized, without prior written permission, provided the source is fully acknowledged.
Cover Illustration: Vikram NayakDesigned and Printed by: Shivam Sundram ([email protected])
For any queries, please contact:
Centre for Budget and Governance AccountabilityB-7 Extn./110 A (Ground Floor), Harsukh Marg,Safdarjung Enclave, New Delhi-110029Ph: +91-11-49 200 400 / 401 / 402, Fax: +91-11-4050 4846Email: [email protected]
Website: www.cbgaindia.org

FOREWORDCentre for Budget and Governance Accountability (CBGA) carries out an in depth analysis of the Union Budget and brings out such a publication every year. The main purpose of this publication is to facilitate an informed discussion on the Union Budget, particularly around the sectors and issues relevant for the poor and vulnerable sections of the population.
This publication presents a comprehensive analysis of the priorities and proposals in Union Budget 2015-16, focusing on social sectors (such as education, health, drinking water and sanitation, food security etc.) and the responsiveness of the Budget towards the vulnerable sections of the population (such as women, children, dalits, adivasis, religious minorities, persons with disabilities, and urban poor). It also looks closely at the progressivity in the taxation policies adopted in the latest Budget. In addition, it discusses a number of other important issues such as the outlays for promoting renewable energy, the proposals relating to black money and the need for stronger policy measures for transparency and accountability in the domain of government budgets in India.
More importantly, this publication tries to facilitate a clear understanding of the changes in the federal fiscal architecture in the country, which are taking place in 2015-16 as a result of the recommendations of the 14th Finance Commission pertaining to Centre-State sharing of resources and restructuring of Central schemes.
We would be glad to get your feedback and suggestions as well as queries for additional information (at [email protected]), which would help us improve our efforts in future.
Subrat DasExecutive Director, CBGA
(www.cbgaindia.org)

Cen
tre
for
Bu
dge
t an
d G
over
nan
ce A
ccou
nta
bil
ity
iv

v Cen
tre
for
Bu
dge
t an
d G
over
nan
ce A
ccou
nta
bil
ity
CONTENTSSl. No. Section Page No
Foreword ii
An Overview 1
1. Demystifying Devolution to States 5
2. Are There Enough Tax Resources? 16
3. Investor Friendly: At What Cost? 20
4. Indirect Taxes: Greater Burden on the Poor 23
5. Budget 2015-16: Do Women Count? 25
6. Budgets for Children 30
7. Plan Strategies for Dalits and Adivasis 35
8 Budgets for the Nodal Ministries for Dalits and Adivasis 39
9. Development of Muslims: From the lens of Budgets 42
10. How Disabled Friendly is this Budget? 47
11. Are our Cities ‘Smart’ for Inclusive Development? 51
12. Provisioning for Health Budgets 55
13. Takeaways for Education from the Union Budget 61
14. Does the Budget Ensure ‘Padhe Bharat, Badhe Bharat’? 65
15. Drinking Water and Sanitation: Steps towards ‘Swachh Bharat’ 67
16. Rural Development: Key Issues and Challenges 70
17. How Well Are Farmers’ Plights Addressed in Budget 2015-16? 74
18. Allocation Priorities for Food Security 79
19. Nutritional Commitments in 2015-16 84
20. Is Budget 2015-16 Consistent With Expansion Targets for Renewable Energy? 88
21. Black Money: Beyond Offshore Accounts 92
22. Transparency and Accountability in the Context of the New Fiscal Regime 94
23. Policy Measures Related to Banking and Finance Highlighted in the Budget Speech
97

Cen
tre
for
Bu
dge
t an
d G
over
nan
ce A
ccou
nta
bil
ity
vi

1 Cen
tre
for
Bu
dge
t an
d G
over
nan
ce A
ccou
nta
bil
ity
AN OVERVIEWThe direction indicated by the Finance Minister’s Budget Speech reveals the steps for fiscal decentralisation from Centre to States. It has led to a modest increase in the spending capacity of the State Governments though their fiscal autonomy (in terms of discretion over the resources available) would certainly go up from 2015-16. In such a scenario, the move towards transfer of a number of major social sector programmes from the Centre to the States over the next couple of years raises concerns pertaining to the overall magnitude of budgetary resources that would be available for critical social sector interventions in the coming fiscal year and beyond. It appears that the transfer of social sector responsibilities to the State Governments is not going to be matched by an adequate increase in their spending capacity.
Union Budget is primarily the arena of fiscal policy of the Centre; however, the 2015-16 Budget Speech of the Finance Minister has followed and even accentuated a trend observed over the last several years, of restricting the discussion on core fiscal policy decisions to provide space for elaborate references to developments pertaining to banking sector, monetary policy and other measures outside the purview of the Budget. The overall direction indicated by the Budget Speech, and particularly those pertaining to taxation, indicate a much stronger adherence to market friendly policies than what was witnessed over the last few years. For instance, the decisions to cut the Corporate Tax rate (from 30 % to 25 %), defer some of the measures (like the General Anti Avoidance Rules) that could limit the scope for MNCs to dodge taxes and increase the dependence on Indirect Taxes to compensate for the softer approach towards Direct Taxes, underscore the overall policy framework being pursued by the current government at the Centre.
While the nominal rate of Corporate Tax would be reduced in 2015-16, the rationalisation of the plethora of exemptions (that have led to the effective Corporate Tax rate being rather low at 23 %) is scheduled to be done in a phased manner and that too starting in 2016-17. The proposals relating to Personal Income Tax would make the Income Tax base even narrower, and those pertaining to the abolition of Wealth Tax (being replaced by a 2 % additional surcharge on Income Tax on the super-rich) would further weaken the limited progressivity in India’s tax system. The argument cited for abolition of Wealth Tax, that it is an inefficient tax, seems questionable as the cost of collecting Rs. 100 from this tax has come down from Rs. 54 in 2001-02 to Rs. 9 in 2013-14. While the revenue from the additional surcharge on Income Tax on the super-rich is projected to more than compensate for the loss of revenue due to abolition of Wealth Tax, the collections from surcharge are not part of the divisible pool of Central Taxes and hence would not be shared with the States.
Though India collects two-third of its total tax revenue (of around 17 % of GDP) from Indirect Taxes and only a third from Direct Taxes, Union Budget 2015-16 has moved towards even greater dependence on Indirect Taxes and softening of the regime of Direct Taxes. The tax-GDP ratio for Gross Central Taxes is projected to increase to 10.3 % in 2015-16 from 9.9 % in the Revised Estimate (RE)

Cen
tre
for
Bu
dge
t an
d G
over
nan
ce A
ccou
nta
bil
ity
2
for 2014-15; but even the tax-GDP ratio projected for 2017-18 (at 10.7 %) is going to be way below that attained earlier in 2007-08 (11.9 %).
What this has meant is that no expansion could be envisaged in the overall spending capacity of the government (Centre and States combined) for the next few years, despite the fact that the overall fiscal policy space in the country (i.e. the overall government spending to GDP ratio, at around 27 %) has been smaller than that of not only developed countries but also of many other developing countries (like Brazil, South Africa, Mexico and China). Such fiscal policies have constrained the thrust towards fiscal decentralisation, which the 14th Finance Commission has attempted to provide for the next five years (2015-16 to 2019-20).
Quite contrary to what has been the common perception about the implications of the 14th Finance Commission recommendations, the net increase in the spending capacity of the State Governments (resulting from the changes being introduced in Centre-State sharing of resources) in 2015-16 would be very modest. It needs to be recognised that while the Share of States in Central Taxes would go up from Rs 3.82 lakh crore in 2014-15 Budget Estimate (BE) to Rs 5.23 lakh crore in 2015-16 BE and Non Plan Grants and Loans to States would increase from Rs 69095 crore in 2014-15 BE to Rs 1.07 lakh in 2015-16 BE, the overall magnitude of Central Assistance to States for Plan Spending is going to decline sharply from Rs 3.3 lakh crore in 2014-15 to Rs 1.96 lakh crore in 2015-16 BE. This is because the Centre is not only going to discontinue most forms of untied assistance for Plan spending by States, it is also going to stop incurring Revenue Expenditure on Plan schemes in a number of sectors expecting the States to take those up from 2015-16. As a result, the net increase in spending capacity of the States (combined for all States) in 2015-16 (as compared to 2014-15 BE) is projected to be only Rs 46192 crore, which would be a small 0.33 % of GDP for the year.
In the new framework of Centre-State sharing of resources, that has come out clearly since the Report of the Subgroup of Chief ministers on Rationalisation Centrally Sponsored Schemes (CSS) (henceforth, NITI Aayog report) have come into the public domain, the report classifies the as “Core” and “Optional”. Core Schemes would have compulsory participation by States, whereas amongst the Optional Schemes, States could choose some or all of them. The core schemes would be those that are mandated by legal obligations (e.g. MGNREGA), backed by Cess collection (e.g. funds for Sarva Shiksha Abhiyan and Mid-Day Meal from the Prarambhik Shiksha Kosh, schemes funded from the National Clean Energy Fund), those targeted for socially disadvantaged groups (e.g. schemes meant specifically for SCs, STs, minorities, persons with disabilities, and social security schemes for unorganized workers) or those meant for poverty alleviation in backward regions (especially the Special Area Programmes). A few of the prevailing Plan schemes have been categorized as ‘optional’ for the states, which would be delinked (e.g. Backward Regions Grant Fund, Model Schools scheme, National e-Governance Action Plan, among others) with the possibility that some of the States may decide to continue some of these interventions with their own untied budgetary resources transferred as share of taxes.
However, what is most important to note is that starting from 2015-16, the Centre would reduce its commitments on salaries of staff incurred at the State level in the different CSS, implementation of some of which may be crucially dependent on human resources, such as the National Health Mission, Integrated Child Development Services, Rashtriya Krishi Vikas Yojana, Rashtriya Madhyamik Shiksha

3 Cen
tre
for
Bu
dge
t an
d G
over
nan
ce A
ccou
nta
bil
ity
Abhiyan, National Rural Drinking Water Programme, Swachh Bharat Abhiyan, Indira Awas Yojana and National Rural Livelihoods Mission. This is evident from the NITI Aayog report that categorically states the following:
In all such Schemes where there are remuneration/salary components, the funding pattern for salary/remuneration components should not be modified to the disadvantage of the States until the completion of the 12th Plan (2016-17). This recommendation is made subject to the following:
i) The funding in existing Schemes where salary component is borne by the State Government would continue to be borne by the State, i.e. no change is recommended.
ii) Where the salary/remuneration is paid under the Scheme, the Centre’s allocation share would remain capped at the current level. Hence any upward revision of remuneration or additional hiring may be made only with the States own resources.
iii) The Central Ministries may review the extant guidelines in the Schemes to enable States to have the flexibility in norms and guidelines to take an appropriate decision on hiring personnel in any Scheme.
(Report of the Subgroup of Chief Ministers on Rationalisation of Centrally Sponsored Schemes, pp.38)
Following this decision, the Union Budget outlays for all these schemes have been reduced in 2015-16 BE (as compared to 2014-15 BE).
Hence, it is obvious that these schemes are effectively getting ‘transferred’ to State Governments, with the expectation that the States will provide additional budgetary resources from their own funds now to compensate for the resources withdrawn by the Centre. It needs to be pointed out here that the net increase in spending capacity of the States in 2015-16 is projected to be a small 0.33 % of GDP. This increase in net spending capacity for the States does not change much even after the allocations made in the Supplementary Demand for Grants, 2015-16 announced in September this year.
In 2013-14 BE (the latest year for which the RBI has compiled information for all the State Budgets), the total allocation for Social Sectors accounted for 40.5 % of the aggregate spending by all States. Hence, if the States on an average continue to allocate resources following the same prioritisation of their Budgets, only around 0.12 % of the GDP would be the incremental spending from State Budgets on the Social Sector programmes. However, the Union Budget outlay for all Social Sector ministries (including Rural Development and Urban Development, but excluding Agriculture and Food Subsidy) registers a decline from 1.92 % of GDP in 2013-14 (Actuals) to 1.68 % of GDP in 2015-16 BE. Hence, the total resource envelope for social sectors in the country could witness a decline in 2015-16 unless the States step up the priority for social sector programmes in their Budgets significantly.
The move towards effectively transferring a host of important social sector programmes to States along with an increase in their discretion or autonomy over the budgetary resources available to them would be a step in the right direction provided the State Governments have adequate overall spending capacity. However, primarily because of the stagnant tax-GDP ratio of the Centre and the fact that only 42 % of the divisible pool of Central Taxes would be shared with the States, the State Budget outlays
Cen
tre
for
Bu
dge
t an
d G
over
nan
ce A
ccou
nta
bil
ity
4
for these crucial development programmes (like SSA, MDM, IAY, NHM, ICDS, NRDWP and RKVY etc.) might not increase by as much as would be required just to protect the overall budgetary outlays for these at the prevailing levels. What makes this a grave concern is that for most of these social sector programmes, the prevailing magnitudes of budgets have themselves been quite inadequate.
It is worth noting that two important programmes backed by legislations have escaped the axe that has fallen on the Union Budget outlays for most social sector interventions. Union Budget for 2015-16 protects the outlay for Food Subsidy at Rs 1.24 lakh crore, which is nearly the same as the Rs 1.23 lakh crore allocated in the RE for 2014-15. Likewise, for MGNREGA, the outlay for 2015-16 BE is pegged at Rs 34699 crore, with a stated intention of providing an additional Rs 5000 crore if the receipts from taxes in 2015-16 exceed the projected levels because of tax buoyancy; the outlay for the programme in 2014-15 RE is Rs 33000 crore.
What causes a serious concern about Union Budget 2015-16 is the fact that the transfer of responsibilities to the State Governments across a range of development sectors is not going to be matched by an adequate increase in their spending capacity. This could make the ongoing interventions in these sectors even more resource-constrained than what has been the case until now.

5 Cen
tre
for
Bu
dge
t an
d G
over
nan
ce A
ccou
nta
bil
ity
The Union Budget 2015-16 is the first full-fledged budget placed by the newly elected government. The paradigm of the Union Budget remains fixed at fiscal consolidation at the expense of expenditure compression and not increased revenue generation. This is evident from the fact that total expenditure of the Union government has declined from Rs.17,94892 crore in 2014-15BE to Rs.17,77477crore in 2015-16BE and there has been no clear indication to provide a boost to the overall tax-GDP ratio. The decline in expenditure comes mostly on account of the reduced Plan expenditure of a magnitude of Rs. 1,09723 crore.
The justification provided by the government for such reduction is on account of the 14th Finance Commission (FFC) recommendations for fiscal devolution to states. One of the major recommendations made in the FFC report which was tabled last week, and accepted by the centre, took a leap forward in terms of changing the nature of resource sharing between centre and states. The FFC recommended a transfer of 42% of the divisible central taxes to the states which amounted to an increase by 10 percent points from its predecessors. This would perhaps come as a relief to the states who have been demanding 50% share of total taxes. The increased devolution also works in tandem with the spirit of fiscal federalism with more autonomy and untied resources to the states. With the replacement of the Planning Commission by NITI Aayog (which does not have any financial implications for the states) and the acceptance of greater share of taxes to be devolved to the states, the government has termed it as a stepping stone for ‘cooperative federalism’.
Table 1: Composition and Structure of Transfer of Resources to States (Rs crore)
2014-15 BE 2014-15 RE 2015-16 BE
States share of taxes and duties 382216 337808 523958Non Plan grants and loans to states 69936 80258 108551CA to States 323563 262913 207147Total Union Resources transferred to States* 775715 680979 815787GDP at current market prices (2011-12 series) 12653762 12653762 14108945States share of taxes and duties as % of GDP 3.0 2.7 3.7
Non Plan grants and loans to states as % of GDP 0.6 0.6 0.8
CA to States as % of GDP 2.6 2.1 1.4
Total Union Resources transferred to States as % of GDP
6.1 5.4 5.8
Note: *Total union resources comprise of states’ share in central taxes, non-plan grants, CA to state, Assistance for Central and Centrally sponsored schemes.Source: Compiled by CBGA from Union Budget documents, 2015-16
DEMYSTIFYING DEVOLUTION TO STATES1

Cen
tre
for
Bu
dge
t an
d G
over
nan
ce A
ccou
nta
bil
ity
6
However, a deeper examination of the amount of increased devolution provides a clearer picture of the status of overall resources being transferred to the states. Table 1 below shows that the Total Union resources, states’ share in central taxes and Non-plan grants as share of GDP does show an increase from 2014-15 revised estimates. However, while the states’ share in central taxes and Non-plan grants, as share of GDP has increased, the magnitude of overall Union resources transferred to states as percentage of GDP by the 2014-15 budgeted expenditure reveals a decline in 2015-16.
These increases imply that while the states would definitely enjoy a greater degree of autonomy and flexibility in terms of deciding on their expenditure priorities, it does not necessarily imply an increased spending capacity for the states. Thus the Union government’s argument for reducing Plan assistance to states due to an increase in the share of the divisible pool transferred to the states remains unqualified in terms of increasing the total resources for the states.
The reduced Plan assistance by the Union also throws light on the priority accorded to the social sector commitments of the Union government. The government has recently come out with a NITI Aayog report on rationalisation of the CSS. The report reveals a newer classification of all programmes being implemented by the Centre. The table below provides the classification of the 66 schemes being implemented with full or partial support of the Centre.
Table 2: Classification of CSS
Classification of CSS Distribution of original 66 CSS
Remarks
(A) Schemes to be implemented un-altered 17 Some of these schemes are reformulated with addition of new components, or taken up in Central Sector
(B) Schemes to be implemented with a changed sharing pattern
33
(C) Schemes delinked from Union support: States may decide to continue from their own resources
8
(D) Other schemes which are part of devolution to the States or have been re-structured in (A), (B) and (C) above.
8
Total 66
Source: Reproduced from the REPORT OF THE SUBGROUP OF CHIEF MINISTERS ON RATIONALISATION OF THE CSS
Earlier the Union budget 2015-16 and now the NITI Aayog report has categorically stated that due to the higher devolution of taxes to the states, the Normal Central Assistance, Special Plan Assistance, Special Central Assistance and Additional Central Assistance for other purposes are subsumed in the FC award itself. Earlier in the year, during the budget announcement, the Union categorised some Centrally Sponsored Schemes which has been made clearer by the NITI report. The government has announced 17 schemes that would continue to be implemented unaltered (category A) and 33 schemes to be implemented with a changed pattern of sharing of resources (category B). The detailed list of schemes in category A and B is given in Table 3a.

7 Cen
tre
for
Bu
dge
t an
d G
over
nan
ce A
ccou
nta
bil
ity
These comprise of the schemes which represent national priorities especially those targeted at poverty alleviation, schemes mandated by legal obligations and those backed by cess collection like the SSA and the MDM. It also includes schemes which are targeted to benefit the socially disadvantaged group which includes SCs, STs, Muslims and physically challenged sections of the population.
However, by the new arrangement recommended in the NITI report the Schemes are further classified as ‘Core’ and ‘Optional’. As per the report, Core Schemes would have compulsory participation by States, whereas amongst the Optional Schemes, States could choose some or all of them. The Core Schemes would include schemes such as MGNREGA as well as Schemes for Social Inclusion as in category A and category B. The priorities are determined as per the goals set in the National Development Agenda in the areas namely,
• Poverty Elimination – Livelihoods, Jobs and Skill Development
• Drinking Water and Swachh Bharat Mission
• Rural Connectivity: Electricity; Access Roads and communication.
• Agriculture, including Animal husbandry, Fisheries Integrated Watershed Management and Irrigation
• Education, including Mid Day Meal
• Health, Nutrition, Women and Children
• Housing for All: Rural and Urban
• Urban Transformation
• Law and Order, Justice Delivery Systems
• Others which may include Wildlife Conservation and Greening
Further, among the Core Schemes, MGNREGA and schemes intended for Social Inclusion would be “the Core of the Core” and shall be the first charge on funds available. The list of the Core of the Core Scheme is given in Table 3b.
The Centre also decided to discontinue eight schemes (optional), which included the BRGF and some such others falling in category C and D as per Table 2. The detailed list is provided in Table 3c.
Table 3a: Schemes in category A and B (Core Schemes)
S.No. List of 66 CSS approved by the Cabinet for the 12th plan
Proposed Umbrella Programmes/Ministries
1 Mahatma Gandhi National Rural Employment Guarantee Scheme (MGNREGA)
1. National Rural Employment Guarantee Scheme
2 National Social Assistance Programme (NSAP)
2. National Social Assistance Programme
3 National Programme for persons with disabilities
3. National Programme for Persons with Disabilities
4 Scheme for Development of Scheduled Castes
4. Umbrellla Programme for Development of Scheduled Castes

Cen
tre
for
Bu
dge
t an
d G
over
nan
ce A
ccou
nta
bil
ity
8
5 Umbrella scheme for Education of ST students
5. Umbrella Programme for Development of Scheduled Tribes
6 Minorities including Multi Sectoral Development Programme for providing Education to Madrasas/Minorities
6. Multi Sectoral Development Programme for Minorities
7 Scheme for Development of Other Backward Classes and denotified, nomadic and semi-nomadic Tribes
7. Umbrella Programme for Development of Other Vulnerable Groups
8 Scheme for development of Economically backward Classes (EBCs)
9 Pradhan Mantri Adarsh Gram Yojana (PMAGY)
8. Krishi Unnati Yojana
10 National Food Security Mission11 National Horticulture Mission 12 National Mission on Sustainable Agriculture 13 National Oilseed and Oil Palm Mission 14 National Mission on Agriculture Extension
and Technology 15 Rashtriya Krishi Vikas Yojana (RKVY) (ACA) 16 National Livestock Management Programme 9. Rashtriya Pashudhan Vikas Yojana +
Fisheries 17 National Livestock Health and Disease Control Programme
18 National Plan for Dairy Development 19 National Rural Drinking Water Programme 10. Swachh Bharat Abhiyan (Grameen)
11. National Drinking Water Mission 20 Nirmal Bharat Abhiyan 21 National River Conservation Programme
(NRCP) 12. Environment, Forestry & Wildlife
22 National Afforestation Programme (National Mission for a Green India)
23 Conservation of Natural Resources and Ecosystems
24 Integrated Development of Wild Life Habitats
25 Project Tiger 26 National Health Mission including NRHM 13. National Health Mission including
AYUSH, NACO and Medical Research27 Human Resource in Health and Medical Education
28 National Mission on Ayush including Mission on Medicinal Plants
29 National AIDS & STD Control Programme 30 Border Area Development Programme
(BADP) (ACA) (MHA/M/o Finance) 14. Border Area Development Programme

9 Cen
tre
for
Bu
dge
t an
d G
over
nan
ce A
ccou
nta
bil
ity
31 National Urban Livelihood Mission 15. National Livelihood Mission – Rural 16. National Livelihood Mission - Urban 32 National Rural Livelihood Mission (NRLM)
33 Rajiv Awas Yojana including JNNURM part of MoHUPA
17. Housing for All- Rural (RD) 18. Housing for All- Urban (HUPA)
34 Indira Awaas Yojana (IAY) 35 Sarva Siksha Abhiyan 19. National Education Mission
36 Rashtriya Madhyamik Shiksha Abhiyan (RMSA)
37 Support for Educational Development including Teachers Training & Adult Education
38 Rashtriya Uchhtar Shiksha Abhiyan 39 Scheme for providing education to Madrasas,
Minorities and Disabled 40 National Service Scheme 20. National Service Scheme
41 National Programme Nutritional Support to Primary Education (MDM)
21. Mid Day Meal Programme
42 Integrated Child Development Services (ICDS)
22. Integrated Child Development Scheme and related programmes like maternity benefits, SABLA, KSY etc.
43 Integrated Child Protection Scheme (ICPS) 23. Integrated Child Protection Scheme
44 Development of Infrastructure Facilities for Judiciary including Gram Nyayalayas
24. Infrastructure Facilities for Judiciary
45 Pradhan Mantri Gram Sadak Yojana (PMGSY) 25. Pradhan Mantri Gram Sadak Yojana
46 Integrated Watershed Management Programme (IWMP)
26. Pradhan Mantri Krishi Sinchai Yojana
47 Accelerated Irrigation Benefit & Flood Management Programme (merging AIBP and other programmes of water resources such as CAD, EMP etc.) (ACA) + DAC
48 Jawaharlal Nehru National Urban Renewal Mission (JNNURM) (ACA)
27. Atal Mission for Rejuvenation and Urban Transformation (AMRUT) 28. Swachh Bharat Abhiyan Shahari 29. Smart Cities Mission
49 National Mission for Empowerment of Women including Indira Gandhi Mattritav Sahyog Yojana
Transferred to Central Sector and IGMSY made a sub-scheme of ICDS
50 Rajiv Gandhi Scheme for Empowerment of Adolescent Girls (SABLA)
To be implemented through ICDS machinery
Source: Compiled by CBGA from Union Budget documents, 2015-16 and REPORT OF THE SUBGROUP OF CHIEF MINISTERS ON RATIONALISATION OF THE CSS

Cen
tre
for
Bu
dge
t an
d G
over
nan
ce A
ccou
nta
bil
ity
10
Table 3b: ‘Core of the Core’ Schemes
Sl. No.
Scheme Categorization in BE 2015-16
Allocation in BE 2015-16 (including central sector components) in Rs. cr)
1 MGNREGA A 33700 2. National Social Assistance Programme A 9000 3 National Programme for persons with
disabilities A 5
4 Scheme for development of scheduled caste ( it has components in Central Sector also)
A 2649
5 Umbrella Scheme for education of ST children A 1155 6 For Minorities: (has schemes in both CSS and
CS) CSS: 1. Multi Sector Development Programme for Minorities- CSS ( Rs. 1244 cr) 2. Scheme for providing education to Madrasas/Minorities – CSS ( Rs. 375 cr)
A 3474 CSS: 1619 CS: 1855
7. Welfare of other Backward classes A 1094
Source: Reproduced from the REPORT OF THE SUBGROUP OF CHIEF MINISTERS ON RATIONALISATION OF THE CSS
Table 3c: Schemes in Category C and D (Optional)
S.No. List of 66 CSS approved by the Cabinet for the 12th plan
Proposed Umbrella Programmes/Ministries
1 National Land Record Modernisation Programme To be transferred to Central Sector (Digital India Initiatives)
2 Assistance to States for Infrastructure Development for Exports (ASIDE)
Delinked from Union Support
3 Backward Regions Grant Fund (District Component (ACA)
Delinked from Union Support
4 Rajiv Gandhi Panchayat Sashastrikaran Yojana Delinked from Union Support 5 Backward Regions Grant Fund (BRGF) (State
Component) Delinked from Union Support.
6 National Scheme for Modernization of Police and other forces
Delinked from Union Support.
7 Scheme for setting up of 6000 Model Schools at Block level as Benchmark of Excellence
Delinked from Union Support
8 National E-Governance Action Plan (NeGAP) (ACA) Transferred to Central Sector (as part of Digital India)

11 Cen
tre
for
Bu
dge
t an
d G
over
nan
ce A
ccou
nta
bil
ity
9 Social Security for Unorganized Workers including Rashtriya Swasthya Bima Yojana
Transferred to Central Sector
10 Skill Development Mission Transferred to Central Sector 11 Support for Statistical Strengthening Transferred to Central sector 12 National Handloom Development Programme Transferred to Central Sector 13 Catalytic Development programme under
Sericulture Transferred to Central Sector
14 Infrastructure Development for Destinations and Circuits
Transferred to Central Sector
15 National Mission on Food Processing Transferred to Central Sector 16 Yuva Krida aur Khel Abhiyan (PYKKA) To be transferred to Central Sector
Source: Compiled by CBGA from Union Budget documents, 2015-16 and REPORT OF THE SUBGROUP OF CHIEF MINISTERS ON RATIONALISATION OF THE CSS
Given such categorization of schemes, it is important to bring in a degree of caution while interpreting some of the announcements related to major schemes under classification A and B. It has been categorically added by the centre that:
The Centre-State funding pattern is being modified in view of the larger devolution of tax resources to States as per the recommendations of 14th Finance Commission whereby in this scheme, the revenue expenditure is to be borne by the States.
The NITI Aayog report further announced:
In all such Schemes where there are remuneration/salary components, the funding pattern for salary/remuneration components should not be modified to the disadvantage of the States until the completion of the 12th Plan (2016-17). This recommendation is made subject to the following:
i) The funding in existing Schemes where salary component is borne by the State Government would continue to be borne by the State, i.e. no change is recommended.
ii) Where the salary/remuneration is paid under the Scheme, the Centre’s allocation share would remain capped at the current level. Hence any upward revision of remuneration or additional hiring may be made only with the States own resources.
iii) The Central Ministries may review the extant guidelines in the Schemes to enable States to have the flexibility in norms and guidelines to take an appropriate decision on hiring personnel in any Scheme.
(Report of the Subgroup of Chief Ministers on Rationalisation of Centrally Sponsored Schemes, pp.38)
This announcement implies that expenses on the infrastructure (and in only specific cases maintenance) for the programmes at the state level would be borne by the Union government. Given the fact that capital expenditure by the states on most of these listed programmes are miniscule and they have a larger revenue (salaries mainly) component which then would have to be borne by states, it may further be interpreted as a slow phase out of some of the schemes from the ambit of the Union

Cen
tre
for
Bu
dge
t an
d G
over
nan
ce A
ccou
nta
bil
ity
12
government in coming years. Thus if the resources of the states do not increase commensurately, there is an increased possibility of the important programmes suffering due to a lack of adequate resources.
It is amply clear that a lot of the burden to cater to the needs of the social sector as well as socially disadvantaged sections of the population under the changed fiscal arrangements, have been accorded to the States on the pretext of higher tax devolutions. This has its own ramifications. First, the union government has successfully reduced its social sector expenditures and would continue to do so in future as and when it transfers some of the schemes listed in Table 3a to the states. Table 4 below reflects this trend of a clear decline in the social sector expenditures as share of GDP. The Centre thus absolves itself from the responsibility of provisioning for social sectors in the ‘expectation’ that the states would continue these programmes by themselves.
Table 4: Social Sector Expenditures by Union Government (in Rs. Crore)
Ministries/Departments
2010-11 2011-12 2012-13 2013-14 2014-15 (RE)
2015-16 (BE)
Addl. Allocation In Union Supplemen-tary demand for grants 2015-16
Ministry of Culture 1322 1309 1388 1989 2159 2169 30Ministry/Deptt. of Drinking Water and Sanitation
10570 9998 12969 11941 12107 6244 3685
Ministry of Health and Family Welfare (including AYUSH)
24450 27199 27885 30135 31965 33282 1652
Ministry of Housing and Urban Poverty Alleviation
828 957 933 1084 3413 5634 821
Ministry of Human Resource Development
51904 60146 66055 71322 70505 69075 1048
Ministry of Labour and Employment
2806 3318 3645 4233 4311 5361 -
Ministry of Minority Affairs
2020 2298 2174 3027 3165 3738 192
Ministry of Social Justice and Empowerment
4245 5029 4940 5515 5893 7162 145
Ministry of Tribal Affairs
3152 3625 3073 3839 3872 4819 -
Deptt. of Urban Development
6572 6858 6541 7297 11013 16832 2000
Ministry of Women and Child Development
10688 15671 17036 18037 18588 10382 4062

13 Cen
tre
for
Bu
dge
t an
d G
over
nan
ce A
ccou
nta
bil
ity
Ministry of Youth Affairs and Sports
2841 970 871 1123 1157 1541 82
Deptt. of Rural Development
72109 64263 50187 58666 68204 71695 1000
Total Expenditure under Social Sector Ministries/Deptts. (Excluding Food Subsidy)
193508 201641 197697 218208 236352 237934 252651
Ministry of Consumer Affairs, Food and Public Distribution (Food Subsidy)
71472 74277 86677 93317 123366 125474 5145
Total Expenditure under Social Sector Ministries/Deptts. (Including Food Subsidy)
264980 275918 284374 311525 359718 363408 383270
GDP at Current Market Prices (2011-12 series)
7783167 8832012 9988540 11345056 12653762 14108945
Share of Social Sector Expenditure (Excluding Food Subsidy) as % of GDP
2.49 2.28 1.98 1.92 1.87 1.69 1.79
Share of Social Sector Expenditure (Including Food Subsidy) as % of GDP
3.40 3.12 2.85 2.75 2.84 2.58 2.72
Source: Compiled by CBGA from Union Budget documents, various years and Supplementary Demand for Grants, 2015-16.
This brings us to the second important question of whether the states are prepared to take up such huge responsibilities in immediate future. This is not to question the step towards fiscal federalism, which is undoubtedly welcome, but to raise an apprehension based on the figures for social sector expenditures made by the states in the last fifteen years. Table 5 clearly shows that social sector expenditures by all states historically in the last fifteen years have not exceeded 40% of the total expenditure of the states, apart from a few states like Chhattisgarh or Meghalaya. The average spending by all states in 2001-14 has been 36% approximately. Therefore, in order to realise the Centre’s expectations that the states would shoulder major responsibilities of provisioning for the social sectors, would only be possible under massive reprioritization of spending patterns in the states as well as flow of adequate resources to fund these expenditure priorities.
It also raises apprehensions about whether all states, specifically the poorer ones, are enough prepared to undergo the reprioritization and planning processes with an immediate effect. It is not to question the capacities of the states to undergo this exercise, but to raise apprehensions for the duration of the gestation period. It is of course a known fact that longer gestation periods would mean delay in implementation and distortion in fund flow mechanisms, not to mention further deteriorated social

Cen
tre
for
Bu
dge
t an
d G
over
nan
ce A
ccou
nta
bil
ity
14
conditions for the poor and marginalized. And in doing so it needs to be ensured that the states do not face any resource constraint.
Table 5: Social Sector Expenditure as share of Total expenditures by States* (in %)
State 2004-05
2005-06
2006-07
2007-08
2008-09
2009-10
2010-11
2011-12
2012-13 (RE)
2013-14 (BE)
Average Expenditure (2001-2014)
Chhattisgarh 37.7 44.2 47.6 46.2 50.1 54.2 50.2 51.6 51.0 53.6 47.0Meghalaya 35.8 38.2 37.6 37.5 35.7 36.6 36.7 39.4 41.6 46.5 45.4Bihar 30.5 38.4 41.0 43.8 43.9 41.8 38.2 40.0 44.6 45.0 40.5Jharkhand 44.1 45.9 47.0 43.5 47.8 44.2 46.4 41.2 44.8 43.9 40.2Rajasthan 34.1 40.1 39.5 38.9 45.2 44.3 42.4 42.6 42.2 43.3 38.6Maharashtra 28.1 35.3 37.3 37.0 36.8 40.3 41.4 41.1 43.0 43.2 38.5West Bengal 29.1 28.2 31.9 34.7 31.9 40.7 41.9 42.5 42.8 43.0 38.3Haryana 24.2 32.0 28.5 33.3 37.2 41.0 39.6 40.9 40.0 42.1 37.3Karnataka 28.5 33.4 32.7 36.7 37.8 39.9 39.9 37.8 41.1 42.1 37.2Andhra Pradesh 29.3 30.8 32.9 32.7 38.9 35.6 38.9 39.2 40.6 41.8 37.2Uttarakhand 36.6 36.3 37.9 37.4 38.4 42.3 42.5 45.5 41.2 41.7 36.9
Madhya Pradesh 24.7 32.5 35.3 35.7 36.7 35.2 39.0 33.6 41.8 41.6 36.5Odisha 28.9 34.2 31.7 35.9 41.6 41.0 42.3 42.9 41.5 39.9 35.9Uttar Pradesh 28.6 33.7 32.1 34.4 37.8 39.0 37.7 38.8 40.3 39.6 35.7Gujarat 29.0 32.1 33.4 34.9 35.0 38.4 39.9 38.2 39.0 39.1 35.5Tripura 37.6 34.0 36.5 36.5 37.2 37.9 38.4 41.7 44.2 38.0 35.1Tamil Nadu 32.6 36.9 33.1 35.9 39.7 40.3 40.2 38.3 38.9 37.9 34.8Assam 32.4 36.8 38.7 40.0 38.7 36.7 39.5 37.0 38.4 37.0 34.6Goa 31.4 30.9 31.8 31.6 32.2 32.5 33.5 33.1 34.9 36.4 34.1Himachal Pradesh 29.0 32.7 33.0 35.2 36.6 35.0 37.3 34.6 35.5 35.9 34.0Kerala 36.2 35.6 31.0 31.4 33.4 33.6 33.4 34.8 34.7 35.7 33.9Sikkim 22.2 23.3 24.3 23.5 27.4 28.8 30.9 36.8 35.4 35.2 30.9Punjab 17.8 19.8 17.9 18.8 23.8 22.7 22.5 27.1 32.6 32.2 30.2Mizoram 35.6 33.3 34.8 36.7 40.1 41.5 38.6 36.6 38.0 30.3 29.5Nagaland 27.6 28.6 29.6 29.5 28.3 25.9 28.3 24.9 28.6 28.9 28.8Manipur 33.6 34.2 28.7 31.7 32.9 32.5 31.6 29.4 30.9 27.0 28.3Jammu and Kashmir 27.9 29.9 31.3 30.0 29.9 30.6 29.1 29.3 27.0 25.8 26.8Arunachal Pradesh 31.2 30.4 30.2 31.1 29.9 33.7 28.1 32.4 26.9 20.8 22.9

15 Cen
tre
for
Bu
dge
t an
d G
over
nan
ce A
ccou
nta
bil
ity
All States 29.6 33.7 33.9 35.3 37.6 38.7 39.0 38.7 40.4 40.5 35.7
NCT Delhi 33.1 41.0 39.6 40.5 43.8 42.2 42.4 50.0 48.3 46.7 40.5Puducherry NA 36.7 34.7 35.8 35.9 38.1 38.3 45.9 39.8 36.1 37.9
Notes: RE: Revised Estimates. BE: Budget Estimates. NA- Not applicable/Not available. * Includes expenditure on social services, rural development and food storage and warehousing under revenue expenditure, capital outlay and loans and advances by the State Governments.Source: Compiled by CBGA from State Finances: A Study of Budgets, 2013-14, RBI, Mumbai.
Hence, it follows from the above discussion that the step towards ‘cooperative federalism’, with increased autonomy and flexibility in spending abilities for the states would yield improved outcomes based on a singular question of whether the overall size of the pie improves for the better. This remains to be seen in the subsequent years, as soon as greater details of state level expenditures begin appearing in the public domain.

Cen
tre
for
Bu
dge
t an
d G
over
nan
ce A
ccou
nta
bil
ity
16
• Size of the Union Budget 2015-16 (BE) is 12.6% of GDP
• Size of Union and State Budgets combined for 2013-14 (BE) was 27%
• Union tax-GDP ratio for 2015-16 (BE) is 10.3%
• Tax-GDP ratio of centre and states combined is 17.9% for 2013-14 (BE)
• GST to be implemented from April 1, 2016
The Union Budget 2015-16 with an estimated size of Rs 17,77,477 crore (12.6% of GDP) is Rs 96,319 crore more than the revised estimates of 2014-15. But relative to the size of the Indian economy, the magnitude of Union Budget spending has seen a continuous decline since a peak of 15.9% of GDP in 2009-10.
Chart 1: Magnitude of Union Budget Spending in India
14.0
15.7 15.915.4
14.814.1
13.713.3
12.6
12.012.513.013.514.014.515.015.516.016.5
Source: Union Budget 2015-16
Even if we combine the budgetary spending of the Centre and States, India’s total government spending compared to the size of its economy is only 27% (Indian Public Finance Statistics 2013-14), which is much lesser than that of developed and most developing countries. It is also one of the lowest among some of the fastest growing economies in the world, namely, BRIICSAM (Brazil, Russia, India, Indonesia, China, South Africa and Mexico) countries (Chart 2).
ARE THERE ENOUGH TAX RESOURCES?2

17 Cen
tre
for
Bu
dge
t an
d G
over
nan
ce A
ccou
nta
bil
ity
Chart 2: Government Spending to GDP Ratios in BRIICSAM Countries
38.3 39.2 41.1
34.335.9 37.9
30.1 31.933.1
20.4
23.9
29.0
25.626.3
27.129.7
26.727.0
21.2
18.620.1
15.0
20.0
25.0
30.0
35.0
40.0
2008 2009 2010 2011 2012 2013
Brazil
Russia
South Africa
China
Mexico
India
Indonesia
Source: International Monetary Fund, World Economic Outlook Database, April 2014Note: Total expenditure consists of total expense and the net acquisition of nonfinancial assets. Apart from being on an accrual basis, total expenditure differs from the Government Finance Statistics Manual 1986 definition of total expenditure in the sense that it also takes the disposals of nonfinancial assets into account
The low levels of government spending in India can be attributed to lower levels of revenues, especially tax revenues. When there more tax revenues, it increases the room in a government’s budget so that it can spend more without borrowing. This lower fiscal space is not expected to improve too much over the course of the next few years (Chart 3).
Chart 3: Tax-GDP Ratio (for Gross Central Tax Revenue)*
9.9
10.310.5
10.7
9.8
10.2
10.6
2014‐15 (RE) 2015‐16 (BE) 2016‐17 (Estimate)
2017‐18 (Estimate)
Source: Macroeconomic Framework Statement, Union Budget 2015-16Note*: Gross Central Tax Revenue for 2015-16 (BE) is Rs 14,49740.6 crore out of which Rs 5,23,958.24 crore is transferred to the states
Even when we compare across BRIICSAM countries, India has one of the lowest tax-GDP ratios (Chart 4) which constraints in fiscal policy space.

Cen
tre
for
Bu
dge
t an
d G
over
nan
ce A
ccou
nta
bil
ity
18
Chart 4: Tax-GDP Ratios across BRIICSAM Countries
14.0 13.416.9 16.8
27.4
35.630.1
13.117.9
19.724.4
28.2 30.633.7
0.05.010.015.020.025.030.035.040.0
Indonesia India Mexico China South Africa Russia Brazil
2002 2012
Source: Government Finance Statistics Yearbook of various years published by IMF; China Statistical Yearbook 2003 published by National Bureau of Statistics of China; Revenue Statistics in Latin America 2014 published by OECD; Indian Public Finance Statistics 2013-14 published by Ministry of Finance, IndiaNotes: (1) Figures for Mexico and Brazil are for 2000 and 2011 respectively and calculated from Revenue Statistics in Latin America 2014 published by OECD (2) Figures for India are from 2001-02 and 2013-14(BE) respectively obtained from Indian Public Finance Statistics 2013-14 published by the Ministry of Finance of India (3) Figure for China for 2002 was calculated from the China Statistical Yearbook 2003 published by the National Bureau of Statistics of China (4) Figures for Indonesia, South Africa and Russia were obtained from Government Finance Statistical Yearbook 2003 published by IMF (5) Figures for Indonesia, Russia and South Africa for 2012 and China for 2011 were extracted from the IMF Data warehouse on 12/27/2014 4:32:32 AM, Government Finance Statistics Yearbook. (6) Figures are for general government except for Indonesia; Indonesia figures are for its central government’s budgetary transactions.
Despite the Finance Minister’s concern that the “fiscal space has not just been reduced, but squeezed”, the focus is on “maintaining fiscal discipline” rather than augmenting resource mobilization. The Economic Survey 2014-15 calls for “expenditure compression” to meet the fiscal deficit targets.
Property Tax Reforms: Says the Fourteenth Finance Commission (FFC)
With an increase in responsibilities of sub-national governments in spending for the social sector (higher devolution and transfer of several Centrally Sponsored Schemes), the 14th FFC has called for strengthening mechanisms for assessment and improving efficiency in levy, collection and billing of property taxes. The assessment may be done every 4-5 years while minimizing exemptions so that local governments have more own sources of revenue.
GST for Enhanced Revenue Generation: Economic SurveyAccording to the Economic Survey 2014-15, enhanced revenue generation will be possible through higher growth rates and through the implementation of the Goods and Services Tax (GST). GST is expected to “add buoyancy to the economy by developing a common Indian market and reduce the cascading effect on the cost of goods and services”.

19 Cen
tre
for
Bu
dge
t an
d G
over
nan
ce A
ccou
nta
bil
ity
Tax Exemptions given by the Central Government- 2014-15
The ‘Revenue foregone statement under the Central Tax System’ has been reframed as ‘Statement of Revenue Impact of Tax Incentives under the Central Tax System’. The aggregate revenue impact of tax incentives is Rs 549984.1 crore for 2013-14 and projected to be Rs 589285.2 crore for 2014-15. The revenue foregone is estimated to be 43.2% of total tax revenue for the year 2014-15. The tax incentives provided to some of the sectors in the year 2014-15 are not considered to be productive. It means, if the incentives are withdrawn, it would hardly affect overall economic growth and development. Some of them are listed in the following
• Exemptions of corporate profits given to industries located in SEZ are estimated to Rs 19, 000 crore
• Tax exemptions given on account of contributions given to political parties stand at Rs 32 crore
• Custom duty exemption given to gold and diamond traders is Rs 75,592 crore in 2014-15. This is 56 percent higher compared to the exemption given in the previous year
• Effective tax rates for cement manufacturing companies are as low as 5.8%
• Some mining contractors are charged with an effective tax rate of 7.2%
• In the financial services sector, leasing companies are charged with a very low effective tax rate of 1.84%
• Effective tax rates for some of the film distribution firms are 9.2% against the statutory rate of 33.3%

Cen
tre
for
Bu
dge
t an
d G
over
nan
ce A
ccou
nta
bil
ity
20
• Corporate Tax to reduce from 30% to 25% over the next four years, starting next financial year
• General Anti Avoidance Rules (GAAR) deferred by two years; to apply prospectively from 2017
• Shome Committee proposal on indirect transfer accepted. ‘Substantial Value’ clarification: Indian assets worth more than 10 crore, 50% of total assets of foreign company transferred
• Tax Administration Reform Commission (TARC) recommendations to be implemented this year
Tax Rates and Ease of Doing Business Where is the evidence that they are related?
World Bank appointed Independent Panel Review of Doing Business Report
“It is of particular concern if the rankings are misused to promote questionable tax policies or if administrative decisions are driven by a desire to improve a country’s position in the overall rankings, rather than by ensuring that the tax system meets the country’s real needs”.
India’s low ranking at 142 on the World Bank’s ease of doing business index of 189 countries was highlighted as a cause for concern in the run-up to the budget. The low ranking also featured prominently in arguments that favoured rationalising tax rates prior to the budget. There is no question that ease of doing business needs to improve in India, but there is no clear evidence that tax rates are a factor. In fact, the World Bank Doing Business index has itself been criticised for its tax indicator.
A World Bank appointed independent panel reviewed the ‘Doing Business’ index and published their recommendations in 20131. Among many concerns, it noted the ‘Paying Taxes’ indicator to be one of the most controversial in the index due to its extensive use in country-level policy or political debates. The panel further recommended that the tax rate indicator should be removed as it is not a relevant measure of the ease of doing business in a country.
Though the World Bank 2015 Doing Business Index did not withdraw this indicator, they noted that lower tax rates are not necessarily better as some economies have tax-GDP ratios that are so low it affects government’s ability to regulate efficiently, invest in infrastructure and provide basic health and education services to the poor. This concern is evident in India, with a tax-GDP ratio of approximately 17%, which is the lowest among BRICS and is at the bottom of G20. Further, this erosion of direct taxes and reliance on indirect taxes increases the overall burden on the poorer sections of society. With direct taxes contributing only one-third of total tax revenues, direct tax cuts and exemptions further aggravates our regressive tax structure.
1 http://www.dbrpanel.org/sites/dbrpanel/files/doing-business-review-panel-report.pdf
INVESTOR FRIENDLY: AT WHAT COST?3

21 Cen
tre
for
Bu
dge
t an
d G
over
nan
ce A
ccou
nta
bil
ity
The move to rationalise corporate tax incentives is certainly welcome. Though it remains to be seen if the phased rationalisation of corporate tax exemptions along with the tax cut will have a revenue neutral effect as some have argued, the broader trend of erosion of tax base, especially for direct taxes is more important to note in this context.
Reduced Corporate Tax Rate: A Race to the Bottom Policy Focus should be on Regional Harmonisation of Tax Rates, not Tax Competition
The Finance Minister in his Budget Speech referenced the lower corporate tax rates of other major Asian countries as the rationale for reducing the rate to 25% over the next four years. As per Chart 1 below, though it is true that many developing countries have corporate tax rates below 30%, researchers have highlighted this to be a worrying trend.
IMF’s Keen and Simone (2004)2 have noted, in their research on tax competition, that downward pressure on corporation tax revenues is more striking in developing economies than developed. This trend is of concern since leading this race to the bottom are tax havens with no tax or very low tax rates. For a developing country struggling to raise tax revenues, India should be a leader in discussions on harmonisation of tax rates in Asia and globally, rather than a follower of such harmful tax competition.
Chart 1: Corporate Tax Rates across Select Developing Countries
20 2025 25 25 28 30 30
34 35
05
10152025303540
Source: KPMG Database (as of 28 February 2014)
If the intent was to bridge the gap between statutory and effective corporate tax rate, rationalising incentives alone would have sufficed to increase the effective tax rate. The political choice for the convergence of the rates has been to decrease the statutory tax rate rather than increase effective tax rates—a choice that deserves more debate.
Yet again, India remains behind its BRICS contemporaries with Brazil having introduced GAAR in 2001, South Africa in 2006 and China in 2008. India attempted to introduce GAAR in 2012, but the reason given for its postponement was that the tax administration was not ready for its implementation and will only result in scaring away foreign investors. Three years on, the same argument is heard to further postpone its introduction.
2 Keen and Simone (2004), Tax Notes International, Special Supplement

Cen
tre
for
Bu
dge
t an
d G
over
nan
ce A
ccou
nta
bil
ity
22
Introducing GAAR: Addressing Tax Avoidance Should Be A PriorityPutting in place checks and balances, if still absent, is practical; not further postponement
UNCTAD World Investment Reports: MNCs rate India as an attractive investment destination
As per UNCTAD’s World Investment Reports in 2012, 2013 and 2014, India has been ranked among the top 4 countries in the world, as per a survey of MNCs, according to its attractiveness for investment.Yet, reports suggested that investors were scared away from investing in India due to its tax policies during this period.
The argument on ensuring a non-adversarial tax regime is well-taken and no tax payer should be unduly harassed. But suggesting that GAAR should not be introduced, instead of exploring checks and balances still absent in current guidelines, is asking that the government turn a blind eye to widespread tax avoidance that exists. After all, GAAR is meant to address important issues such as abuse of tax treaties, use of tax havens for the purpose of reducing tax bills and other clever tax avoidance arrangements that are draining the country’s resources.
Introducing GAAR would also be in line with current global efforts to address tax dodging by multinational corporations being led by OECD and G20 through the ‘Base Erosion and Profit Shifting (BEPS)’ initiative. India’s involvement in this initiative should in no way hinder efforts to introduce GAAR right now, as has been suggested by the Memorandum to the Finance Bill 2015. OECD countries are themselves moving ahead with measures in line with BEPS and beyond it.
Further postponement and the amendment to ensure GAAR is applied prospectively from 2017, only raises more questions about widespread use of aggressive tax planning schemes in the corporate sector. If not, why all the fuss then from genuine investors who would not be affected by GAAR?
There is a consensus in the literature about the main factors affecting (foreign) investment location decisions. The most important ones are market size and real income levels, skill levels in the host economy, the availability of infrastructure and other resource that facilitates efficient specialisation of production, trade policies, and political and macroeconomic stability of the host country.
Survey analysis shows that host country taxation and investment incentives play only a limited role.
- OECD (2008), “Tax Incentives for Investment: A Global Perspective Experiences in MENA and non-MENA Countries”

23 Cen
tre
for
Bu
dge
t an
d G
over
nan
ce A
ccou
nta
bil
ity
INDIRECT TAXES: GREATER BURDEN ON THE POOR
• Modernised indirect taxes regime; Goods and Services Tax (GST)
• Net revenue gain of Rs 15,068 crore through an indirect tax gain of Rs 23,383 crore over a direct tax loss of Rs 8,315 crore
• Reduced rates of basic customs duty on certain inputs, raw materials, intermediates and components (in all 22 items)
• The new Service Tax rate subsuming ‘Education Cess’ and ‘Secondary and Higher Education Cess’ increased to 14%
• Wealth tax abolished and replaced with 12% surcharge on super-rich
• Clean Energy Cess from Rs 100 to Rs 200 per metric tonne of coal to finance clean environment initiatives
• Enabling provision to levy Swachh Bharat Cess at a rate of 2% or less on all or certain services if need arises on a date yet to be notified
Tax StructureA progressive structure of taxation implies that individuals and corporations pay taxes according to their ability to pay. In India, for every Rs 100 collected as tax revenues, approximately Rs 30 comes from direct and the rest is from indirect taxes, respectively i.e. a major proportion of tax revenues are collected from those on goods and services while the rest come from taxes on income, profit, capital gains, property, goods and services etc (Chart 1).
Chart 1: Direct versus Indirect Taxes in India’s Total (Centre and States) Tax-GDP Ratio
5.8 5.8 5.6 5.7 69.6 10.5 10.7 11.5 11.9
0
5
10
15
2009‐10 2010‐11 2011‐12 2012‐13 (RE) 2013‐14 (BE)
Total Direct Tax (Percent GDP) Total Indirect Tax (Percent GDP)
Source: Indian Public Finance Statistics 2013-14
As is evident from Chart 1, the share of direct taxes in the total tax-GDP ratio has remained stagnant between 5.8 and 6.0% since 2009-10 while the share of indirect taxes has been increasing in an already decreasing overall tax-GDP ratio.
4

Cen
tre
for
Bu
dge
t an
d G
over
nan
ce A
ccou
nta
bil
ity
24
Comparing India’s tax structure across BRIICSAM countries (Chart 2), while India has managed to increase its share of direct tax revenues in total tax revenues in the last decade or so, in the last two budgets, there has been a noticeable shift towards augmenting more indirect tax revenues at the cost of direct tax revenues. A regressive tax structure such as this is at a cost to the poor and most vulnerable sections of society.
Chart 2: Direct Tax Revenue as a Percentage of Total Tax Revenue
23.2 24.4
53.959.1
52.961.9 58.9
33.4 34.4
45.8 50.355.3 59.6
64.1
010203040506070
India China Indonesia Russia Brazil South Africa Mexico
2002 2012
Notes: (1) Figures for Mexico and Brazil are for 2000 and 2011 respectively and calculated from Revenue Statistics in Latin America 2014 published by OECD (2) Figures for India are from 2001-02 and 2013-14 (BE) respectively obtained from Indian Public Finance Statistics 2013-14 published by the Ministry of Finance of India (3) Figure for China for 2002 was calculated from the China Statistical Yearbook 2003 published by the National Bureau of Statistics of China (4) Figures for Indonesia, South Africa and Russia were obtained from Government Finance Statistical Yearbook 2003 published by IMF (5) Figures for Indonesia, Russia and South Africa for 2012 and China for 2011Source: Government Finance Statistics Yearbook of various years published by IMF; China Statistical Yearbook 2003 published by National Bureau of Statistics of China; Revenue Statistics in Latin America 2014 published by OECD; Indian Public Finance Statistics 2013-14 published by Ministry of Finance, India
Tax as an Instrument of Re-distributing Wealth and IncomeAs per the Credit Suisse’s Global Wealth Databook 2014, the top percentile of India owns upto 49 percent of the wealth. The wealth tax revenue which was Rs 1008 crore in 2013-14 was only Rs 950 crore in 2014-15 (RE). The Finance Minister in his budget speech asked “should a tax which leads to high cost of collection and a low yield be continued or should it be replaced with a low cost and higher yield tax?” But does it still incur such a high cost? In 2001-02, the cost of wealth tax collection was 53.8% of the actual wealth tax revenues1. In 2013-14, this decreased to 1% (approx.)2.
Most of the proposals in the current budget are to augment indirect tax revenues, coupled with direct tax exemptions which increase the regressivity in the tax structure. There are no proposals to tap revenues through inheritance or wealth taxes. Instead, there is an increase in the surcharge on the super-rich by 2% (which takes the total to 12%) and an increase in service tax to 14% in order to align with the Goods and Services Tax (GST). It is worthy to note that cesses and surcharges are not included in the divisible pool of taxes that are shared with the states.
1 Property Taxes Across G20 Countries, Prakash, P. (2011), CBGA and Oxfam India2 Calculated from Expenditure Budget 2015-16, Vol. II
25 Cen
tre
for
Bu
dge
t an
d G
over
nan
ce A
ccou
nta
bil
ity
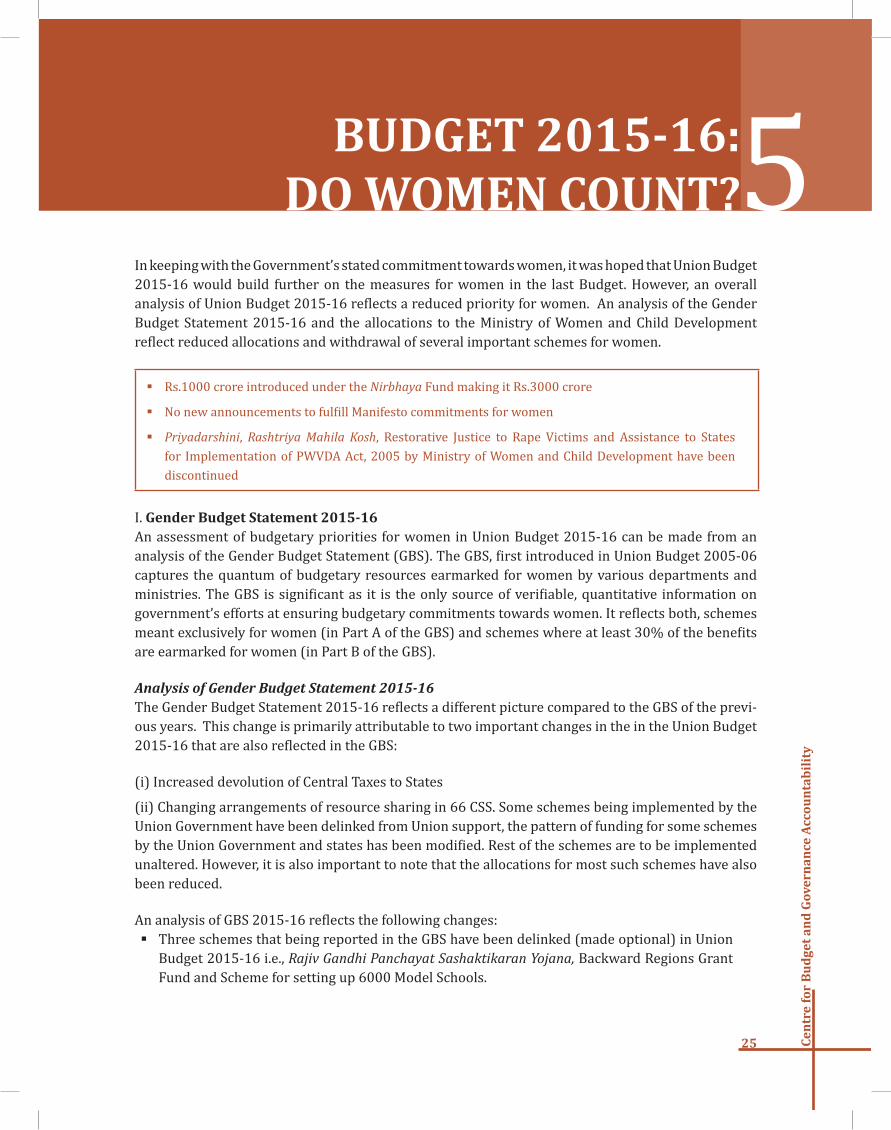
In keeping with the Government’s stated commitment towards women, it was hoped that Union Budget 2015-16 would build further on the measures for women in the last Budget. However, an overall analysis of Union Budget 2015-16 reflects a reduced priority for women. An analysis of the Gender Budget Statement 2015-16 and the allocations to the Ministry of Women and Child Development reflect reduced allocations and withdrawal of several important schemes for women.
Rs.1000 crore introduced under the Nirbhaya Fund making it Rs.3000 crore
No new announcements to fulfill Manifesto commitments for women
Priyadarshini, Rashtriya Mahila Kosh, Restorative Justice to Rape Victims and Assistance to States for Implementation of PWVDA Act, 2005 by Ministry of Women and Child Development have been discontinued
I. Gender Budget Statement 2015-16 An assessment of budgetary priorities for women in Union Budget 2015-16 can be made from an analysis of the Gender Budget Statement (GBS). The GBS, first introduced in Union Budget 2005-06 captures the quantum of budgetary resources earmarked for women by various departments and ministries. The GBS is significant as it is the only source of verifiable, quantitative information on government’s efforts at ensuring budgetary commitments towards women. It reflects both, schemes meant exclusively for women (in Part A of the GBS) and schemes where at least 30% of the benefits are earmarked for women (in Part B of the GBS).
Analysis of Gender Budget Statement 2015-16The Gender Budget Statement 2015-16 reflects a different picture compared to the GBS of the previ-ous years. This change is primarily attributable to two important changes in the in the Union Budget 2015-16 that are also reflected in the GBS:
(i) Increased devolution of Central Taxes to States
(ii) Changing arrangements of resource sharing in 66 CSS. Some schemes being implemented by the Union Government have been delinked from Union support, the pattern of funding for some schemes by the Union Government and states has been modified. Rest of the schemes are to be implemented unaltered. However, it is also important to note that the allocations for most such schemes have also been reduced.
An analysis of GBS 2015-16 reflects the following changes:Three schemes that being reported in the GBS have been delinked (made optional) in Union
Budget 2015-16 i.e., Rajiv Gandhi Panchayat Sashaktikaran Yojana, Backward Regions Grant Fund and Scheme for setting up 6000 Model Schools.
BUDGET 2015-16: DO WOMEN COUNT?5

Cen
tre
for
Bu
dge
t an
d G
over
nan
ce A
ccou
nta
bil
ity
26
Among the schemes that continue to be implemented unaltered by the Union Government, the allocations for Mid-Day Meal, Rajiv Gandhi Scheme for Empowerment of Adolescent Girls- SABLA and Umbrella Scheme for Protection and Development of Women have been reduced in Union Budget 2015-16.
The third important change in the GBS 2015-16 is reflected in reduced Union Government allocations for a number of schemes: Rashtriya Madhyamik Shiksha Abhiyan, Rashtriya Uchcha Shiksha Abhiyan, Indira Awas Yojana and Integrated Child Development Service. The reduced allocations, as explained in the GBS are on account of “enhanced devolution of Union Taxes to States as recommended by the Fourteenth Finance Commission”. To keep the Budget for these programmes unchanged, it is stated that “States are to contribute from their enhanced resources”. However, in this regard, it is important to note that the allocation of resources to these schemes by states would depend on the prioritisation for these by the states.
Table 1: Allocations to Select Schemes as Reflected in GBS (in Rs. Crore)
2014-15 (BE)
2015-16 (BE)
Addl. Allocations in 2015-16 SB
Mid-Day Meal (Core) 3965 2771 -SABLA (Core) 700 10 400Scheme for Protection and Development of Women* (Optional)
315 78 -
RMSA (Core) 1500 1010 -RUSA (Core) 660 347 -IAY (Core) 160 10025 -ICDS (Core) 10735 7502 3600* Includes National Mission for Empowerment of Women, Swadhar Greh, Restorative Justice for Rape Victims, Assistance to Implementation of PWDVA Act, 2005)
Source: Expenditure Budget Vol 1, Union Budget Documents, 2015-16 and Supplementary Demand for Grants, 2015-16
Analysis of Part A of GBS 2015-16Part A of the GBS reflects funds exclusively for women. The total quantum of funds, in Part A of the GBS is Rs. 16,657 crore in 2015-16 (BE). Chart 1 presents the allocations in Part A of GBS as a proportion of the Union Budget and GDP.
As reflected in Chart 1, the magnitude of funds meant exclusively for women have declined as a proportion of the Union Budget and GDP in 2015-16. This decline is indicative of the reduced priority for women in the Union Budget.
A scrutiny of GBS in Union Budget 2015-16 also points to the fact that most interventions meant specifically for women are meagerly funded. Chart 2 presents a snapshot of budgetary outlays for women specific schemes as reflected in Part A of the GBS.

27 Cen
tre
for
Bu
dge
t an
d G
over
nan
ce A
ccou
nta
bil
ity
Chart 1: Allocations in Part A of GBS as a Proportion of the Union Budget and GDP
1.55
1.32
1.53
1.040.94
0.23 0.19 0.21 0.14 0.12
0
0.2
0.4
0.6
0.8
1
1.2
1.4
1.6
1.8
2011‐12 (RE) 2012‐13 (RE) 2013‐14 (RE) 2014‐15 (RE) 2015‐16 (BE)
Allocations in Part A of GBS as a percent of Union Budget
Allocations in Part A of GBS as percentage of GDP
Note: GDP figures upto 2010-11 based on old series (2004-05). GDP Figures from 2011-12 onwards based on new series (2011-12)Source: Compiled by CBGA from Union Budget Documents, , Various Years
As reflected in Chart 2, only three schemes i.e., Infrastructure Maintenance (Department of Health and Family Welfare), Nirbhaya Fund for Safety of Women (Department of Economic Affairs) and Indira Awas Yojana have allocations exceeding Rs. 1,000 crore. Likewise, only two schemes, Indira Gandhi Matritva Sahyog Yojana (Ministry of Women and Child Development) and Scheme on Women Safety on Public Road Transport from Nirbhaya Fund1 (Ministry of Road Transport& Highways) have allocations of more than Rs. 100 crore. Most schemes, meant only for women have allocations of less than Rs. 100 crore.
Chart 2: Allocations to Schemes Exclusively for Women as Reported in Part A of GBS 2015-16
54
2
3
0 10 20 30 40 50 60
Number of schemes with allocations less than Rs.100 crore
Number of schemes with allocations of Rs. 100 crore or more
Number of schemes with allocations of Rs.1,000 crore or more
Source: Compiled by CBGA from Union Budget Documents, Various Years
Quality of Reporting in Part B of GBSA concern while analysing the GBS pertains to the quality of reporting in the GBS by various departments and ministries. The methodology of preparation of the GBS this year too, does not appear to have undergone any revision. An analysis of the GBS 2015-16 reflects that concerns with the quality of reporting continue to persist.
1 The total magnitude of Nirbhaya Fund is a corpus of Rs.3,000 crore

Cen
tre
for
Bu
dge
t an
d G
over
nan
ce A
ccou
nta
bil
ity
28
For schemes reported in Part B, no rationale is provided for why certain proportions of the schemes’ total allocations are being reported in the GBS by concerned departments/ministries. Though some schemes have clear guidelines for ensuring benefits to women (such as MGNREGA and Nehru Yuva Kendra Sangathan), based on which reporting is done under GBS, a number of schemes report a blanket 30-50 percent of their total allocations in Part B. These schemes do not provide clear guidelines to justify their inclusion or any information on beneficiaries / programme objectives to substantiate such proportions (such as Sarva Shiksha Abhiyan, Integrated Child Protection Scheme).
Another concern with the reporting pertains to inconsistencies; several schemes report 100 percent or more of their allocations in Part B of the GBS (such as Pre Matric Scholarship for Minorities, Improvement in Working Conditions of Child/Women Labour)
Allocations to schemes under Ministry of Women and Child DevelopmentThe Ministry of Women and Child Development (MWCD) is the nodal agency for the welfare, development and empowerment of women. The total allocations to the Ministry have declined from Rs. 21,193 crore in 2014-15 (BE) to Rs. 14,382 crore in 2015-16 (BE), after taking into account supplementary grants for ICDS and SABLA.
Table 2: Allocations to Schemes in category A and B (In Rs. Crore)
Schemes 2014-15 2015-16 Addl. Allocations in 2015-16 SB
(BE) (RE) (BE)
Indira Gandhi Matritva Sahyog Yojana 400 360 402.23Swadhar Greh 115 30 50Restorative Justice to Rape Victims 20 0 0Rashtriya Mahila Kosh 20 0 0Beti Bachao, Beti Padhao* 90 45 97One Stop Crisis Centres 20 0 2 6.25Women’s Helpline 10 0 1National Mission for Empowerment of Women 90 10 25Rajiv Gandhi Scheme for Empowerment of Adolescent Girls (SABLA)
700 630 10 400
Assistance to States for Implementation of Protection of Women From Domestic Violence Act,2005
50 0 0
Note: Figures include lumpsum provision for NER and Sikkim *Does not include lump sum provision for the NER Source: Compiled by CBGA from the Union Budget documents, 2015-16 and Supplementary Demand for Grants, 2015-16
Table 2 captures the schemes by the Ministry of Women and Child Development that will be fully supported by the Union Government, i.e. schemes for which the pattern of Centre-State sharing remains unchanged. It is important to note that most of these schemes have either been discontinued, or as the allocations reflect, are likely to be withdrawn in the coming years.

29 Cen
tre
for
Bu
dge
t an
d G
over
nan
ce A
ccou
nta
bil
ity
Scheme for Assistance to States for Implementation of Protection of Women from Domestic Violence Act, 2005, Rashtiya Mahila Kosh and Restorative Justice to Rape Victims have not been allocated any funds this year
Allocations to Rajiv Gandhi Scheme for Empowerment of Adolescent Girls (SABLA), Women’s Helpline, Swadhar Greh and one Stop Crisis Centres reflect that these schemes are likely to be discontinued and will not receive and allocations in the coming years. Moreover, it is important to note that the allocations to Swadhar Greh and SABLA are being met from the Nirbhaya Fund. Resources under the Nirbhaya Fund are meant to be utilised for substantive interventions to ensure safety and security of women and should not be used for meeting expenses under existing schemes.
Though the outlay for Indira Gandhi Matritva Sahyog Yojana have not been reduced, the allocations for 2015-16 reflect that the scheme will continue to be implemented in 53 districts on a pilot basis
The need to strengthen budgetary outlays, especially for interventions to address violence against women, has been ignored in Union Budget 2015-16. A number of critical schemes to meet the needs of women in distress have been withdrawn in this Budget. The Government’s announcement of setting up of a One Stop Crisis Centre in each district of the country, seems to have been reversed in this Budget. Even the Manifesto Commitments of operationalisation of the Scheme for Restorative Justice to Rape Victims and introduction of an Acid Attack Victim’s Welfare Fund have been unmet in this Budget.
Schemes those are not ‘Core of the Core’: Integrated Child Development Service
Among the schemes by Ministry of Women and Child Development that will have a changed sharing pattern is the Integrated Child Development Service (ICDS). The Union Government allocations to ICDS in BE 2015-16 is Rs. 8,754 crore as against Rs.18,391 crore in BE 2014-15. Another Rs. 3600 crore have been added in Union supplementary grants which make it to Rs.12,354 crore. Under the new arrangements, the Union Government will only provide infrastructure expenditure (such as expenditure on construction of Anganwadi Centres etc.). The Centre would also provide support for salaries for the existing AWW and AWH but not support any hike in honorariums/salaries of staff or for any new recruits. The states are also expected to bear any other expenditures such as recurring expenditures including honorarium/salaries to Anganwadi workers and helpers, etc. from 2017 onwards, which is going to be a large part of expenditure under the scheme. Once the infrastructure needs under the scheme have been met, most expenditure under the scheme will be revenue expenditure. Thus, over the years, an increasing part of the expenditure for the scheme will have to be borne by the states.
In such a scenario, the resources allocated by the states towards the scheme will determine to a large extent, how well the budgetary requirements under the scheme are being met. Though the Union Budget documents emphasis that this shortfall will be met by the States, it remains to be seen how the states prioritise the allocations from the untied funds available to them.

Cen
tre
for
Bu
dge
t an
d G
over
nan
ce A
ccou
nta
bil
ity
30
Status of Children and their BudgetIndia is home to about 442 million children aged 0-18 years, who constitute 39 percent of the country’s population. Policy makers visualise them as the nation’s assets. But, the dominant attitude of the nation is to treat children as a passive group, which is reflected in the designing, implementing and monitoring of child related schemes without their consultation. In fact, the government remains assured of catering to the need of children via CSOs working in the field of children’s rights. It could be what government see them as, if they are healthy, secure and develops well. According to the government’s Combined Report1 on Committee on the Rights of the Children (CRC), 2011, “many of the outcome indicators for children point to the disadvantaged status of children; the proportion of Child Budget in the Union Budget seems inadequate.”2 Data shows there is improvement in some of the outcome indicators of children’s well-being, however, in others, children continue to lag behind. Hence, their needs and entitlements are specific to their area, group, and age; and accordingly, require a variety of interventions.
There has been a budgetary outlay by the government for policies and schemes towards the upliftment of children. For instance, during 11thFive Year Plan (FYP), the total expenditure on children related schemes was around Rs. 202,819.6 crore. The 12thFYP (2012-17) recognised the urgency and importance of addressing the vulnerabilities of children in India’s population. Despite the recognition of child budgeting in the Five-year Plan documents, the share of child budget in the Union budget has never been more than 5 percent. Even this allocation has always been tilted in favour of educational schemes of children as shown in chart 1.
Chart 1: Component-wise comparison of children schemes (in %)
72.2
23.3
3.6 0.8 0.1
79.1
15.63.9 1.3 0.1
Education Development Health Protection Others
2014‐15 (BE) 2015‐16 (BE)
Source: Statement 22, Child Budget of Various years
1 It is combined report prepared by Central, States, NGOs and UNICEF. 2 India: Third and Fourth Combined Periodic Report on the Convention on the Rights of the Child http://wcd.nic.in/crc3n4/crc3n4_1r.pdf
BUDGETS FOR CHILDREN6

31 Cen
tre
for
Bu
dge
t an
d G
over
nan
ce A
ccou
nta
bil
ity
Box 1: Some Important Schemes for Children under newly defined Categories
Category A and B (Core) Delinked Schemes and others (C and D)
ICPS ICDS
None
NCPCR National AIDS & STD Control Programme
National Nutrition MissionSSAMDMBeti Bachao Beti Padhao
Source: Budget At a Glance, Annex-III, 2015-16 and REPORT OF THE SUBGROUP OF CHIEF MINISTERS ON RATIONALISATION OF THE CSS
With the new government at the helm of affairs, there have been substantial changes in the reporting of budgetary allocation, in general. After the acceptance of the Fourteenth Finance Commission recommendation to devolve Central Taxes from 32 percent to 42 percent, the budgetary allocation appears deceptively lower in the social sector. It does appear in child budgeting where ICDS, MDM, SSA and other vital schemes have lower allocation. But, the Union Budget does use a caveat that ‘states are going to contribute for the schemes related to children from their enhanced resource. The total resources will remain unaffected’.
But, it has to be looked critically as this devolution of fund to the states is untied in nature. Outlays depend on the state priority for the social sector and the Union government does not have any control over it. Further,, the Union Budget has divided schemes into three categories – schemes that are fully funded by Union; schemes delinked from support of the centre; schemes to be run with the changed sharing pattern. There are a number of schemes which do not fall into any of these categories.
Schemes as per Different needs Child mortality, malnourishment, labour, abuse and exploitation, and child trafficking are areas of concern that need to be addressed through financial commitments. Post-birth survival is another issue that Indian children are grappling with. Today, the Infant Mortality Rate (IMR) in India is 40. And over 1,00,000 children, below the age of 11 months, die of diarrhea annually in India.3 Water borne diseases and Acute Respiratory Infections (ARI) are also a serious concern. Similarly, the rising incidence of tuberculosis in infants and young children needs acknowledgment and higher investment.
However, child health received 0.16 percent share in the Union Budget 2014-15 (BE); which was a decline from 0.18 percent in 2012-13 to 0.16 percent in 2014-154. In 2015-16 (BE) total allocation for child health is Rs. 2279.5 crore. Although fund devolution has been initiated but aggravated health situation of children will pose serious challenges to the spending capacity of states.
Another disease which has a direct and indirect effect on children is AIDS. “The Government of India estimates that about 2.40 million Indians are living with HIV…Children (<15 yrs) account for 3.5% of all infections”.5
3 One Lakh Children in India die of Diarrhea Annually, The Hindu, May13, 2013. 4 Statement 22, Expenditure Budget Volume II, Union Budget 2012-13, 2013-14 and 2014-155 HIV/AIDS in India,The World Bank, July 10, 2012.

Cen
tre
for
Bu
dge
t an
d G
over
nan
ce A
ccou
nta
bil
ity
32
Box 2: First time Reporting of Existing Schemes in Child Budget 2015-16 ( in Rs. crore)Ministry/Department Schemes 2014-15 (RE) 2015-16 (BE)
MoHA/Police Creche facilities for CRPF 0.45 0.5Creche facilities for CISF 0.58 0.49
MoMA Merit cum Means based Scholarship
350 335
LOK SABHA Funds for Children Corner 0.03 0.03Lok Sabha Secretariat Meritorious Award & S’ship for the wards of Group C Employee
0.13 0.12
Source: Child Budget Statement 22, Expenditure Budget Vol. 1, 2015-16
The Indian government is committed to eliminate new HIV infections among children by 2015 through Prevention of Parent to Child Transmission of HIV/AIDS (PPTCT) programme started in 2002. However, the policy of targeted intervention goes against children with AIDS who are last to receive attention. Transgenders, female sex workers, truck drivers, man sex with man, drug users (unsafe injection) are top of the priority. Secondly, the issue is about the lack of resources to deal with children affected by AIDS. The Department of AIDS control under Ministry of Health and Family Welfare issues grant- in- aid to state AIDS control societies which also looks at the provision for ‘Integrated Counseling & Testing facilities including prevention of Parent to Child Transmission’. An amount Rs. 928 crore was allocated in the year 2013-14 (BE) which has been constant in 2014-15 (Interim Budget) and 2014-15 (BE). In 2015-16 (BE) total allocation is Rs. 540 crore.6Hence, there is an urgent need to strengthen existing health systems and raise funds earmarked for child health.
Given the weak health system that children are living in, one cannot assure and achieve their all-round development. Although, the government has focused more on this part through Integrated Child Development Programme, 15.6 percent of total child budget is allocated for their development and hence the most important scheme in this area is ICDS.
Table1: Allocation under Integrated Child Development Scheme (in Rs. Crore)
Scheme 2010-11 2011-12 2012-13 2013-14 2014-15 2015-16
BE RE BE RE BE RE BE BE BE
ICDS 8826 9370 10100 14148 15953 15858 17846 18391 8449Source: Expenditure Budget, Vol. 2. of the Ministry of Women and Child Development and the Child Budget Statement, Expenditure Budget, Vol. 1, Union Budget, various years
In 2015-16 (BE), total allocation under ICDS is Rs. 8448.8 crore7 (Table 1). In 2015-16, the Finance Minister announced for additional ICDS budget of Rs. 1500 crore, if extra funds get generated by tax buoyancy. However, ICDS was allocated another Rs. 3600 crore in supplementary grants presented in September, 2015. Additionally in its universalisation and in its third phase of expansion is facing many challenges such as inadequate availability of space for Anganwadi Centres
http://www.worldbank.org/en/news/feature/2012/07/10/hiv-aids-india. Website accessed on 26 February 2015.6 Low allocation is due to financial devolution of funds based on 14th Finance Commission.7 The current ICDS figure excludes National Nutrition Mission (NNM), where earlier figure have included it. This time government is treating NNM as separate scheme.
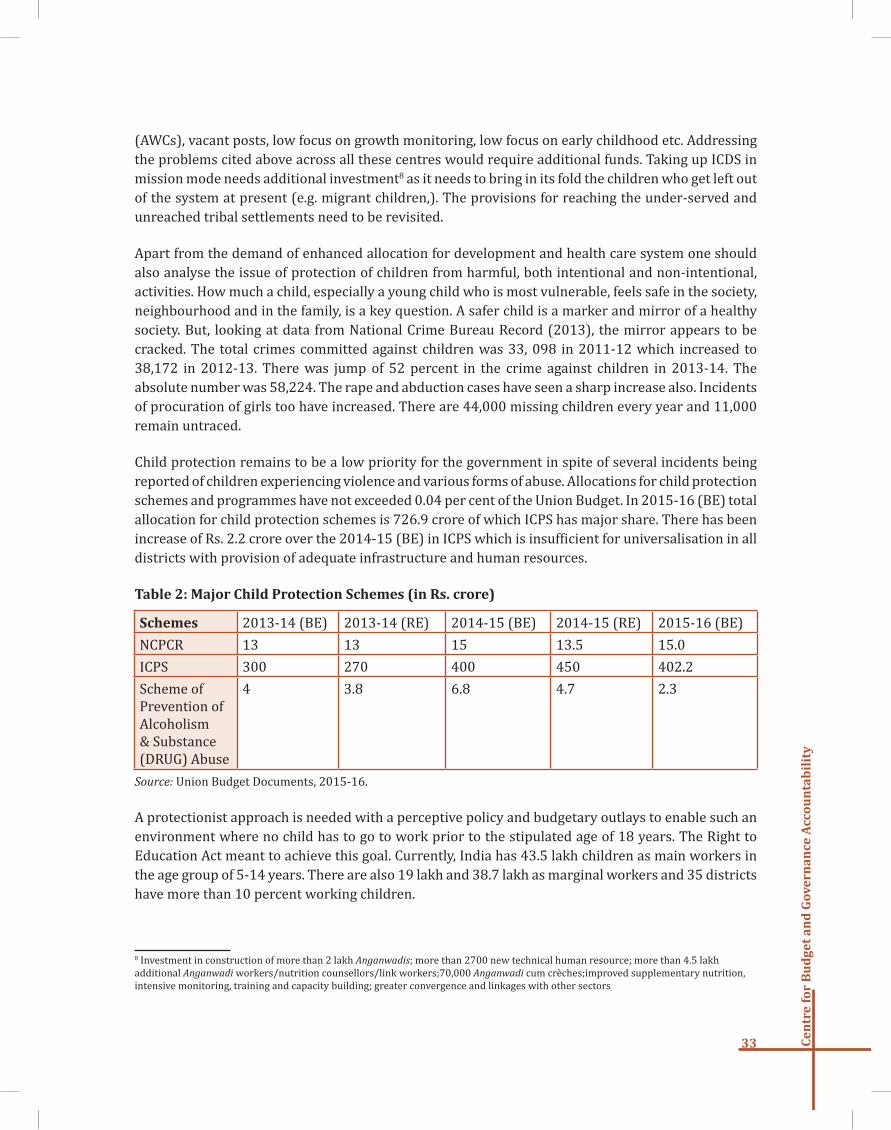
33 Cen
tre
for
Bu
dge
t an
d G
over
nan
ce A
ccou
nta
bil
ity
(AWCs), vacant posts, low focus on growth monitoring, low focus on early childhood etc. Addressing the problems cited above across all these centres would require additional funds. Taking up ICDS in mission mode needs additional investment8 as it needs to bring in its fold the children who get left out of the system at present (e.g. migrant children,). The provisions for reaching the under-served and unreached tribal settlements need to be revisited.
Apart from the demand of enhanced allocation for development and health care system one should also analyse the issue of protection of children from harmful, both intentional and non-intentional, activities. How much a child, especially a young child who is most vulnerable, feels safe in the society, neighbourhood and in the family, is a key question. A safer child is a marker and mirror of a healthy society. But, looking at data from National Crime Bureau Record (2013), the mirror appears to be cracked. The total crimes committed against children was 33, 098 in 2011-12 which increased to 38,172 in 2012-13. There was jump of 52 percent in the crime against children in 2013-14. The absolute number was 58,224. The rape and abduction cases have seen a sharp increase also. Incidents of procuration of girls too have increased. There are 44,000 missing children every year and 11,000 remain untraced.
Child protection remains to be a low priority for the government in spite of several incidents being reported of children experiencing violence and various forms of abuse. Allocations for child protection schemes and programmes have not exceeded 0.04 per cent of the Union Budget. In 2015-16 (BE) total allocation for child protection schemes is 726.9 crore of which ICPS has major share. There has been increase of Rs. 2.2 crore over the 2014-15 (BE) in ICPS which is insufficient for universalisation in all districts with provision of adequate infrastructure and human resources.
Table 2: Major Child Protection Schemes (in Rs. crore)
Schemes 2013-14 (BE) 2013-14 (RE) 2014-15 (BE) 2014-15 (RE) 2015-16 (BE)NCPCR 13 13 15 13.5 15.0ICPS 300 270 400 450 402.2Scheme of Prevention of Alcoholism & Substance (DRUG) Abuse
4 3.8 6.8 4.7 2.3
Source: Union Budget Documents, 2015-16.
A protectionist approach is needed with a perceptive policy and budgetary outlays to enable such an environment where no child has to go to work prior to the stipulated age of 18 years. The Right to Education Act meant to achieve this goal. Currently, India has 43.5 lakh children as main workers in the age group of 5-14 years. There are also 19 lakh and 38.7 lakh as marginal workers and 35 districts have more than 10 percent working children.
8 Investment in construction of more than 2 lakh Anganwadis; more than 2700 new technical human resource; more than 4.5 lakh additional Anganwadi workers/nutrition counsellors/link workers;70,000 Anganwadi cum crèches;improved supplementary nutrition, intensive monitoring, training and capacity building; greater convergence and linkages with other sectors

Table 3: Budget for the Schemes against Child Labour under various Ministries (in Rs. Crore)
Ministry Scheme 2011-12
(BE)
2012-13
(BE)
2013-14
(BE)
2014-15
(BE)
2015-16
(BE)
MoL& E Improvement of Working Conditions of Child/ Women Labour
373.0 150.0 200.0 175.0 250.0
MWCD Scheme for Welfare of Working Children in need of Care and Protection
10.0 10.0 10.0 10.0 10.0
Source: Compiled by the author from various Union Budget documents
In 2014-15 (BE), ‘Improvement of Working Conditions of Child/Women Labour’ shows a decrease of 12.5 percent i.e. Rs. 175 crore from 2013-14. However, in 2015-16 (BE) total allocation for the scheme is Rs. 250 crore (Table 3).
A conclusion that can certainly be drawn from the current frame of child budgeting is that, it segregates a child’s life in various stages and designs some policy for that phase. This has both pros and cons. The positive feature about this approach is that it provides focused intervention in a specific area where efforts are really needed. The flip side to this approach is that it misses the holistic approach towards an overall development of a child. Budget outlays aiming to shape a “Happy Childhood”, where a child survives to become a healthy, rational citizen who can freely participate in the society and positively contribute to national progress would rather have a holistic approach than working in silos.

35 Cen
tre
for
Bu
dge
t an
d G
over
nan
ce A
ccou
nta
bil
ity
The Scheduled Caste Sub Plan (SCSP) and Tribal Sub Plan (TSP) were started in the 1970s with the objective of addressing the multiple developmental deficits confronting the Dalits and Adivasis. The idea was to channelize Plan funds from the budgets of the Central Ministries towards the development of the Dalits and Adivasis, at least in proportion to their share in the total population. The population share for the Dalits was 16.6 percent and for Adivasis was 8.6 percent according to the Government of India Census 2011.
The total resources earmarked for the Dalits and Adivasis have clearly witnessed a decline from the previous years (see chart 1). While the allocations reported in SCSP have declined from Rs. 43,208 crore in 2014-15 BE to Rs. 30,851 crore in 2015-16 BE; allocations reported in TSP have declined from Rs. 26,715 in 2014-15 BE to Rs. 19,980 in 2015-16 BE. The allocations in 2014-15 BE under SCSP and TSP exclude the allocations for MGNREGA.
Chart 1: Allocations Reported in SCSP and TSP
34722
43208
33638 30851
22039 26715
20536 19980
2013-14 AE 2014-15 BE 2014-15 RE 2015-16 BE
Allocations reported in SCSP Allocations reported in TSP
Source: Compiled by CBGA from Union Budget documents, various yearsNote: Allocations in SCSP and TSP in 2014-15 BE excludes the allocations for MGNREGA
What has caused this decline in earmarking under SCSP and TSP in 2015-16?
The decline in the allocations reported under the SCSP and the TSP Statements, from 2014-15 BE to 2015-16 BE, has mainly been on account of the following reasons:
• First reason is because in the Budget Estimates of 2014-15, allocations for MGNREGA were also reported in the SCSP and TSP Statements. The allocation under MGNREGA was around Rs. 7,340 crore in SCSP and Rs. 5,672 crore in TSP in 2014-15 BE. However, as per the Guidelines of the Planning Commission (2006) for the implementation of the SCSP and
PLAN STRATEGIES FOR DALITS AND ADIVASIS7

Cen
tre
for
Bu
dge
t an
d G
over
nan
ce A
ccou
nta
bil
ity
36
TSP, “Wage component, especially under rural employment schemes, should not be included under SCP/TSP”. Hence, reporting of MGNREGA was an anomaly. This has been rectified in the Revised Estimates of 2014-15 and the 2015-16 BE.
• Second reason is that a number of Central sector and Centrally Sponsored Schemes (CSS) are getting transferred to the States from this Union Budget. In many schemes (24 in number), such as the Integrated Child Development Service, National Health Mission, Rural Housing etc., the States have to bear the revenue expenditure, as they are now getting higher devolution of the tax resources. Hence, the contribution of the Union Government for these schemes has declined, and the expectation is that this shortfall would be met by the States. This amounts to a decline of another Rs. 7,998 crore in SCSP, and Rs. 4,521 crore in TSP, from 2014-15 BE to 2015-16 BE, across these 24 schemes.
With regard to the decline in allocations for the schemes with changed sharing pattern, the SCSP and TSP Statements state that “…to keep the Budget for such programmes unchanged, States are to contribute from their enhanced resources. It is estimated that any shortfall in SCSP/TSP on account of FFC award will be made up by the States from their enhanced resources.”However, this is merely an expectation by the Union Government. How far this shortfall would be met by the States from their enhanced resources is not certain, nor can it be ensured by the Union Government. This would largely be determined by two major factors: (i) the net spending capacity of the States, which has not increased much, despite the higher devolution of resources from the Central resource pool; and (ii) the prioritisation by the states towards these sectors. Thus, it is questionable as to whether this shortfall seen in the allocations reported in SCSP and TSP will be met by the States. Given this, the sharp decline in the total allocations reported for SCSP and TSP is a concern.
Changes in Classification of SchemesThe schemes have now been classified as:
(A) Schemes to be implemented un-altered
(B) Schemes to be implemented with a changed sharing pattern (C) Schemes delinked from Union support: States may decide to continue from their own resources (D) Other schemes which are not part of (A), (B) and (C) above.
Most of the schemes pertaining to MSJE and MoTA have been subsumed under the umbrella programmes for the development of the SCs and STs and are classified under category A
• The third reason is due to the delinking of certain CSS from the Centre, which essentially means discontinuation of these schemes by the Union Government. These have been left at the discretion of the State Governments, who might or might not decide to continue with these schemes. Owing to discontinuation of such schemes like the Rajiv Gandhi Panchayat Sashaktikaran Abhiyan (RGPSA), Scheme for setting up of 6000 Model Schools etc. another amount of Rs. 417 crore under SCSP and Rs. 210 crore under TSP has declined in Union Budget 2015-16 BE from 2014-15 BE.
• The fourth reason is owing to the decline in the allocations for the schemes for the benefit of Dalits and Adivasis that are being retained by the Union Government.

37 Cen
tre
for
Bu
dge
t an
d G
over
nan
ce A
ccou
nta
bil
ity
Thus, there remains uncertainty with regard to whether the shortfall in the allocations being reported under the SCSP and TSP would be addressed by the States through their own resources.
Having discussed some of the reasons for the decrease in the allocations in the SCSP and TSP in 2015-16 BE, it is also important to see how these changes would alter the denominator for calculating the shares of SCSP and TSP from the Plan outlays of the Centre.
Computing the Proportion of SCSP and TSP: What has changed?Given the changes in the reporting of the schemes and programmes from this Union Budget, the methodology for computing the shares of the SCSP and TSP have also changed. However the basic idea remains the same - the part of the Union Government’s Plan Outlay over which it has the jurisdiction - should be treated as the denominator for calculating these shares.
The Interim Budget (IB) 2014-15, introduced certain changes in reporting of the schemes. These included: (i) Centrally Sponsored Schemes (CSSs) which were previously a part of the Central Plan, were restructured and reclassified as Central Assistance to State and UT Plans (ii) A flexi fund component was introduced in the plan outlay for these schemes (iii) This flexi fund component was to be at least 10 percent of the Plan budget of each CSS (see box below)
Thus, in Union Budget 2014-15 BE, when we compute the allocations under SCSP or TSP as a proportion of the Budget Support for Central Plan, the amount which should be deducted from the Total Plan Expenditure is only the quantum of untied funds being devolved to the State and UT Plans, and not the entire amount being reported as the Central Assistance to State and UT Plans. The untied transfers in this case were:
(a) Allocations for schemes reported under Central Assistance for State and Union Territory Plans till last Union Budget 2013-14 (in Statement 16, Expenditure Budget, Volume I)(b) 10 percent of allocations for Centrally Sponsored Schemes which have started reporting in Statement 16 from Union Budget 2014-15 [which is the 10% flexi fund component]
The denominator for computing shares of SCSP and TSP in 2014-15 BE was:
Denominator for computing share of SCSP and TSP = Total Plan Expenditure – (a) – (b)
However, from the Union Budget 2015-16 this methodology has changed due to the revised sharing pattern in funding of the schemes.
The amount to be deducted from the Total Plan Expenditure would still be the untied funds being devolved to the States and UTs, as a part of Central Assistance to State and UT Plans. This would give us the amount over which the Union Government should have implemented the SCSP and TSP. Thus in this budget, the amount to be deducted from the Total Plan Expenditure comes to around Rs. 70,895 crore (includes components like Additional Central Assistance, Schemes of North Eastern Council, etc.). Hence, the denominator would be as follows:

Cen
tre
for
Bu
dge
t an
d G
over
nan
ce A
ccou
nta
bil
ity
38
Denominator = Rs. 4,65,277 crore – Rs. 70,895 crore = Rs. 3,94,382 crore
Taking into account the changes in the reporting, as well as the structure and funding of the various schemes and programmes, the allocations as a proportion of the Plan outlays of the Union Government are as follows:
Chart 2: Compiled Allocations in SCSP and TSP
10.3
7.86.4
5.1
0
2
4
6
8
10
12
0
5000
10000
15000
20000
25000
30000
35000
40000
45000
2014‐15 BE 2015‐16 BE
Chart 2: Allocations in SCSP nd TSP
Allocation in SCSP (Rs. Crore)
Allocation in TSP (Rs. Crore)
SCSP as a proportion of Plan Outlay of the Union Government (%)
TSP as a proportion of the Plan Outlay of the Union Government (%)
Source: Compiled by CBGA from Union Budget documents, various years.
Issues with Implementation of the StrategiesIn addition to mapping the major changes in the reporting under SCSP and TSP, and computing their respective shares, it is also important to highlight that the implementation of these strategies continue to be marred by a number of concerns (see box). These need to be addressed to ensure effective implementation of the SCSP and TSP.
Issues with Implementation of SCSP and TSP
- Never reached stipulated norms of 16% and 8% respectively- Notional allocations and unclear assumptions behind reporting by ministries- Who will monitor the implementation of these strategies now that the Planning Commission ceases to exist?
- Implications of the changes in sharing pattern of funding, especially in social across sectors
Summing UpThus, there has been a substantial decline in both the outlays reported in the SCSP and TSP as well as their respective shares in the Plan Expenditure of the Union Government. This is primarily due to the changes in the categorisation of the central schemes according to the revised sharing pattern between the Centre and the States. While it is being assumed, that the observed shortfall in the allocations in SCSP and TSP will be met by the States from the additional resources devolved to them, the issues prevalent in the implementation of these strategies need to be looked into and addressed.
BUDGETS FOR THE NODAL MINISTRIES FOR DALITS AND
ADIVASIS

39 Cen
tre
for
Bu
dge
t an
d G
over
nan
ce A
ccou
nta
bil
ity
•Priority for lending by MUDRA Bank to be given to SCs and STs for their entrepreneurial development. MUDRA Bank set up with corpus of Rs. 20,000 crore, and credit guarantee corpus of Rs. 3,000 crore with an additional Rs. 600 crore given in supplementary grants.
•Van Bandhu Kalyan Yojana to be a major umbrella programme under which all the major schemes would run. Existing Van Bandhu Kalyan Yojana will be merged under the umbrella programme.
At the Union Government level, it is the Ministry of Social Justice and Empowerment (MSJE) and the Ministry of Tribal Affairs (MoTA) have the nodal responsibility for planning and implementation of the schemes and programmes for the development of Dalits and Adivasis respectively. The ministries are implementing a range of interventions to address the development deficits confronting the groups and to promote their holistic development. This article briefly analyses the budgets for these nodal ministries.
However, before looking at the budgets for these ministries, it is important to first see how the schemes and programmes being implemented by these ministries have been reported. Given that there have been changes in the way the schemes are being reported from the Union Budget 2015-16, a scrutiny of how reporting is being done by these ministries is also important.
The Union Budget 2015-16 notes that the schemes which will continue to be supported by the Union Government are essentially those schemes which are either meant for the welfare of the poor and disadvantaged or are legal obligations of the Union. The schemes under both the MSJE and MoTA largely fall under the first category ─ to be fully supported by the Union Government. This is because these ministries deal with the welfare of the disadvantaged sections of the population.
Ministry of Social Justice and Empowerment (MSJE) had proposed Rs. 16,822 crore for 2014-15 BE1; however it was allocated Rs. 6,213 crore in 2014-15 (BE), which is less than half of what was proposed by the ministry. The allocation for the ministry increased around Rs. 300 crore to Rs. 6,525 crore in 2015-16 BE.
Table 1: Allocations under Major Schemes of the MSJE (in Rs. Crore)
Major schemes 2013-14 AE 2014-15 BE 2014-15 RE 2015-16 BE
Ministry of Social Justice and Empowerment 5515 6213 5452 6525Pre Matric Scholarship for SC Students (Class IX & X) 546 834 500 843
1 Departmentally Related Standing Committee Report on the Demands for Grants of the Department of Social Justice and Empowerment for 2014-15, December 2014, Lok Sabha.
BUDGETS FOR THE NODAL MINISTRIES FOR DALITS AND
ADIVASIS8
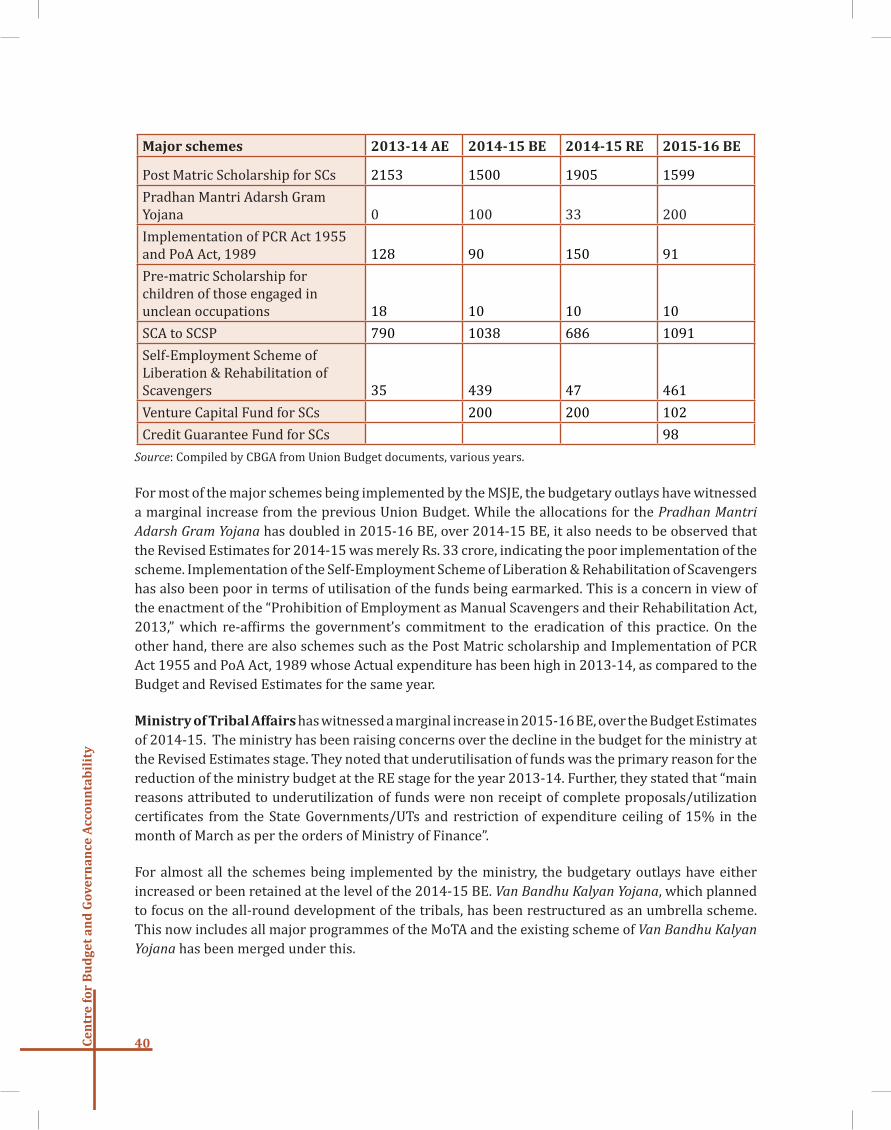
Cen
tre
for
Bu
dge
t an
d G
over
nan
ce A
ccou
nta
bil
ity
40
Major schemes 2013-14 AE 2014-15 BE 2014-15 RE 2015-16 BE
Post Matric Scholarship for SCs 2153 1500 1905 1599Pradhan Mantri Adarsh Gram Yojana 0 100 33 200Implementation of PCR Act 1955 and PoA Act, 1989 128 90 150 91Pre-matric Scholarship for children of those engaged in unclean occupations 18 10 10 10SCA to SCSP 790 1038 686 1091Self-Employment Scheme of Liberation & Rehabilitation of Scavengers 35 439 47 461Venture Capital Fund for SCs 200 200 102Credit Guarantee Fund for SCs 98
Source: Compiled by CBGA from Union Budget documents, various years.
For most of the major schemes being implemented by the MSJE, the budgetary outlays have witnessed a marginal increase from the previous Union Budget. While the allocations for the Pradhan Mantri Adarsh Gram Yojana has doubled in 2015-16 BE, over 2014-15 BE, it also needs to be observed that the Revised Estimates for 2014-15 was merely Rs. 33 crore, indicating the poor implementation of the scheme. Implementation of the Self-Employment Scheme of Liberation & Rehabilitation of Scavengers has also been poor in terms of utilisation of the funds being earmarked. This is a concern in view of the enactment of the “Prohibition of Employment as Manual Scavengers and their Rehabilitation Act, 2013,” which re-affirms the government’s commitment to the eradication of this practice. On the other hand, there are also schemes such as the Post Matric scholarship and Implementation of PCR Act 1955 and PoA Act, 1989 whose Actual expenditure has been high in 2013-14, as compared to the Budget and Revised Estimates for the same year.
Ministry of Tribal Affairs has witnessed a marginal increase in 2015-16 BE, over the Budget Estimates of 2014-15. The ministry has been raising concerns over the decline in the budget for the ministry at the Revised Estimates stage. They noted that underutilisation of funds was the primary reason for the reduction of the ministry budget at the RE stage for the year 2013-14. Further, they stated that “main reasons attributed to underutilization of funds were non receipt of complete proposals/utilization certificates from the State Governments/UTs and restriction of expenditure ceiling of 15% in the month of March as per the orders of Ministry of Finance”.
For almost all the schemes being implemented by the ministry, the budgetary outlays have either increased or been retained at the level of the 2014-15 BE. Van Bandhu Kalyan Yojana, which planned to focus on the all-round development of the tribals, has been restructured as an umbrella scheme. This now includes all major programmes of the MoTA and the existing scheme of Van Bandhu Kalyan Yojana has been merged under this.

41 Cen
tre
for
Bu
dge
t an
d G
over
nan
ce A
ccou
nta
bil
ity
Table: 2 Allocations under Major Schemes of the MoTA (in Rs. Crore)
Major Schemes 2013-14 AE 2014-15 BE 2014-15 RE 2015-16 BE
Ministry of Tribal Affairs 3839 4498 3872 4819Ashram Schools in Tribal Sub-Plan Areas 72 0 0 0Schemes for PMS, Book Bank and Up gradation of Merit of ST students 748 0 0 0Pre-matric scholarship for ST students 219 0 0 0Schemes of Hostels for ST Girls and Boys 101 0 0 0Mechanism for Marketing of Minor Forest Produce (MFP) through Minimum Support Price(MSP) and Development of value Chain for MFP 112 317 100 307Umbrella Schemes for Education of ST Children 0 1058 1066 1155Special Central Assistance to TSP 1050 1200 1040 1250Assistance for schemes under proviso(i) to Article 275(1) of the Constitution 1097 1317 1135 1367Van Bandhu Kalyan Yojana 100 100 200Source: Compiled by CBGA from Union Budget documents, various yearsNote: *The Umbrella Scheme for Education of ST Children is being implemented to fill the critical gap in the education of ST children. It provides a number of options to be picked by the states out of the following components 1. Strengthening and Establishment of Ashram schools and hostels; 2. Establishment of Vocational Education Centres within Ashram Schools; 3. Pre.-Matric Scholarship; 4. Post matric Scholarship
Summing up Budgetary outlays for the key schemes being implemented by the nodal ministries for Dalits and Adivasis have been retained by the Union Government. While the financial performance of some schemes has been encouraging, there are others whose implementation needs to be strengthened further. For holistic development of these groups, both the Union Government and the States have to work in close coordination, supplementing each other’s efforts, to address the key deficits confronting these groups.

Cen
tre
for
Bu
dge
t an
d G
over
nan
ce A
ccou
nta
bil
ity
42
The Indian constitution talks about the idea of equality among its citizens and prohibits discrimination on the grounds of religion. It has also committed for preservation, protection and assurance of the rights of minorities (Article 14, 15, 29&30). Five religious communities, namely Muslims, Christian, Sikhs, Buddhists and Zoroastrians were declared as minority communities under section 2 (c) of the National Commission for Minorities Act, 1992. Despite the many provisions in the Constitution of the equal opportunities and rights to all, it was seen that the minorities, particularly Muslims were left untouched by the working of the Indian democracy. The Muslim community comprises the largest share – more than 70 percent among the total minority population.
Further, the commitment was made by the government to address the problems of inequality, deprivation and exclusion of religious minorities in the 11th plan through the approach of ‘faster and inclusive growth’. To address the overall development deficit of minorities, particularly Muslims, Government of India has adopted a four-pronged strategy in terms of policy initiatives since 2006-07 which includes educational empowerment, economic empowerment and access to public services, strengthening of minority institutions and area development.
The central government has been targeting few flagship programmes/schemes related to education, livelihood and access to public services, credit and skill development for minorities under PM New 15 point programme (15PP) since 2006. Further ,under the aegis of the Ministry of Minority Affairs (MMA), new development schemes and programmes related to scholarship, community leadership and area development were devised, most important being Multi Sectoral Development Programme (MSDP) as area development programme. Most of these government interventions are minority targeted rather than Muslim focused. Under the new arrangement as recommended by the Report of Subgroup of Chief Ministers on Rationalising CSS, MSDP and schemes for providing education to Madrasas/Minorities have been classified as ‘Core of the Core’ schemes.
Budgetary allocation for minorities in the Union Budget 2015-16Looking at the budgetary allocation for minorities, it may be noted that only 0.23 percent of the total Union Budget 2015-16 has been earmarked for development of minorities including MoMA and other line Ministries, although the religious minorities constitute 21 percent of total population as per census 2011. Whereas, the current budget total allocation (in absolute number) under MoMA has increased marginally from Rs. 3,734 crore in 2014-15 (BE) to Rs. 3,738 crore .In terms of the new announcement in the budget 2015-16, an integrated education and livelihood scheme called ‘Nai Manzil’ will be launched this year to enable Minority Youth who do not have a formal school-leaving certificate to obtain one and find better employment. Further, to show-case civilization and culture of the Parsis, the Government will support, in 2015-16, an exhibition, ‘The Everlasting Flame’.
In budget 2014-15, the government introduced a new scheme “Up grading the Skills and Training in of Traditional Arts/ Crafts for Development (USTTAD)” for promoting and preserving the traditional craft, arts for development of minorities through skill up-gradation. In terms of budget, Rs. 0.45 crore
DEVELOPMENT OF MUSLIMS: FROM THE LENS OF BUDGETS9

43 Cen
tre
for
Bu
dge
t an
d G
over
nan
ce A
ccou
nta
bil
ity
was allocated for USTTAD in the 2014-15 RE, whereas Rs. 17 crore has been earmarked in the 2015-16.
The table 1 analyses the performance of MoMA in terms of fund utilisation which has been unsatisfactory in the 11th Plan. The ministry was able to utilize merely 78 percent (average) of the total outlay earmarked in the 11thPlan period. In the first two years of 12th Plan, the percent of utilisation is found to be as low as 60 percent in 2012-13 but it has gone up to 86 percent in 2013-14. The MoMA noted that poor utilisation in 2012-13 has primarily been due to a delayed start in implementation of major schemes such as pre-matric scholarship and MSDP for select MCDs.
Table 1: Status of Fund Allocation and Utilisation under Ministry of Minority Affairs(in Rs. Crore)
Year Allocation Expenditure Utilisation* (in %)B.E R.E
2007-08 500 350 196.7 39.32008-09 1000 650 619.1 61.92009-10 1740 1740 1709.4 98.22010-11 2600 2500 2080.9 77.32011-12 2850 2750 2292.3 80.42012-13 3155 2218 2157.9 60.42013-14 3531 3131 3026 86.02014-15 3734 3165 - -2015-16 3738
Note: *Utilisation has been reported taking into account BE figures.BE: Budget Estimate; RE: Revised EstimateSource: Compiled by CBGA from Ministry of Minority Affairs, Govt. of India
Table 2 shows scheme wise details of expenditure/allocation under MoMA since 2012-13 (first four years of the 12th FYP). The total allocation during the first four years amounts to Rs. 12018.25 crore, which is 69 percent of the total proposed allocation of Rs. 17,323 crore in the 12th FYP. Further, the analysis of the allocation and utilisation of each of the schemes for the same period shows that major schemes such as MSDP, Pre and Post Scholarships, Women Leadership Scheme, Support for Students clearing Prelims conducted by UPSC, SSC have had very low fund allocation and utilisation. Schemes like Merit-cum-means scholarship and Pre and Post-Matric Scholarship have not been able to achieve 70 per cent targets of 12th FYP, which is a major cause of concern.
Multi- Sectoral Development Programme: Scheme to be implemented unaltered under category AMSDP is an area development programme of MoMA for improving the education, health, work participation and access to basic public services in Minority Concentrated Districts (MCDs). MSDP was launched in 90 MCDs in the 11th Plan; among the 90 MCDs, 66 districts were Muslim concentrated. In the 12th FYP, MSDP was extended to 710 development blocks of 196 districts and 66 towns. As per the data reported by MoMA, in the initial 2 year and 9 month of 12th Plan , government was able to release only 34 percent of total proposed allocation in 12th Plan in MSDP and actual expenditure data was not

Cen
tre
for
Bu
dge
t an
d G
over
nan
ce A
ccou
nta
bil
ity
44
made available on MSDP for the same period . water, IAY and income generating infrastructure have poor completion rate against the unit sanctioned under the MSDP project and many activities under the MSDP have not yet started.
Table 2: Scheme-wise Plan Allocation by MoMA in 12th Five Year Plan (in Rs. Crore)
Schemes/Programmes12th Plan Proposed Allocation
2012-13 (Actuals)
2013-14 (Actuals)
2014-15(RE)
2015-16 (BE)
Total Allocation/Exp. as % of Proposed Allocation for 12th FYP
1 2 3 4 5 6 7=3+4+5+6/2*100
Maulana Azad Education Foundation 500 0 160 113 113 77
Free Coaching and Allied Scheme 120 14 23.68 29.17 45 93
Research/Studies, Monitoring and Evaluation 220 31.05 42.42 23.47 44.75 64
Merit-cum-means 1580 181.18 259.9 317 315 68
Pre-Matric Scholarship 5000 786.14 962.99 1017 990 55Post Matric 2850 326.43 515.67 538.50 550 68MSDP 5650 641.26 953.48 769.72 1232 74Maulana Azad National Fellowship 430 66 50.02 0.9 44.85 38
Grants-in-aid to State NMDFC 10 0 2 1.8 1.8 56
Support for Students clearing Prelims Examination
75 0 1.95 2.1 3.6 10
Leadership Development of Minority Women 75 10.45 11.95 12.5 14.13 65
Computerisation of records of State Waqf Boards
17 0.89 2.98 3.15 3.15 60
Strengthening of the State Waqf Boards 25 0 1.91 3.6 6.08 46
Interest subsidy on Educational Loans for overseas studies
10 0 0 3.5 4.19 77
Skill Development 60 0 16.99 41.4 64.22 204NMDFC 600 99.64 0 27 107 39Total Plan Allocation under Minority Affairs Ministry 17323 2157.98 3007.49 3140 3712.78 69
Source: Compiled by CBGA from Ministry of Minority Affairs, Expenditure Budget Vol. II

45 Cen
tre
for
Bu
dge
t an
d G
over
nan
ce A
ccou
nta
bil
ity
For the same period, there has been a very low achievement in physical outcomes across the components of MSDP. The components like education, skill building, health, Anganwadi Centre (AWC), drinking
Implementation Issues in PM’s New 15-Point ProgrammePrime Minister’s new 15-Point Programme for the welfare of minorities focuses on enhancing opportunities for education, equitable share in economic activities and employment, improving the conditions of living of minorities and prevention and control of communal riots. The target for development of minorities under 15 PP has to be achieved with a definite goal in a specific timeframe. The 15PP envisaged earmarking 15% of total allocations and achieving the physical targets under select flagship programmes for development of minorities. Except MSDP, all the schemes run by MoMA are also part of 15PP which are 100 percent meant for the development of minorities. There were two important commitments made under 15 PP; one by the ‘department of personnel and training’ with a promise to ensure 15% share in public employment; and ‘department of financial services’ with targets to disburse 15% of the annual ‘priority sector lending’ (PSL) to favour minorities.
Currently, eleven Union ministries/departments claimed to be involved in implementing the 15PP, including Ministries of Rural Development, Urban Development, Housing and Urban Poverty Alleviation, Labour and Employment, Minority Affairs, Home, Finance, Women and Child Development, School Education and Literacy, Personal and Training. Selected schemes are Indira Awas Yojana (IAY), Ajivika, National Rural Drinking Water Programme (NRDWP), Urban Infrastructure and Governance (UIG), Urban Infrastructure Development Scheme for Small and Medium Towns (UIDSSMT), Integrated Housing Slum Development Programme (IHSDP), Basic Services for Urban Poor (BSUP), Swarna Jayanti Gram Swarozgar Yojana (SJSRY), Priority Sector Lending to Minorities, Integrated Child Development Services (ICDS), Industrial Training Institutes(ITIs), Sarva Shiksha Abhiyan (SSA), Kasturba Gandhi Balika Vidyalay (KGBV), , and Madrassa Modernisation Programme.
The Union Ministry of Minority Affairs collates scheme wise information on the 15 PP. There are only few schemes which report the financial achievement.The utilization rate for the period 2006-07 and2013-14 is found to be low in IAY (70.53 percent), SJRSY (53.08) and ITI (68.20 percent) with some degree of variation whereas the disbursement in Priority Sector Lending (102 Percent) shows over achievement (Table 3).
Table 3: Financial Achievement under 15 PP (2006-07 to 2013-14)
Schemes Financial Target Financial Achievement % of Financial Achievement
IAY 12522.66 8832 70.53SJRSY 355.62 188.76 53.08ITI 219.95 150 68.20Priority Sector Lending 235016 240383 102.28
Source: Ministry of Minority Affairs, GoI
The scheme wise information on the 15 PP like SSA, KGBV, ICDS, and SGSY (renamed as Ajeevika), only the data on physical achievements is reported without the information on their financial performance. The component related to JNNURM (UIG, UIDSSMT, IHSDP and BUSP) and Madrassa Modernisation

Cen
tre
for
Bu
dge
t an
d G
over
nan
ce A
ccou
nta
bil
ity
46
Programme did not report the data on fund utilisation and physical outcomes. The table 4 shows that important schemes like ICDS (59 percent), SGSY (61 percent) and IAY (82 percent) have low physical achievements whereas SJRSY has higher physical achievement. The physical achievement in SSA is found to be low with some degree of variation across the components (Table 4).
Table 4: Physical Achievement under 15 PP (2006-07 to 2013-14)
Schemes Physical Target Physical Achievement
% of Achievement
Operationalization of ICDS centre 118775 70371 59.25Formation of Self Help Groups in SGSY/Aajeevika 1889556 1157381 61.25IAY 3135049 2572132 82.04Micro Enterprises in SJRSY 97596 115483 118.33Skill Training under SJRSY 363848 365034 100.33Primary Schools (SSA) 21726 15939 73.36Upper Primary School(SSA) 10326 8151 78.94Additional Classrooms 281671 230639 81.88Number of Teachers 186229 125386 67.33KGBV 1192 555 46.56
Source: Ministry of Minority Affairs, GoI
The concerned ministries under 15 PP should be urged to report their achievements, both physical and financial, under their respective schemes for the benefit of minorities. The same needs to be reported on a regular basis to the Ministry of Minority Affairs or introducing a budget statement, to maintain this information. The reporting of expenditure under 15 PP by the Union ministries has been more in the nature of ‘retrospective budgeting’, where the allocations for minorities are earmarked after the budgets for the schemes have been finalised without any special measure taken for minorities during the budget preparation phase. The schemes and programmes in 15 PP should prepare exclusive action plans for minorities considering the specific needs and challenges particularly faced by Muslims.

47 Cen
tre
for
Bu
dge
t an
d G
over
nan
ce A
ccou
nta
bil
ity
Status Unknown – Promises 2014-15
No specific allocation or information is available on the following promises made by the Union Government in the financial year 2014-15:
a. National Institute for Inclusive Universal Design
b. National Centre for Disability Sportsc. 15 New Braille Press and modernization of
existing onesd. Currency Notes in Braille
Promises 2015-16
a. Access for persons with disabilities in select heritage sites in Goa, Maharashtra, Karnataka, Rajasthan, Gujarat, Varanasi, Jammu & Kashmir, Punjab and Hyderabad / Telangana.
b. Increase in tax exemption to the tune of Rs.25,000 under sections 80DD and 80U of the Income Tax Act for families having persons with disabilities and persons with disabilities respectively.
c. Assistive devices for Senior Citizens living below poverty line.
1. 64% of the total working age population (82% of population of persons with disabilities are not students and is considered as working age) are non-workers and marginal workers and thus do not benefit from the promise of increased tax exemption or any Government programme.
2. Schemes related to disability have been mainly classified under categories A and B under the new arrangement. The umbrella programme, National Programme for PWD, features as ‘Core of the Core’ scheme.
3. There has been a marginal increase of Rs.4 crore in the estimated overall budget of the Department of Disability Affairs. This increase is on the scheme for assistive devices.
4. No allocation to the National Mental Health Programme, which is the only programme that has components for community mental health,
5. The allocations for programmes related to persons with disabilities across Ministries have remained at the same level as last years budget..
6. The allocation to the programme “Sports for the Disabled” by the Ministry of Youth Affairs and Sports has been reduced.
Increase in tax exemption to families and persons with disabilities under section 80DD and section 80 U of the Income Tax Act is a welcome move on the part of the Union Government. But, it is important to get into details to understand “Who benefits out of this, and whether it really contributes towards participation of persons with disabilities in the growth and development agenda of the nation”.
HOW DISABLED FRIENDLY IS THIS BUDGET?1
1 Prepared by Equals, Centre for Promotion of Social Justice
10

Cen
tre
for
Bu
dge
t an
d G
over
nan
ce A
ccou
nta
bil
ity
48
It is to be noted that in order to avail this exemption, one should be earning more than Rs.2.5 lakhs per year. In the absence of statistics on number of persons with disabilities earning more than Rs.2.5 lakhs in a year, the Census 2011 figures are used to understand the status of persons with disabilities.
As per Census 2011, the total non-worker population is 46% of the total population of persons with disabilities.
The worker population is categorized into main workers and marginal workers. Main workers are those who work for more than 6 months in a year and this group amounts to 25% of the total population, ones likely to benefit from the tax exemption. Further analysis revealed that 92% of the non-worker population does not receive any pension or other benefits from the Government. It is needless to mention that the 9% marginal workers are not eligible for the pension of Rs.300 per month from the Government. Therefore, more than half of the working population does not benefit from any of the promises of the Union Government. It is observed that even among the population of workers with disabilities, 58% work as cultivation labourers, agriculture labourers and in house hold industries, who are unlikely to earn more Rs.2.5 lakhs per year, the remaining 42% carry out other jobs, which amounts to 18% of the total working age population. Thus it is safe to conclude that a miniscule percentage of persons with disabilities are benefited every year out of this exemption. The tax revenue foregone estimated to Rs.157.4 crore during the financial year 2014-15 has benefited only few out of this 18%.
It is important to highlight here that those who receive pension from the Union Government, , are bound by the clause in the guideline, that they “cannot gainfully engage in any forms of employment”. The Government does not compensate those who are “gainfully employed”, failing to address the additional disability cost which is required for a decent standard of living.
Trends in Union Budget Allocations for Persons with DisabilitiesAllocation to the Department of Disability Affairs finds a marginal increase of fourcrore . This increase of four crore is for ADIP scheme, which is a grants-in aid programme for supply of assistive devices. This could be utilized for the supply of assistive devices to senior citizens. There is lack of clarity on how the increased allocation will fulfill the commitment made in the Scheme for Implementation of Persons with Disabilities Act (SIPDA)to provide access in Heritage sites and in public buildings, universities etc,. The following table gives the details of allocation to the Department.
Table 1: Allocation to Schemes of the Department of Disability Affairs (Rs. crore)
Schemes 2012-13 (Actual)
2013-14 (RE)
2014-15 (BE)
2014-15 (RE)
2015-16 (BE)
DDRS 46.99 80.50 80.00 45.45 54National Institutes 104.69 136 147.16 55.27 118ADIP 70.60 96 98 90 112.95PWD Act Implementation 20.03 58.50 71.00 32.54 98.20Scheme for the employment of the physically challenged
0.50 1.00 1.80 0.45 0.45

49 Cen
tre
for
Bu
dge
t an
d G
over
nan
ce A
ccou
nta
bil
ity
Other programmes for the welfare of the physically handicapped
7.71 60.70 70.10 20.71 44.79
Post Matric Scholarship for students with disabilities
0.00 .05 10.70 1.80 10.80
NHFDC 20 31 33 33.30 31.50ALIMCO 20.0 0.01 21.0RCI 6.25 4.35 4.90Rajiv Gandhi Fellowship 15.30 9.00 7.20National Programme for persons with disabilities
5.00 0.02 5.00
Social security and welfare
142.69 105.19 145.18
Total 270.52 463.75 632.89 441.06 636.94
Source: Union Budget and Economic Survey, Government of India
The social protection programmes of the Ministry of Rural Development include persons with disabilities as one of their target groups. The data on allocation and expenditure under these programmes are not available
Ministry of Human Resource Development (MHRD), Ministry of Health and Family Welfare (MoHFW) and Ministry of Youth Affairs and Sports (MYAS) also have allocations for persons with disabilities. It is observed that all allocations have been maintained except in the Ministry of Youth Affairs and Sports, where there is a decrease in allocation.
Chart 1: Allocations for PWD in MYAS, MoHFW and MHRD
02468
MYAS
Source: http://indiabudget.nic.in/index.asp

Cen
tre
for
Bu
dge
t an
d G
over
nan
ce A
ccou
nta
bil
ity
50
0200400600800
MoHFW
Source: http://indiabudget.nic.in/index.asp
0200400600800
1000
2007 –08(RE)
2008 – 09 (RE)
2009 – 10 (Actual)
2010 – 11 (Actual)
2011 – 12 (Actual)
2012 – 13 (RE)
2013‐14 (RE) 2014‐15 * actuals till 28.02.15
MHRD
Source: http://indiabudget.nic.in/index.asp
The National Mental Health programme, one of the key programmes for persons with psychosocial disability finds no allocation in the financial year 2015-16. This is the only community initiative for persons with psychosocial disabilities.

51 Cen
tre
for
Bu
dge
t an
d G
over
nan
ce A
ccou
nta
bil
ity
Box 1: Major Schemes under Ministry of Housing & Urban Poverty Alleviation (MoHUPA) and Ministry of Urban Development (MoUD)
New Schemes to be shared between Union and States Older Schemes under classifications A and B1. AMRUT including Urban Rejuvenation Mission-500 habitations and Mission for Development of 100 smart cities2. Sardar Patel Urban Housing Scheme3. National Livelihood Mission (urban)
1. Rajiv Awas Yojana2. JNNURM 3. Rajiv Rin Yojana4. National Heritage Cities Programme
Source: Statement 16, Expenditure Budget Vol. I, 2015-16 and REPORT OF THE SUBGROUP OF CHIEF MINISTERS ON RATIONALISATION OF THE CSS
Box 2: Urban Development: Budget 2015-16
• Urban rejuvenation features in the priority list of the government. • The JNNURM has been subsumed under Atal Mission for Rejuvenation and Urban
Transformation (AMRUT) which has components of smart cities and drinking water and sanitation for urban areas with other programmes in erstwhile JNNURM.
• Sardar Patel Urban Housing Scheme replaces Rajiv Awaas Yojana with an allocation of Rs. 4150 crore
• Mission for 100 Smart Cities (Rs. 2020 crore) and 500 habitations (Rs. 3919 crore) will cater to the need of urban infrastructure
Source: Expenditure Budget Vol. I, 2015-16 and REPORT OF THE SUBGROUP OF CHIEF MINISTERS ON RATIONALISATION OF THE CSS
The 21st century is called the urban century because for the first time since the dawn of civilisation, more people are residing in urban areas than in rural areas. It is estimated that by 2050, about 70 percent of the global population will be living in cities and India is no exception to this phenomenon. According to Census 2011 estimates, 31.2 percent of the Indian population lives in urban areas. Projections show that by 2030, around 575 million people, i.e. double the current urban population, will live in urban areas in India and Mumbai and Delhi will be amongst the five largest cities in the world.
However, the urban areas in our country have failed to meet the demands of this increasing population pressure resulting in large gaps in provisioning of basic amenities of housing, drinking water, sanitation, transportation etc. Deprivation of such services has resulted in burgeoning of slums with conditions unfit for human habitation. At present, 17.7 percent of the urban population comprising 65 million people lives in slums in India.
ARE OUR CITIES ‘SMART’ FOR INCLUSIVE DEVELOPMENT?11

Cen
tre
for
Bu
dge
t an
d G
over
nan
ce A
ccou
nta
bil
ity
52
Budget 2015-16The key ministries addressing some specific needs of the urban poor are Ministry of Housing & Urban Poverty Alleviation and Ministry of Urban Development. The overall budget allocation for both the ministries has decreased slightly when compared to 2014-15 BE. However, this needs to be seen in the light that most of the schemes under these ministries will undergo a change in their funding pattern between the states and the center after the increase in devolution of resources from Centre to the States.
Table 1: Union Budget Allocations/Expenditure for MoHUPA and MoUD (in Rs. Crore)
2012-13 2013-14 2014-15 BE 2014-15 RE 2015-16 BE
Addl. Allocation In Union Supplemen-tary demand for grants 2015-16
MoHUPA 933.2 1084.0 6008.6 3413.4 5634.5 821
MoUD 8465.0 7296.7 17628.6 11013.0 16832.2 2000Note: From 2014-15 JNNURM (BSUP and IHSDP) was transferred to MoHUPA and JNNURM (UIG, UIDSSMT) was transferred to MoUD which was earlier with Ministry of Finance.
The most significant policy intervention in urban development was the introduction of Jawaharlal Nehru National Urban Renewal Mission (JNNURM) and, more recently, Rajiv Awas Yojana. However, after looking at the budgetary allocation it appears that both these schemes will be eventually replaced by the new Mission for 100 Smart Cities and Urban Rejuvenation Mission-500 Habitations, which are expected to continue developing urban infrastructure, and Sardar Patel Urban Housing Scheme to achieve the target of Housing for all by 2022.
Table 2: Expenditure under JNNURM (in Rs. crore)
2009-10 2010-11 2011-12 2012-13 2013-14UIDSSMT+UIG 4052 2704 5248 3420 5303BSUP+ IHSDP+RAY 2092 2629 2111 1937 2256JNNURM TOTAL 6144 5332 7359 5357 7559
Source: Compiled by CBGA from various Union Budget documents
One of the most ambitious schemes of the new government is development of ‘Smart Cities’. The concept note by Ministry of Urban Development defines smart cites as;
“…cities which have smart (intelligent) physical, social, institutional and economic infrastructure while ensuring centrality of citizens in a sustainable environment. It is expected that such a Smart City will generate options for all residents to pursue their livelihoods and interests meaningfully and with joy”.

53 Cen
tre
for
Bu
dge
t an
d G
over
nan
ce A
ccou
nta
bil
ity
The 100 cities to be developed as Smart Cities will be chosen amongst the following categories: • One satellite city of each of the cities with a population of 4 million people or more (9 cities) • Most of the cities in the population range of 1 – 4 million people (about 35 out of 44 cities) • All State/UT Capitals, even if they have a population of less than one million (17 cities) • Cities of tourist, religious and economic importance not included in above (10 cities) • Cities in the 0.2 to 1.0 million population range (25 cities)
It has been proposed that the selected cities will include special investment regions or special economic zones with modified regulations and tax structures to make them attractive for domestic as well as foreign investment.
According to the estimate of the High Power Expert Committee (HPEC) on Investment Estimates in urban infrastructure Rs. 7.0 lakh crore would be needed for 100 smart cities in next 20 years using an average figure of one million people in each of these cities. This turns out to be an annual requirement of Rs. 35,000 crores. The government is expecting this amount to come in the form of private investment or through PPP mode. This is evident from a meagre allocation of Rs. 2020 crore for this mission in the current budget. It would be a challenge to fill this vast gap through the private sector investment which is driven by profit motive.
As mentioned above, Indian cities are also home to 65 million slum dwellers and if corrective measures, both curative and preventive, are not taken, cities will become unsustainable. The wide inequality in urban areas is not only a concern for human development but will also hamper the economic growth in the long run. So far, the Smart Cities project appears to be catering to the needs of the neo-middle class and conceptualising on the lines of SEZs. The needs of the marginalised in such cities have not been addressed. If we go by the existing practices whereby slum dwellers, in the name of rehabilitation, are pushed to the peripheral areas of cities, then with the development of satellite towns adjoining such cities the urban poor would be pushed further away.
Countries like Germany, Japan, Singapore and the United States have come forward to assist India in its initiative of Smart Cities but it is likely that this project is being looked as an investment opportunity more than anything else. There is already a concern that such cities will be exclusionary, neglecting the needs of the urban poor and this has been strengthened by the keen interest being shown by large number of foreign players and private developers. Such investments are welcome but the government should ensure that the interest of the poor and marginalised in the urban areas is also protected.
To address the vulnerability of the urban poor, the government has continued with National Livelihood Mission (urban). The mission aims at enhancing the skills of the urban poor to enable access to gainful self-employment and skilled wage employment. It would also address the livelihood concerns of the urban street vendors by facilitating access to suitable spaces, institutional credit and social security.
The government had announced a similar scheme called Deen Dayal Upadhyaya Antyodaya Yojana on 25th September 2014 for uplift both the rural and urban poor. However, there was no mention of this scheme in the current budget.

Cen
tre
for
Bu
dge
t an
d G
over
nan
ce A
ccou
nta
bil
ity
54
Table 3: Budgetary Allocations/Expenditure under National Livelihood Mission (Urban)/SJSRY (in Rs. crore)
2011-12 2012-13 2013-14 2014-15 BE 2014-15 RE 2015-16 BE
820.4 793.6 725.1 1003 733.0 510Source: Union Budget, Expenditure Budget Vol. II, MoHUPA, various years
Overall, there seems to be heavy dependence on private investment to fulfill the plans of the government for urban development. The scope and aim of new schemes introduced by the government will become clear only after detailed guidelines for such schemes are formulated and available in public domain. With the changing pattern of financing of various schemes, the role of states will also become critical in this effort and the final outcome will depend on both the spending capacity as well as the priorities of the state governments.

55 Cen
tre
for
Bu
dge
t an
d G
over
nan
ce A
ccou
nta
bil
ity
• All programmes in health have been subsumed under the National health Mission that includes NRHM, human resources in health and Medical Education, National mission on AYUSH and medicinal plants and National AIDS and STD control programme.
• All India Institutes of Medical Sciences in J&K, Punjab, Tamil Nadu, Himachal Pradesh and Assam
• National Institutes of Pharmaceutical Education and Research in Maharashtra, Rajasthan, and Chhattisgarh
• Increase in the limit of deduction u/s 80D of the Income-tax Act from Rs. 15,000 to Rs. 25,000 on health insurance premium (in case of senior citizen from Rs. 20,000 to Rs. 30,000). Deduction of expenditure of similar amount in case of a very senior citizen not eligible to take health insurance
• Increase in the limit of deduction in case of very senior citizens u/s 80DDB of the Income-tax Act on expenditure on account of specified diseases from Rs. 60,000 to Rs. 80,000
• Some changes are also being made to excise levy on cigarettes and the compounded levy scheme applicable to pan masala, gutkha and certain other tobacco products.
Well Being of the Health Sector Health is one of the most critical sectors for any economy. It is especially so for a country like India with a large proportion of population belonging to the poorer strata and comprising largely the marginalised sections, viz., dalits, adivasis, women. The criticality of India’s health sector has been well documented and widely acknowledged. There have been serious talks about provisioning for universalised healthcare services. However, it seems that walking the talk has been a difficult task.
Union Budget 2015-16 Speech: “Good health is a necessity for both quality of life, and a person’s productivity and ability to support his or her family. Providing medical services in each village and city is absolutely essential.” The Election Manifesto of BJP: “India needs a holistic care system that is universally accessible, affordable and effective and drastically reduces the out of pocket spending on health.”
Some facts regarding the health sector in India
The Out of Pocket (OOP) spending on health is nearly 70
percent
More than 60 percent of OOP spending for healthcare is on
medicines
In 2013-14, the expenditure on health by Centre and States
combined was only about 1.3 percent of GDP
Overwhelming presence of private sector in the provision of healthcare services (nearly 70 percent, according to some
estimates)
Some Facts
PROVISIONING FOR HEALTH BUDGETS12

Cen
tre
for
Bu
dge
t an
d G
over
nan
ce A
ccou
nta
bil
ity
56
The Union Budget 2015-16, thus, needs to be analysed taking into account these facts, the policy discourse and the needs of the common people, especially the poor. As per the recommendations of the Fourteenth Finance Commission (FFC), the share of funds to be devolved to the States has increased from 32% to 42%. This has also caused expenditure cuts from Plan assistance provided to states and cuts in funds allocated for the CSS. The CSS has undergone changed arrangements in sharing patterns and schemes have been classified accordingly. The table for such classification has been discussed in chapters 1 and 2.
In the health sector, the expenditure heads like Medical Institutions and Medical Education Training & Research fall under the first category. The allocations under these have marginally increased.
However, some of the most important schemes like the National Health Mission (NHM), along with the National AIDS and STD Control Programme and the Promotion of AYUSH fall under the classification A and B. This effectively implies that, over a period of time, large proportion of recurring expenditures under these schemes, including salaries, would be borne by the States.
The existing situation in the health sector is that that there are human resources shortages across States. Under NHM delays have been reported in the payment of salaries to health personnel by three to six months. Also, there is an increasing tendency to recruit the staff on a contractual basis, with low salaries and lack of job and social security. Even then, the States would, thus, have to take the responsibility of recruiting newer regular cadre staff and other necessary human resource requirements as per newer recommendations put forward by the NITI Aayog Report of the Subgroup of Chief Ministers on rationalising CSS.
Under such an arrangement, there are two concerns that emerge:
A. To what extent would the States prioritise their resources for the health sector? B. Would there be an additional spending capacity with the States to deal with increased
expenditure commitments?
In the Union Budget 2015-16, the total allocations for the Ministry of Health and Family Welfare have decreased by about Rs. 6000 crore. This cut, however, would have to be seen under the changing sharing pattern of revenues and expenditure between Centre and States and the increased share of fund devolution to States by the FFC.
Table 1: Allocations Across Different Departments/Ministries (Rs. crore)
Ministry/Department 2013-14 (Actual) 2014-15 (BE) 2014-15 (RE) 2015-16 (BE)
Department of Health & Family Welfare 27145.3 35163 29042 29653Department of Health Research 874.1 1017.7 932 1018.2Department of AIDS control 1473.1 1785 1300 1397Total Ministry of Health & Family Welfare 29492.5 37965.7 31274 32068.2Ministry of AYUSH 642.4 1272.1 691 1214Jan Aushadhi Programme 15.2 30 9.7 35Department of Pharmaceuticals 107.6 247.9 137 259
Note: The figures include the North East Region (NER) componentSource: Compiled by CBGA

57 Cen
tre
for
Bu
dge
t an
d G
over
nan
ce A
ccou
nta
bil
ity
The National Health Mission (NHM) is one of the most important schemes in the health sector, which, according to the new categorisation, will fall under the classification of both core and optional under category B. The allocation for this in the Union Budget 2015-16 shows a decrease of about Rs. 3900 crore (Table 2). However, it needs to be assessed if this would translate into an effective decrease or this decrease would be compensated by the increasing fiscal space available to the States Governments under the new arrangement. For the ailing healthcare sector in India, which requires substantial investments, the task for the States may prove to be a challenging one without adequate support from the Union.
Table 2: Allocations under NHM (Rs. crore)
Schemes 2013-14 (Actual)
2014-15 (BE)
2014-15 (RE)
2015-16 (BE)
National Health Mission (NHM) 18633.8 22731.0 18609.3 18875.3Note: The figures include the North East Region (NER) componentSource: Compiled by CBGA
Allocations across some of the other schemes in the health sector are given as under (Table 3). The Pradhan Mantri Swasthya Suraksha Yojana (PMSSY) is fully supported by the Union Government and the allocation has marginally increased in 2015-16 over the 2014-15 (BE) allocation. These have been transferred to Central sector schemes.
Table 3: Allocations across select Schemes in Healthcare (Rs. crore)
Schemes 2013-14 (Actual)
2014-15 (BE)
2014-15 (RE)
2015-16 (BE)
Pradhan Mantri Swasthya Suraksha Yojana (PMSSY)**
1273.2 1906.0 891.0 2156.0
Rashtriya Swasthya Bima Yojana (RSBY) 887.5 1434.3 559.7 1420.5*Note: The figures include the North East Region (NER) component*the figure includes an allocation of Rs.100 crore for the RSBY under the Ministry of Health & Family Welfare. Erstwhile RSBY is now divided into two distinct components - Social Security for the unorganised workers and provision for health services. The card would be provided by Ministry of Labour and Employment and the health services would be provided by Ministry of Health & Family Welfare. **PMSSY is the scheme for “establishment of AIIMS type super-speciality hospitals-cum-teaching institutions and upgrading of State Government hospitals” Source: Compiled by CBGA
The announcement for establishing All India Institute of Medical Sciences (AIIMS) in five States, which comes under the PMSSY, is a welcome step. However, with shortages in human resources (doctors, surgeons, ANMs) existing at various levels, there is a greater need to invest in and prioritise the availability of quality doctors and other health personnel in the existing facilities.
National Health Mission – National Rural Health Mission (NRHM) and National Urban Health Mission (NUHM)The NHM, beginning 2013-14, subsumes the NRHM and the NUHM. However, there have hardly been any allocations reported under the NUHM. The NHM essentially comprises only the NRHM sub-mission. Of the total expenditure under the MoHFW, the NRHM constitutes more than 50 percent.

Cen
tre
for
Bu
dge
t an
d G
over
nan
ce A
ccou
nta
bil
ity
58
Within NRHM, the proportion of the five schemes, viz., RCH Flexipool (Including Routine Immunization), NRHM Flexipool, Infrastructure Maintenance, IPPI (Pulse Polio) and National Disease Control Programme (NDCP), has undergone some change over the years. While the share of NDCP, IPPI and Infrastructure maintenance has seen a declining trend, the share of NRHM Flexipool and RCH Flexipool has relatively increased.
Chart 1: Share of different Components of NRHM as percent of Total Expenditure under NRHM
0.010.020.030.040.050.060.070.080.090.0
100.0
2006
-07
2007
-08
2008
-09
2009
-10
2010
-11
2011
-12
2012
-13
2013
-14
RCH Flexipool(including Routine Immunization)
NRHM Flexipool
Infrastructure Maintenance IPPI (Pulse Polio)
National Disease Control Programme(NDCP)
Source: Compiled by CBGA
Status of Human Resources and Infrastructure in Rural AreasThe changing pattern of allocation and expenditure between Centre and States also needs to be studied in the context of the infrastructure and human resources shortfalls that have plagued the health sector in India. Although the availability of female health workers/ANMs has improved, with only 3 percent shortfall being recorded in 2014, in other categories there are large shortfalls being recorded. For instance, the availability of surgeons at Community Health Centres (CHCs), Obstetricians & Gynaecologists at CHCs and Pharmacists and Laboratory Technicians at Primary Health Centre (PHCs) and CHCs record huge shortfalls.
Table 4: Status of Shortfall in Human Resource Requirements in Healthcare
Health Personnel Shortfall (in %)
Health Worker [Female]/ANM at Sub Centres & PHCs 3Doctors at Primary Health Centres 12Surgeons at CHCs 83

59 Cen
tre
for
Bu
dge
t an
d G
over
nan
ce A
ccou
nta
bil
ity
Obstetricians & Gynaecologists at CHCs 77Pharmacists at PHCs & CHCs 28Nursing Staff at PHCs & CHCs 21Laboratory Technicians at PHCs & CHCs 46
Source: Compiled by CBGA
The infrastructure in rural India continues to record shortfalls.
Table 5: Status of Shortfall in Infrastructure Requirements in Healthcare
Infrastructure Required In Position Shortfall Shortfall (%)
Sub Centres (SCs) 179240 152326 36346 20PHCs 29337 25020 6700 23CHCs 7322 5363 2350 32
Source: Compiled by CBGA
Availability of Generic Medicines – A Bitter Pill?India is the fourth largest producer of drugs in the world and world class supplier of relatively cheap generic medicines, being known as the pharmacy of the world. The bulk of the pharmaceutical sector in India is private in nature. Despite this, about 65 percent of Indians are without access to essential medicines1.
According to one of the estimates by the World Health Organisation (WHO), the Out of Pocket (OOP) expenditure constituted around 2 percent of India’s GDP and 58 percent of the total health expenditure in 2012. More than 60 percent of OOP spending for healthcare is on medicines2. To address this, the Jan Aushadhi programme under the Department of Pharmaceuticals was launched in November, 2008 envisaging opening of dedicated outlets where high quality generic medicines would be sold at low prices. The proposed outlay under the 12th Plan period for this scheme is Rs. 200 crores. However, the annual allocations for the Jan Aushadhi programme have been very low. Despite a lot of talk about increasing the availability of free generic medicines, the Union Budget 2015-16 has allocated only Rs. 35 crore for the scheme.
Table 6: Allocations under the Department of Pharmaceuticals and the Jan Aushadhi Programme (in Rs. crore)
Ministry/Department 2013-14 (Actual)
2014-15 (BE)
2014-15 (RE)
2015-16 (BE)
Jan Aushadhi Programme 15.2 30.0 9.7 35.0Department of Pharmaceuticals 107.6 247.9 137.0 259.0
Source: Compiled by CBGA
1 World Medicines Situation Report (2011)2 Prayas (2011): “Free Access to Essential Medicines in Rajasthan”

Cen
tre
for
Bu
dge
t an
d G
over
nan
ce A
ccou
nta
bil
ity
60
Health – A Fundamental Right?The Draft National Health Policy (2015), put in the public domain recently, proposes healthcare as a fundamental right, the denial of which would be punishable by law. This Draft comes after a 13-year gap from the last comprehensive National Health Policy in 2002, and is a welcome step insofar as it attempts a stocktaking of the healthcare sector in India. The Draft acknowledges that “a full achievement of the MDGs” will require an increase in public health expenditure to around 4-5 percent of GDP, but proposes increasing it to only 2.5 percent of the GDP.
The draft NHP, as also the Union Budget, has no specific guidelines to tackle the perpetual problems of lack of accountability of institutions, regulation of the private health sector, inadequate infrastructure and staff shortage in the public health sector. The concerns regarding increasing drug prices and unavailability of affordable generic medicines also remain unaddressed. The large presence of private sector has already been a concern and the push for an insurance-based service provisioning seems to be one step further into that direction. The Union Budget 2015-16, therefore, was expected to increase the total allocation in the health sector by at least 1 percent of GDP from the present 1.2 percent, but the allocations seem to have undergone a decrease. Instead, the onus of prioritising expenditure on healthcare has been mainly devolved to the States on account of ‘health’ being the State subject in the Indian Constitution and increased devolution of the share of Central taxes.

61 Cen
tre
for
Bu
dge
t an
d G
over
nan
ce A
ccou
nta
bil
ity
13On 23rd February 2015, marking the start of the budget session, President Pranab Mukherjee men-tioned education as the ‘priority of priorities’ for his government. Presenting his first full year Budget, the Finance Minister Arun Jaitley also assured that, along with core economic issues, the Union Gov-ernment will continue its action in reforming the education sector. In a spirit of strengthening federal governance and cooperative federalism, the Government accepted the recommendations of the 14th Finance Commission (FC) to increase devolution of the divisible pool of resources to the states. This has been reflected in design of the allocations of the schemes for education in this Budget (See Box 1). The Ministry of Human Resource Development (MHRD) submitted a proposal to the 14th Finance Commission for continued support to states for elementary education (14th FC report, Vol I, Para 11.15).
Box 1: Compositional Shifts in the allocation of Schemes in view of higher resource devolution
Category A and B Category C and D
Core of the core(Schemes to run unaltered)
Core(Scheme to Run with Changed Sharing Pattern)
Scheme Not Getting Central Support Anymore
1. Pre- matric scholarship for children of those engaged in unclean occupation
2. Scholarship schemes (post and pre matric) for SC, ST and OBCs
3. Scheme for providing education to minorities
4. Umbrella scheme for education of ST children
5. Sarva Shiksha Abhiyan (Financed from education cess)
6. Mid Day Meal(Financed from education cess)
7. Support to educational development including Teacher training and adult education
1. Rashtritya Madhyamik Shiksha Abhiyan (RMSA)
2. Strategic assistance for state higher education- Rashtriya Uchcha Shiksha Abhiyan (RUSA)
(In these schemes, the revenue expenditure to be borne by States, Subsequent to change funding pattern, overall expenditure of the schemes will not decrease)
1. Scheme for setting up of 6000 model schools
(State may decide to continue or not with the scheme out of their increase resouces resulting from ecommendation of 14th Finance Commission)
Source: Compiled by CBGA from Union Budget Documents 2015-16 and REPORT OF THE SUBGROUP OF CHIEF MINISTERS ON RATIONALISATION OF THE CSS.
TAKEAWAYS FOR EDUCATION FROM THE UNION BUDGET

Cen
tre
for
Bu
dge
t an
d G
over
nan
ce A
ccou
nta
bil
ity
62
Major Announcements for the sector:1. IIT in Karnataka; Indian School of Mines in Dhanbad to be upgraded to IIT2. IIM for Jammu and Kashmir and Andhra Pradesh3. Setting up of Student Financial Aid Authority to administer and monitor Scholarship as well
Educational Loan Schemes, through Pradhan Mantri Vidya Lakshmi Karyakram4. Exemption of Education Cess and the Secondary and Higher Education Cess from excisable goods
and inclusion in Central Excise duty
However, the commitment of the Government to the Finance Commission is not reflected in its allocation pattern.
In Union Budget 2015-16, the total allocations for SSA and MDM are Rs. 22,000 crore and Rs. 9,236 crore respectively. This shows a reduction of 28.5 percent and 31 percent from the 2014-15 Budget Estimates. Over the last few years, the major chunk of government financing of SSA and MDM had been through education cess. However, this year, the part of the SSA and MDM financed from cess is categorised as ‘schemes fully supported by Union Government’, and rest of the allocations of Rs. 2,200 crore and Rs. 1461 crore respectively will flow to states as Gross Budgetary Support (GBS).
This fund sharing pattern clearly indicates that to roll out Right to Education (RTE) Act through SSA, the government is shifting its responsibility towards State Governments as 90 percent of the SSA allocation is now coming from the education cess (Prarambhik Shiksha Kosh) (See Fig. 1) and only 10 percent from Central Government’s Plan Budget.
In addition to these schemes, government also provides full financial support to central institutions like IITs and IIMs. This year also there is announcement for two IITs and two IIMs in the uncovered states. Last year, there were proposals for five new IITs and five new IIMs. For all these new institutes, Rs. 1,000 crore has been allocated. However, a recent press release of MHRD1 on the status of six new IIMs reports that it is only in Andhra Pradesh that a foundation stone has been laid, though the Ministry has ordered all the six mentor institutes of new IIMs to start admission procedure.
Figure 1: Pattern of Financing SSA through Education Cess (percent)
65.6
48 56.8 58.8 58.3
66.7 62.8
90
2009
-10
2010
-11
2011
-12
2012
-13
2013
-14
2014
-15
(BE)
2014
-15
(RE)
2015
-16
(BE)
Financing SSA through cess as a % of total SSA financing
Source: Compiled by CBGA from Union Budget Documents, various years
1 http://pib.nic.in/newsite/PrintRelease.aspx?relid=115866
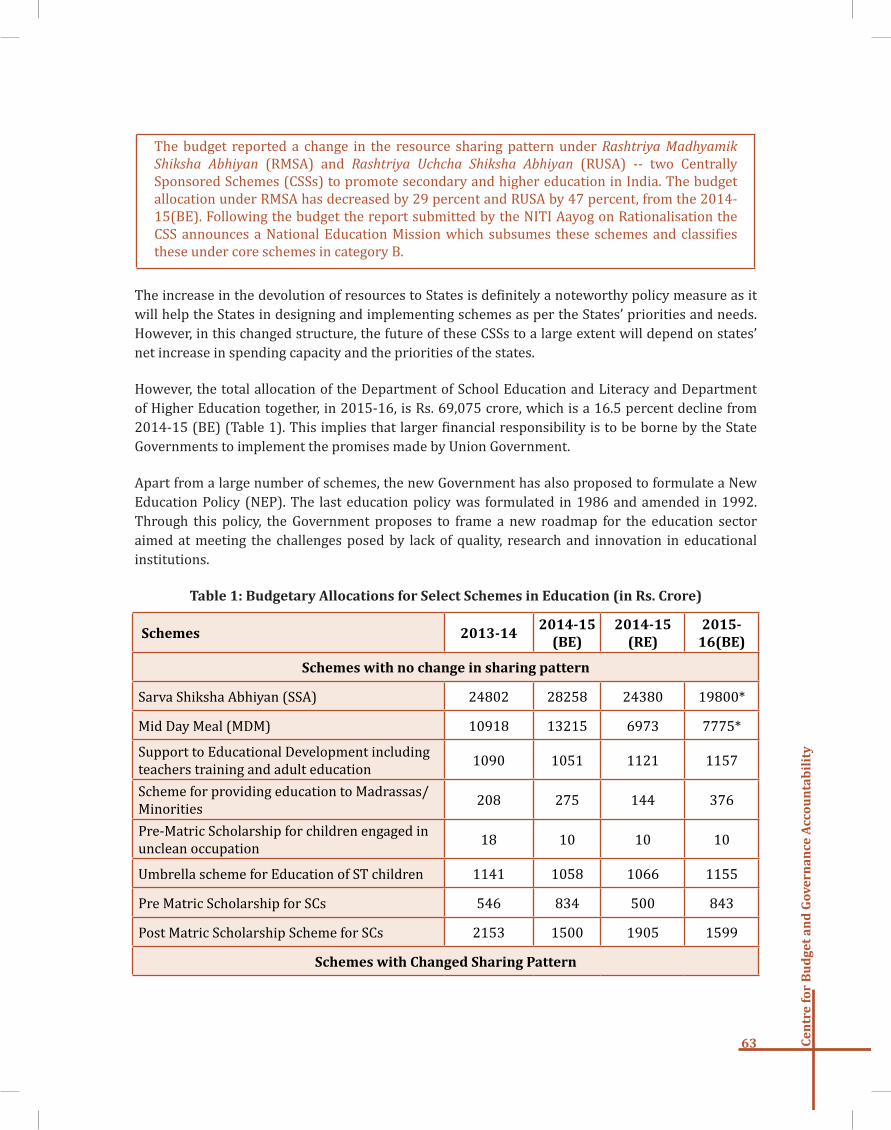
63 Cen
tre
for
Bu
dge
t an
d G
over
nan
ce A
ccou
nta
bil
ity
The budget reported a change in the resource sharing pattern under Rashtriya Madhyamik Shiksha Abhiyan (RMSA) and Rashtriya Uchcha Shiksha Abhiyan (RUSA) -- two Centrally Sponsored Schemes (CSSs) to promote secondary and higher education in India. The budget allocation under RMSA has decreased by 29 percent and RUSA by 47 percent, from the 2014-15(BE). Following the budget the report submitted by the NITI Aayog on Rationalisation the CSS announces a National Education Mission which subsumes these schemes and classifies these under core schemes in category B.
The increase in the devolution of resources to States is definitely a noteworthy policy measure as it will help the States in designing and implementing schemes as per the States’ priorities and needs. However, in this changed structure, the future of these CSSs to a large extent will depend on states’ net increase in spending capacity and the priorities of the states.
However, the total allocation of the Department of School Education and Literacy and Department of Higher Education together, in 2015-16, is Rs. 69,075 crore, which is a 16.5 percent decline from 2014-15 (BE) (Table 1). This implies that larger financial responsibility is to be borne by the State Governments to implement the promises made by Union Government.
Apart from a large number of schemes, the new Government has also proposed to formulate a New Education Policy (NEP). The last education policy was formulated in 1986 and amended in 1992. Through this policy, the Government proposes to frame a new roadmap for the education sector aimed at meeting the challenges posed by lack of quality, research and innovation in educational institutions.
Table 1: Budgetary Allocations for Select Schemes in Education (in Rs. Crore)
Schemes 2013-142014-15
(BE)2014-15
(RE)2015-
16(BE)
Schemes with no change in sharing pattern
Sarva Shiksha Abhiyan (SSA) 24802 28258 24380 19800*
Mid Day Meal (MDM) 10918 13215 6973 7775*
Support to Educational Development including teachers training and adult education 1090 1051 1121 1157
Scheme for providing education to Madrassas/Minorities 208 275 144 376
Pre-Matric Scholarship for children engaged in unclean occupation 18 10 10 10
Umbrella scheme for Education of ST children 1141 1058 1066 1155
Pre Matric Scholarship for SCs 546 834 500 843
Post Matric Scholarship Scheme for SCs 2153 1500 1905 1599
Schemes with Changed Sharing Pattern

Cen
tre
for
Bu
dge
t an
d G
over
nan
ce A
ccou
nta
bil
ity
64
Rastriya Madhyamik Shiksha Abhiyan (RMSA) 2679 5000 3480 3565
Rashtriya Uchcha Siksha Abhiyan (RUSA) 262 2200 397 1155
Scheme Delinked from Central Support
Schemes for setting up of 6000 model schools at block level 1275 1200 1022 1
Dept. of School Education and Literacy 46856 55115 46805 42220
Dept. of Higher Education 24465 27656 23700 26855
Note: *The total Union Budget allocation for SSA and MDM are Rs. 22,000 crore and Rs.9,236.4 crore respectively. These figures are the part of the schemes financed from Prarambhik Siksha Kosh (education cess); Source: Compiled by CBGA from various budget documents, various years.

65 Cen
tre
for
Bu
dge
t an
d G
over
nan
ce A
ccou
nta
bil
ity
14The deteriorating learning quality in government schools is currently one of the most discussed issues in the education sector. Economic Survey 2014-15 also has flagged issues like how more than one crore children are missing out on the benefits of legislations like RTE Act. Though there are improvements in literacy rate and school enrolment, learning scenario in India is dismal in international comparisons. PISA (2009) result shows the two most educationally advanced states, Himachal Pradesh and Tamil Nadu, ranked lowest in both reading and mathematical ability among the BRICSAM countries (and 72nd and 73rd out of a total of 74 tested entities for which results were reported) (Chart 1).
ASER (2014) report has also highlighted that learning levels, both in Government schools and Private schools, are not improving (Chart 2). The National Achievement survey by NCERT also pointed out learning as a big challenge in the Indian education sector. The levels of learning vary across states, gender, social groups and regions. The situation is more severe in higher levels of education. In a Continuous and Comprehensive Evaluation (CCE) of CBSE for 2 lakh students in class IX, only 90 thousand could pass the evaluation. Poor learning at earlier stages of education was identified as a key reason for this failure.
Charts 1 & 2: Performance in Learning Ability
Source: OECD PISA survey, 2009
Source: ASER, 2014
To improve the quality of foundational learning, MHRD has launched ‘Padhe Bharat, Badhe Bharat’ (PBBB) in 2014, as a sub-component of the Sarva Shiksha Abhiyan (SSA). The programme was designed to improve comprehensive early reading, writing and early mathematics programme for children in
DOES THE BUDGET ENSURE ‘PADHE BHARAT, BADHE BHARAT’?

Cen
tre
for
Bu
dge
t an
d G
over
nan
ce A
ccou
nta
bil
ity
66
Classes I and II. Under this programme, Rs. 762 crore was approved to States. However, there were no separate allocations for PBBB, as allocations for the line items were already covered under SSA. The allocation for improving the quality under SSA is minimal compared to other major components. The evidence clearly points to the indifferent attitude of the Government towards quality education.
Myths and Facts about Govt. School Teachers and Learning in India
Myth 2: Regular teachers in Govt. schools overpaid ; low cost private school teachers more efficient with
lesser salary
Myth 1: Learning level in low cost private schools is better
than Govt. school
Fact 1: This myth is one of the most fallacious beliefs pervading the education establishment. For the last ten years, ASER report is portraying the dismal condition of learning outcomes in rural India. It also reports a substantial increase in enrolment in private schools, as quality of learning is better in private schools as compared to the government schools. The findings read as ─ fundamental right to ‘quality’ education, can be achieved in an economically viable manner, only if the Government systematically partners with private providers in the elementary education (Sarangapani, 2009). However, as per the ASER data, percentage of children in Class V who can read a Class II level text, has increased from 41.1 percent in 2013 to 42.2 percent in 2014 in government school; whereas, in private schools these figures are 63.3 percent and 62.5 percent in 2013 and 2014 respectively.Learning not only depends on school management type, but also on other socio-economic factors. Children in private schools have more educated and affluent parents, who can afford to pay additional school fees (Wadhwa, 2014). Moreover, in spite of ‘better quality’ in private schools, children in classes I-V in government schools taking private tuitions has increased from 15.6 percent in 2011 to 15.7 percent in 2014. On the other hand, children of the same classes in private schools taking paid additional tuition, has increased from 5.7 percent in 2011 to 8.1 percent in 2014.
Fact 2: In the wake of recession, many policymakers, economists, and media are suggesting reductions in salary of inefficient regular teachers in government schools as a solution to country’s better fiscal health and maximum governance. However, so far there is no credible evidence to show that education offered by budget private schools is comparable to Government schools. Moreover, not a single study has shown a significant correlation between teacher salary and learning outcomes. Indeed, accountability of teachers is a serious concern. However, a salary cut or applying low cost private school model for employment of teachers in government schools will not ensure better learning outcomes. For example, for the last few years, as a policy measure, Bihar and Madhya Pradesh governments are appointing contractual (low paid) teachers in schools. This implies that the expenditure towards teacher salary is comparatively low in these states. A contractual teacher receives Rs. 6400-6800 per month in Bihar and Rs. 6000 in Madhya Pradesh (MP); while a regular teacher receives around Rs. 23,000-28,000 and Rs. 17800 on an average in Bihar and MP, respectively (Kapur and Dongre 2014). However, as per the Educational Development Index, among 35 States and UTS, Bihar ranks 34 and MP 31 (DISE, 2013-14).

67 Cen
tre
for
Bu
dge
t an
d G
over
nan
ce A
ccou
nta
bil
ity
15Swachh Bharat Mission (SBM) is one of the heavily endorsed programmes of the new government. This was evident from the Prime Minister’s gesture of taking up the broom and challenging many others to engage in sanitizing India. The SBM is an umbrella programme which includes National Rural Drinking Water Programme (NRDWP) and Swachh Bharat Abhiyan (SBA). It has both rural and urban component.
What does Budget 2015-16 have for Water & Sanitation?
• Budget 2014-15 (RE) for SBA – Rs. 4540.5 Crore• Budget 2014-15 (RE) for NRDWP- Rs. 9250 crore• Toilets constructed in 2014-15 – 50 lakh• Resource provided to build toilets in 10 heritage sites• Donations other than CSR for Swachh Bharat Kosh to come under section 80G of the IT Act• Supplementary grants announced in September, 2015 allocated an additional Rs.
3685 crore for achieving targets
The Finance Minister in his Budget Speech described SBM as a programme not just for hygiene and cleanliness but largely for preventive health care and awareness generation. However, the Budget 2015-16 did not reflect the government’s intention on Clean India. In view of the larger devolution of tax resources to States as per the recommendations of the Fourteenth Finance Commission, the funding pattern of Swachh Bharat Mission, like many other Centrally Sponsored Schemes is being modified. In the pretext of this development, the Union government has almost halved the budget for the SBA from Rs. 12100 crore in the 2014-15 (RE) to Rs. 6236 crore in 2015-16 (BE). It also stated that from now onwards the revenue expenditure would be borne by the states. With more autonomy to spend funds, water and sanitation would now largely be the responsibility of the states. Therefore, it is now critical to look at the spending of the states on the sector.
Financing Swachh BharatThe Swachh Bharat Mission mobilises funds from various sources. The responsible ministries for the mission are Ministry of Drinking Water and Sanitation (MDWS) for rural area and Ministry of Urban Development (MoUD) for urban sanitation, while the Department of School Education and Ministry of Women and Child are responsible for constructing toilets in schools and anganwadi centres (AWCs) respectively. Besides, Sarva Siksha Abhiyan and Rashtriya Madhyamik Siksha Abhiyan funds being used to construct school toilets, funds are also mobilised from the corporate sector and Public Sector Units (PSUs) as part of their Corporate Social Responsibility (CSR). A special fund — Swachh Bharat Kosh (SBK) has been set up to facilitate channelization of philanthropic contributions and CSR funds towards this cause. The budget facilitated 100 percent deductions for contributions, other than by way of CSR contributions, to the SBK. Further to construct community sanitary complexes and public toilets the government is depending on the Public Private Partnerships.
DRINKING WATER AND SANITATION - STEPS TOWARDS ‘SWACHH BHARAT’

Cen
tre
for
Bu
dge
t an
d G
over
nan
ce A
ccou
nta
bil
ity
68
The Finance Minister in his speech emphasized that Swachh Bharat has a larger goal of creating a clean environment than just constructing toilets. To finance the clean environment initiatives, the government increased the clean energy cess from Rs. 100 to Rs. 200 per metric tonne of coal, etc. The excise duty on sacks and bags of polymers of ethylene used other than by the industries is increased from 12 percent to 15 percent. Additionally, if need arises, provisions will be enabled to levy Swachh Bharat cess at a rate of 2 percent or less on all or certain services. The budget also provided concessions on custom and excise duty available to electrically operated vehicles and hybrid vehicles to curb pollution and promote clean energy.
Can the Targets be achieved?The SBM aims to make India open defecation free by the year 2019. The objective is to construct 11.11 crore Individual Household Latrines (IHHL) in the country. The government has set a target of providing toilets to every school by August 15, 2015. To achieve this, the department of school education has launched Swachh Bharat Swachh Vidyalaya programme. Moreover, solid and liquid waste management is also the objective of the mission and therefore it includes components like Solid Liquid Waste Management system in rural areas and Municipal Solid Waste Management in 4041 statutory towns of the country.
Table 1: School toilets supported by various agencies
Agencies Boys Toilets Girls Toilets Total
Corporate sector 1271 1924 3195Public Sector Units 56174 30607 86781RMSA 2032 1446 3478SSA 94814 68739 163553Total 154291 102716 257007Only 1% of the total school toilets are supported by 14 corporate companies
Source: www.mhrd.gov.in, http://125.63.72.116:8085/swachhvidhyalaya/, accessed on February 28, 2015
With such high targets and set deadlines, it is important that the pace of the programme remains consistent. According to the Ministry of Human Resource Development, the department aims to construct 257,007 new toilets and repair 162,571 dysfunctional toilets. Though the department has achieved 100% booking to construct new toilets and 52 percent for repairing dysfunctional toilets, the achievement with respect to the deadline is not satisfactory. Since the inception of the Programme, only 20 percent of the new toilets have been constructed while just 0.8 percent of the dysfunctional toilets have been repaired. Ideally, to achieve the set target 51,401 new toilets should be constructed per month but it took six months to construct same number of toilets.
The physical achievements for anganwadi toilets are even lower. In the financial year 2014-15, a total of 3937 toilets were constructed by November 2014. Construction of AWCs with toilets has become a programme component of ICDS only recently. Provision of toilet is an integral part of the two lakh new AWC buildings to be constructed and two lakh to be upgraded. States have been instructed to provide at least one toilet per unit in upgraded AWC buildings. Further, about 6.9 lakh existing AWC have no toilets as on 31st March, 2014.

69 Cen
tre
for
Bu
dge
t an
d G
over
nan
ce A
ccou
nta
bil
ity
Studies by Centre for Budget and Governance Accountability find that poor physical achievements are the result of untimely flow of funds to the local bodies, poor capacities of the existing work force and improper planning. Therefore to expedite the process it is expected that the state governments invest on recruitment of workforce and enhance the capacities of the front line workers by training and capacity building programmes. Apart from this proper monitoring is important to ensure accountability. In the absence of this, it would be difficult to achieve the mammoth task of making India open defecation free.
Are allocations adequate?
Notion of a functional toilet
SQUAT Survey conducted in the villages of Central and North India finds that people in rural India have a globally unique concept of a functional toilet. The respondents described the cost of a functional toilet to be Rs. 21,000. The question then arises that, is it too high a cost for a sustainable toilet with proper fecal disposal system.
It is doubtful whether the government would be able to achieve its target by looking at the budgetary allocations for the programme. Poor sanitation has been repeatedly linked more to people’s behaviour than to accessibility and availability of toilets. While government believes that habits can be improved by training and capacity building its efforts remain insincere. The allocation to the Information, Education and Communication (IEC) component has been reduced from 15 percent to 8 percent. There are different views on increasing the unit cost for an IHHL and more focus on IEC, but to make India open defecation free neither can be undermined.
By sharing 42 percent of the tax resources with the states, the Union Government has transferred a big share of expenses to the states and therefore the funding to the sector will now depend on the prioritisation of the states. However, the Subgroup of Chief Minister in their report submitted to the NITI Aayog on rationalising CSS has also recommended that infrastructure related expenses would be shared by the Union and any expenditure pertaining to the salaries for workers in the SBA would be protected at the existing levels till 2017. Any new recruitment or increments would have to be borne by the states themselves. Thus it would depend solely on the states to decide on their strategies to meet targets and maintain those in the coming days with a larger share of taxes and reduced plan assistance.

Cen
tre
for
Bu
dge
t an
d G
over
nan
ce A
ccou
nta
bil
ity
70
Rural development is a strategy designed to improve the economic and social life of the rural poor and ensure an all-encompassing development of the rural areas in India. It involves extending the benefits of development to the poorest in rural areas, to bring about equity in the quality of life across all socio-economic groups. As per the Census 2011, nearly 83 crore people in India are living in rural areas, which constitute about 69 percent of the total population of the country. Thus, given the large rural economy in India, there is a need for concerted focus on rural development in terms of appropriate policies and adequate budgetary allocations. Also, convergence across schemes is needed for achieving better outcomes for the sector.
Since this is the first full-fledged budget of the NDA Government, it would be interesting to witness how the policies and budgets for rural India unfold. In the elections for the 16th Lok Sabha, the BJP had announced specific agenda for the rural sector in its election manifesto. The manifesto had envisioned the idea of Rurban – “urban amenities to rural areas while retaining the soul of the village” and a focus on improving village level infrastructure. In the budget 2014-15, the Shyama Prasad Mukherji Rurban Mission and the Village Entrepreneurship Start-up Programme was introduced with an initial allocation of Rs. 100 crore in each. The preferred mode of delivery under the Rurban Mission was public private partnership. In Union Budget 2015-16, no new schemes or programmes have been announced; rather, there has been an effort to delink the schemes like Backward Regions Grant Fund (BRGF) from the Union Budget or possibility to transfer fully the Indira Awas Yojna (IAY) and National Rural Livelihood Mission (NRLM) to State governments. Only Mahatma Gandhi National Rural Employment Guarantee Act (MNREGA) and Pradhan Mantri Gram Sadak Yojna (PMGSY) are going to be fully supported by the Union Government among the rural development programmes.
The Ministry of Rural Development (MoRD) has been running a number of programmes/schemes in addition to those by the Rural Development Department in different States. The major flagship programmes which account for bulk of the allocations in the Ministry include MGNREGA, Ajeevika/NRLM, IAY and PMGSY.
At the Union level, there has been an increasing trend in the budgetary allocations under all the MoRD schemes from 2004-05 to 2014-15. The rate of increase witnessed about a 2.6 fold increase in 2008-09 over the 2007-08 amount essentially reflecting the increased allocations under the flagship programme MGNREGA, which came into operation in the year 2006-07. The allocation of Rs.73270 crore was under the MoRD for 2015-16 which shows a relative dip from Rs 83852 crore in 2014-15 because of the restructuring in the fund flow mechanism of flagship programmes in the Union Budget.
In almost all the schemes the outlays approved by the 12th FYP are nearly half of those proposed by the Ministry. For instance, under MGNREGA the MoRD had proposed about Rs. 3.6 lakh crore for the 12th Plan period but the Planning Commission approved only Rs. 1.6 lakh crore. For some other schemes like IAY, the 12th Plan amount approved was less than half of the amount proposed by the MoRD. Information presented below shows that the allocations made in the first four years as percent of the
RURAL DEVELOPMENT: KEY ISSUES AND CHALLENGES16

71 Cen
tre
for
Bu
dge
t an
d G
over
nan
ce A
ccou
nta
bil
ity
total 12th Plan outlay have varied across different schemes. Under NRLM and PMGSY, the allocations in the first four years have been 50 percent and 60 percent of the total Plan outlay respectively and relatively larger amounts remain to be allocated in the last year of the Plan.
Table 1: Allocations (Budget Estimates) over different years in the 12th FYP (in Rs. Crore)
SchemeProposed allocation in12th Plan
2012-13 2013-14 2014-15 2015-16
Allocation in first 4 years as % of 12th Plan outlay
MGNREGA 165059 33000 33000 33989 34699 81.6NRLM 29006 3915 4000 4000 2382.8 49.3IAY 59585 11075 15184 16000 10025 87.7PMGSY 124013 24000 21700 14391 14291 59.9
Source: Note on Demand, Department of Rural Development, Vol-II
The rate of utilization in IAY has been reported as reasonably good. But, the current unit cost per household under IAY is inadequate and does not incorporate the rising cost of material.The IAY is a flagship scheme of the MoRD which aims at providing houses to below the poverty line (BPL) families in the rural areas.Under the IAY, a shelter-less BPL family is given assistance of Rs. 70,000 in plains and Rs. 75,000 in hilly/difficult areas/Integrated Action Plan (IAP) districts for construction of a new house. Therefore, the unit cost under the IAY should have ideally been revised and consequently this should have been reflected in the Union Budget 2015-16. The physical targets specified under the scheme, too, are inadequate. Thus there needs to be an upward revision in these targets as well as the overall budget under IAY.
Under the MGNREGA, the expenditure as percent of total available funds has been in the range of 73-83 percent for most of the years since the inception of the Scheme, exceeding the total available funds in the year 2012-13. However, the person-days of employment per household have been in the range of 42-54 days, much less than the guaranteed number of 100 days. Thus, the performance under this scheme has not been up to the mark as seen in the following Table.
Table 2: MGNREGA - Financial and Physical Progress
Years 2006-072007-
082008-
092009-
102010-
112011-
122012-
13
Financial Progress
Items200
Districts330
Districts615
Districts619
Districts625
Districts635
Districts636
DistrictsBudget Outlay (Rs. crore) 11300 12000 30000 39100 40100 40000 33000Central Releases (Rs. crore)
8641 12610 29940 24714 10383 9952 32550
Total available fund (including OB) (Rs. crore)
12074 19306 37397 45682 52649 41564 38835

Cen
tre
for
Bu
dge
t an
d G
over
nan
ce A
ccou
nta
bil
ity
72
Expenditure (Rs. crore) 8823 15857 27250 37910 39377 37549 39440Expenditure (% against available funds)
73% 82% 73% 83% 75% 90% 101%
Expenditure on wages (as % of total expenditure)
66% 68% 67% 69% 58% 64% 69%
Physical progress
Total Job Cards Issued (in crore)
3.8 6.5 10.0 11.3 12.0 12.3 12.6
Households provided Employment (in crore)
2.1 3.4 4.5 5.3 5.5 5.0 5.0
Total Employment days (in crore)
90.5 143.6 216.3 283.6 257.2 211.4 210.8
Person-days of employment per HH
43 days 42 days 48 days 54 days 47 days 42 days 44 days
Average Wage paid per person-day (in Rs.)
65 75 84 89 99 113.54 121.38
Source: National Institute of Rural Development (NIRD) Statistics, 2012-13
Box 1: Major Restructuring in the Rural Development Programmes
The Backward Region Grant Fund (BRGF) has been dropped from the Union Budget 2015-16. BRGF was launched in February 2007 (as Additional Central Assistance to State Plan) as an area development programmes in 272 backward districts, to bridge the regional imbalances in development across States through decentralised planning processes. The BRGF programme has two components, namely, the Development Grant component and the Capacity Building component. Government should not have scrapped the BRGF given its importance in terms of removing the regional imbalances and strengthening the grassroots planning without prior consultation with the State governments.
Further, in the announcements following the Budget 2015-16, and the report of the NITI Aayog on Rationalisation CSS, MGNREGA has been classified as core of the core programmes under classification A. The housing components in IAY and NRLM has been classified as core schemes under category B which signifies that the fund sharing pattern between Centre and States would undergo changes.
Operational Issues in MGNREGAIn Union Budget 2015-16, the allocation for MGNREGA stands at Rs. 34,699 crore, which is not a significant increase over the previous years. It must be noted that the allocations under the MGNREGA over the past few years have remained nearly stagnant. According to the NSSO 66th Round data (July 2009 - June 2010), 25 percent of rural households were provided work under the scheme. Around 19 percent of the total rural households sought work but did not get employment under MGNREGA. The proportion of total rural households seeking work but not getting employment under MGNREGA, remained around 19 percent even in the 68th round of NSSO (July 2011- June 2012).

73 Cen
tre
for
Bu
dge
t an
d G
over
nan
ce A
ccou
nta
bil
ity
As MGNREGA is essentially demand driven, any procedural failing or implementation bottleneck on the part of the state would adversely affect the demand for work under the programme and lead to its failure. It is well acknowledged that the majority of the beneficiaries under MGNREGA have been the poor households and the marginalised sections of the society, that is, women, SCs and STs. In this context, the MGNREGA Sameeksha (2012) notes that, “…rationing of demand greatly undermines the poverty alleviation potential of the Scheme”. At present, the allocations for MGNREGA cost the exchequer a meagre 0.3 percent of GDP and nearly 50 million households are getting at least some employment. Thus, it is imperative that the allocations under MGNREGA are increased in the next budget.
It has been reported that under MGNREGA there were enormous unpaid wages in the year 2013-14, amounting to a sum of Rs. 4,800 crore. Accounting for these unpaid wages, the effective allocation stands at only about Rs. 29,200 crore. In the detailed guidelines of the MGNREGA there is a clause for the payment of compensation for the duration of the delay, beyond the sixteenth day of closure of muster rolls. However, a circular by the Department of Rural Development, notes that “…it was found that except for Maharashtra and Chhattisgarh, in no State, the Programme Officers have been examining the delayed cases, which reflects poorly on the monitoring of the scheme in many States.” According to the MGNREGA MIS, the share of payments generated within 15 days was 57.5 percent in 2012-13 and 45.6 percent in 2013-14. This shows that in 2012-13 and 2013-14, about 42 and 54 percent of the payments respectively, were delayed beyond the stipulated 15-day limit. As provisions under MGNREGA are demand driven, it is of utmost importance to ensure adequate availability of work and timely payment of wages, to keep the scheme operational.
Another area of concern is the discrepancy between the data available on MGNREGA under the MIS and the NSS Rounds. For instance, there are discrepancies under the heads “percentage of rural households provided employment” and “Average person-days/households”. Thus, there is a need to make the MGNREGA MIS data more authentic. According to the Comptroller and Auditor General Report on MGNREGA (2013), there was a variation ranging from 1 to 71 percent between MIS and Monthly Progress Report data. There is also no mechanism to verify the authenticity of data uploaded to the MGNREGA website.
In sum, the Union Budget 2015-16 does not show any substantial increase in the allocations under any of the flagship programmes of the Government under MoRD, including MGNREGA. The total allocation for the MoRD has declined to Rs.73270 in 2015-16 from Rs 83852 crore in 2014-15. Also, the government did not come out with any concrete measure to ensure adequate availability of work and timely payment of wages, to keep the MGNREGA operational. However, the Report of the Subgroup of Chief Ministers on rationalising CSS has recommended to classify MGNREGA as ‘core of the core’ schemes under the category A in which schemes would be implemented unaltered, given its legal support.

Cen
tre
for
Bu
dge
t an
d G
over
nan
ce A
ccou
nta
bil
ity
74
HOW WELL ARE FARMERS’ PLIGHTS ADDRESSED IN BUDGET 2015-16?
Agriculture sector has been playing an important role in shaping the overall growth trajectory of the Indian economy since Independence. However, the contribution of this sector in the overall Gross Domestic Product (GDP) of the country has come down significantly in recent years, compared to the early phases of planning process. In spite of this decline, it employs more than half of the country’s total population. Being a source of raw materials for a number of industries, its contribution to the country’s total export, the linkages with overall economic growth as well as securing food for the nation, the sustained growth of the agriculture sector is imperative.
During post 1990s, the gap between the overall GDP growth rate and the growth of the primary sector (which includes agriculture sector) has widened, which indicates that the primary sector growth is lagging behind the overall economic growth. Though there has been a revival of the growth of Agri-GDP during the 11th Five Year Plan Period, the same during 2012-13, 2013-14 and 2014-15 has been registered at 1.2, 3.7 and 1.1 percent, respectively. The important causal factor for such a downturn in growth rates compared to the growth rate that this sector registered during 11th FYP (i.e. 4.1 percent-annual average) has been inadequate attention in the budgetary priorities towards this sector in the Union Government budgets.
Krishi Unnati Yojana and Pradhan Mantri Krishi Sinchai Yojana
In the subsequent announcements following the UB 2015-16 and the submission of the report of the Subgroup of Chief Ministers on Rationalisation the CSS, it was made clear that Agriculture, including Animal husbandry, Fisheries Integrated Watershed Management and Irrigation was in the priority list of the union government. It was also reflected in the announcement of the umbrella programme of Krishi Unnati Yojana which subsumed most of the mission programmes on agriculture and the RKVY (ACA). The Pradhan Mantri Krishi Sinchai Yojana would be the other umbrella to cover irrigation and watershed management programmes. The schemes are all classified as core schemes and would be implemented as schemes in categories A and B. The table below provides details of the umbrella programme.
Name of schemes/programmes Umbrella Programme
Pradhan Mantri Adarsh Gram Yojana (PMAGY)
Krishi Unnati Yojana
National Food Security Mission National Horticulture Mission National Mission on Sustainable Agriculture National Oilseed and Oil Palm Mission National Mission on Agriculture Extension and Technology
Rashtriya Krishi Vikas Yojana (RKVY) (ACA)
Integrated Watershed Management Programme (IWMP) Pradhan Mantri Krishi Sinchai YojanaAccelerated Irrigation Benefit & Flood Management
Programme (merging AIBP and other programmes of water resources such as CAD, EMP etc.) (ACA) + DAC
Source: Compiled by CBGA from Union Budget documents, 2015-16 and REPORT OF THE SUBGROUP OF CHIEF MINISTERS ON RATIONALISATION OF THE CSS
17

75 Cen
tre
for
Bu
dge
t an
d G
over
nan
ce A
ccou
nta
bil
ity
Although lofty promises were made in the election manifesto of the present government at the Centre, hardly any substantive steps have been taken in the Union Budget 2015-16. Further, considering these promises made in the election manifesto, it was expected that this Union Budget 2015-16, which is the first full-fledged budget of the NDA government at the Centre, would give top priority to this sector, particularly a boost to the farm income through the agricultural activities in the dryland.
Resource Allocations and Spending in Agriculture SectorThe allocation for the Ministry of Agriculture (MoA) in the current Union Budget shows a decline over the 2013-14 Acutal Expenditure and 2014-15 RE. This decline is to the extent of Rs. 1713 crore [Rs. 24,910 crore in 2015-16 (BE) from Rs. 26,623 crore in the 2014-15 (RE)] and to the tune of Rs. 589 crore in 2015-16 (BE) compared to the allocation 2014-15.
However, agricultural research and education, which has been playing an important role in the research and development of new technologies to cope with the increasing demand of foodgrains in the country, has been given priority in the annual budgets of the Ministry. Consequent to this, the allocations for the Department of Agriculture Research and Education within the MoA has got a boost in the current Union Budget. Data presented in Table-1 captures budgetary allocations under three departments of the MoA since 2009-10.
Table 1: Allocations for Three Departments of the MoA since 2009-10 (Rs. Crore)
Year Types of Expenditure
Dept. of Agriculture and Cooperation
Dept. of Agricultural Research and Education
Dept. of Animal Husbandry Dairying and Fisheries
Total Expenditure of the MoA
1 2 3 4 5 6=3+4+52009-10 Plan 10623 1707 871 13201
Non-Plan 1051 1503 100 2655Total 11675 3210 971 15856
2010-11 Plan 16967 2522 1096 20585Non-Plan 277 2864 93 3234Total 17245 5386 1189 23819
2011-12 Plan 16524 2573 1230 20327Non-Plan 195 2156 103 2454Total 16719 4729 1333 22781
2012-13 Plan 17655 2461 1716 21833Non-Plan 298 2048 76 2421Total 17953 4510 1792 24254
2013-14 Plan 18691 2451 1749 22890Non-Plan 232 2280 77 2589Total 18923 4731 1826 25479
2014-15 (RE)
Plan 19530 2500 1800 23830Non-Plan 322 2384 87 2793Total 19852 4884 1887 26623

Cen
tre
for
Bu
dge
t an
d G
over
nan
ce A
ccou
nta
bil
ity
76
2015-16 (BE
Plan 16646 3691 1491 21828Non-Plan 358 2629 94 3081Total 17004 6320 1585 24910
Note: RE-Revised Estimate; BE-Budget EstimateSource: Compiled by CBGA from Union Budget documents
How are Major Schemes funded within the Ministry of Agriculture?
There has been a major reshuffle in the current Union Budget with regard to implementation of erstwhile schemes of the Union Government in agriculture and allied sectors. Rashtriya Krishi Vikas Yojana (RKVY), which was the flagship programme of the Union Government during 11th and 12th Five Year Plan period, has received inadequate attention in the current budget with the amount being pegged at Rs. 4500 crore. Similarly, allocations for National Food Security Mission (NFSM) also reduced in the current Union Budget to the extent of Rs. 730 crore compared to the budget allocated during 2013-14 (BE).
Table 2: Budget for Select Schemes in Agriculture Sector (in Rs. Crore)
Scheme 2013-14 2014-15 BE 2014-15 RE 2015-16 BE
Rashtriya Krishi Vikas Yojana (RKVY) 7053 9954 8444 4500National Food Security Mission (NFSM)
2027 2030 1830 1300
National Horticulture Mission (NHM) 1809.3 0 0 0Mission for Integrated Development for Horticulture(MIDH)
0 2232.5 1959.1 1950
National Mission for Sustainable Agriculture (NMSA)
0 1511.6 1330.4 835
National Oilseed and Oil Palm Mission 0 329 350Pradhan Mantri Krishi Sinchai Yojana (of which) Integrated Watershed Management Programme (IWMP) Pradhan Mantri Krishi Sinchai Yojana
0 5623.3 53000 2313 15000 30 1800
Paramparagat Krishi Vikas Yojana 0 0 300Agricultural Marketing (schemes like construction of Rural Godowns, Integrated Scheme on Agricultural Marketing, Grants to SFAC for Credit Guarantee Fund for FPOs etc.)
870.7 755.7 898.7 843.2
Indian Council of Agricultural Research (ICAR)
2480 3334 2206.6 3295

77 Cen
tre
for
Bu
dge
t an
d G
over
nan
ce A
ccou
nta
bil
ity
NAIS/MNAIS/WBIC 2551 2588 2589Sub-Mission on Agriculture Extension 0 670.6 625.5Blue Revolution 316.2 422.6 301.7 410.7Dairy Vikas Yojana 501.6 516.5 449.6 481.5
Source: Compiled by CBGA
The National Horticulture Mission (NHM) and other relevant programmes meant for development of horticulture and vegetable crops have been merged with the Mission for Integrated Development for Horticulture (MIDH) for which a lesser allocation to the tune of Rs. 280 crore has been noticed in the current budget over 2013-14 BE. Further, schemes like Pradhan Mantri Krishi Sinchai Yojana (Rs. 623 crore), Sub-Mission on Agriculture Extension (Rs. 35 crore), and Blue Revolution (Rs. 100 crore) got a decreased budgetary allocation in the Union Budget 2015-16. Paramparagat Krishi Vikas Yojana (a new scheme) has been introduced in the current budget with an allocation of Rs. 300 crore (Table-2).
Does ‘one size fits all’ work for Indian agriculture: Outlays for Rainfed/Dryland Agriculture in Union Budget 2015-16
Given that nearly two-thirds of the country’s cultivated area is under rainfed agriculture, public policies with adequate budgetary provisions would be critical for achieving sustained agricultural growth, and hence the overall economic growth. In the past, there have been a few policy announcements for development of rainfed agricultural practices in the country. However, inadequate budget allocations either for rolling out such programmes or their implementation has resulted in unfulfilled outcomes. In the current Union Budget, the amount provisioned under National Mission on Sustainable Agriculture (NMSA) is quite inadequate and even declined over the Revised Estimate of 2014-15. It is important to note here is that NMSA was introduced in the 12th FYP with an objective to address issues like climate change, water conservation, water management and water efficiency, soil fertility and sustainability of natural resources use and rainfed agricultural issues in a holistic manner including programme of dip and sprinklers distribution.
It was also expected that RKVY would be the vehicle to devote much of its allocated resources towards the development of rainfed/agriculture. However, allocations under RKVY in the Union Budget 2015-16 has been minimized and now States have to devote much of its own resources towards fulfilling the objectives carved out in the 12th Five Year Plan. Further, the budget document also noted that the allocation for RKVY will not be decreased from the present level subsequent to the changed funding pattern following the recommendations of the 14th Finance Commission. It has also been noted that the states have to bear the revenue expenditure under the scheme. Given huge shortage of staffs, across states, such conditionality that states’ cannot use funds under RKVY for the payment of salary to the staff and recruit more staffs by the Union Government has been quite disappointing.
In the whole, the allocations provisioned under the Department for Land Resources (DoLR) within the Ministry of Rural Development, the administrative unit responsible for the development of dryland/rainfed agriculture in the country has declined to the tune of Rs. 1637.5 crore in 2015-16 (BE) compared to Rs. 3759.13 crore in 2014-15 (BE). This indicates growth disparity within agriculture sector would continue to widen further as the Union Budget 2015-16 again fails to treat concerns of rainfed/dryland agriculture in the country.

Cen
tre
for
Bu
dge
t an
d G
over
nan
ce A
ccou
nta
bil
ity
78
From Government Accounts to Farmers’ Accounts-A long way to Travel!As noted in the Economic Survey 2013-14, due to implementation of RKVY and related sub-schemes, paddy production in implementing states has increased by 7 percent in 2012-13 over 2011-12. In 2013-14, the total foodgrain production has been estimated at 265.6 million tonnes, for 2014-15 this would be lower by 8.5 million tonnes. Given such a scenario declining production of foodgrains and looking at the requirements for provisioning of foodgrain under National Food Security Act and other welfare scheme of the government, it is desirable that the Union Government prioritises its budget towards agriculture sector by giving a boost in allocation. In this context, one of the recommendations of the Shanta Kumar Committee “greater investments in agriculture in stabilizing production and building efficient value chains to help the poor as well as farmers” is worth noting. One of the very few positive things seen in the current Union Budget is that there has been an increase in allocation towards Crop Insurance Schemes compared to the budgets of previous years, which is again as a part of the commitments mentioned in the election manifesto. However, the demand for extending crop insurance to all farmers, for all crops and considering lower units (that is individual farmers’ crop) as the unit of insurance with hundred percent insurance premiums to be borne by the government would still be a dream for the farming community. The grand promises noted in the BJP’s manifesto for the farming community would require a long way to go if aspirations of securing farmers’ income are to be fulfilled.

79 Cen
tre
for
Bu
dge
t an
d G
over
nan
ce A
ccou
nta
bil
ity
18Situation of Hunger and Malnutrition in the CountryIt is indeed shocking to note that even after close to seven decades of India’s independence, its story on mitigating hunger and malnutrition remains quite unsatisfactory. During 2010-12, the incidence of undernourished people in total population was as high as 17.5 percent (compared to 20.9 percent in 2004-06), the incidence of underweight children in the total under-five age group was 40.2 percent in 2008-12, the incidence of anemia in the age 6- 59 months is reported to be as high as seventy percent. Due to lack of proper nutrition among children under-five years of age, ‘wasting’ is inflicted on almost 20 percent, 43 percent are underweight and 48 percent are ‘stunted’. Further, hunger and malnourishment have their own social geography [as the Scheduled Castes/Tribes (SCs/STs) are relatively worse off] as well as physical-economic geography, with a number of Indian states being comparable to the worst cases in Sub-Saharan Africa. For instance, the prevalence of wasting among the children from the Scheduled Tribes (ST) community is 28 percent, compared to 20 percent for the overall relevant population.
Despite substantial progress (as reported by some surveys) with respect to child nutrition since 2005-06 (the last round of National Family Health Survey-III, which captured relevant statistics on child malnourishments), undernutrition levels in India remain higher than “almost anywhere else in the world”. Further, despite several major schemes in place for decades such as the Integrated Child Development Services (ICDS), the Mid-Day Meal, Anganwadi Centres and others, the core problem of hunger and malnutrition of its children continues to be on the higher side. The implementation of many of these schemes is quite tardy as there is lack of seriousness in addressing administrative and functional bottlenecks associated with these schemes over the years. Although there are number of good provisions laid down in the National Food Security Act 2013 to address concerns relating to hunger, important and serious flaws on how to improve nutrition still lie unanswered. Most importantly, at this point in time, rolling out NFSA in all the States are still wanting. Further, such problems would aggravate the situation with the new fiscal architecture that has been reflected in the current Union Budget 2015-16, where implementation (in terms of budgetary allocations) of many of these decade old schemes (like ICDS) is left with the State governments.
Manifesto Commitments and Status of NFSA-A Reality Check
It is important to mention that the government at the Centre in its election manifesto promised, “… ‘universal food security’ is integral to national security…. and that the right to food does not remain an act on paper or a political rhetoric”. A review of the Public Distribution System (PDS) was also promised in order to benefit the common man with a radical transformation of the Food Corporation of India (FCI). In the Union Budget 2014-15, there has been a mention on ‘unbundling FCI operations into procurement, storage and distribution for greater efficiency’. The present government at the Centre had also promised to secure people’s right to food and nutrition in its election manifesto.
ALLOCATION PRIORITIES FOR FOOD SECURITY

Cen
tre
for
Bu
dge
t an
d G
over
nan
ce A
ccou
nta
bil
ity
80
In pursuance of its promise, the Government of India constituted a High Level Committee in August 2014 headed by Shanta Kumar to suggest restructuring or unbundling of Food Corporation of India (FCI) with a view to improve its operational efficiency and financial management. The Committee suggested how to unbundle FCI, and the recommendations put forward are undesirable and unwelcome when it comes to squeezing coverage of NFSA to around 40 percent. Further, instead of recommending how to strengthen and bring efficiency of FCI, particularly at times when the added responsibility attached to this decade old institution after the enactment of NFSA, 2013 for procuring and handling foodgrains distribution in the country, recommendations like allow private players to do so, seems quite bizarre.
NFSA in the Changed Context- Shanta Kumar Committee Recommendations
Parliament of India enacted the National Food Security Legislation in 2013, which brought several existing schemes and programmes into one umbrella aimed at providing food and nutritional security by ensuring coverage of 75 percent of rural and 50 percent of urban Indians with an entitlement of 5kgs of cereals per person per month. However, there has been tardy implementation of the National Food Security Legislation by the states which is not only a denial of the right to basic needs of individuals but also aggravates the situation of hunger and malnutrition of the country day by day. Originally in NFSA, 2013 it was mandated that within 365 days of passing of the Act, state governments should rollout the Act. As of now only eleven states and Union Territories, e.g. Punjab, Haryana, Rajasthan, Himachal Pradesh, Madhya Pradesh, Bihar, Chhattisgarh, Maharashtra, Karnataka, Delhi and Chandigarh have implemented the Act, fully or partially. In the meantime, the deadline of rolling out NFSA fully has been extended thrice. Enactment of the National Food Security Bill by the Union Government of India is certainly a welcome step, but there are number of issues which are yet to be resolved- relating to public provisioning (food subsidy in the budgets) and other implementation issues including the maternity entitlement.
The Shanta Kumar Committee recommended 7 kgs of cereals per person per month for family members of priority households. But, as per NFSA, 5 kgs grains per person per month were provisioned to priority households. The Committee also opined that provisioning of 5 kgs per person per month would make poor households worse off, who used to get 7 kgs per person per month under the Targeted Public Distribution System (TPDS). Also, its recommendations of providing of well-designed subsidized bins (to the targeted beneficiaries) to keep the ration safely, for at least 6 months, immediately after the procurement season ends was a laudable step. Regarding the need for real time basis computerization and digitization of entire food management system, covering procurement and distribution of foodgrains under NFSA and other welfare schemes of the government of India, is certainly a welcome feature.
However, on the other hand, the Committee also recommended that the coverage of food subsidy needs to be revisited and restricted to only around 40 percent instead of the present provisioning of 67 percent in the NFSA. While recommending so, the Committee did not mention why it should be restricted to such a low level except saying that the recommended level would “comfortably cover BPL families and some even above that”. The reason cited for reduced coverage due to leakages in the system seems quite contradictory, particularly where so called worst performing states have been able to address this considerably.
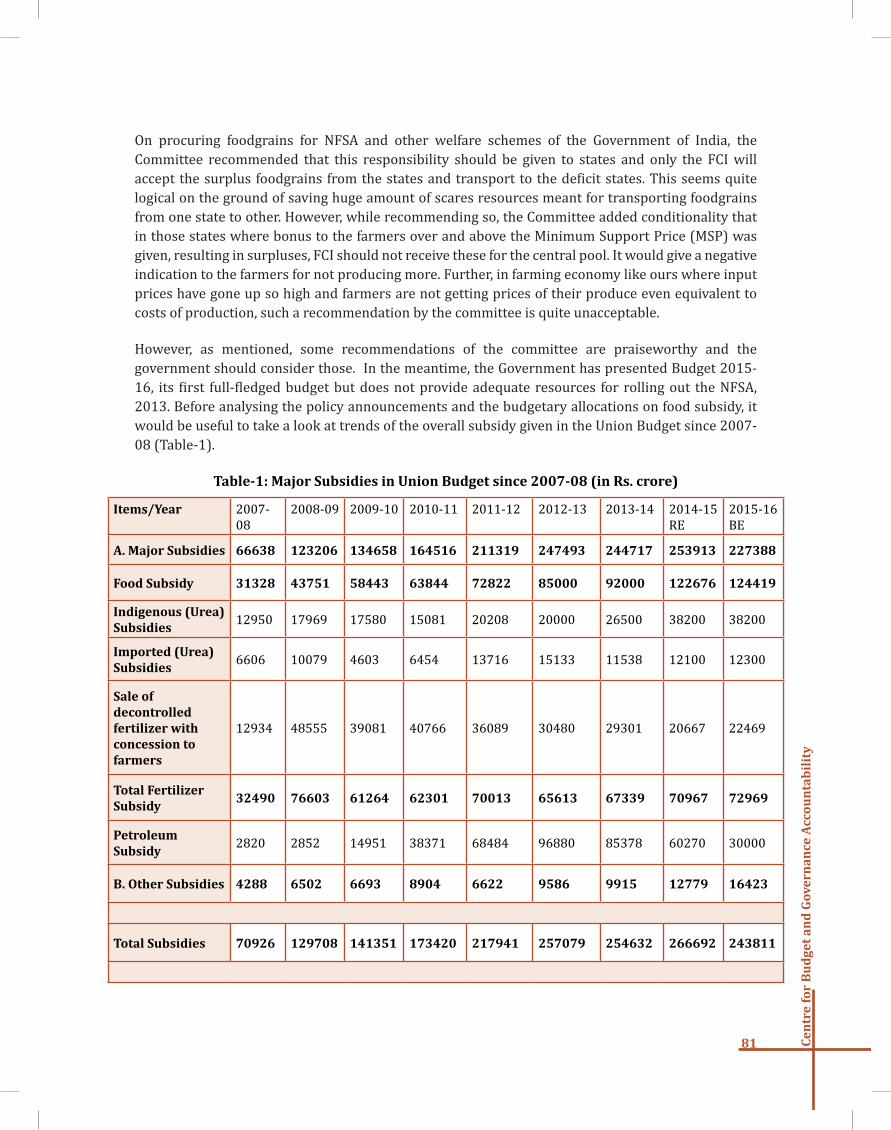
81 Cen
tre
for
Bu
dge
t an
d G
over
nan
ce A
ccou
nta
bil
ity
On procuring foodgrains for NFSA and other welfare schemes of the Government of India, the Committee recommended that this responsibility should be given to states and only the FCI will accept the surplus foodgrains from the states and transport to the deficit states. This seems quite logical on the ground of saving huge amount of scares resources meant for transporting foodgrains from one state to other. However, while recommending so, the Committee added conditionality that in those states where bonus to the farmers over and above the Minimum Support Price (MSP) was given, resulting in surpluses, FCI should not receive these for the central pool. It would give a negative indication to the farmers for not producing more. Further, in farming economy like ours where input prices have gone up so high and farmers are not getting prices of their produce even equivalent to costs of production, such a recommendation by the committee is quite unacceptable.
However, as mentioned, some recommendations of the committee are praiseworthy and the government should consider those. In the meantime, the Government has presented Budget 2015-16, its first full-fledged budget but does not provide adequate resources for rolling out the NFSA, 2013. Before analysing the policy announcements and the budgetary allocations on food subsidy, it would be useful to take a look at trends of the overall subsidy given in the Union Budget since 2007-08 (Table-1).
Table-1: Major Subsidies in Union Budget since 2007-08 (in Rs. crore)
Items/Year 2007-08
2008-09 2009-10 2010-11 2011-12 2012-13 2013-14 2014-15 RE
2015-16 BE
A. Major Subsidies 66638 123206 134658 164516 211319 247493 244717 253913 227388
Food Subsidy 31328 43751 58443 63844 72822 85000 92000 122676 124419
Indigenous (Urea) Subsidies
12950 17969 17580 15081 20208 20000 26500 38200 38200
Imported (Urea) Subsidies
6606 10079 4603 6454 13716 15133 11538 12100 12300
Sale of decontrolled fertilizer with concession to farmers
12934 48555 39081 40766 36089 30480 29301 20667 22469
Total Fertilizer Subsidy
32490 76603 61264 62301 70013 65613 67339 70967 72969
Petroleum Subsidy
2820 2852 14951 38371 68484 96880 85378 60270 30000
B. Other Subsidies 4288 6502 6693 8904 6622 9586 9915 12779 16423
Total Subsidies 70926 129708 141351 173420 217941 257079 254632 266692 243811

Cen
tre
for
Bu
dge
t an
d G
over
nan
ce A
ccou
nta
bil
ity
82
Total Subsidies as % of GDP
1.40 2.31 2.20 2.23 2.47 2.57 2.24 2.11 1.73
Total Subsidies as % of Total Union Government Expenditure
9.95 14.67 13.80 14.48 16.71 18.23 16.33 15.86 13.72
Source: Compiled by CBGA from Union Budget documents
Data presented above (Table 1) reveals that there has been a significant increase in the allocation for overall subsidy by the Union Government since 2007-08 in nominal terms. In fact, the total subsidy in the Union Budget for 2007-08 was Rs. 70,926 crore, which increased to Rs. 166,692 crore in 2014-15 (RE) and further reduced in 2015-16 (BE) to Rs. 243,811 crore. However, total subsidy as a share of GDP hovers around 1.4 percent to 2.6 percent during the said period. Total subsidy as percent of GDP noticed a continuous decline since 2012-13. The total subsidy as a share of the total Union Budget was 9.95 percent in 2007-08, which increased to 18.23 percent in 2012-13, and then started to decline thereafter continuously, to reach 13.72 percent in the current budget. The recent decline in the total subsidy kitty of the Union Budget pertains to petroleum subsidy.
Following the enactment of the National Food Security Bill (2013), the allocation under food subsidy in the Union Budget shows a nominal hike with a view to ensure food for all. Though there has been an increase in allocation under food subsidy in absolute terms in the current budget (i.e. Rs. 124,419 crore in 2015-16 (BE) against Rs. 92,000 crore in 2013-14), compared to budgets of the earlier years, food subsidy as a proportion of the GDP and the total Union Budget has been hovering around one percent and seven percent respectively. With the coming of the Act and following the promises made in the election manifesto, it was expected that the full-fledged budget of the NDA government at the Centre would accord high priority to the food subsidy budget in order to cover the requirements - however, no such signals are there in this budget.
Chart 1: Union Budget Allocation for Food Subsidy as % of GDP and Total Union Govt. Expenditure
0.62 0.78 0.91 0.82 0.82 0.85 0.81 0.97 0.88
4.40 4.95
5.70 5.33 5.58 6.03 5.90
7.30 7.00
012345678
2007-08 2008-09 2009-10 2010-11 2011-12 2012-13 2013-14 2014-15 RE 2015-16 BE
Food Subsidy as % of GDP Food Subsidy as % of Total Union Government Expenditure
Source: Compiled by CBGA from Union Budget documents.
It is also important to note that concerns relating to maternity entitlement, nutritious meals for the children, provisioning of community kitchens, additional provisioning for ensuring agriculture

83 Cen
tre
for
Bu
dge
t an
d G
over
nan
ce A
ccou
nta
bil
ity
production and measures to roll out NFSA have not been adequately spelt in this budget. Further, the need for strengthening of institutional mechanisms to ensure transparency in foodgrain management and distribution and efforts towards bringing convergence across and among schemes to fully achieve the objective of food and nutrition security of the country has not been given adequate priority in the current budget.
Given the nature of change in funding pattern and responsibility of implementing schemes like Integrated Child Development Services (ICDS), Mid-Day Meal (MDM), Indira Gandhi Matritva Sahyog Yojana (IGMSY) etc., it is too early to apprehend anything on how the country is moving in the direction of eradicating hunger and malnutrition. The Finance Minister did not consider it necessary to utter, even for once, government’s concern on food security in his budget speech.
If the government is serious for a comprehensive food and nutrition security for the country, additional provisioning of 5.25 kg of pulses and 2.28 kg of edible oil, per family per month, along with the cereals ( at least 10 kgs per person per month) distribution under NFSA, the budgetary allocations under food subsidy head should have been higher. Rather, it is clear from this Budget that the Union Government is more serious in giving sops to the corporates by slashing tax rate further.

Cen
tre
for
Bu
dge
t an
d G
over
nan
ce A
ccou
nta
bil
ity
84
Schemes related to Nutrition under the Changed Fiscal Arrangements of Resource Sharing between Union and States
Nutrition features in high priority list of the Union government. The nutrition intervention of the government in the National Nutrition Mission, to be piloted by the MWCD under specific schemes namely the IGMSY, ICDS, SABLA, and other related maternal and reproductive health schemes pertaining to nutritional health of mother and child and partly through MDM. Under the changed arrangements, all of these schemes feature under different umbrella programmes that are listed below. The sharing of resources for the schemes would be according to the category under which the umbrella programmes are classified. Most of these schemes have been meant to be either a sub-scheme in ICDS or implemented through the ICDS machinery. However the budgetary allocations to ICDS was reduced by 50 percent in 2015-16 BE, to Rs. 8,472 crore (BE) in the FY 2015-16, from Rs. 16,316 crore (RE) in FY 2014-15. In September, 2015, an additional allocation of Rs. 3600 crore to ICDS was added to make it Rs. 12,072 crore which is still lower than allocations made in 2014-15RE.
Name of schemes Umbrella Programme
Integrated Child Development Services (ICDS) Integrated Child Development Scheme and related programmes like maternity benefits, SABLA, KSY etc.
National Mission for Empowerment of Women including Indira Gandhi Matritva Sahyog Yojana (IGMSY)
Transferred to Central Sector and IGMSY made a sub-scheme of ICDS
Rajiv Gandhi Scheme for Empowerment of Adolescent Girls (SABLA)
To be implemented through ICDS machinery
National Programme Nutritional Support to Primary Education (MDM)
Mid Day Meal Programme
Source: REPORT OF THE SUBGROUP OF CHIEF MINISTERS ON RATIONALISATION OF THE CSS
The extent of malnutrition is high in India, especially among children below 5 years of age. As per the third National Family Health Survey (NFHS-3), following the World Health Organisation (WHO) standards for child growth, almost 43 percent children below 5 years were under-weight for their age and almost half the children were short or stunted for their age (48 percent). The extent of undernourishment among the marginalised sections was much higher.
The last decade (2005-06 to 2014-15) has seen improved allocations by the Union Government for two major nutrition-specific schemes, viz., Integrated Child Development Scheme (ICDS) and Mid-Day Meal (MDM) (Chart 1). There was a five-fold increase in expenditure on ICDS and a four-fold increase in MDM budget. Along with these, a scheme for improving the nutritional intake of girl child (RGSEAG-SABLA) was also introduced. However, the overall allocations for nutrition-specific schemes remained less than 2 percent of the total expenditure of the Union Budget.
The present budget has accepted the recommendations of the Fourteenth Finance Commission to increase the fiscal autonomy of the States and improve fiscal federalism by giving them increased share
NUTRITIONAL COMMITMENTS IN 2015-1619
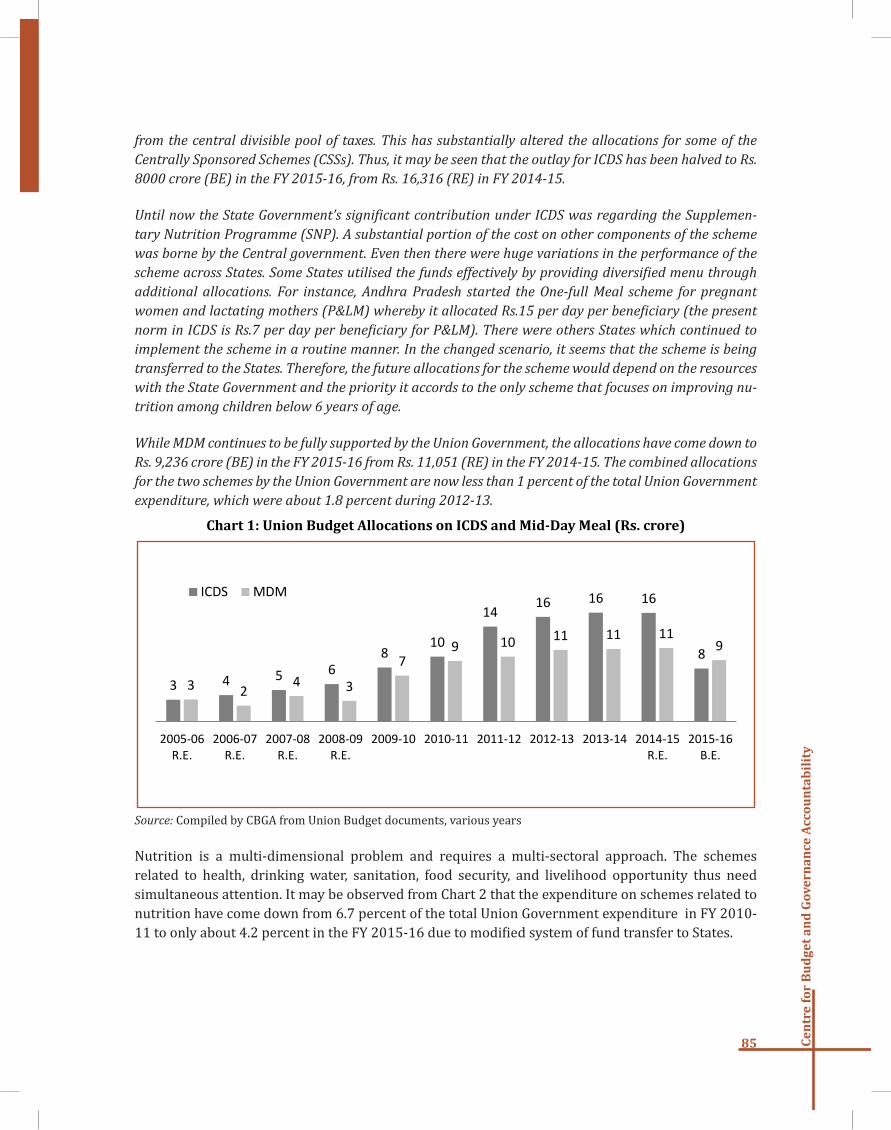
85 Cen
tre
for
Bu
dge
t an
d G
over
nan
ce A
ccou
nta
bil
ity
from the central divisible pool of taxes. This has substantially altered the allocations for some of the Centrally Sponsored Schemes (CSSs). Thus, it may be seen that the outlay for ICDS has been halved to Rs. 8000 crore (BE) in the FY 2015-16, from Rs. 16,316 (RE) in FY 2014-15.
Until now the State Government’s significant contribution under ICDS was regarding the Supplemen-tary Nutrition Programme (SNP). A substantial portion of the cost on other components of the scheme was borne by the Central government. Even then there were huge variations in the performance of the scheme across States. Some States utilised the funds effectively by providing diversified menu through additional allocations. For instance, Andhra Pradesh started the One-full Meal scheme for pregnant women and lactating mothers (P&LM) whereby it allocated Rs.15 per day per beneficiary (the present norm in ICDS is Rs.7 per day per beneficiary for P&LM). There were others States which continued to implement the scheme in a routine manner. In the changed scenario, it seems that the scheme is being transferred to the States. Therefore, the future allocations for the scheme would depend on the resources with the State Government and the priority it accords to the only scheme that focuses on improving nu-trition among children below 6 years of age.
While MDM continues to be fully supported by the Union Government, the allocations have come down to Rs. 9,236 crore (BE) in the FY 2015-16 from Rs. 11,051 (RE) in the FY 2014-15. The combined allocations for the two schemes by the Union Government are now less than 1 percent of the total Union Government expenditure, which were about 1.8 percent during 2012-13.
Chart 1: Union Budget Allocations on ICDS and Mid-Day Meal (Rs. crore)
3 4 5 6 8
10
14 16 16 16
8
3 2 4 3
7 9 10 11 11 11
9
2005-06R.E.
2006-07R.E.
2007-08R.E.
2008-09R.E.
2009-10 2010-11 2011-12 2012-13 2013-14 2014-15R.E.
2015-16B.E.
ICDS MDM
Source: Compiled by CBGA from Union Budget documents, various years
Nutrition is a multi-dimensional problem and requires a multi-sectoral approach. The schemes related to health, drinking water, sanitation, food security, and livelihood opportunity thus need simultaneous attention. It may be observed from Chart 2 that the expenditure on schemes related to nutrition have come down from 6.7 percent of the total Union Government expenditure in FY 2010-11 to only about 4.2 percent in the FY 2015-16 due to modified system of fund transfer to States.

Cen
tre
for
Bu
dge
t an
d G
over
nan
ce A
ccou
nta
bil
ity
86
Chart 2: Expenditure on Schemes related to Nutrition as share of Total Expenditure of Union Government
6.7 6.1
6.2
5.6 5.3
4.2
2010-11 2011-12 2012-13 2013-14 R.E. 2014-15 R.E. 2015-16 B.E.
Note: Nutrition related schemes referred here include both nutrition-specific schemes (ICDS and MDM) and nutrition-sensitive schemes (National Health Mission, NRDWP, Swaccha Bharat Abhiyaan, and MGNREGA). The total allocations for these schemes have been taken for calculating the percentage.Source: Compiled by CBGA from Union Budget documents, various years
Moreover, as per the Economic Survey 2014-15, the per capita net availability of food was uneven during the previous decade. It peaked to 494 gram per capita per day in 2002 and came down to 422 gram per capita per day in 2005. To improve production of some of the important foodgrains National Food Security Mission was launched in 2007. The allocations for the scheme have again been reduced from Rs. 1830 crore in FY 2014-15 to Rs. 1300 crore.
Global Hunger Index describes the situation in India as ‘alarming’. At present the progress in achieving MDG targets related to nutrition are either moderate or slow, except for access to safe drinking water (Table 1). The budget talks about building India as a Global Manufacturing Hub with ‘Make in India’ campaign. It aims to create job opportunities for millions of youth. In this context, by the government should give priority to early childhood care as it is during this period that the maximum physical and brain development occurs, which in turn leads to improved health, education and productivity.
Table 1: MDG Targets for 2015: Progress and Achievements
MDG Target Target for 2015 Progress Achievement
Proportion of under-weight children below 3 years (%)
26 Slow or almost off-track
40 in 2005-06
Under- Five Morality Rate (per 1000 live births)
42 Moderately on-track
55 in 2011
IMR (per 1000 live births) 27 42 in 2012Maternal Mortality Ratio (per 1,00,000 live births)
109 Slow or off-track 212 in 2007-09
Sustainable access to safe drinking water (%)
Reduce to 17% proportion of households without access to safe drinking water
On-track target attained in 2007-08

87 Cen
tre
for
Bu
dge
t an
d G
over
nan
ce A
ccou
nta
bil
ity
Sustainable access to basic sanitation (%)
Reduce to 38% proportion of households without access to improved sanitation
slow 49.2% in 2008
Source: Government of India, Towards Achieving Millennium Development Goals India 2013. http://mospi.nic.in/mospi_new/upload/MDG_pamphlet29oct2013.pdf
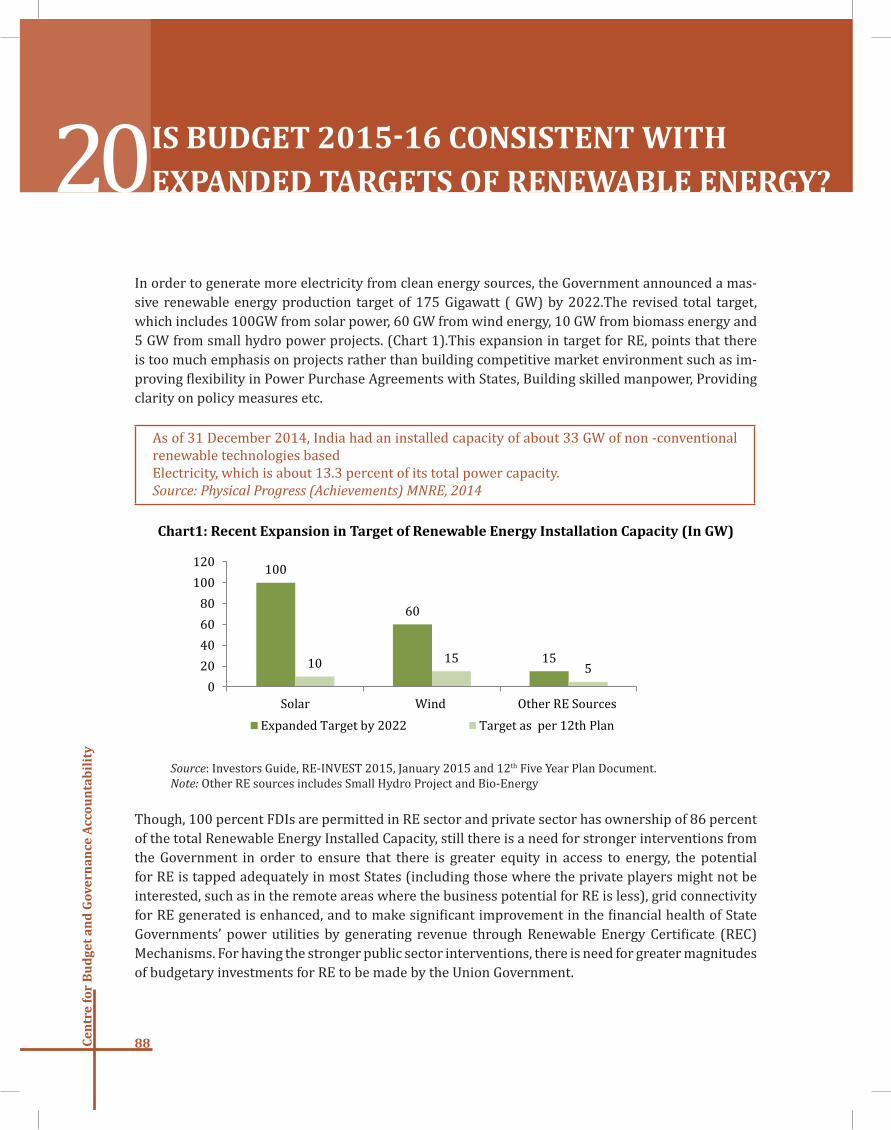
Cen
tre
for
Bu
dge
t an
d G
over
nan
ce A
ccou
nta
bil
ity
88
In order to generate more electricity from clean energy sources, the Government announced a mas-sive renewable energy production target of 175 Gigawatt ( GW) by 2022.The revised total target, which includes 100GW from solar power, 60 GW from wind energy, 10 GW from biomass energy and 5 GW from small hydro power projects. (Chart 1).This expansion in target for RE, points that there is too much emphasis on projects rather than building competitive market environment such as im-proving flexibility in Power Purchase Agreements with States, Building skilled manpower, Providing clarity on policy measures etc.
As of 31 December 2014, India had an installed capacity of about 33 GW of non -conventional renewable technologies basedElectricity, which is about 13.3 percent of its total power capacity.Source: Physical Progress (Achievements) MNRE, 2014
Chart1: Recent Expansion in Target of Renewable Energy Installation Capacity (In GW)
100
60
15 10 15 5
020406080
100120
Solar Wind Other RE SourcesExpanded Target by 2022 Target as per 12th Plan
Source: Investors Guide, RE-INVEST 2015, January 2015 and 12th Five Year Plan Document.Note: Other RE sources includes Small Hydro Project and Bio-Energy
Though, 100 percent FDIs are permitted in RE sector and private sector has ownership of 86 percent of the total Renewable Energy Installed Capacity, still there is a need for stronger interventions from the Government in order to ensure that there is greater equity in access to energy, the potential for RE is tapped adequately in most States (including those where the private players might not be interested, such as in the remote areas where the business potential for RE is less), grid connectivity for RE generated is enhanced, and to make significant improvement in the financial health of State Governments’ power utilities by generating revenue through Renewable Energy Certificate (REC) Mechanisms. For having the stronger public sector interventions, there is need for greater magnitudes of budgetary investments for RE to be made by the Union Government.
IS BUDGET 2015-16 CONSISTENT WITH EXPANDED TARGETS OF RENEWABLE ENERGY?20
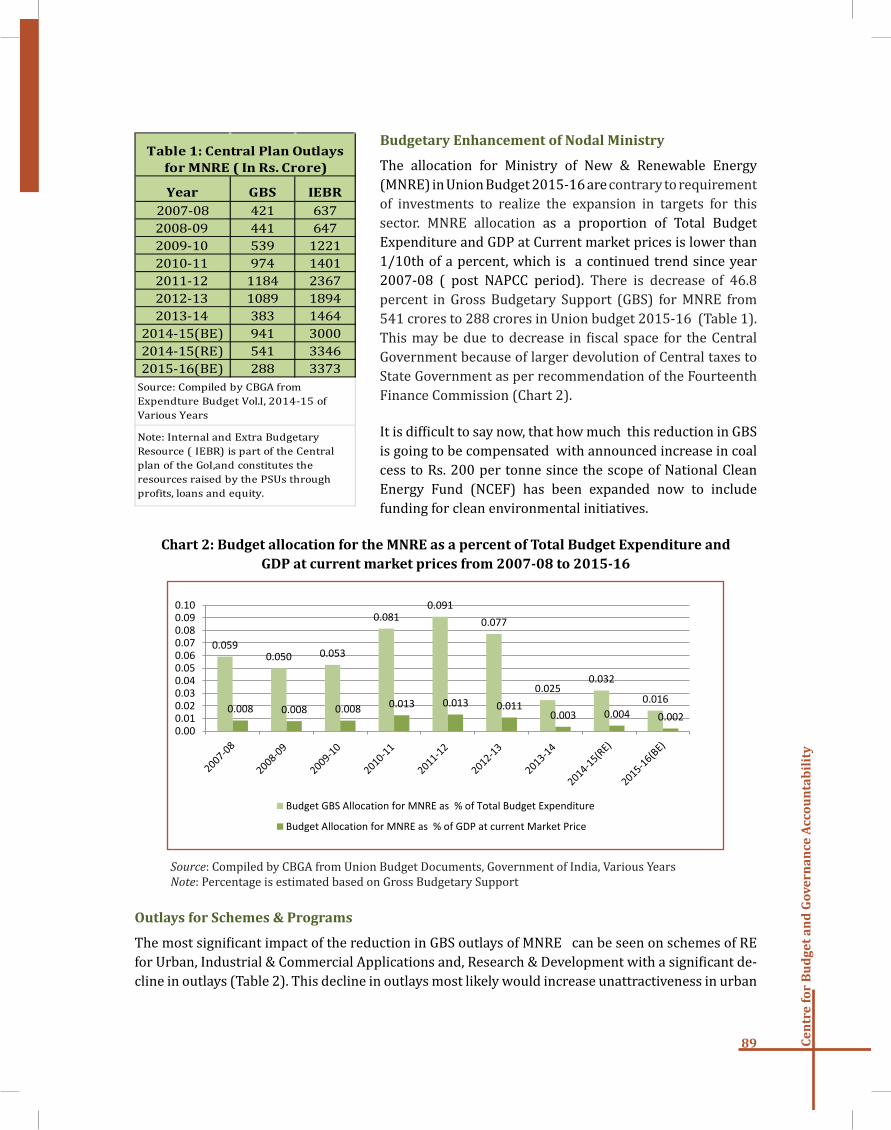
89 Cen
tre
for
Bu
dge
t an
d G
over
nan
ce A
ccou
nta
bil
ity
Budgetary Enhancement of Nodal Ministry
Year GBS IEBR 2007-08 421 6372008-09 441 6472009-10 539 12212010-11 974 14012011-12 1184 23672012-13 1089 18942013-14 383 1464
2014-15(BE) 941 30002014-15(RE) 541 33462015-16(BE) 288 3373
Note: Internal and Extra Budgetary Resource ( IEBR) is part of the Central plan of the GoI,and constitutes the resources raised by the PSUs through profits, loans and equity.
Source: Compiled by CBGA from Expendture Budget Vol.I, 2014-15 of Various Years
Table 1: Central Plan Outlays for MNRE ( In Rs. Crore) The allocation for Ministry of New & Renewable Energy
(MNRE) in Union Budget 2015-16 are contrary to requirement of investments to realize the expansion in targets for this sector. MNRE allocation as a proportion of Total Budget Expenditure and GDP at Current market prices is lower than 1/10th of a percent, which is a continued trend since year 2007-08 ( post NAPCC period). There is decrease of 46.8 percent in Gross Budgetary Support (GBS) for MNRE from 541 crores to 288 crores in Union budget 2015-16 (Table 1). This may be due to decrease in fiscal space for the Central Government because of larger devolution of Central taxes to State Government as per recommendation of the Fourteenth Finance Commission (Chart 2).
It is difficult to say now, that how much this reduction in GBS is going to be compensated with announced increase in coal cess to Rs. 200 per tonne since the scope of National Clean Energy Fund (NCEF) has been expanded now to include funding for clean environmental initiatives.
Chart 2: Budget allocation for the MNRE as a percent of Total Budget Expenditure and GDP at current market prices from 2007-08 to 2015-16
0.059 0.050 0.053
0.081 0.091
0.077
0.025 0.032
0.016 0.008 0.008 0.008 0.013 0.013 0.011
0.003 0.004 0.002 0.000.010.020.030.040.050.060.070.080.090.10
Budget GBS Allocation for MNRE as % of Total Budget Expenditure
Budget Allocation for MNRE as % of GDP at current Market Price
Source: Compiled by CBGA from Union Budget Documents, Government of India, Various YearsNote: Percentage is estimated based on Gross Budgetary Support
Outlays for Schemes & Programs
The most significant impact of the reduction in GBS outlays of MNRE can be seen on schemes of RE for Urban, Industrial & Commercial Applications and, Research & Development with a significant de-cline in outlays (Table 2). This decline in outlays most likely would increase unattractiveness in urban
IS BUDGET 2015-16 CONSISTENT WITH EXPANDED TARGETS OF RENEWABLE ENERGY?

Cen
tre
for
Bu
dge
t an
d G
over
nan
ce A
ccou
nta
bil
ity
90
consumers for installing RE technologies such as spending on well implementation of net metering program may be dampened. Budget 2015-16 missed the opportunity to introduce a policy measures for implementing net-metering in urban population.
For connecting the rural population without electricity, this Budget announced electrification of the remaining 20,000 villages in the country, by 2020, including off-grid solar power generation. This is a continuity of earlier targets envisaged in erstwhile Rajiv Gandhi Grameen Vidyutikaran Yojana (RGGVY) which is now subsumed under newly launched scheme Deendayal Upadhyaya Gram Jyoti Yojana (DDUGJY). Moreover, off-grid RE applications are still being seen as a sub-optimal choice by villagers who still prefer grid-connected power supply. Government need to revisit DDUGJY scheme with inclusion of micro-grid installation since it also work on overcoming switching costs before full-scale grid connections are attempted along with providing energy access.
Union budget announced a new initiative for training of 50,000 Surya Mitras (under Grid Interactive and Distributed Power scheme) with an outlay of 10 crore, which is indeed a welcome step. This scheme should be continued in future to pace with the huge target of RE.
Table 2: Budget Allocations for Various Schemes of MNRE (Rs. crore)
Key Programs/ Schemes2014-15
( RE)2015-16
( BE )
Percentage Increase /
decrease in Outlays
Grid Interactive and Distributed Renewable Power 1800.0 2410.0 34
RE for Rural Applications 132.5 131.0 -1RE for Urban, Industrial and Commercial Applications 14.0 4.6 -67
Research, Design & Development in RE 128.0 90.0 -30
Supporting Programme 61.5 19.1 -69
Source: Compiled by CBGA from Expenditure Budget Vol II for MNRE Note: Above figures include NCEF amount
Efforts for Creating Transmission Network
Besides expanding renewable energy capacities across the country through above schemes and programs, there is need to commensurate evacuation of RE generated to the regional and national grids and from renewable generating states to renewable deficient states. It takes at least three years to build a new transmission line, but less than a year to build a large solar or wind park. Therefore, to avoid bottlenecks, the transmission infrastructure needs to be ramped up now. Though, India is depending on foreign loans for extending transmission infrastructure, there is concern that RE evacuation will be difficult for projects with no clearly identified beneficiaries or bulk power transmission agreements as that made it hard for State Transmission Utilities to plan for and invest in augmenting associated transmission systems. The Union Budget 2015 -16 failed in prioritizing burgeoning investments requirement for the transmission infrastructure for RE. There is no significant

91 Cen
tre
for
Bu
dge
t an
d G
over
nan
ce A
ccou
nta
bil
ity
revision in outlays for Power Sector Reforms (Transmission & Distribution), Central Transmission Utility (PGCIL) or for the various schemes of Ministry of Power for this purpose such as Green Energy Corridors and Smart grid (Table 3).
Table 3: Budget allocations for various Schemes supporting Transmission network for Renewable Energy (Rs. Crore)
Schemes 2014-15 ( RE) 2015-16( BE)
Power Sector Reforms( T & D )* 1841.1 1463.0
Investment in PGCIL 20000.0 20000.0
Green Energy Corridor 1.0 1.0Smart Grid 1.0 40.0
Source: Compiled by CBGA from Expenditure Budget Vol. II for Ministry of PowerNote: * Figures includes Total Outlays for Power Sector Reform on Transmission & Distribution
Incentives for Manufacturing EquipmentBesides the need for considering aspects of developing capacity and transmission network, there is also a need for strengthening the domestic manufacturing of equipment for RE technologies. The Union Budget 2015-16 reduced custom and excise duty on Solar water heater system from 12% to Nil and other exemptions on various metal parts equipment.
Recent Announcements and Supplementary demand for grants following the Union Budget 2015-16.
There has been an additional supplementary Grants-in-aid of Rs. 503 crore for Ministry of New and Renewable Energy (MNRE). The amount for this grant is met from National Clean Energy Fund.
Supplementary grant is for meeting the expenditure under the of the Schemes of MNRE such as; (1) Grid Interactive and distributed Renewable Power(i) for Solar Power with Rs. 250 crore (ii) for Green Energy Corridors with Rs.100 crore
(2) Off-Grid/Distributed and Decentralised Renewable power for Solar Power with Rs. 150 crore (3) Construction of office building in New Delhi and Institute at Bhubaneshwar with Rs.3 crore.
With supplementary grant , overall allocation for MNRE would be now comparable with allocation made in Union budget 2014-15, however not adequate for meeting expanded targets of Renewable Energy.
Central Government is fully supporting all the schemes under Ministry of New and Renewable Energy. There is no transfer of schemes to the State Governments

Cen
tre
for
Bu
dge
t an
d G
over
nan
ce A
ccou
nta
bil
ity
92
Major Announcements
New Law on Black Money abroad criminalising tax evasion in relation to foreign assets with imprisonment upto 10 years and penalty of 300% among other features
Concealment of income/evasion of income in relation to a foreign asset to be made a ‘predicate’ offence under Prevention of Money Laundering Act, 2002
Benami Transactions (Prohibition) Bill to be introduced to curb domestic black money
Greater Focus Required on Curbing Generation of Black Money in IndiaFocus on offshore black money welcome; will yield little result without addressing its source
The increased focus on money held in offshore bank accounts by Indians, especially by SIT on Black Money constituted by the Supreme Court, is reflected in this Budget as well. This is certainly welcome as this forms an important aspect of deterring outflow of money from India. But there still remains a large gap in terms of a comprehensive policy, mapping sectors generating black money in India and the corresponding reforms required. The intent in the budget to curb generation of black money in real estate is a step in the right direction, though inadequate.
In this context, publishing the three reports on black money commissioned by Government of India in 2012 would provide greater clarity on these issues. It would also contribute to a more informed public debate on sources of black money generation and how this could be addressed.
Staff Shortage Remains UnaddressedStaff shortage across various agencies such as CBDT, ED, FIU, CBEC etc. has been estimated to be 30,000 (CBDT 2012). A report by Asian Development Bank (ADB 2014), which analysed tax administration in Asia and the Pacific, noted that India has one of the most under-resourced and understaffed revenue bodies, in proportion to the size of the population. Recent news reports noted that facing staff shortage, Enforcement Directorate could take 6 years to probe black money cases. Implementation of existing or new legislations in relation to black money requires that the administrative machinery is significantly strengthened. The opportunity has been missed in this budget.
Revenue Loss due to Double Taxation Avoidance Agreements (DTAAs) Comprehensive review of tax treaties needed
Against the backdrop of concerns of round tripping and revenue losses due to misuse of tax treaties, a comprehensive review of all Double Taxation Avoidance Agreements (DTAAs) is required. Currently, no data is available detailing transactions that avail of treaty benefits to analyse the costs and benefits of signing these treaties.
BLACK MONEY: BEYOND OFFSHORE ACCOUNTS21

BLACK MONEY: BEYOND OFFSHORE ACCOUNTS
Research on FDI inflows into India by KS Chalapati Rao and BiswajitDhar (2011) noted that almost 70% of inflows were through tax havens and at best half the total inflows could be considered as genuine FDI.
In 2013, a similar review by Mongolia resulted in cancellation of tax treaties with Netherlands, Luxembourg and UAE due to abuse of such treaties. Indonesia unilaterally cancelled its tax treaty with Mauritius in 2004 due to concerns of ‘round tripping’. Efforts to curb black money will not be effective unless all loopholes related to illicit money flows, aided by tax treaties, are identified and addressed.
Gaps in Addressing Offshore Secrecy and Tax Evasion Opportunity for India to Lead
The drive to address offshore tax evasion still has many gaps that need to be addressed. Corruption, crime, and tax evasion are facilitated by people’s ability to hide their identity through secretive shell companies and other legal structures. Money launderers and corrupt individuals are known to operate through these complex anonymous shell companies, which are generally linked to tax havens.
Recent scams in India such as Satyam, 2G, Coalgate, CWG, IPL and various Ponzi schemes had clear links to tax havens such as Mauritius, Cayman Islands, Singapore, etc. This coupled with ineffective information exchange standards between jurisdictions enables not just tax dodging but money laundering as well. While the G20 leaders’ commitment to address these issues is welcome, India has the opportunity to take the lead among emerging economies by translating this to national commitments.
• Ministry of Corporate Affairs & Ministry of Finance in consultation with SEBI/RBI should put in place central public registers of beneficial owners of companies and other legal entities, with adequate safeguards (such as trusts, foundations etc.)
• India’s leadership on improving information exchange standards globally is noteworthy. While the G20 has adopted Automatic Exchange of Information as the global standard, there are concerns that jurisdictions would be allowed to choose with whom they want to engage in automatic information exchange, rather than being truly multilateral. This could leave developing countries at a disadvantage with more powerful countries refusing to share information. Additionally, non-reciprocity of information sharing should be explored in favour of LICs unable to send information at present.
• If companies were required to report sales, profits, and taxes paid in all jurisdictions in their audited annual reports, it would make it difficult to hide money off shore. Though the G20 has committed to country-by-country reporting, specifically through Action 13 of the G20/OECD Base Erosion and Profit Shifting, India should commit to making this public. Making this information public would enable tax administrations in the poorest countries to easily access this vital information to address BEPS in their contexts.

Cen
tre
for
Bu
dge
t an
d G
over
nan
ce A
ccou
nta
bil
ity
94
TRANSPARENCY AND ACCOUNTABILITY IN THE CONTEXT OF THE NEW FISCAL REGIME1
1 Contributed by Ravi Duggal. The author can be reached at: [email protected]
There were great expectations from the 14th Finance Commission (FC) to transform the fiscal ecology of the country given that a new government had been elected and it was talking of transforming governance under the slogan of “Minimum Government Maximum Governance” and strengthening transparency and accountability. Further the implementation of the 14th FC coincides with the 2015-16 Budget which is the first full budget of the new regime in power at the Centre. The Finance Minister in his budget speech said that this budget will make India fly, with acceleration of economic growth to 7.4 percent the fastest in the World, and set in process an unprecedented transformation of India’s economic and social development.
The big news emanating from the 14th FC is the 10 percent point increase from 32 percent to 42 percent share of states in the divisible pool of taxes. There is euphoria all around that states will get a much larger share from the tax kitty. What does this really mean? Yes the states are getting a much larger share of taxes as unconditional transfers, to be precise 31.3 percent more as a share compared to the 13th FC period, which means that they have more funds to plan their development strategies autonomous of the Centre, meaning delinked from Centre’s planned programs and schemes. So the positive aspect is that the fiscal space of the states to do their own thing has expanded substantially.
But has the total fiscal envelope of the states really expanded as much? The answer is no. While the proportion of unconditional transfers have increased substantially the total transfers have not increased as much – just about 2 or 3 percent points. The “magic” that has happened is that with the “shut-down” of the Planning Commission a large part of the funds that the Centre transferred through various plan schemes have now been assigned directly to the states. Thus we see that there is a huge jump of 37 percent from the previous year in tax transfer (unconditional revenues) to states in 2015-16 budget in accordance with the 14th FC mandate but on the other hand for grants and loans from Centre to states we see a huge decline of 19 percent for the same period, mostly in the financing related to Central Assistance for State plans. In 2014-15 the total transfer of resources from the Centre to states was 51 percent and this has increased to 53 percent in 2015-16, a gain of mere two percent in the overall fiscal envelope which amounts to just 0.58 percent of GDP. Infact the 2014-15 budget had already begun that process of shifting many of the plan schemes into the state pool. In contrast the fiscal space of the Centre has shrunk consequently and this would impact budgets of a number of its line departments, especially social sector and anti-poverty programs. The big challenge emerging from this is would the states use their larger fiscal space to fill the gap that would be created with compression in the allocations of Centre’s line departments?
So given this reality the euphoria is unwarranted. The states have serious thinking and strategizing to do if they have to take advantage of this new opportunity and trajectory. At one level they have a larger fiscal space but at another level their challenge is to use this additional fiscal space effectively
22

95 Cen
tre
for
Bu
dge
t an
d G
over
nan
ce A
ccou
nta
bil
ity
TRANSPARENCY AND ACCOUNTABILITY IN THE CONTEXT OF THE NEW FISCAL REGIME1
1 Contributed by Ravi Duggal. The author can be reached at: [email protected]
to fill the gaps and deficits in development and service delivery in their states. Thus defining appropriate priorities as per the needs and demands of their citizens becomes critical to achieving their development goals. This also opens up the space for civil society groups to engage with the states in determining these priorities.
At the level of the Centre their fiscal space may appear to be reduced but with the Planning Commission fading out they have simply slashed a whole lot of plan schemes which the Centre used to give as grants to the states from its own resources as assistance for state plans. But as mentioned above the loss in the Centre’s total fiscal envelope is only 0.58 percent of GDP but against this small deficit the burden on the states in terms of responsibility to continue and strengthen various ongoing programs that the Centre has now seconded to the states is perhaps much larger.
Further the 14th FC has also done away with sector specific grants that earlier FCs had included arguing that such priorities are best decided by the states and often such specific grants were an imposition from above and many states did not like it. Hence this became the logic for raising the unconditional ratio from the divisible tax pool so that stats had a greater autonomy or freedom to plan as per its own needs and priorities. The 14th FC in the light of this recommendation has suggested a new institutional mechanism through which the Centre can engage with states in a transparent manner to facilitate additional resource transfers from the Centre’s fiscal envelope now that the Planning Commission has ceased to exist.
The 14th FC has also continued with making provisions for local governments, both panchayat and municipal bodies. It is at this local level where transparency and accountability is the weakest and hence the grant has been bifurcated into two parts, one as their dedicated share for basic services (90 percent for panchayats and 80 percent for municipalities) and the other part (10 and 20 percent respectively) based on performance wherein two critical transparency indicators have been indicated – timely publication of accounts and publishing service delivery benchmarks and also efforts at raising their own revenues (see box below). Further the state is being held to account to disburse grants to the local bodies within 15 days of receiving the grant from the Centre and the latter has also been mandated to release the grant in two instalments, one in June and the other in October.
“We are of the opinion that proper accounts are the starting point for financial accountability. Non-maintenance or delayed compilation of annual accounts means compromised accountability. It also implies that reliable financial data for determining the need for resources for local bodies is not available. We observe that it has been more than twenty years that municipalities and panchayats were sought to be empowered, through a Constitutional amendment, to act as institutions of local self-governance and also to provide certain basic services to citizens. It is inconceivable, and certainly not desirable, that local bodies seek an ever increasing share of public moneys and yet continue to keep themselves beyond the ambit of accountability and responsibility for the public money placed with them.” – 14th Finance Commission
The above again is a great opportunity for civil society groups, who work mostly at the local level to use this FC recommendation to strengthen access to budget information at the local level as well as use this information to make service delivery accountable to citizens.

Cen
tre
for
Bu
dge
t an
d G
over
nan
ce A
ccou
nta
bil
ity
96
Finally the 14th FC has also recognised that a substantial increase is needed in the tax-GDP ratio but it has been able to project an increase of only about two percent additional (0.67 at the Centre level) by the end of the 14th FC period. This would continue to remain a major constraint for increasing the share of social sectors in the budget and hence would require concerted efforts by civil society groups to engage the Finance Ministry on taxation and tax expenditure issues wherein with elimination of upto two-thirds of tax expenditures and stronger tax compliance nearly five percent of the GDP can be reined in taking the tax-GDP ratio at the national level to 21 percent from the present 17 percent. However the 2015-16 budget has taken a regressive step on taxes by reducing corporate tax rates from the present 30 percent to 25 percent, a decline of nearly 17 percent. This along with the two percent increase in service tax rates and removal of the wealth tax has pushed back the little progressive growth we had seen in taxation policy in the last few years. And ironically the budget estimates for tax revenues of the Centre in absolute numbers show a decline of Rs. 57000 crores from the previous year or 0.4 percent of GDP. This is some kind of history that this year’s budget has achieved.
97 Cen
tre
for
Bu
dge
t an
d G
over
nan
ce A
ccou
nta
bil
ity
23The 2015-16 Budget Speech of the Union Finance Minister has followed the trend of making elaborate references to developments pertaining to banking sector, monetary policy and other measures that are not strictly under the purview of fiscal policy. This section outlines some such policy measures that the Union Finance Minister has discussed in his Speech.
A. Taming Inflation- The Union Government has proposed an amendment to the RBI Act to set up a Monetary Policy Committee, which would help regulate price inflation in the country. The government has also proposed setting up of a Unified National Agricultural Market to moderate prices of the agro based products with the cooperation of States.
B. Financial Inclusion- Provisioning of banking services and extending easy credits fall under the domain of financial institutions. A fiscal policy intervention is needed when these institutions fail to achieve adequate success in such activities. In the latest budget, the government has referred to a number of steps to provide easy banking services to the people. There is an allocation of Rs. 25,000 crore for Rural Infrastructure Development Fund (RIDF) set up in NABARD. Besides this, additional efforts in the direction of rural credits expansion, a Long Term Rural Credit Fund for Rs. 15,000 crore, short term Co-operative Rural Credit Reliance Fund of worth Rs. 45,000 crore and a short term RRB Refinance Fund Rs. 15,000 Crore have been set up. The Government has set up an ambitious target of Rs. 8.5 lakh crore of credit for the banks during 2015-16.
The Government has proposed to set up a MUDRA (Micro Units Development Refinance Agency) Bank with a corpus fund of Rs. 20,000 crore and credit guarantee corpus of Rs. 3,000 crore. The aim is to refinance the Micro Finance Institutions (MFIs). It has also engaged the Departments of Posts in the Pradhan Mantri Jan Dhan Yojana to extend banking services to remote areas.
C. Regulation of Financial Market- The government has proposed to set up a Public Debt Management Agency (PDMA) in order to bring both India’s external borrowings and domestic debt under one roof. This is a move towards increasing the ‘ease of doing business’ in the country. It has also proposed merger of the Forward Markets Commission (FMCs) with SEBI to strengthen the regulation of commodity forward markets in an attempt to reduce wild speculations. The government has proposed a number of legislations in the Government Securities Act and RBI Act to regulate the speculative market.
It has proposed to set up a Task Force to establish a sector neutral Financial Redressal Agency that would address grievances against all financial service providers. It is also likely to introduce the Indian Financial Code in this direction. To provide support to the sick industries, the government has proposed to bring a comprehensive Bankruptcy code in fiscal 2015-16. For the regulation of Non-Banking Finance Institutions (NBFIs), the SARFAESI Act, 2002 is likely to be enforced, as mentioned in the Budget Speech of the Finance Minister.
POLICY MEASURES RELATED TO BANKING AND FINANCE HIGHLIGHTED IN THE BUDGET SPEECH

In order to improve the governance of public sector banks, the government intends to set up an Autonomous Bank Board Bureau. It is an effort to develop differentiated strategies and capital raising plans through innovative financial methods and instruments. The government intends to reduce the cash transactions in the market in a move towards curbing black money; it has promoted the use of Rupay debit cards in this regard.
D. Optimal Use of Gold Stock in the Country- The country has accumulated a gold stock of over 20,000 tonnes, which are lying non-traded in various banks and financial institutions. The government has proposed to enter the market to capitalize this placid gold stock. In this effort, the government has introduced a Gold Monetisation scheme in place of both Gold Deposit and Gold metal loan schemes. This scheme will allow the depositors of gold to earn interest in their metal accounts and the jewellers to obtain loan in their metal account. The government has proposed to introduce a Sovereign Gold Bond that can be purchased in place of metal gold. The bond will carry fixed rate of interest and can be redeemable in cash in terms of the face value of the gold. Circulation of Indian Gold Coin is another step forward to reduce the heavy pressure of gold deposits in the banks and financial institutions.

99 Cen
tre
for
Bu
dge
t an
d G
over
nan
ce A
ccou
nta
bil
ity