OF 3, THOUGHTS FROM THE GOLF INDUSTRY SHOW · sellers are now serving as middlemen and ... has...
7
MAY 22,2013 PART2 OF 3, THOUGHTS FROM THE GOLF INDUSTRY SHOW ' Darius Hatami, MAl Managing Director HVS Golf Se rvices
Transcript of OF 3, THOUGHTS FROM THE GOLF INDUSTRY SHOW · sellers are now serving as middlemen and ... has...

MAY 22,2013
PART2 OF 3,
THOUGHTS FROM THE GOLF INDUSTRY SHOW
' Darius Hatami, MAl Managing Director HVS Golf Services

Thoughts from the Golf Industry Show
The following is the second in a three-part series that examines the state of the golf industry todav. The
first article explored the historv and examined the issues challenging the golf ii1dustry. T/1is second arl'icle
explores the impacts to Golf Facility Financials and Value, while the third article will look to the future of
tl1e industry and the issues that will shape its health moving forward.
Credit must be given to the large number of industry professionals at the Golf Industry Show w/10 were
speakers r::md whose thovghts, ideas and concerns I am Jiberallv using. These il1sights are a direct result
of their expertise and experience, and I would like to thank them for their input.
Golf Facility Financials and Value
Overbuilding·- The sole cause of financial distress?
As was noted in the Part 1 of this series, overbuilding in the industry contributed to its latest cycle. While the supply of golf courses was increasing, the growth of golfers to play on these courses was lagging. The declining golfer to course ratio has resulted in a loss of demand and presented a buyer's market for golfers. The extent of the decline in golfers per course means that the market share of each golf course has been diluted to the point where a large number of goiffacilities are now financially distressed. This intense competition has created a predatory\environment, and along with the growth of third-party tee time sellersi has created a market in which the third-party sellers and the customer have more power than the golf course.
It is our perspective at HVS that the overdevelopment of golf courses during the current cycle did come economic factors lying outside of the golf industry. These factors include developers using the golf course to sell real •estate, government agencies using golf as a tool for economic development, and resorts using the golf course to sell rooms. However, the financial problems of many of the golf courses were also due to the fact that golf course developers in all sectors did not devote sufficient resources to understanding the long-term financial implications of golf course ownership.
Many developers failed to have a plan or exit strategy for the golf facilities after the real estate sales process was completed. While many developers recognized the fact that the golfcourse or club was a loss leader for real estate sales, many had disregard for the economics of supply artd demand for golf courses within their local markets and within their projects, and ignored the potential financial implications of this imbalance. This lack of attention often resulted in the inability to execute an exit strategy for the golf facility o club asset when the development was completed. This same ovex;sight also led to:
1. The construction of more golf holes than could be supported by the market and by an Individual development;
2. The construction of outlandish clubhouses that could not be supported by the membership or users; 3. Course designs tl1at were targeted to core golfers and were consequently longer and more difficult to play
for a large segment of the market; 4. Course designs that cost more than necessary to maintain and operate; and 5. Course designs that were not friendly to new and beginning golfers, leading to significant difficulty in
generating new golfers.
PART 2 OF 3-THOUGHTS FROM THE GOLF INDUSTRY SHOW ( PAGE 2

In the new paradigm in the golf industry, it is important to pay attention to the long-tenn implications of golf course development and to assure that the development can financially support the golf fadlity within its borders or area of influence.
The, Cascading lmp~cts to the Bottom line
While the overbuilding of the golf course industry was becoming evident in 2005 and 2006 due to declining golfer to course ratios, other changes including the fallout of the great recession dictated additional financial difficulties for the industry.
On the revenue side, the golf facilities were also being impacted due to the evaporation of the financial resources of its patrons, resulting in a loss of clients or frequency of play, a loss in the sales of peripherals including carts, practice range usage, food and retail items. The continued growth of national hard goods sellers also fostered additional difficulties for sales in the pro shop.
Further, many courses suffered from a lack of a sophisticated understanding of the markets in which they operate. The golf industry lacks a sophistcated and comprehensive database that monitors the health and financial performance of the golf and dub facilities, and this lack of adequate data is a direct cause for poor decision maldng by the owners. As the demand declined, course owners reacted by slashing green fees, bundling food or beverages with rounds, and searching for any way to save market share. The result was a significant decline in the average yield and an overall decline in REVPATT (Revenue per Available Tee Time) for all golf courses. The Iack of sufficient competitive data to understand the context of their price cutting, dictated that in many cases, the golfers had more knowledge than the operators, and the operators lost control of pricing power.
Mari(et intelligence and control of pricing are also being impacted by the advent of third-party tee time sellers. The golf industry, like the hotel industry, has resorted to third parties to sell off-peak tee times, and as these sellers start gaining market share, they are also gaining market intelligence in terms of what is happening in the larger market This superior intelligence is allowing the third party resellers to better understand the pricing in the market and therefore to garner larger shares of the market. These third-party sellers are now serving as middlemen and siphoning further resources away from the golf courses.
So a combination of reduction in rounds, reduction in the average rate, and a reduction in overall spending combined to produce a significant loss of revenues for many courses. Based upon our estimates, the average course lost 15% of its rounds, had a 20%-reduction: in-average rate, and an estimatea 10% loss in ancillary spending. In total, revenues declined by an estimated 35% at the average golf course from peak levels in 2005 and 2006. ·
It is a common understanding that golf course maintenance costs are almost entirely fiXed, meaning that the costs are stable no matter how many golfers play the course, so the loss of income does not have the corresponding reduction in operating costs. The increasing costs of maintaining the golf course, rises in health care costs, the rise in the costs of gasoline and gasoline-related products, and the increase in precious metals were all causing maintenance costs to grow. The increasing cost of fuel, which is used directly in operations, but also is a big component of many supplies including the irrigation piping, fertilizers and a host of other items, has meant significant inflation in operating costs. The price of copper, for wire used in the irrigation system, has also been rising. These increases have created difficulty in maintaining course costs and have directly reduced facility profits.
PART 2 OF 3-THOUGHTS FROM THE GOLF INDUSTRY SHOW I PAGE 3

The availability and cost ofirrigation water is another wild card and in some instances has had a tremendous impact on the facilities' financial performance. At some courses the cost of irrigation water can exceed $1.0 million a year, which may equate to 100% of the entire course maintenance budget and consume as much as 30% of gross revenues. As the scarcity of water becomes an issue nationally, the costs of water are likely to continue to rise in many areas of the country. Since golf course expenses are primarily fixed, these losses in t"evenue accumulate directly to the bottom line, meaning significant declines in net operating income today, and potentially into the future.
The increasing quality of the golf courses built over the last decade has also raised the expectations of golfers and put pressure on existing facilities to upgrade their course and course conditions. This has created a clear understanding of the market position of many golf courses, as those that have reinvested remain solvent. while. those that did not make improvements suffer from declining market share, deteriorating conditions, and are caught in a downward cycle.
Defining Distres$
The confluence of these market conditions provides little .wonder that many-golf course operators have become distressed. Tl:lere are nearly 16,000 golf courses in the country today, and The National Golf Foundation reports total closures of around 1.15'0 golf courses during the previous ten years, ~th approximately 665 closing in the last five years. So about 7% of the inventory of golf courses in the United States has closed during the past d~tmde. Given the difficult economic conditions, that is a surprisingly low percentage.
~hen golf courses do dose it is typically due to following factors.
1. High.est and best use -The distress is so significant or the change in the surrounding land use is so strong that the value of the golf course becomes Jess than the value of the land.
2. There are insufficient resources to pay the operating expenses and fund any needed capital improvements. This creates difficulties in maintaining market share and causes further declines in . income.
3. A third factor is when the golf course needs to refinance Its existing debt.
This financial distress for a g()lf facility is manifest either in its inability to pay its debt obligations or an inability to maintain course conditions. The first stage of distress is a change in the allocation of resources from capital improvements or maintenance to preserve ownership through the continued payment of debt service. This rea!locaton inevitably results in deferred maintenance of the course, club, irrigation system or maintenance equipment and a lack of sufficient resources to pay for golf course maintenance costs. The result is· a general deterioration of course quality and a lack ofcompetitiveness. At this point in the cycle, there are a significant number of newer golfcourses and existing golf courses that have undergone significant remodeling. A greater separation between the golf courses that have made improvements and those that have struggled to survive is becoming apparent The second stage of distress is typically an event or requirement relating tO finance. This event may be the need for capital to maintain a competitive golf course, to purchse or lease maintenance equipment, or distress may be in the form of a balloon payment or needed reHnance.
It Is Clear that a large poJiion of the industry is In the first stage of distress, this i'ndudes;
• Many lower tiered, member,owned golf courses • · Many older golf courses
PART 2 OF 3-THOUGHTS FROM THE GOLF INDUSTRY SHOW I PAGE 4
• Many family-owned golf courses • Many golf courses that were part of newer, failed residential developments.
This type of distress is difficult to measure, as it is never quantified, but is more symptomatic. In 2008, the National Golf Foundation surveyed 4,415 private clubs in the U.S. and found that 10% to 15% reported facing serious financial challenges. As 2008 was still early in the financial crisis, itis apparent that many additional facilities would have been at risk in the interim. While private courses typically have the option of allowing in public play to fix the problems, public course compete primarily on price and course quality, as opposed to exclusivity, and do not have the opportunity to immediately broaden their market
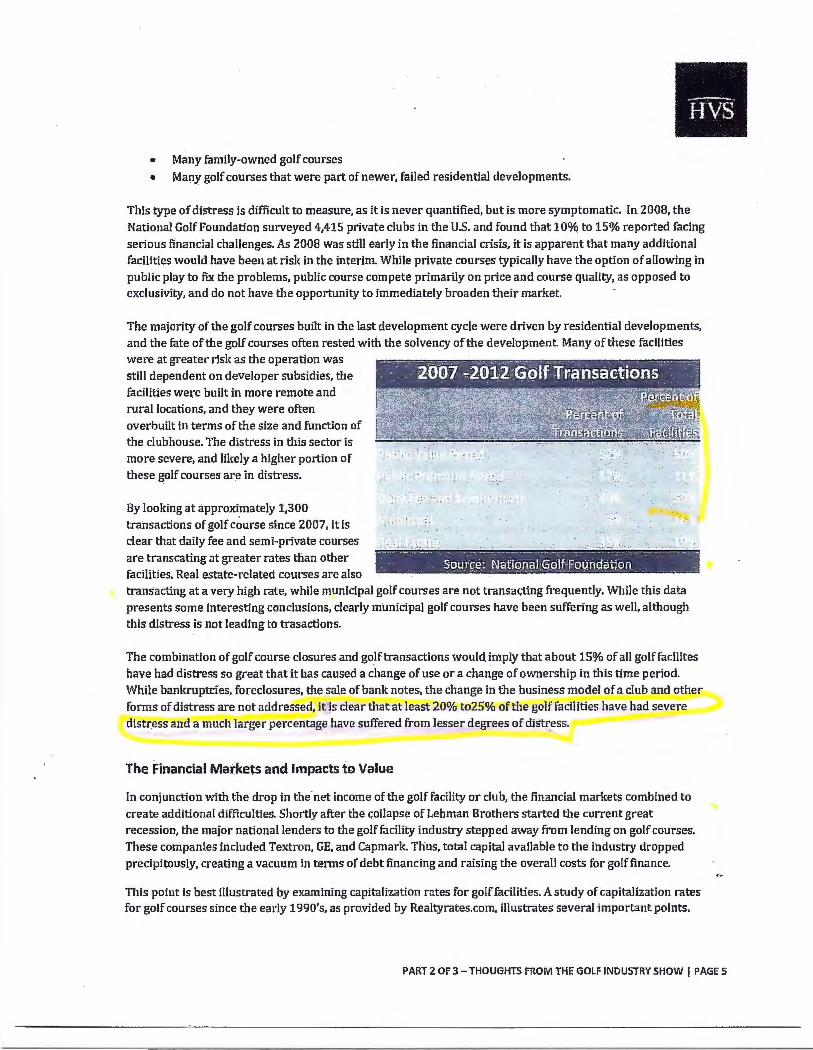
The majority of the golf courses built in the last development cycle were driven by residential developments, and the fate of the golf courses often rested with the solvency of the development Many of these facilities were at greater risk as the operation was still dependent on developer subsidies, the facilities were built in more remote and rurc;~.llocations, and they were often overbuilt in terms of the size and function of the clubhouse. The distress in this sector is more severe, and likely a higher portion of these golf courses are in distress.
By looking at approxi.mately 1,300 transactions of golf course since 2007, it is dear that daily fee and semi-private courses are transcating at greater rates than other facilities. Real estate-related courses are also
·• . z~··r .. ·1-~J.,_·~·-
. . ~----,---_ • ~--~---.-. - ----·-, c•·--·-. ~. -'7'""'1§ :..._ _ ___ _ S_q~;tr.~.~--D!~!l&D~IJ.~_dJf.f9~n.Q~fl~!1 . . ____ · YA
transacting at a very high rate, while municipal golf courses are not transacting frequently. While this data presents some interesting conclusions, dearly municipal golf courses have been suffering as well, although this distress is not leading to trasactions.
The combination of golf course closures and golf transactions would imply that about 15% of all golf facilites have had distress so great that it has caused a change of use or a change of ownership in this time period. While banltruptdes, foreclosures, the sale of bank notes, the change in the business model of a club and other forms of distress are not addressed, it is clear that at least 20% to25% of the golf facilities have had severe distr.ess and a much larger percentage have suffered from lesser degrees of distress.
The Financial Marke.ts and Impacts to Value
fn conjunction with the drop in the net income of the golf facility or dub, the financial markets combined to create additional difficulties. Shortly after the collapse of Lehman Brothers started the current great recession, the major national lenders to the golf facility industry stepped away from lending on golf courses. These companies included Textron, GE, and Capmark. Thus, total capital available to the industry dropped precipitously, creating a vacuum in terms of debt financing and raising the overall costs for golf finance.
This point is best illustrated by examining capitalization rates for golf facilities. A study of capitalization rates for golf courses since the early 1990's, as provided by Realtyrates.com, illustrates several important points.
PART 2 OF 3-THOUGHTS FROM THE GOLF INDUSTRY SHOW I PAGE 5

Capitalization rates were between 11% and 12% in the early 1990's, before the emergence of the national golf course lenders. Golf course cap rates pea){ed at around 8% in 1999, but with the loss of these national lenders, the recession, and the remaining oversupply of golf courses, capitalization rates are now back to 12%. The change in cap rates from 1999 to today amounts to roughly 33%, dictating that a golf facility generating the same net income now as it was in 1999 is currently valued at 2/3rds of what it was based on growth of capitalization rates alone. But as was illustrated in Part 1, with revenues down by 35% and expenses rising, the reality is that market-wide golf course values are likely closer to about 33% of what they were during the peak
Golf Cap Rates
13.0% t==========:;•;li~~~~ 12.0% li.lr.. - _,. 11.0% ~~-~~------,7'·· Rllll __ _.:;..._ _______ _
1o.o% J----~~-----...,.Lt!-_· ____________ _ 9.0% ~ 8.0% .J-------------......_ ________ ___,
\ 7.0% +-~-T~~~~-r-,--~~~-T~~T-~-r~--r-~~~~ N m '<t Ll'l ll) I' 00 C7l 0 rl N m '<t Ll'l I.D 1'- 00 C7l 0 rl N C7l C7l C7l C7l en en en en 0 0 0 0 0 0 0 0 0 0 rl rl rl C7l en en en en en m m 0 0 0 0 0 0 0 o · 0 0 0 0 0 rl rl rl rl rl rl rl rl N N N N N N N N N N N N N
Year
I Source: Realtv Rates.com
If that were not trouble enough, loan to value requirements increased, further making financing difficult While this point was made in part 1 of this article series, a large number of golf loans were financed at 3- toSyear terms, and the lack of lenders ;md lending when these notes came due precipitated additional difficulties in securing finance . What this means is that even a golf facility that generated positive operating income and has always been current on their mortgage cannot refinance due to changes to the values and more stringent financing conditions. So for many owners, the golf course value was below the existing loan amount or loan to value requirement, and therefore the ability to refinance depended on providing additional equity to meet the new higher loan to value ratios required in the current market for refinancing.
It seems as though the operating income for golf courses is never really stabilized; but is always variabletherefore, using capitalization rates can lead to vastly varying estimates of value. This leads to the conclusion that the sale of a golf course inevitably includes some type of story relating to problems with how the golf course was operated, and how the new capital will turnaround the operation. Even prior to the current distress in the market, the purchase and refinance of the golf facilities almost always included a story on how the facility can be repositioned and fare better in the future. In today's market it seems as though buyers and lenders have become more skeptical of these types of turnarounds by golf courses, and the underwriting of the golf courses based upon pro-forma income as opposed to historical income have also been impacted.
The utilization of discount rates to determine value is necessiatated by the changing income from the golf course. According to data provided by Realtyrates.com, the discount rates for golf courses peaked at 10.5% in
PART 2 OF 3-THOUGHTS FROM THE GOLF INDUSTRY SHOW J PAGE 6

2003; and are now around 12.5%.-This dictates that financing a turn-around is a more difficult story in the current market, as less \¥eight is given to future increases in revenue.
Golf Discount Rates
15.0~~
. AAA -14.0%
I ~ '"~""" ~-~ ~~ - ·~~ "" . - 11.0%
- 10.0% . ··r ·~···., ~ii 't~ ii ~ ii ~ii ~ii M i ..: h.:~.:.:.:..:
ii iii1 ~ ii ii ii i5 aaa aoa aaa aoo- o-o-ac a.I~"'E --o"'E -"1:J"E """"'0"0 ..... ~-e..c: ~~~ ~~~~ ~~.., .. ~~ ... l~~..i~ ~]1! ;j]'E,;j]'E,~]--e-:: ~-=~,.:; c: , ;;; NrTl Nrn NCT') NtT'l~ Ntr) Nf11
2002 2003 20~ 2005 2006 2007 2008 2.009 20W 20U 2012
I Source: Realtv Rates.com I
•
•
Given the perfect storm of compression of revenues, rising expenses, a loss of capital, decreasing value and more stringent lending conditions, it is of little surprise that the golf industry is in a painful period of distress. Golf course values are down, lending is still difficult, and the ability of the industry to alter these constraints is going to be tested in th years to come.
So while most of the bad news is now on the table, the third part of this series relates potential optimism for the future of the golf course industry and the value of golf facilities.
(
PART 2 OF 3- THOUGHTS FROM THE GOLF INDUSTRY SHOW I PAGE 7