OET (Optical Emission Tomography) a new Flame Front ... · OET (Optical Emission Tomography) a new...
32
OET (Optical Emission Tomography) a new Flame Front Diagnostic & PIV (Particle Image Velocimetry) in Transonic flows The 16 th Symposium on Measuring Techniques in Transonic and Supersonic Flow in Cascades and Turbomachinery Cambridge 23 & 24 th September 2002 P. Dunkley, P.Bryanston-Cross, E.Moll & B.Timmerman Optical Engineering Laboratory
Transcript of OET (Optical Emission Tomography) a new Flame Front ... · OET (Optical Emission Tomography) a new...

OET (Optical Emission Tomography) a new Flame Front Diagnostic
&
PIV (Particle Image Velocimetry) in Transonic flows
The 16th Symposium on Measuring Techniques in Transonic and Supersonic Flow in Cascades and Turbomachinery
Cambridge 23 & 24th September 2002
P. Dunkley, P.Bryanston-Cross, E.Moll & B.Timmerman
Optical Engineering Laboratory

The objective of OET (Optical Emission Tomography) is to create a three dimensional image of a flame structure by sampling the light emission from an array of diodes placed around the burner.

Project Members
• Rolls-Royce plc (Gas turbines)• CORUS (Steel furnaces)• Qinetiq• NPL• Wolfson Maintenance• Warwick University• Manchester University

Problem:-Pollution Regulations-Efficiency-Money
Possible Solution:-Premixed
Combustion
Problem:-Premixed
Combustion Unstable
Instrumentation:View and Evaluate
the Instabilities
Specification:spatial resolution -10mm2
time resolution – 2kHzhigh temperature – 1500oC Pressure – atmospheric to
40 Bar

Why the Hydroxyl Radical?
– Branching Species– Heat Release– A/F Ratio– Flame Front Indicator

TomographyReconstruct a slice of an object from either the absorption of an external source OR emission from the object itself.
Signal entering flame
Signal leaving flame
Mercury lamp
Burner
Fibre optic to spectrographIf a flame is to be reconstructed
using only the emission, the self absorption of the flame needs to be assessed.

Development of Tomographic Array
eold i
I j ωijσ j
3.8° Fibre optic
Acceptance cone of fibre
Tomographic array
The acceptance cone of the fibres fitted to the area

Photograph of Array

Preliminary Results

Preliminary Testing
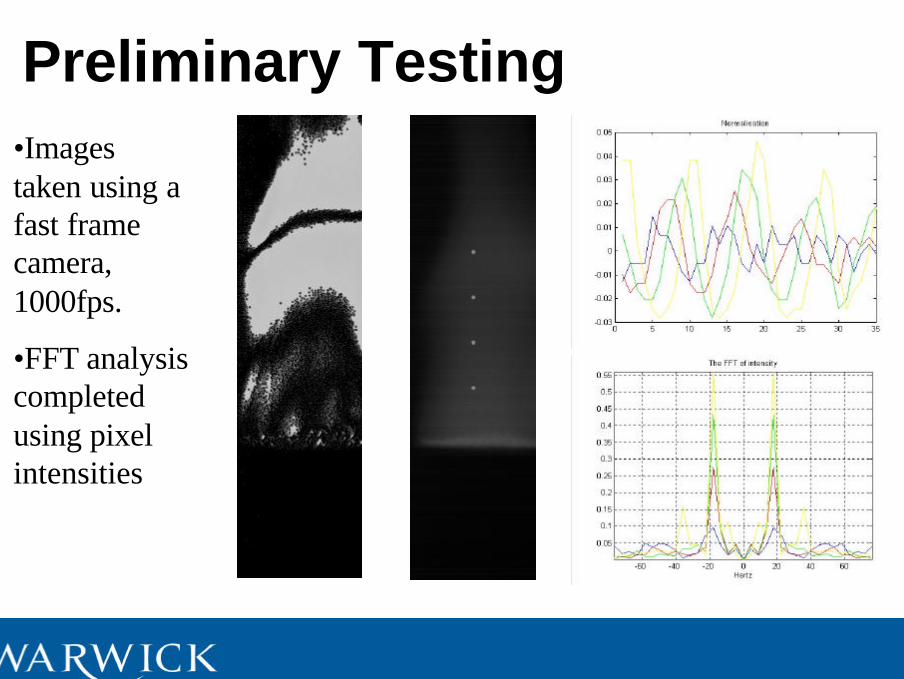
Preliminary Testing•Images taken using a fast frame camera, 1000fps.
•FFT analysis completed using pixel intensities

Preliminary Testing
Single Photograph of OH modified for colour intensity
Single thermocouple scan
Averaged thermocouple result Average of three photographs
The burner has been modified by placing two coins on it’s base. The array result is shown, superimposed on a photograph of the modified burner.

Rolls-Royce Testing

Rolls-Royce TestingFrequency Analysis:

Rolls-Royce TestingReconstruction:

Conclusions
•The array has proven to be a valuable diagnostic in viewing flame instabilities
•The array can accurately reconstruct the OH radical from optically thin hydrocarbon flames.
•The array has met the original specifications

The objective of PIV (Particle Image Velocimetry) in this transonic application was to velocity map the flow through a rotating transonic annular cascade.
The measurements also show an instantaneous mapping of the turbine wake.

A schematic representation of a PIV system
Particle Image Velocimetry (PIV)
Principle of Operation
PIV is a technique that has the potential to make an instantaneous velocity measurement of the whole flow field.
In concept the technique is simple.
It reduces the instantaneous measurement of the flow to an imaging process

P.I.V.
• Particle Image Velocimetry (PIV)• Pulsed, narrow 2-d, plane of light• Flow seeded with tracers• Images captured V
dy
dx
∆∆
∆∆
=ty
tx
V ,

Cross-correlation
•Initial positions of particles recorded on separate image to final positions
Advantages:•velocity direction as well as magnitude is known •zero and near-zero velocities can be measured •more robust velocity results are obtained

Cross-correlation example
Image 1 and Image 2 show simulated particle images at time instants t = t_1 and t = t_2 respectively. Particles are shifted by 4 pixels in positive x and y directions as they move from Image 1 to Image 2.

Cross-correlation example
•The average displacement obtained by performing cross-correlation.(A statistical method aiming to determine the relation of the data contained in the images.)•The correlation function yields a maximum value corresponding to the shift in pixels.•The diagrams show the peak is shifted by 4 pixels in each direction with a distinctive maximum value.

Optical systems:
For RAe the stator was made hollow
For MIT the stator was made of transparent material

The application of PIV
Particle measurement is non-trivial
Density of seeding
Size of seeding (0.2-1 micron)
3-D nature of the flow
Type of light source
Resolution and type of digital camera

The application of PIV to Turbomachinery

The Application of PIV.
Comparison between prediction & measurement
Velocities are shown in m/s and the X,Y co-ordinates are given in mm.
The calculation was made on the spinning rotor in the ‘blow-down’ transonic turbine test facility at RAe Pyestock

Turbulent flow Structures
PIV has a major advantage in that it can show the instantaneous structure of the flow.
The example shows how a turbulent boundary layer structure can be resolved.

Multiple Frame PIV
This is an experiment on a very slowly rotating flow. Using this flow it has been possible to explore mathematical processing needed to solve PIV images.
Firstly a detailed velocity map has been created.
Then, the vortex structure has been calculated and a sequence of digital images have been animated to show the starting jet.

The application of PIV to Turbomachinery: Conclusions
Seeding at transonic speeds at a suitable density is very difficult.
The previous sequence was made at 4Hz over a series of experimental runs of 2s duration. Multifame sequential images are needed to track large scale disturbances.
The shocks were very weak and were not visualised in this exercise.
It did not show wake structures passing through the passage at transonic speeds.
It did not show the 3D nature of the flow. This possible, but requires a two camera approach.
The velocity measurements were accurate to 4%.


Tomographic Array for Combustion Measurement